
A Comprehensive Review of Permeate Gap Membrane Distillation: Modelling, Experiments, Applications


Abstract
1. Introduction
1.1. Overview of Desalination Technologies
1.2. Membrane Distillation (MD) for Desalination
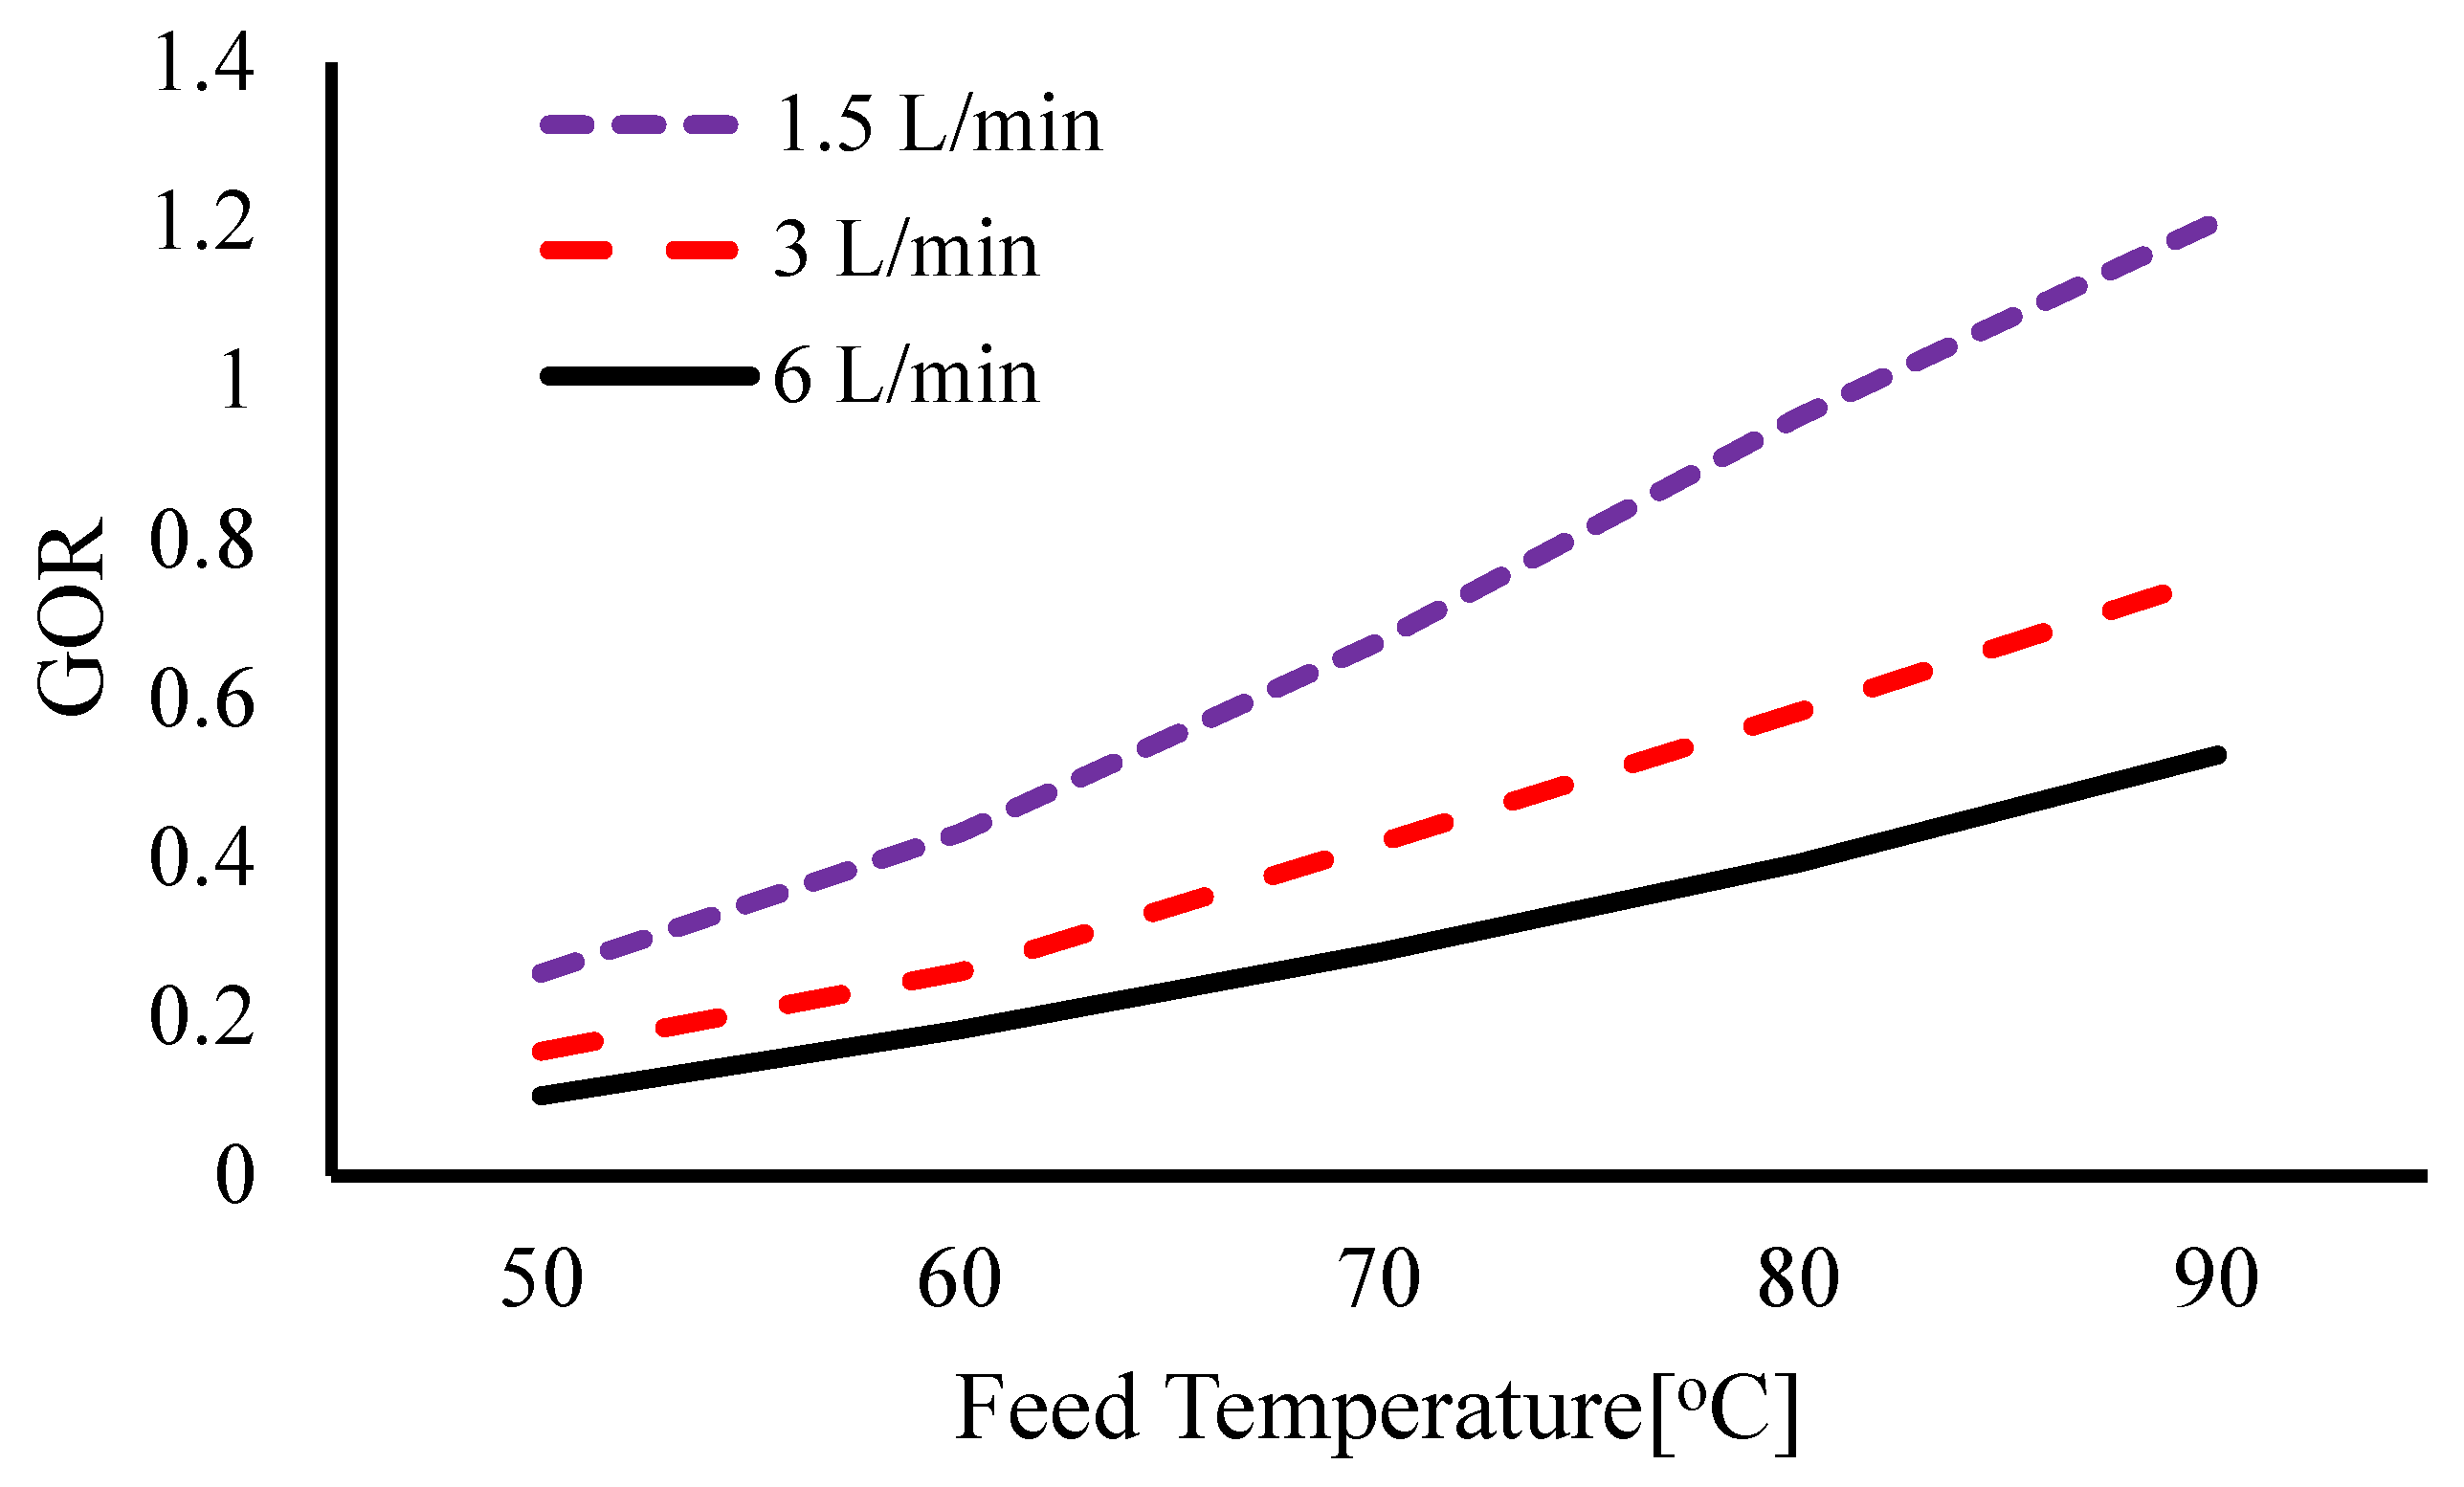
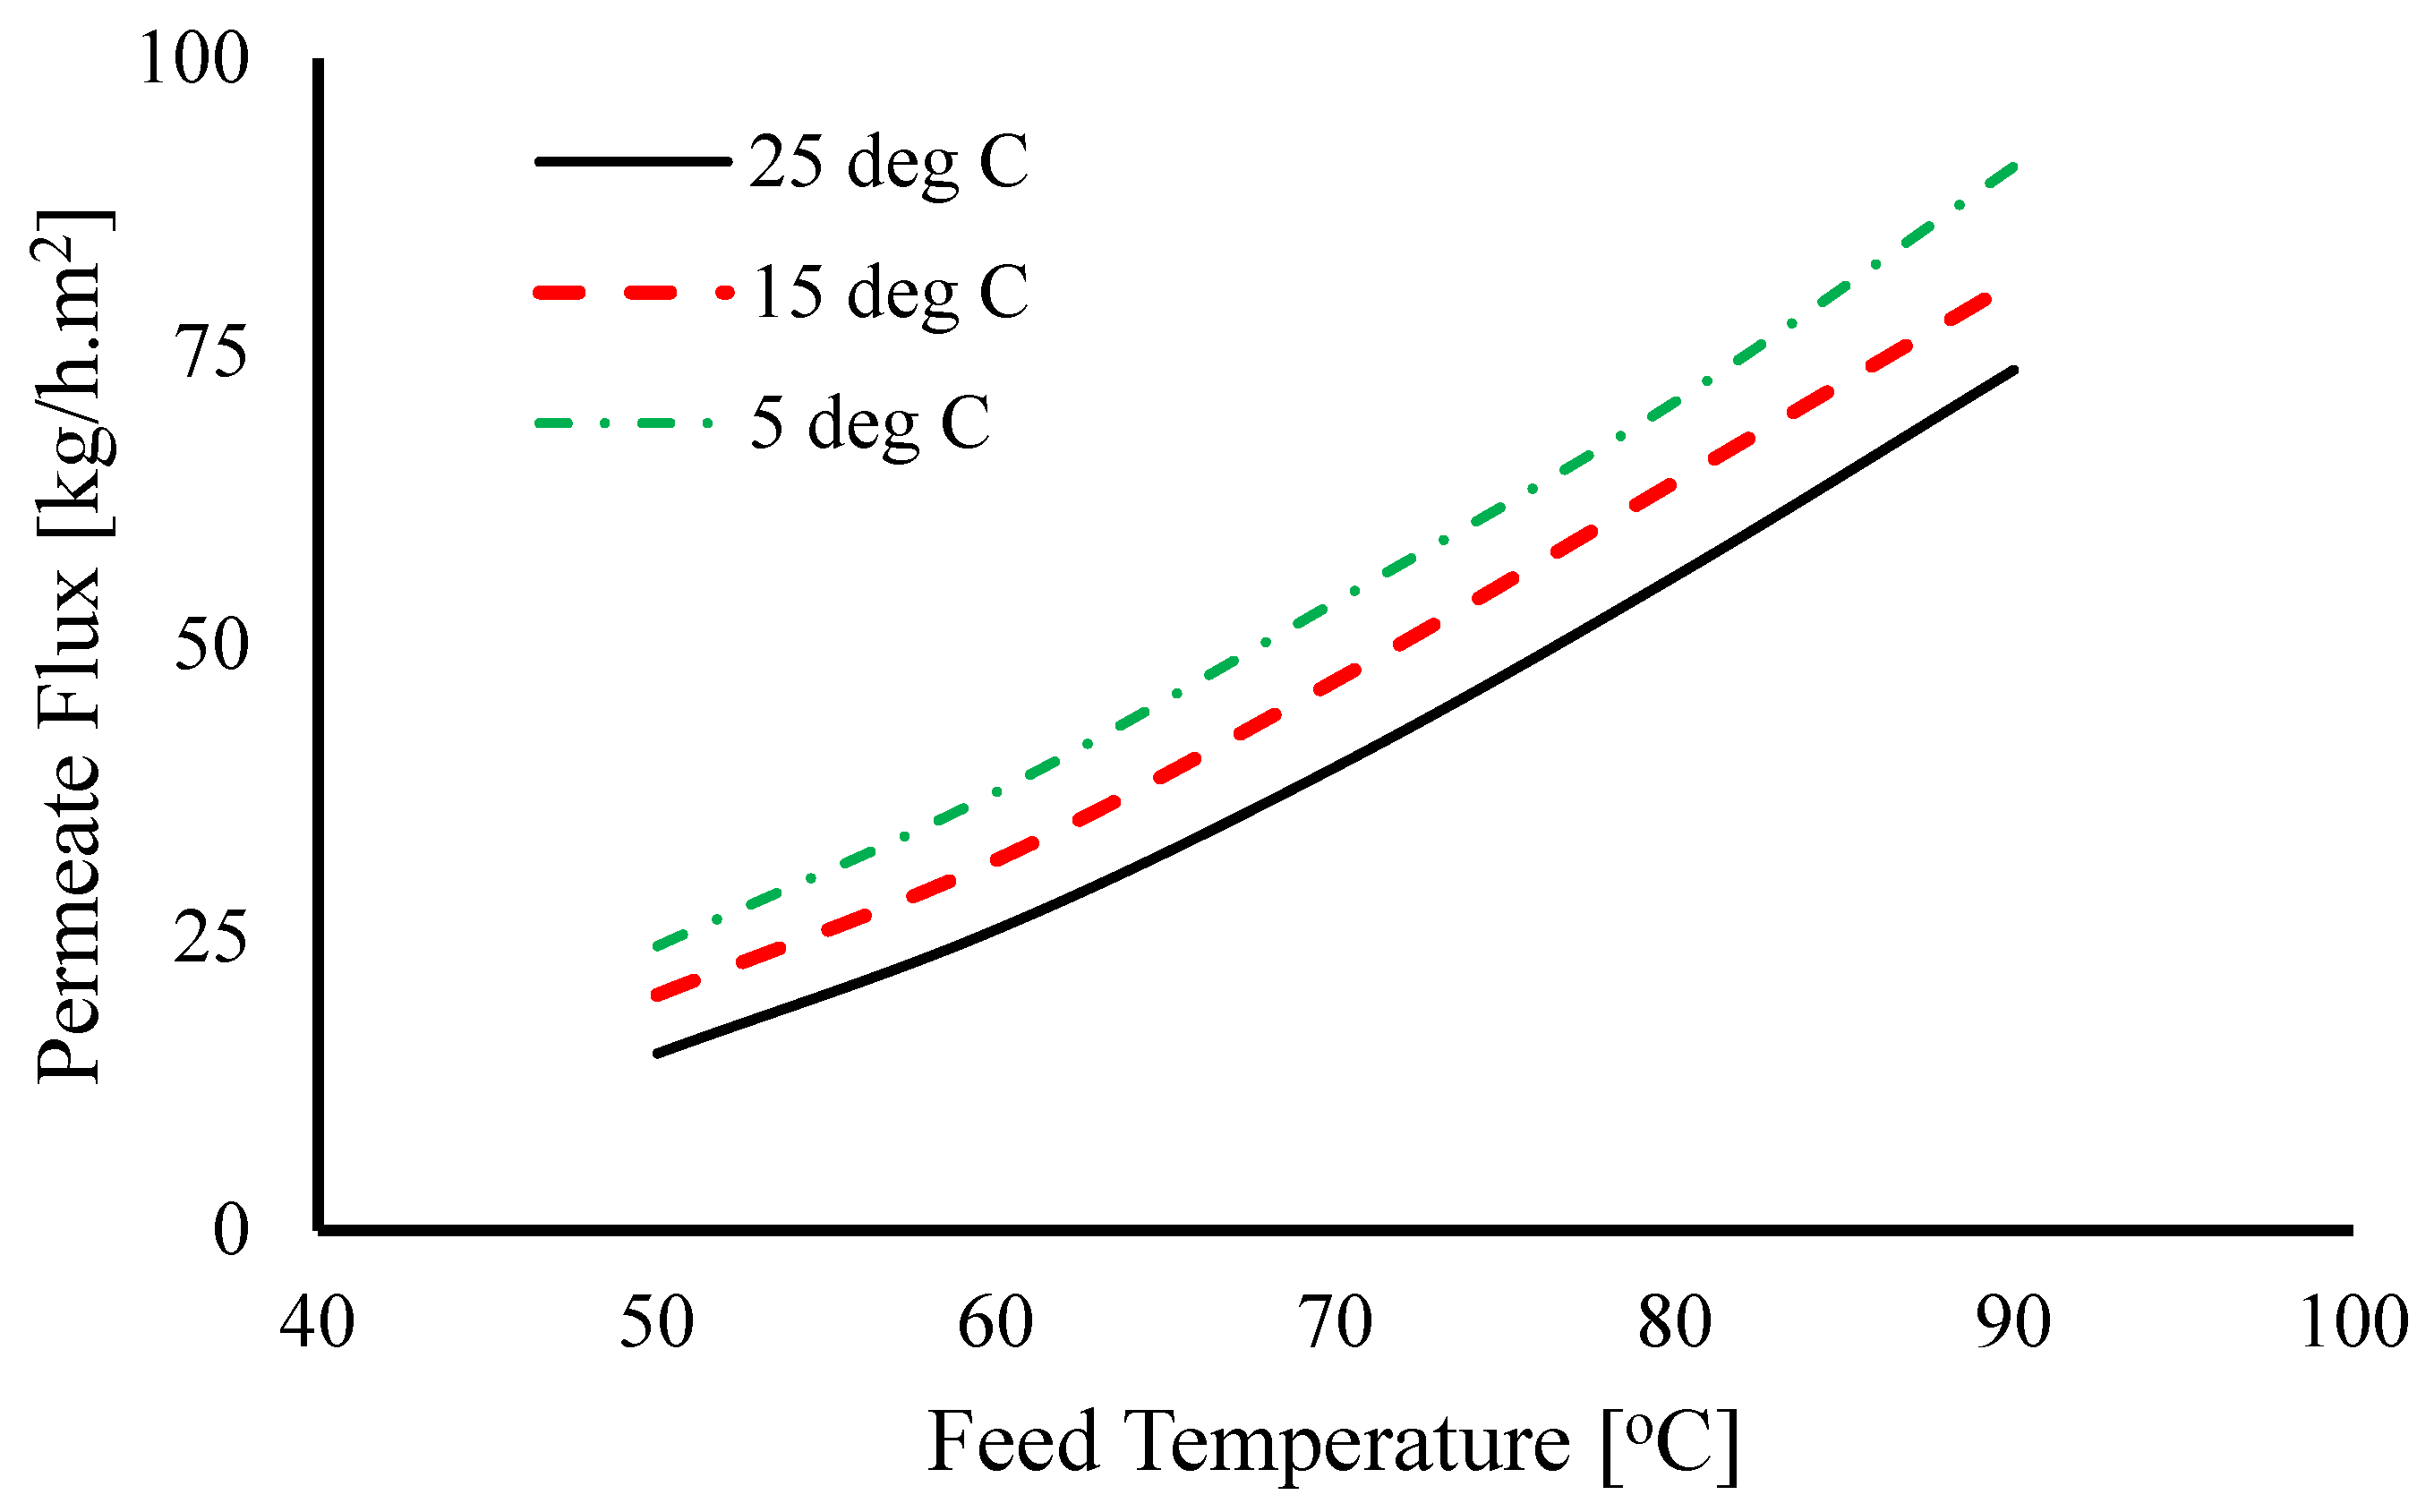
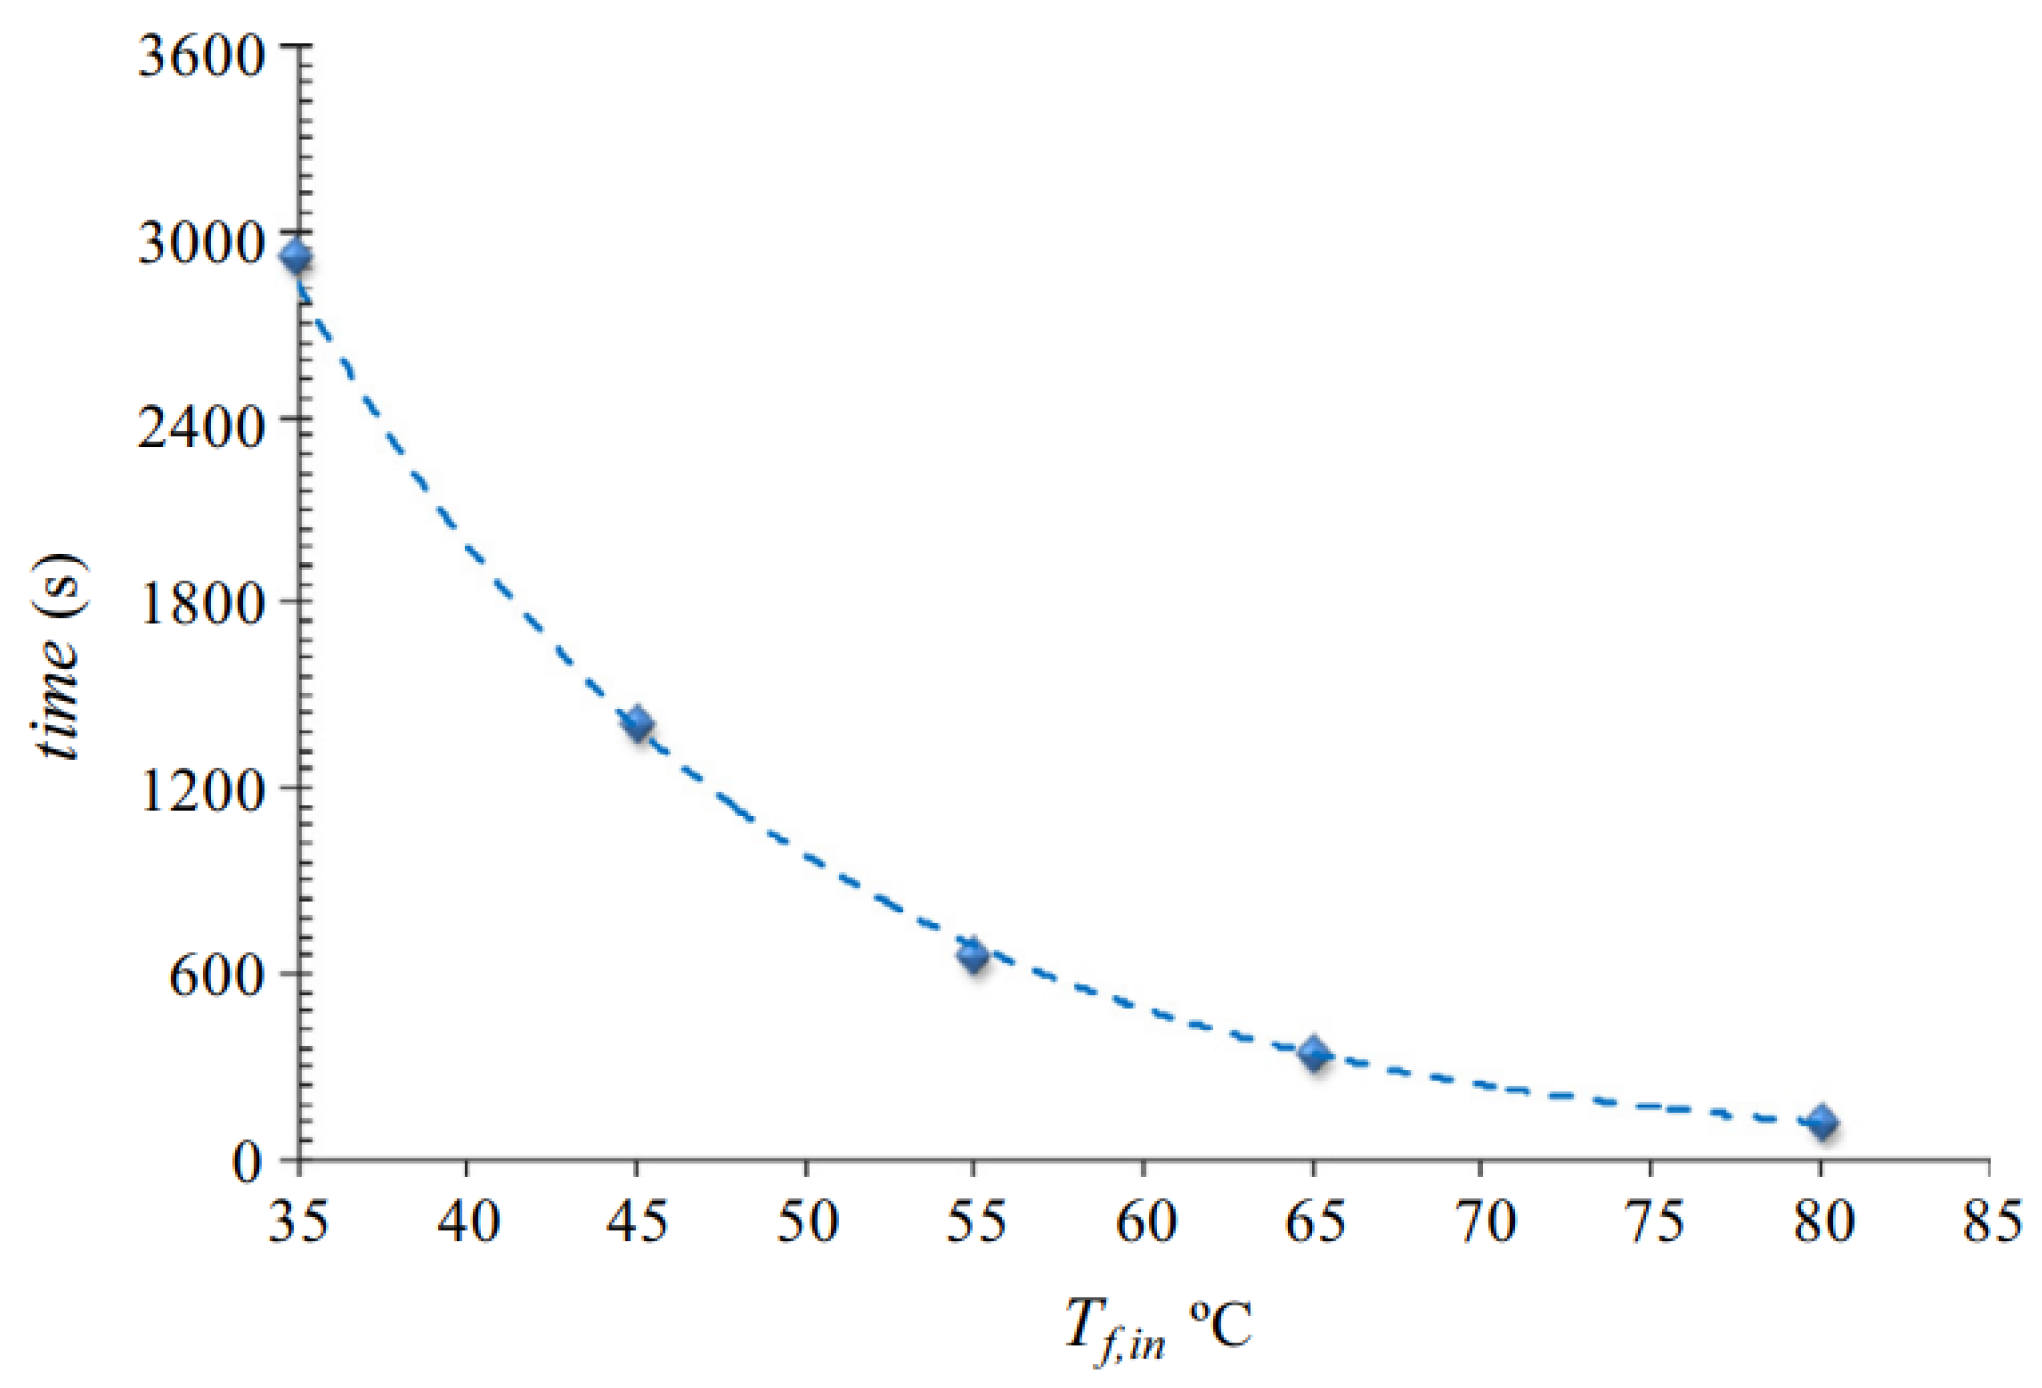
- Feed Temperature: Higher feed temperatures increase the vapour pressure difference across the membrane. This means raising the feed temperature enhances the flux production for all the modules. However, higher temperatures can also increase energy consumption [38].
- Condenser Temperature: Lower condenser temperatures create a higher driving force for vapour transport, improving flux [39].
- Flow Rates: Increased feed and condenser flow rates enhance the heat and mass transfer coefficients by transitioning the laminar flow rate into the turbulent regime, improving flux while minimizing temperature polarization [40].
- Membrane Characteristics: Membrane porosity, pore size, hydrophobicity, and thermal conductivity directly affect vapour transport efficiency and resistance to fouling or wetting [41].
- Gap Width: In configurations like AGMD/PGMD, the width of the permeate gap influences the heat recovery and temperature distribution, impacting both flux and SEC.
- Thermal Conductivity of Materials: High-conductivity materials in cooling plates or membranes improve heat recovery, reducing thermal losses and energy requirements.
1.3. Permeate Gap Membrane Distillation (PGMD)
- Improved Heat Recovery: The water gap in PGMD facilitates effective internal heat recovery, reducing specific thermal energy consumption.
- Enhanced Thermal Efficiency: The water inside the permeate gap reduces the heat loss, lowering mass transfer resistance.
- Design Flexibility: PGMD allows for innovative gap modifications, such as propellers or gap circulation, further enhancing heat and mass transfer.
2. Fundamentals of Permeate Gap Membrane Distillation
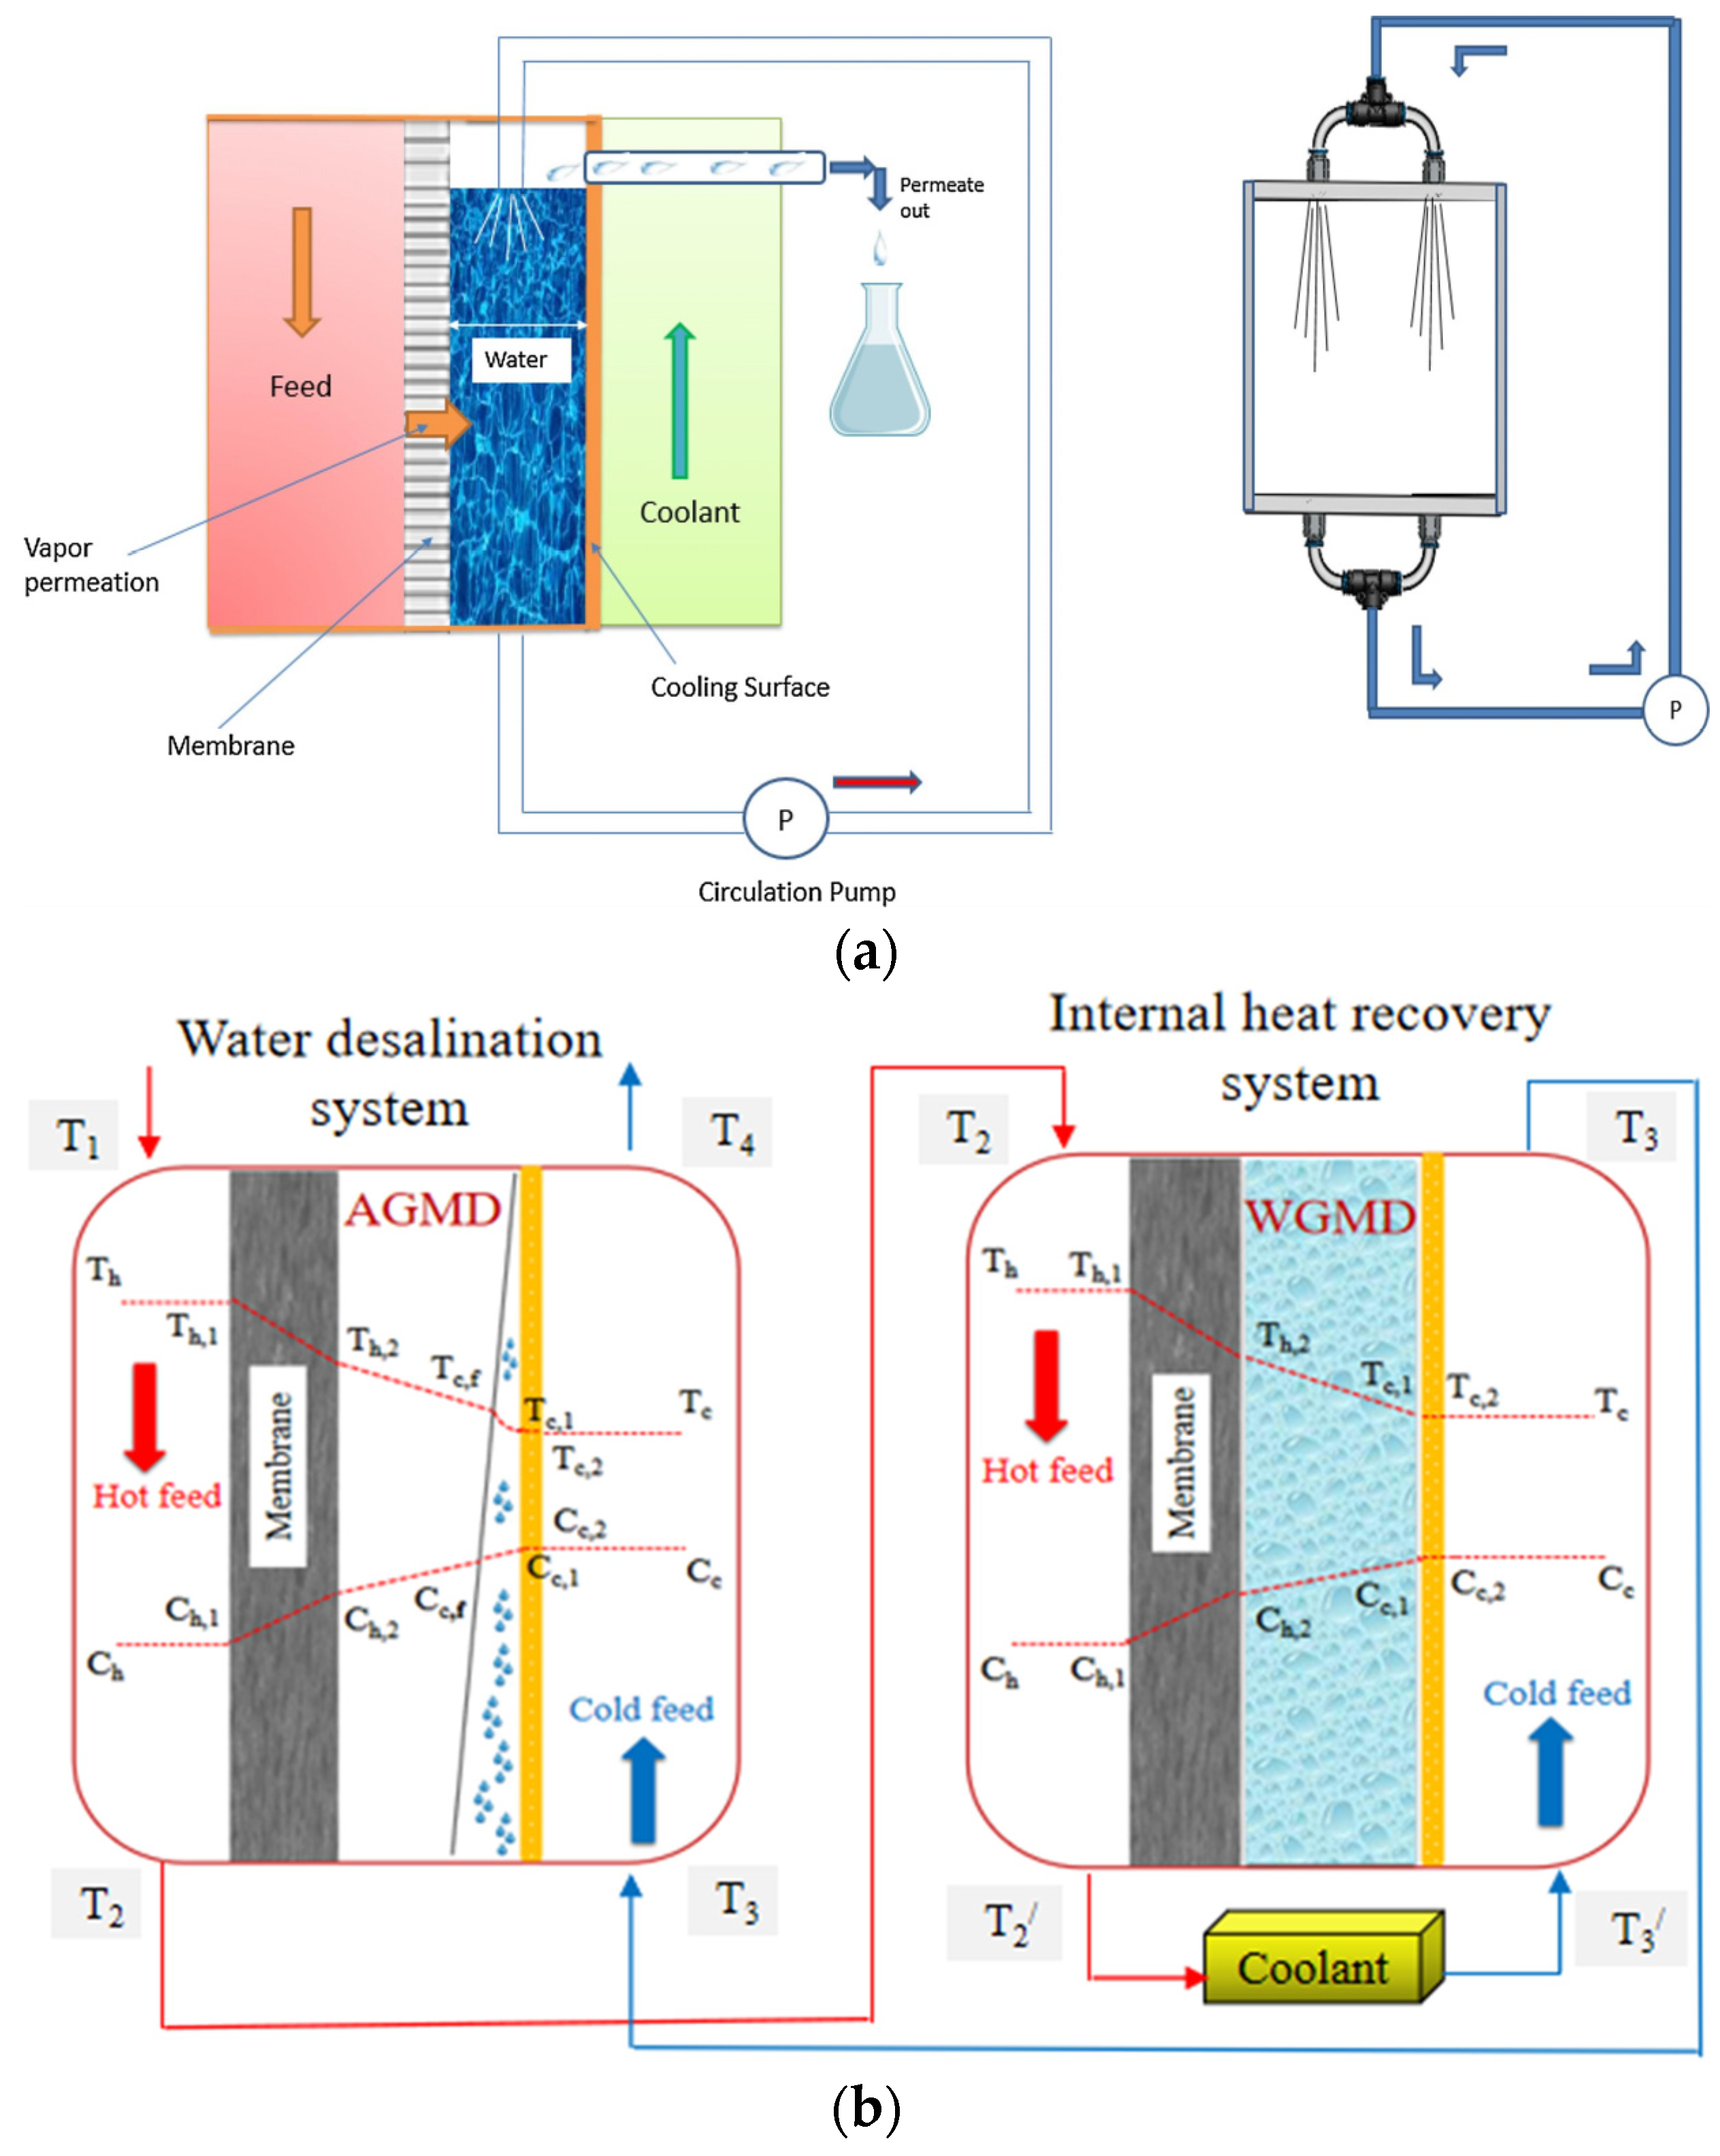
2.1. Mechanism of Freshwater Production in PGMD
2.2. Heat and Mass Transfer in PGMD
2.2.1. Heat and Mass Transfer Modelling
- (a)
- Convection heat transfer from the feed bulk to the membrane surface,
- (b)
- Pure conduction heat transfer through the solid portion of the membrane, and heat transfer associated with evaporative vapour flux passing through the membrane.
- (c)
- On the permeate side, the heat transfer is due to pure conduction in the case of a stagnant permeate gap. However, in most cases, natural convection is considered.
- (d)
- Conduction heat transfer passes passing through the cooling plate.
- (e)
- Convective heat transfer passes passing from the cooling plate to the condenser water.
- (a)
- Vaporization: Initially, water transitions from the liquid phase to the vapour phase. This phase transformation occurs at the interface where the feed solution contacts the membrane surface.
- (b)
- Membrane passage: Water vapour diffuses through the membrane pores because of vapour pressure differences across the membrane. The vapour pressure on either side of the membrane, as well as within the membrane pores, is determined by the following Antoine equation [63]:
- (c)
- Condensation: Finally, the water vapour condenses back into the liquid phase. The condensation occurs at the interface of the cooling plate within the permeate channel [69]. The distillation flux (), is postulated to be directly proportional to the vapour pressure disparity across the membrane and is calculated as follows [42,46,69,70]:
2.2.2. Temperature and Concentration Polarisation
2.3. Optimisation Strategies for PGMD
2.3.1. Response Surface Morphology (RSM)
2.3.2. Differential Evolution Techniques
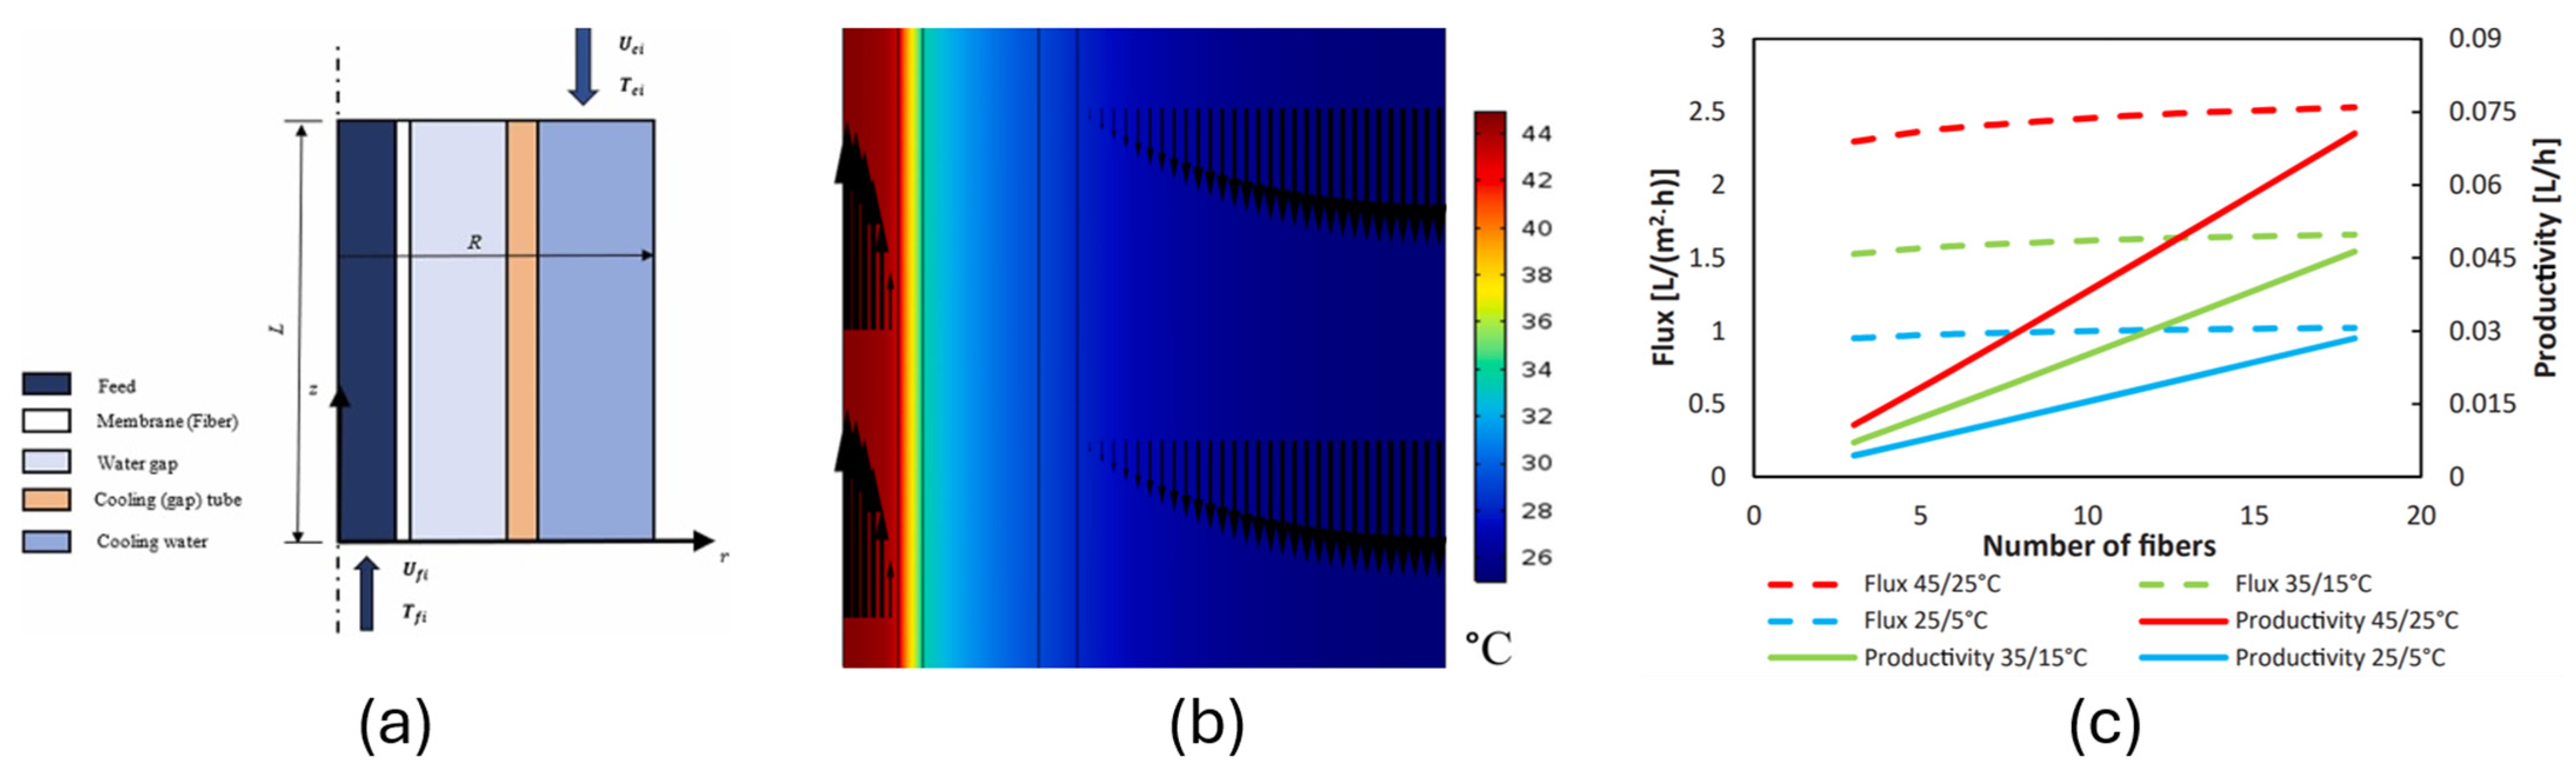
2.3.3. Computational Fluid Dynamics (CFD) Modelling
3. Design, Development, and Testing of PGMD Systems
3.1. Optimal System Configuration for PGMD
3.2. Integration of PGMD with Sustainable Energy Sources
4. Factors Influencing PGMD Performance
4.1. Operational Factors
4.1.1. Feed and Condenser Flow Rate
4.1.2. Feed and Condenser Temperature
4.1.3. Feed Concentration
4.2. Physical Factors
4.2.1. Gap Width
4.2.2. Membrane Materials and Other Properties
PTFE Membrane
PVDF Membrane
Other Membrane Materials

| Porosity (%) | Average Pore Size (μm) | Contact Angle (°C) | Thickness (μm) | Surface Area (m2) | References |
|---|---|---|---|---|---|
| PTFE | |||||
| - | 0.22 | - | 140–200 | 0.12 | [49] |
| 80 | 0.45 | 139 | 154 | 3.081 × 10⁻³ | [62] |
| 80 | 0.05 | - | 70 | 10 | [82] |
| - | 0.24 | 160 | 100 | 0.005 | [61] |
| - | 0.26 | 140 | 170 | 0.005 | [61] |
| 80 | 0.2 | - | 240 | 0.042 | [90] |
| 80 | 0.45 | - | 154 | 3.081 × 10⁻³ | [122] |
| 80 | 379 ± 8 nm | 140 | 153.9 ± 13.6 | 0.00724 | [100] |
| 80 | 0.45 | 139 | 154 ± 14 | 0.0066 | [123] |
| 0.22 | 100 | 140–200 | 0.12 | [124] | |
| PVDF | |||||
| 75 | 0.22 | 100 | 125 | 0.12 | [124] |
| 81.7 | 0.15 | ID = 102.8 OD = 96.4 | 180 | 0.0124 | [42] |
| 80 | 0.2 | - | 200 | 72 | [125] |
| Other membrane materials | |||||
| 80 | 0.046 | 94.8 ± 0.5 | 64.7 ± 6.3 | 5.53 × 10⁻³ | [77] |
| 68 | 0.2 | 110 | - | 0.1691 | [98] |
Other Membrane-Related Issues—Membrane Fouling
| Fouling | Mechanisms | Impact | Reference Image |
|---|---|---|---|
| Organic |
|
| 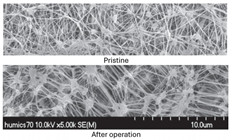 |
| Inorganic |
|
| 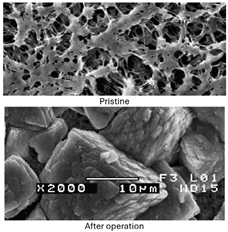 |
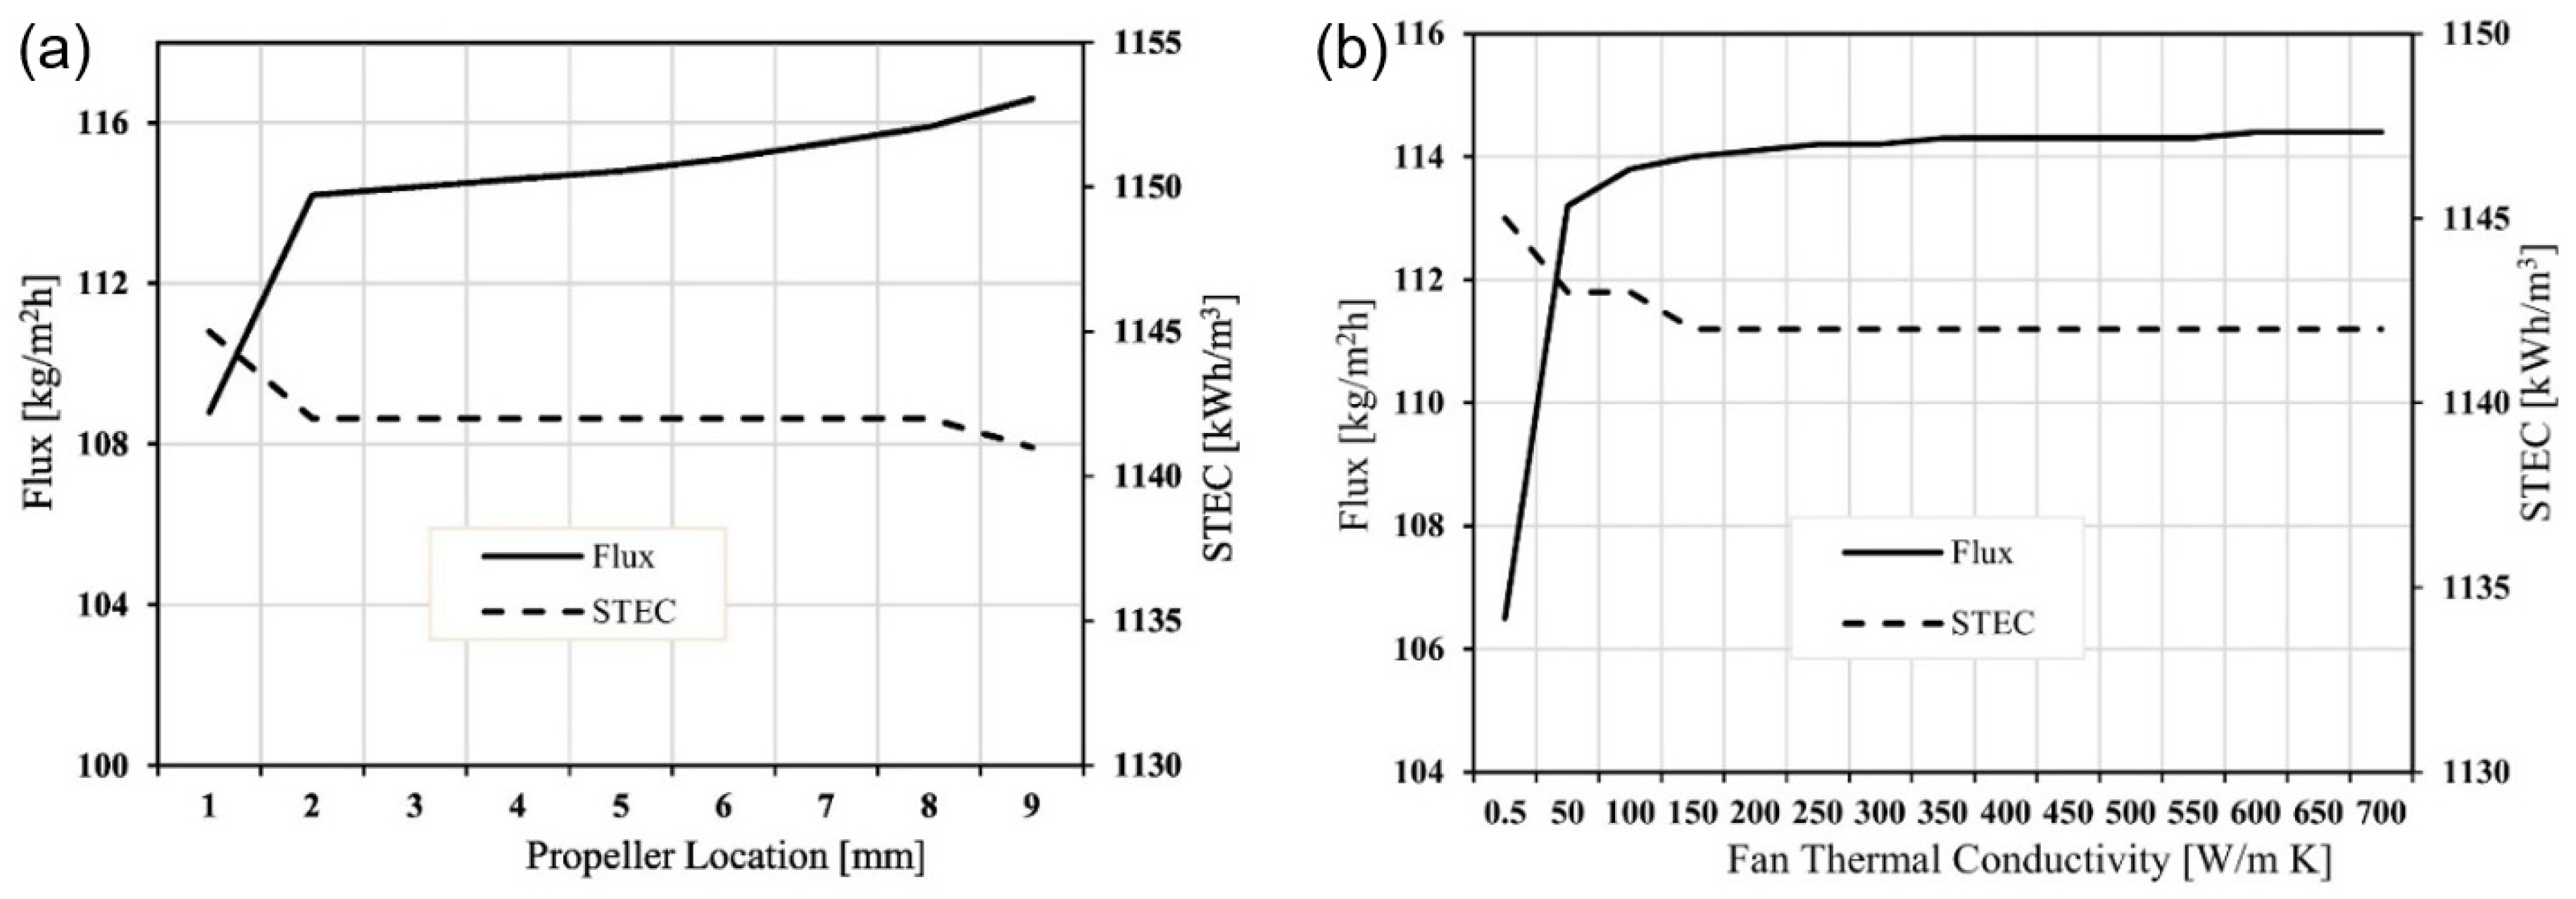
4.2.3. Cooling Plate and Gap Thermal Conductivity
5. Feasibility of PGMD for Commercial Freshwater Production
5.1. Techno-Economic Analysis of PGMD Systems
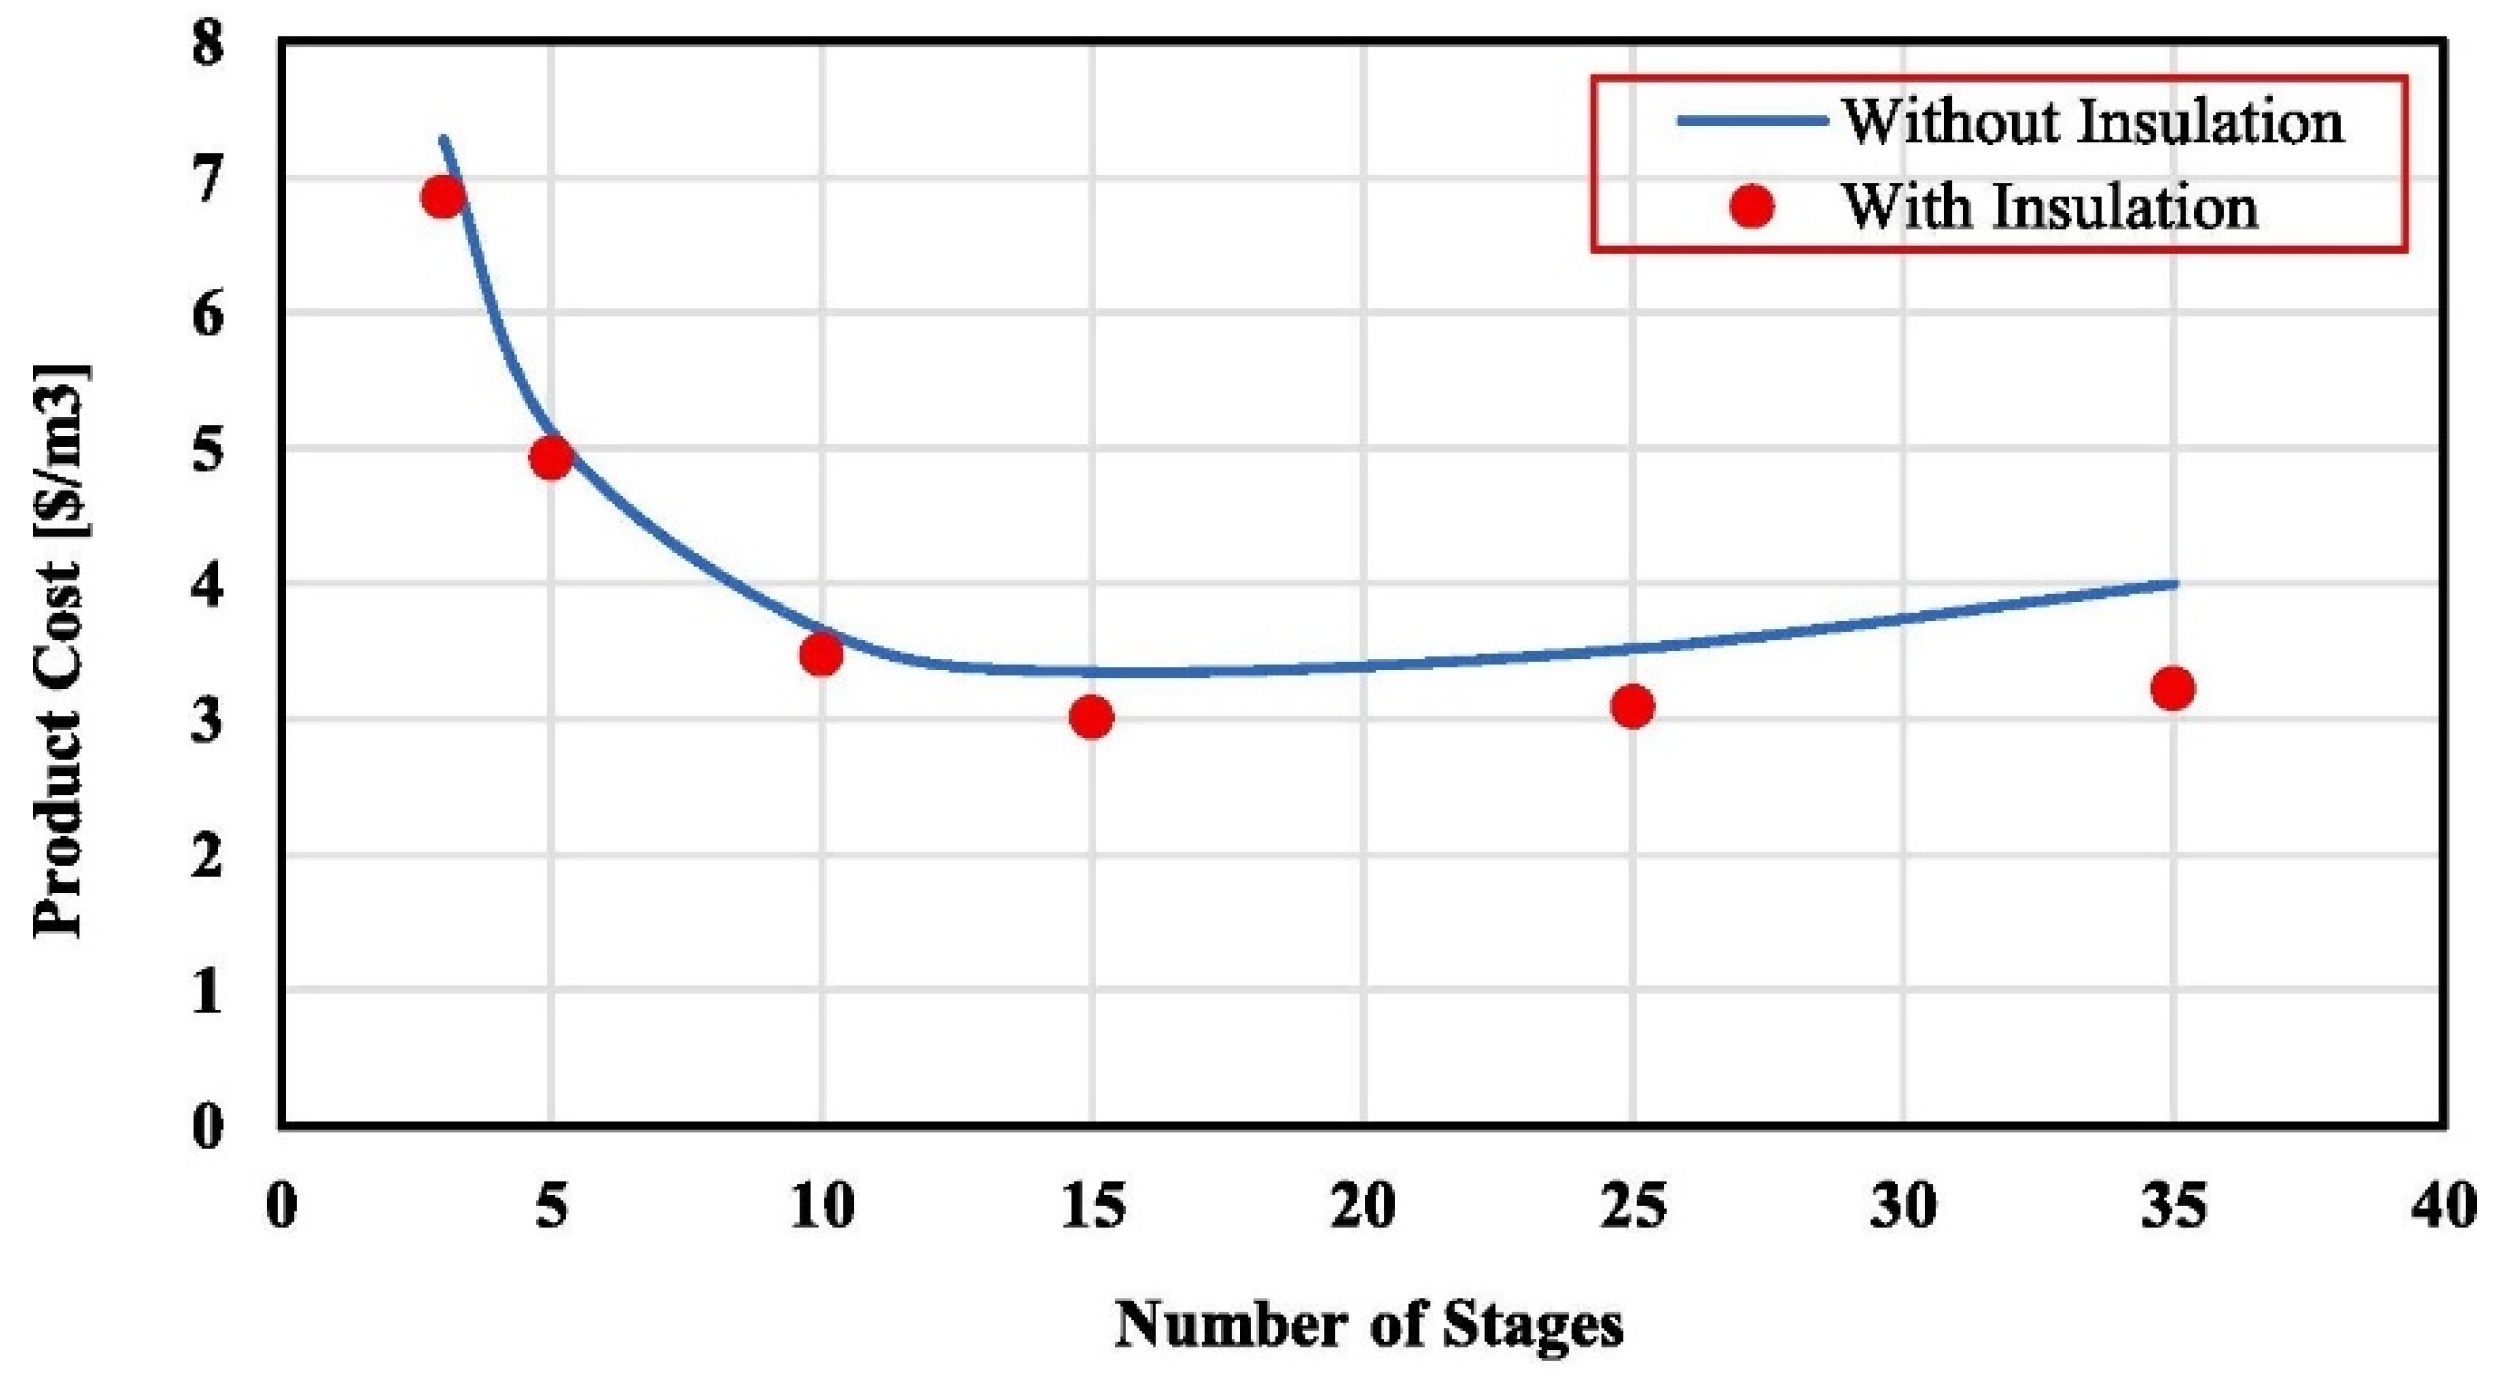
5.1.1. Cost Analysis of Multi-Stage PGMD Systems
5.1.2. Impact of Energy Sources on Water Production Costs
5.1.3. Optimisation Techniques for Cost Reduction
5.1.4. Comparative Cost Analysis of Solar-Powered MD Systems
5.2. Enhancements and Innovations for Commercial Viability
5.2.1. System Modifications for Improved Performance
5.2.2. Innovations in Gap Circulation and Heat Recovery
5.2.3. Hybrid Designs for Internal Heat Recovery
5.2.4. Alternative Applications of PGMD
- (a)
- Using PGMD as a water pump: The permeate produced by the PGMD was directed to specific height levels, effectively utilising it as a water pump.
- (b)
- Using PGMD as an air compressor: The permeate was compressed into a sealed, pressurised tank.
6. Conclusions and Future Outlook
- It was suggested to use a multi-stage PGMD process as the GOR of the system increases with an increase in the number of stages compared to a single stage, and using solar energy as a heating process is even more effective than using an electric heater. Additionally, leveraging waste heat in multi-stage PGMD systems could further reduce costs, emphasising the need for continued research into combining waste heat with solar energy integration.
- Even though we can recover latent heat in PGMD, the distilled flux obtained from a bench-top lab scale is often more than that of a pilot-scale solar integrated system. Therefore, more pilot-scale solar-integrated experiments are needed before commercial application.
- Experimental studies have identified key operational parameters that influence PGMD performance, including feed temperature, condenser temperature, feed flow rates, condenser flow rate, and gap width. The flux increases with an increase in feed temperature and a decrease in condenser temperature. The increased feed and condenser flow rates increase distilled flux; this is also the case for the gap width at certain widths. Increasing the thermal conductivity of the cooling plate increases the effective heat-exchanging capacity between the cooling plate and the permeate. Therefore, a material with high thermal conductivity should be considered while designing the module. These operational factors are pivotal in optimising the system’s efficiency and ensuring high salt rejection rates. The impact of these factors is well-studied on a bench-top lab scale.
- Replacement of the membrane due to fouling increases operational and maintenance costs and freshwater production costs. Limited studies have been conducted on the manufacturing techniques of the antifouling membrane used in PGMD. Membrane durability strongly influences the economic viability of PGMD, and addressing fouling through improved materials and manufacturing techniques remains a priority.
- A water gap in PGMD has advantages over other MD configurations as it provides an opportunity to utilise and modify the module within the gap. Innovations such as adding propellers, impeller-assisted PGMD, gap circulation, and multi-stage configurations are some of the techniques to enhance mass and heat transfer in PGMD and decrease STEC. Gap circulation has effectively promoted uniform temperature distribution, improving heat recovery and energy efficiency. Combining internal heat recovery systems in hybrid PGMD modules, such as the air gap–water gap (AG-WG) design, has expanded the operational flexibility of PGMD and further enhanced distillate flux.
- The feasibility of PGMD to combine water and power production (CWP) systems further enhances its sustainability credentials, aligning with global efforts to reduce carbon emissions and energy consumption in water treatment processes.
Funding
Conflicts of Interest
Nomenclature
| Area of the condenser channel | m2 | |
| Area of membrane at the feed side | m2 | |
| Area of Water permeation | m2 | |
| Gap area | m | |
| Area of the cooling plate | m2 | |
| Membrane mass transfer resistance | kg/m2sPa | |
| Knudsen diffusion resistance | - | |
| Molecular diffusion resistance | - | |
| Membrane surface salt concentration | kg/m3 | |
| Salt concentration on the bulk feed side | kg/m3 | |
| Feed side hydraulic diameter | m | |
| Condenser side hydraulic diameter | m | |
| Diameter of the membrane pore | m | |
| Coefficient of diffusion | m2/s | |
| Coefficient of heat transfer on the feed side | W/m2K | |
| Coefficient of heat transfer on the condenser side | W/m2K | |
| Vapor mass flux | kg/m2h | |
| Permeate gap thermal conductivity | W/mK | |
| Effective thermal conductivity of the membrane | W/mK | |
| Cooling plate thermal conductivity | W/mK | |
| Feed thermal conductivity | W/mK | |
| Condenser thermal conductivity | W/mK | |
| Knudsen number | - | |
| Boltzmann constant | J/K | |
| mass transfer coefficient | - | |
| L | Length of module | m |
| Universal gas constant | J/mol K | |
| Rayleigh number | - | |
| Molecular weight of water | kg/mol | |
| Nusselt number of water at the permeate gap | - | |
| Nusselt number of water at the feed side | - | |
| Nusselt number of water in the cold stream | - | |
| Vapour pressure at | K | |
| Vapour pressure at | K | |
| Air pressure inside the pore | Pa | |
| Mean pressure within the membrane pore | Pa | |
| Total pore pressure | Pa | |
| Vapor pressure of water inside the pores | Pa | |
| Prandtl number of water at the permeate gap | - | |
| Feed side membrane surface temperature | K | |
| Membrane surface temperature at the permeate gap | K | |
| Mean temperature of the membrane | K | |
| Temperature at the permeate gap | K | |
| Temperature of the cooling plate at the permeate gap | K | |
| Temperature of the cooling plate at the condenser side | K | |
| Bulk condenser temperature | K | |
| Bulk feed temperature | K | |
| Molar fraction of water | - | |
| Molar fraction of NaCl | - | |
| Mean free path | m | |
| Porosity of the membrane | - | |
| Membrane thickness | m | |
| Gap thickness | m | |
| Thickness of the cooling plate | m | |
| Density of feed solution | kg/m3 | |
| Rate of heat transfer on the feed side | W/m2 | |
| Rate of heat transfer in the membrane | W/m2 | |
| Rate of heat transfer in the permeate gap | W/m2 | |
| Rate of heat transfer in the cooling plate | W/m2 | |
| Rate of heat transfer in the condenser stream | W/m2 | |
| Vapor pressure difference across the membrane | Pa | |
| γ | Surface tension | N/m |
| θ | Contact angle | ° |
| Pore radius | m |
Abbreviations
| ANN | Artificial Neural Network |
| (AG-WG) MD | Air Gap–Water Gap Membrane Distillation |
| B | Billion |
| BWRO | Brackish Water Reverse Osmosis |
| CPC | Concentration Polarization Coefficient |
| CR | Crossover Constant |
| CGMD | Conductive Gap Membrane Distillation |
| C-PGMD | PGMD with Circulating Gap Water |
| DE | Differential Evolution |
| DCMD | Direct Contact Membrane Distillation |
| ED | Electrodialysis |
| FPC | Flat Plate Collector |
| GOR | Gain Output Ratio |
| HA | Humic Acid |
| HDPE | High-Density Polyethylene |
| i-PGMD | PGMD with Impeller |
| LGMD | Liquid Gap Membrane Distillation |
| LEP | Liquid Entry Pressure |
| MD | Membrane Distillation |
| MED | Multi-Effect Distillation |
| MSF | Multi-Stage Flash |
| MGMD | Material Gap Membrane Distillation |
| M-AGMD | Modified Air Gap Membrane Distillation |
| M-WGMD | Modified Water Gap Membrane Distillation |
| PGMD | Permeate Gap Membrane Distillation |
| RMS | Response Surface Morphology |
| RO | Reverse Osmosis |
| SEC | Specific Energy Consumption |
| SGMD | Sweep Gas Membrane Distillation |
| STEC | Specific Thermal Energy Consumption |
| SWRO | Seawater Reverse Osmosis |
| VGMD | Partial Vacuum Gap Membrane Distillation |
| TPC | Temperature Polarization Coefficient |
| VMD | Vacuum Membrane Distillation |
| WGMD | Water Gap Membrane Distillation |
References
- Mekonnen, M.M.; Hoekstra, A.Y. Four billion people facing severe water scarcity. Sci. Adv. 2016, 2, e1500323. [Google Scholar] [CrossRef] [PubMed]
- UNESCO. World Water Assessment Programme, in The United Nations World Water Development Report 2018. Available online: https://www.unwater.org/publications/world-water-development-report-2018/ (accessed on 12 December 2024).
- Kumar, P.; Date, A.; Mahmood, N.; Kumar Das, R.; Shabani, B. Freshwater supply for hydrogen production: An underestimated challenge. Int. J. Hydrogen Energy 2024, 78, 202–217. [Google Scholar] [CrossRef]
- OECD. OECD Environmental Outlook to 2050, Chapter: C.C.; OECD: Paris, France, 2012. [Google Scholar]
- Boretti, A.; Rosa, L. Reassessing the projections of the World Water Development Report. NPJ Clean Water 2019, 2, 15. [Google Scholar] [CrossRef]
- Forum, W.E. The Global Risk Report 2020. Available online: https://www3.weforum.org/docs/WEF_Global_Risk_Report_2020.pdf (accessed on 12 November 2024).
- Djuma, H.; Bruggeman, A.; Eliades, M.; Lange, M. Non-conventional water resources research in semi-arid countries of the Middle East. Desalination Water Treat. 2016, 57, 2290–2303. [Google Scholar]
- Oki, T.; Entekhabi, D.; Harrold, T.I. The global water cycle. Glob. Energy Water Cycles 1999, 10, 27. [Google Scholar]
- USGS. How Much Water is There on Earth? Water Science School. Available online: https://www.usgs.gov/special-topics/water-science-school/science/how-much-water-there-earth?qt-science_center_objects=0#qt-science_center_objects (accessed on 1 December 2024).
- Programme, U.W.W.A.; Engin, K.; Richard, C. The United Nations World Water Development Report 2023: Partnerships and Cooperation for Water; Facts, Figures and Action Examples; United Nations Educational, Scientific and Cultural Organisation: Paris, France, 2023; Available online: https://policycommons.net/artifacts/10611945/the-united-nations-world-water-development-report-2023/ (accessed on 4 January 2025).
- Reimann, L.; Vafeidis, A.T.; Honsel, L.E. Population development as a driver of coastal risk: Current trends and future pathways. Camb. Prism. Coast. Futures 2023, 1, e14. [Google Scholar] [CrossRef]
- Igor, S. World Fresh Water Resources, Water in Crisis: A Guide to the World’s; Oxford University Press, Inc.: Oxford, UK, 1993. [Google Scholar]
- Marc-Antoine Eyl-Mazzega, É.C. The Geopolitics of Seawater Desalination; Études de l’Ifri, Ifri: Paris, France, 2022. [Google Scholar]
- Ahmad, Z.; Shukla, A.K.; Singh, V.; Sharma, M.; Kumar, P. Thermodynamic analysis of solar powered trigeneration arrangement for cooling, power and drinking water generation. Songklanakarin J. Sci. Technol. 2022, 44, 1419–1426. [Google Scholar]
- Jones, E.; Qadir, M.; van Vliet, M.T.H.; Smakhtin, V.; Kang, S.-m. The state of desalination and brine production: A global outlook. Sci. Total Environ. 2019, 657, 1343–1356. [Google Scholar] [CrossRef]
- Ghalavand, Y.; Hatamipour, M.S.; Rahimi, A. A review on energy consumption of desalination processes. Desalination Water Treat. 2015, 54, 1526–1541. [Google Scholar] [CrossRef]
- Lu, X.; Elimelech, M. Fabrication of desalination membranes by interfacial polymerization: History, current efforts, and future directions. Chem. Soc. Rev. 2021, 50, 6290–6307. [Google Scholar]
- Charcosset, C. A review of membrane processes and renewable energies for desalination. Desalination 2009, 245, 214–231. [Google Scholar] [CrossRef]
- Li, Y.; Chen, X.; Xu, Y.; Zhuo, Y.; Lu, G. Sustainable thermal-based desalination with low-cost energy resources and low-carbon footprints. Desalination 2021, 520, 115371. [Google Scholar] [CrossRef]
- Kumar, P.; Singh, O. Thermodynamic analysis of solid oxide fuel cell-gas turbine-organic Rankine cycle combined system. Int. J. Mater. Sci. Mech. Eng. 2019, 6, 98–102. [Google Scholar]
- Moreira, V.R.; Raad, J.V.; Lazarini, J.X.; Santos, L.V.S.; Amaral, M.C.S. Recent progress in membrane distillation configurations powered by renewable energy sources and waste heat. J. Water Process Eng. 2023, 53, 103816. [Google Scholar] [CrossRef]
- Shahzad, M.W.; Burhan, M.; Ang, L.; Ng, K.C. Energy-water-environment nexus underpinning future desalination sustainability. Desalination 2017, 413, 52–64. [Google Scholar] [CrossRef]
- Nassrullah, H.; Anis, S.F.; Hashaikeh, R.; Hilal, N. Energy for desalination: A state-of-the-art review. Desalination 2020, 491, 114569. [Google Scholar] [CrossRef]
- Rio Carrillo, A.M.; Frei, C. Water: A key resource in energy production. Energy Policy 2009, 37, 4303–4312. [Google Scholar] [CrossRef]
- Gude, V.G. Desalination and sustainability—An appraisal and current perspective. Water Res. 2016, 89, 87–106. [Google Scholar] [CrossRef]
- Mayor, B. Growth patterns in mature desalination technologies and analogies with the energy field. Desalination 2019, 457, 75–84. [Google Scholar]
- Qasim, M.; Badrelzaman, M.; Darwish, N.N.; Darwish, N.A.; Hilal, N. Reverse osmosis desalination: A state-of-the-art review. Desalination 2019, 459, 59–104. [Google Scholar]
- Faigon, M. Success behind advanced SWRO desalination plant. Filtr. Sep. 2016, 53, 29–31. [Google Scholar]
- Schunke, A.J.; Hernandez Herrera, G.A.; Padhye, L.; Berry, T.-A. Energy recovery in SWRO desalination: Current status and new possibilities. Front. Sustain. Cities 2020, 2, 9. [Google Scholar]
- Hafiz Al Hariri, A.; Khalifa, A.E.; Alawad, S.M. Techno-economic analysis of solar-powered membrane distillation system with circulated permeate gap. Sol. Energy 2024, 267, 112243. [Google Scholar] [CrossRef]
- Ankoliya, D.; Mudgal, A.; Sinha, M.K.; Patel, V.; Patel, J. Techno-economic analysis of a hybrid electrodialysis–batch reverse osmosis process for brackish water desalination. AQUA—Water Infrastruct. Ecosyst. Soc. 2023, 72, 593–607. [Google Scholar]
- Biswas, W.K.; Yek, P. Improving the carbon footprint of water treatment with renewable energy: A Western Australian case study. Renew. Wind. Water Sol. 2016, 3, 14. [Google Scholar] [CrossRef]
- Kumar, P.; Singh, O. Investigations on integrating SOFC with gas turbine for performance enhancement and sustainable energy. J. Energy Environ. Sustain. 2019, 7, 42–46. [Google Scholar]
- Khayet, M. Membranes and theoretical modeling of membrane distillation: A review. Adv. Colloid Interface Sci. 2011, 164, 56–88. [Google Scholar] [CrossRef]
- Esato, K.; Eiseman, B. Experimental evaluation of Gore-Tex membrane oxygenator. J. Thorac. Cardiovasc. Surg. 1975, 69, 690–697. [Google Scholar] [CrossRef]
- Yadav, A.; Labhasetwar, P.K.; Shahi, V.K. Membrane distillation using low-grade energy for desalination: A review. J. Environ. Chem. Eng. 2021, 9, 105818. [Google Scholar] [CrossRef]
- Camacho, L.M.; Dumée, L.; Zhang, J.; Li, J.-D.; Duke, M.; Gomez, J.; Gray, S. Advances in Membrane Distillation for Water Desalination and Purification Applications. Water 2013, 5, 94–196. [Google Scholar] [CrossRef]
- Phattaranawik, J.; Jiraratananon, R.; Fane, A.G. Heat transport and membrane distillation coefficients in direct contact membrane distillation. J. Membr. Sci. 2003, 212, 177–193. [Google Scholar]
- Khalifa, A.E.; Alawad, S.M. Air gap and water gap multistage membrane distillation for water desalination. Desalination 2018, 437, 175–183. [Google Scholar] [CrossRef]
- Macossay, J.; Marruffo, A.; Rincon, R.; Eubanks, T.; Kuang, A. Effect of needle diameter on nanofiber diameter and thermal properties of electrospun poly (methyl methacrylate). Polym. Adv. Technol. 2007, 18, 180–183. [Google Scholar]
- Lawson, K.W.; Lloyd, D.R. Membrane distillation. J. Membr. Sci. 1997, 124, 1–25. [Google Scholar]
- Gao, L.; Zhang, J.; Gray, S.; Li, J.-D. Experimental study of hollow fiber permeate gap membrane distillation and its performance comparison with DCMD and SGMD. Sep. Purif. Technol. 2017, 188, 11–23. [Google Scholar] [CrossRef]
- Dow, N.; Gray, S.; Li, J.-d.; Zhang, J.; Ostarcevic, E.; Liubinas, A.; Atherton, P.; Roeszler, G.; Gibbs, A.; Duke, M. Pilot trial of membrane distillation driven by low grade waste heat: Membrane fouling and energy assessment. Desalination 2016, 391, 30–42. [Google Scholar] [CrossRef]
- Zakrzewska-Trznadel, G.; Harasimowicz, M.; Chmielewski, A.G. Concentration of radioactive components in liquid low-level radioactive waste by membrane distillation. J. Membr. Sci. 1999, 163, 257–264. [Google Scholar]
- Duong, H.C.; Cooper, P.; Nelemans, B.; Cath, T.Y.; Nghiem, L.D. Evaluating energy consumption of air gap membrane distillation for seawater desalination at pilot scale level. Sep. Purif. Technol. 2016, 166, 55–62. [Google Scholar] [CrossRef]
- Alkhudhiri, A.; Darwish, N.; Hilal, N. Membrane distillation: A comprehensive review. Desalination 2012, 287, 2–18. [Google Scholar] [CrossRef]
- Banat, F.; Jwaied, N.; Rommel, M.; Koschikowski, J.; Wieghaus, M. Desalination by a “compact SMADES” autonomous solarpowered membrane distillation unit. Desalination 2007, 217, 29–37. [Google Scholar] [CrossRef]
- Raluy, R.G.; Schwantes, R.; Subiela, V.J.; Peñate, B.; Melián, G.; Betancort, J.R. Operational experience of a solar membrane distillation demonstration plant in Pozo Izquierdo-Gran Canaria Island (Spain). Desalination 2012, 290, 1–13. [Google Scholar] [CrossRef]
- Mahmoudi, F.; Moazami Goodarzi, G.; Dehghani, S.; Akbarzadeh, A. Experimental and theoretical study of a lab scale permeate gap membrane distillation setup for desalination. Desalination 2017, 419, 197–210. [Google Scholar] [CrossRef]
- Roslan, S.N.A.B.; Alias, N.H.; Othman, N.H.; Aziz, M.H.A.; Marpani, F.; Mat-Shayuti, M.S.; Shahruddin, M.Z.; Djokokusworo, T. Application of response surface methodology for modelling of direct contact membrane distillation system: A review. Desalination Water Treat. 2022, 257, 169–184. [Google Scholar] [CrossRef]
- Ferreira, R.K.M.; Ramlow, H.; Marangoni, C.; Machado, R.A.F. A review on the manufacturing techniques of porous hydrophobic ceramic membranes applied to direct contact membrane distillation. Adv. Appl. Ceram. 2021, 120, 336–357. [Google Scholar] [CrossRef]
- Foureaux, A.F.S.; Moreira, V.R.; Lebron, Y.A.R.; Santos, L.V.S.; Amaral, M.C.S. Direct contact membrane distillation as an alternative to the conventional methods for value-added compounds recovery from acidic effluents: A review. Sep. Purif. Technol. 2020, 236, 116251. [Google Scholar] [CrossRef]
- Ashoor, B.; Mansour, S.; Giwa, A.; Dufour, V.; Hasan, S. Principles and applications of direct contact membrane distillation (DCMD): A comprehensive review. Desalination 2016, 398, 222–246. [Google Scholar]
- Hitsov, I.; Eykens, L.; De Schepper, W.; De Sitter, K.; Dotremont, C.; Nopens, I. Full-scale direct contact membrane distillation (DCMD) model including membrane compaction effects. J. Membr. Sci. 2017, 524, 245–256. [Google Scholar]
- Ullah, R.; Khraisheh, M.; Esteves, R.J.; McLeskey, J.T., Jr.; AlGhouti, M.; Gad-el-Hak, M.; Tafreshi, H.V. Energy efficiency of direct contact membrane distillation. Desalination 2018, 433, 56–67. [Google Scholar]
- Al-Zoubi, H.; Al-Amri, F.; Khalifa, A.E.; Al-Zoubi, A.; Abid, M.; Younis, E.; Mallick, T.K. A comprehensive review of air gap membrane distillation process. Desalination Water Treat. 2018, 110, 27–64. [Google Scholar] [CrossRef]
- Shahu, V.T.; Thombre, S.B. Air gap membrane distillation: A review. J. Renew. Sustain. Energy 2019, 11, 045901. [Google Scholar] [CrossRef]
- Alawad, S.M.; Khalifa, A.E. Analysis of water gap membrane distillation process for water desalination. Desalination 2019, 470, 114088. [Google Scholar] [CrossRef]
- Im, B.-G.; Lee, J.-G.; Kim, Y.-D.; Kim, W.-S. Theoretical modeling and simulation of AGMD and LGMD desalination processes using a composite membrane. J. Membr. Sci. 2018, 565, 14–24. [Google Scholar] [CrossRef]
- Chen, T.-C.; Ho, C.-D.; Yeh, H.-M. Theoretical modeling and experimental analysis of direct contact membrane distillation. J. Membr. Sci. 2009, 330, 279–287. [Google Scholar] [CrossRef]
- Francis, L.; Ghaffour, N.; Alsaadi, A.A.; Amy, G.L. Material gap membrane distillation: A new design for water vapor flux enhancement. J. Membr. Sci. 2013, 448, 240–247. [Google Scholar] [CrossRef]
- Lawal, D.U. Performance enhancement of permeate gap membrane distillation system augmented with impeller. Sustain. Energy Technol. Assess. 2022, 54, 102792. [Google Scholar] [CrossRef]
- Khayet, M.; Matsuura, T. Membrane Distillation; Elsevier: Amsterdam, The Netherlands, 2011; Volume 41. [Google Scholar]
- Alawad, S.M.; Khalifa, A.E.; Al Hariri, A.H. Theoretical Investigation into the Dynamic Performance of a Solar-Powered Multistage Water Gap Membrane Distillation System. Arab. J. Sci. Eng. 2023, 48, 12499–12511. [Google Scholar] [CrossRef]
- Khayet, M.; Godino, M.P.; Mengual, J.I. Modelling Transport Mechanism Through A Porous Partition. J. Non-Equilib. Thermodyn. 2001, 26, 1–14. [Google Scholar] [CrossRef]
- Khalifa, A.; Lawal, D.; Antar, M.; Khayet, M. Experimental and theoretical investigation on water desalination using air gap membrane distillation. Desalination 2015, 376, 94–108. [Google Scholar] [CrossRef]
- Khayet, M.; Velázquez, A.; Mengual, J.I. Modelling mass transport through a porous partition: Effect of pore size distribution. J. Non-Equilib. Thermodyn. 2004, 29, 279–299. [Google Scholar]
- Li, N.N.; Fane, A.G.; Ho, W.W.; Matsuura, T. Advanced Membrane Technology and Applications; John Wiley & Sons: Hoboken, NJ, USA, 2011. [Google Scholar]
- Zhang, J.; Dow, N.; Duke, M.; Ostarcevic, E.; Li, J.-D.; Gray, S. Identification of material and physical features of membrane distillation membranes for high performance desalination. J. Membr. Sci. 2010, 349, 295–303. [Google Scholar] [CrossRef]
- Zhang, J.; Li, J.-D.; Duke, M.; Xie, Z.; Gray, S. Performance of asymmetric hollow fibre membranes in membrane distillation under various configurations and vacuum enhancement. J. Membr. Sci. 2010, 362, 517–528. [Google Scholar] [CrossRef]
- Manawi, Y.M.; Khraisheh, M.A.M.M.; Fard, A.K.; Benyahia, F.; Adham, S. A predictive model for the assessment of the temperature polarization effect in direct contact membrane distillation desalination of high salinity feed. Desalination 2014, 341, 38–49. [Google Scholar] [CrossRef]
- Martínez-Díez, L.; Vázquez-González, M.I. Temperature and concentration polarization in membrane distillation of aqueous salt solutions. J. Membr. Sci. 1999, 156, 265–273. [Google Scholar] [CrossRef]
- Srisurichan, S.; Jiraratananon, R.; Fane, A.G. Mass transfer mechanisms and transport resistances in direct contact membrane distillation process. J. Membr. Sci. 2006, 277, 186–194. [Google Scholar] [CrossRef]
- Yun, Y.; Ma, R.; Zhang, W.; Fane, A.G.; Li, J. Direct contact membrane distillation mechanism for high concentration NaCl solutions. Desalination 2006, 188, 251–262. [Google Scholar] [CrossRef]
- Anvari, A.; Azimi Yancheshme, A.; Kekre, K.M.; Ronen, A. State-of-the-art methods for overcoming temperature polarization in membrane distillation process: A review. J. Membr. Sci. 2020, 616, 118413. [Google Scholar] [CrossRef]
- Zhang, J.; Li, J.-D.; Gray, S. Effect of applied pressure on performance of PTFE membrane in DCMD. J. Membr. Sci. 2011, 369, 514–525. [Google Scholar] [CrossRef]
- Essalhi, M.; Khayet, M. Application of a porous composite hydrophobic/hydrophilic membrane in desalination by air gap and liquid gap membrane distillation: A comparative study. Sep. Purif. Technol. 2014, 133, 176–186. [Google Scholar] [CrossRef]
- Gao, L.; Zhang, J.; Gray, S.; Li, J.-D. Influence of PGMD module design on the water productivity and energy efficiency in desalination. Desalination 2019, 452, 29–39. [Google Scholar] [CrossRef]
- Curcio, E.; Drioli, E. Membrane Distillation and Related Operations—A Review. Sep. Purif. Rev. 2005, 34, 35–86. [Google Scholar] [CrossRef]
- Ugrozov, V.V.; Elkina, I.B.; Nikulin, V.N.; Kataeva, L.I. Theoretical and experimental research of liquid-gap membrane distillation process in membrane module. Desalination 2003, 157, 325–331. [Google Scholar] [CrossRef]
- Suleman, M.; Asif, M.; Jamal, S.A. Temperature and concentration polarization in membrane distillation: A technical review. Desalin. Water Treat 2021, 229, 52–68. [Google Scholar]
- Ruiz-Aguirre, A.; Andrés-Mañas, J.A.; Fernández-Sevilla, J.M.; Zaragoza, G. Modeling and optimization of a commercial permeate gap spiral wound membrane distillation module for seawater desalination. Desalination 2017, 419, 160–168. [Google Scholar] [CrossRef]
- Alawad, S.M.; Khalifa, A.E.; Abido, M.A.; Antar, M.A. Differential evolution optimization of water gap membrane distillation process for water desalination. Sep. Purif. Technol. 2021, 270, 118765. [Google Scholar] [CrossRef]
- Abido, M.A.; Al-Ali, N.A. Multi-Objective Optimal Power Flow Using Differential Evolution. Arab. J. Sci. Eng. 2012, 37, 991–1005. [Google Scholar] [CrossRef]
- Hariri, A.H.A.; Khalifa, A.E.; Talha, M.; Awda, Y.; Hasan, A.; Alawad, S.M. Artificial neural network and differential evolution optimization of a circulated permeate gap membrane distillation unit. Sep. Purif. Technol. 2024, 338, 126517. [Google Scholar] [CrossRef]
- Yazgan-Birgi, P.; Hassan Ali, M.I.; Swaminathan, J.; Lienhard, J.H.; Arafat, H.A. Computational fluid dynamics modeling for performance assessment of permeate gap membrane distillation. J. Membr. Sci. 2018, 568, 55–66. [Google Scholar] [CrossRef]
- Elbessomy, M.O.; Elsamni, O.A.; Elsheniti, M.B.; Elsherbiny, S.M. Optimum configurations of a compact hollow-fiber water gap membrane distillation module for ultra-low waste heat applications. Chem. Eng. Res. Des. 2023, 195, 218–234. [Google Scholar] [CrossRef]
- Elbessomy, M.O.; Elsheniti, M.B.; Elsherbiny, S.M.; Rezk, A.; Elsamni, O.A. Productivity and Thermal Performance Enhancements of Hollow Fiber Water Gap Membrane Distillation Modules Using Helical Fiber Configuration: 3D Computational Fluid Dynamics Modeling. Membranes 2023, 13, 843. [Google Scholar] [CrossRef]
- Gao, L.; Zhang, J.; Gray, S.; Li, J.-D. Modelling mass and heat transfers of Permeate Gap Membrane Distillation using hollow fibre membrane. Desalination 2019, 467, 196–209. [Google Scholar] [CrossRef]
- Cipollina, A.; Di Sparti, M.G.; Tamburini, A.; Micale, G. Development of a Membrane Distillation module for solar energy seawater desalination. Chem. Eng. Res. Des. 2012, 90, 2101–2121. [Google Scholar] [CrossRef]
- Swaminathan, J.; Chung, H.W.; Warsinger, D.M.; AlMarzooqi, F.A.; Arafat, H.A.; Lienhard V, J.H. Energy efficiency of permeate gap and novel conductive gap membrane distillation. J. Membr. Sci. 2016, 502, 171–178. [Google Scholar] [CrossRef]
- Saleh, A.; Qudeiri, J.A.; Al-Nimr, M.A. Performance investigation of a salt gradient solar pond coupled with desalination facility near the Dead Sea. Energy 2011, 36, 922–931. [Google Scholar] [CrossRef]
- Pal, P.; Manna, A.K. Removal of arsenic from contaminated groundwater by solar-driven membrane distillation using three different commercial membranes. Water Res. 2010, 44, 5750–5760. [Google Scholar] [CrossRef]
- Suárez, F.; Tyler, S.W.; Childress, A.E. A theoretical study of a direct contact membrane distillation system coupled to a salt-gradient solar pond for terminal lakes reclamation. Water Res. 2010, 44, 4601–4615. [Google Scholar] [CrossRef]
- Summers, E.K.; Arafat, H.A.; Lienhard, J.H. Energy efficiency comparison of single-stage membrane distillation (MD) desalination cycles in different configurations. Desalination 2012, 290, 54–66. [Google Scholar] [CrossRef]
- Alquraish, M.M.; Mejbri, S.; Abuhasel, K.A.; Zhani, K. Experimental Investigation of a Pilot Solar-Assisted Permeate Gap Membrane Distillation. Membranes 2021, 11, 336. [Google Scholar] [CrossRef]
- Zaragoza, G.; Ruiz-Aguirre, A.; Guillén-Burrieza, E. Efficiency in the use of solar thermal energy of small membrane desalination systems for decentralized water production. Appl. Energy 2014, 130, 491–499. [Google Scholar] [CrossRef]
- Cheng, L.; Zhao, Y.; Li, P.; Li, W.; Wang, F. Comparative study of air gap and permeate gap membrane distillation using internal heat recovery hollow fiber membrane module. Desalination 2018, 426, 42–49. [Google Scholar] [CrossRef]
- Khalifa, A.E. Membrane Distillation Desalination System With Gap Circulation and Cooling Using a Built-in Heat Exchanger. J. Energy Resour. Technol. 2020, 143. [Google Scholar] [CrossRef]
- Khalifa, A.E. Water and air gap membrane distillation for water desalination—An experimental comparative study. Sep. Purif. Technol. 2015, 141, 276–284. [Google Scholar] [CrossRef]
- Elsheniti, M.B.; Elbessomy, M.O.; Rezk, A.; Fouly, A.; Elsherbiny, S.M.; Elsamni, O.A. Comparative analyses of transient batch operations of hollow-fiber DCMD and WGMD desalination systems at high salinity levels. Desalination 2025, 600, 118492. [Google Scholar] [CrossRef]
- Burgoyne, A.; Vahdati, M. Direct contact membrane distillation. Sep. Sci. Technol. 2000, 35, 1257–1284. [Google Scholar]
- Song, L.; Li, B.; Sirkar, K.K.; Gilron, J.L. Direct Contact Membrane Distillation-Based Desalination: Novel Membranes, Devices, Larger-Scale Studies, and a Model. Ind. Eng. Chem. Res. 2007, 46, 2307–2323. [Google Scholar] [CrossRef]
- Teoh, M.M.; Chung, T.-S. Membrane distillation with hydrophobic macrovoid-free PVDF–PTFE hollow fiber membranes. Sep. Purif. Technol. 2009, 66, 229–236. [Google Scholar] [CrossRef]
- Picard, C.; Larbot, A.; Tronel-Peyroz, E.; Berjoan, R. Characterisation of hydrophilic ceramic membranes modified by fluoroalkylsilanes into hydrophobic membranes. Solid State Sci. 2004, 6, 605–612. [Google Scholar] [CrossRef]
- Schondelmaier, D.; Cramm, S.; Klingeler, R.; Morenzin, J.; Zilkens, C.; Eberhardt, W. Orientation and Self-Assembly of Hydrophobic Fluoroalkylsilanes. Langmuir 2002, 18, 6242–6245. [Google Scholar] [CrossRef]
- Samadi, A.; Ni, T.; Fontananova, E.; Tang, G.; Shon, H.; Zhao, S. Engineering antiwetting hydrophobic surfaces for membrane distillation: A review. Desalination 2023, 563, 116722. [Google Scholar] [CrossRef]
- Rácz, G.; Kerker, S.; Kovács, Z.; Vatai, G.; Ebrahimi, M.; Czermak, P. Theoretical and experimental approaches of liquid entry pressure determination in membrane distillation processes. Period. Polytech. Chem. Eng. 2014, 58, 81–91. [Google Scholar]
- Ghorabi, S.; Ashtiani, F.Z.; Karimi, M.; Fouladitajar, A.; Yousefi, B.; Dorkalam, F. Development of a novel dual-bioinspired method for synthesis of a hydrophobic/hydrophilic polyethersulfone coated membrane for membrane distillation. Desalination 2021, 517, 115242. [Google Scholar] [CrossRef]
- Leaper, S.; Abdel-Karim, A.; Faki, B.; Luque-Alled, J.M.; Alberto, M.; Vijayaraghavan, A.; Holmes, S.M.; Szekely, G.; Badawy, M.I.; Shokri, N.; et al. Flux-enhanced PVDF mixed matrix membranes incorporating APTS-functionalized graphene oxide for membrane distillation. J. Membr. Sci. 2018, 554, 309–323. [Google Scholar] [CrossRef]
- Zheng, L.; Wu, Z.; Wei, Y.; Zhang, Y.; Yuan, Y.; Wang, J. Preparation of PVDF-CTFE hydrophobic membranes for MD application: Effect of LiCl-based mixed additives. J. Membr. Sci. 2016, 506, 71–85. [Google Scholar] [CrossRef]
- Zhang, J.; Gray, S.; Li, J.-D. Modelling heat and mass transfers in DCMD using compressible membranes. J. Membr. Sci. 2012, 387-388, 7–16. [Google Scholar] [CrossRef]
- Khalifa, A.E. Performances of air gap and water gap MD desalination modules. Water Pract. Technol. 2018, 13, 200–209. [Google Scholar] [CrossRef]
- Winter, D.; Koschikowski, J.; Wieghaus, M. Desalination using membrane distillation: Experimental studies on full scale spiral wound modules. J. Membr. Sci. 2011, 375, 104–112. [Google Scholar] [CrossRef]
- Winter, D.; Koschikowski, J.; Ripperger, S. Desalination using membrane distillation: Flux enhancement by feed water deaeration on spiral-wound modules. J. Membr. Sci. 2012, 423–424, 215–224. [Google Scholar] [CrossRef]
- Ruiz-Aguirre, A.; Andrés-Mañas, J.A.; Fernández-Sevilla, J.M.; Zaragoza, G. Comparative characterization of three commercial spiral-wound membrane distillation modules. Desalination Water Treat. 2017, 61, 152–159. [Google Scholar] [CrossRef]
- Lin, Y.-X.; Liou, Y.-K.; Lee, S.L.; Chen, S.-Y.; Tao, F.-T.; Cheng, T.-W.; Tung, K.-L. Preparation of PVDF/PMMA composite membrane with green solvent for seawater desalination by gap membrane distillation. J. Membr. Sci. 2023, 679, 121676. [Google Scholar] [CrossRef]
- Khayet, M.; Mengual, J.I.; Matsuura, T. Porous hydrophobic/hydrophilic composite membranes: Application in desalination using direct contact membrane distillation. J. Membr. Sci. 2005, 252, 101–113. [Google Scholar] [CrossRef]
- Khayet, M.; Matsuura, T.; Mengual, J.I. Porous hydrophobic/hydrophilic composite membranes: Estimation of the hydrophobic-layer thickness. J. Membr. Sci. 2005, 266, 68–79. [Google Scholar] [CrossRef]
- Qtaishat, M.; Khayet, M.; Matsuura, T. Novel porous composite hydrophobic/hydrophilic polysulfone membranes for desalination by direct contact membrane distillation. J. Membr. Sci. 2009, 341, 139–148. [Google Scholar] [CrossRef]
- Qtaishat, M.; Rana, D.; Khayet, M.; Matsuura, T. Preparation and characterization of novel hydrophobic/hydrophilic polyetherimide composite membranes for desalination by direct contact membrane distillation. J. Membr. Sci. 2009, 327, 264–273. [Google Scholar] [CrossRef]
- Alawad, S.M.; Lawal, D.U.; Khalifa, A.E.; Aljundi, I.H.; Antar, M.A.; Baroud, T.N. Analysis of water gap membrane distillation process with an internal gap circulation propeller. Desalination 2023, 551, 116379. [Google Scholar] [CrossRef]
- Khalifa, A.E. Flux enhanced water gap membrane distillation process-circulation of gap water. Sep. Purif. Technol. 2020, 231, 115938. [Google Scholar] [CrossRef]
- Mahmoudi, F.; Date, A.; Akbarzadeh, A. Further investigation of simultaneous fresh water production and power generation concept by permeate gap membrane distillation system. J. Membr. Sci. 2019, 572, 230–245. [Google Scholar] [CrossRef]
- Swaminathan, J.; Chung, H.W.; Warsinger, D.M.; Lienhard V, J.H. Membrane distillation model based on heat exchanger theory and configuration comparison. Appl. Energy 2016, 184, 491–505. [Google Scholar] [CrossRef]
- Shalaby, S.M.; Kabeel, A.E.; Abosheiasha, H.F.; Elfakharany, M.K.; El-Bialy, E.; Shama, A.; Vidic, R.D. Membrane distillation driven by solar energy: A review. J. Clean. Prod. 2022, 366, 132949. [Google Scholar] [CrossRef]
- Curcio, E.; Ji, X.; Di Profio, G.; Sulaiman, A.O.; Fontananova, E.; Drioli, E. Membrane distillation operated at high seawater concentration factors: Role of the membrane on CaCO3 scaling in presence of humic acid. J. Membr. Sci. 2010, 346, 263–269. [Google Scholar] [CrossRef]
- Gryta, M. Fouling in direct contact membrane distillation process. J. Membr. Sci. 2008, 325, 383–394. [Google Scholar]
- Gryta, M. Effect of iron oxides scaling on the MD process performance. Desalination 2007, 216, 88–102. [Google Scholar] [CrossRef]
- Karakulski, K.; Gryta, M.; Morawski, A. Membrane processes used for potable water quality improvement. Desalination 2002, 145, 315–319. [Google Scholar]
- Gryta, M. Concentration of NaCl solution by membrane distillation integrated with crystallization. Sep. Sci. Technol. 2002, 37, 3535–3558. [Google Scholar]
- Wang, P.; Chung, T.-S. Recent advances in membrane distillation processes: Membrane development, configuration design and application exploring. J. Membr. Sci. 2015, 474, 39–56. [Google Scholar] [CrossRef]
- Mundhenk, N.; Huttenloch, P.; Kohl, T.; Steger, H.; Zorn, R. Metal corrosion in geothermal brine environments of the Upper Rhine graben—Laboratory and on-site studies. Geothermics 2013, 46, 14–21. [Google Scholar] [CrossRef]
- Zuo, G.; Wang, R. Novel membrane surface modification to enhance anti-oil fouling property for membrane distillation application. J. Membr. Sci. 2013, 447, 26–35. [Google Scholar]
- Alklaibi, A.M.; Lior, N. Membrane-distillation desalination: Status and potential. Desalination 2005, 171, 111–131. [Google Scholar] [CrossRef]
- Razmjou, A.; Arifin, E.; Dong, G.; Mansouri, J.; Chen, V. Superhydrophobic modification of TiO2 nanocomposite PVDF membranes for applications in membrane distillation. J. Membr. Sci. 2012, 415–416, 850–863. [Google Scholar] [CrossRef]
- Seraj, S.; Mohammadi, T.; Tofighy, M.A. Graphene-based membranes for membrane distillation applications: A review. J. Environ. Chem. Eng. 2022, 10, 107974. [Google Scholar] [CrossRef]
- Bhadra, M.; Roy, S.; Mitra, S. Desalination across a graphene oxide membrane via direct contact membrane distillation. Desalination 2016, 378, 37–43. [Google Scholar] [CrossRef]
- Ren, J.; Li, J.; Xu, Z.; Liu, Y.; Cheng, F. Simultaneous anti-fouling and flux-enhanced membrane distillation via incorporating graphene oxide on PTFE membrane for coking wastewater treatment. Appl. Surf. Sci. 2020, 531, 147349. [Google Scholar]
- Naidu, G.; Jeong, S.; Kim, S.-J.; Kim, I.S.; Vigneswaran, S. Organic fouling behavior in direct contact membrane distillation. Desalination 2014, 347, 230–239. [Google Scholar]
- Lawal, D.U.; Abdulazeez, I.; Alsalhy, Q.F.; Usman, J.; Abba, S.I.; Mansir, I.B.; Sathyamurthy, R.; Kaleekkal, N.J.; Imteyaz, B. Experimental Investigation of a Plate–Frame Water Gap Membrane Distillation System for Seawater Desalination. Membranes 2023, 13, 804. [Google Scholar] [CrossRef] [PubMed]
- Memon, S.; Im, B.-G.; Lee, H.-S.; Kim, Y.-D. Comprehensive experimental and theoretical studies on material-gap and water-gap membrane distillation using composite membranes. J. Membr. Sci. 2023, 666, 121108. [Google Scholar] [CrossRef]
- Khayet, M. Solar desalination by membrane distillation: Dispersion in energy consumption analysis and water production costs (a review). Desalination 2013, 308, 89–101. [Google Scholar] [CrossRef]
- Alawad, S.M.; Khalifa, A.E.; Antar, M.A. Performance analysis of multistage water gap membrane distillation system with economic evaluation. Appl. Therm. Eng. 2021, 184, 116297. [Google Scholar] [CrossRef]
- Amaya-Vías, D.; López-Ramírez, J.A. Techno-Economic Assessment of Air and Water Gap Membrane Distillation for Seawater Desalination under Different Heat Source Scenarios. Water 2019, 11, 2117. [Google Scholar] [CrossRef]
- Lawal, D.U.; Alawad, S.; Usman, J.; Abba, S.I.; Sekar, S.; Mansir, I.B.; Baroud, T.; Alsalhy, Q.F.; Yassin, M.A.; Shah, S.M.H.; et al. Performance assessment of a modified air-gap and water-gap membrane distillation systems. Desalination Water Treat. 2024, 317, 100303. [Google Scholar] [CrossRef]
- Abu-Zeid, M.A.E.-R.; Lu, X.; Zhang, S. Enhancement of the air gap membrane distillation system performance by using the water gap module. Water Supply 2020, 20, 2884–2902. [Google Scholar] [CrossRef]
- Al-Asheh, S.; Banat, F.; Qtaishat, M.; Al-Khateeb, M. Concentration of sucrose solutions via vacuum membrane distillation. Desalination 2006, 195, 60–68. [Google Scholar] [CrossRef]
- Mohammadi, T.; Bakhteyari, O. Concentration of l-lysine monohydrochloride (l-lysine–HCl) syrup using vacuum membrane distillation. Desalination 2006, 200, 591–594. [Google Scholar] [CrossRef]
- Elkina, I.B.; Gilman, A.B.; Ugrozov, V.V.; Volkov, V.V. Separation of Mineral Acid Solutions by Membrane Distillation and Thermopervaporation through Porous and Nonporous Membranes. Ind. Eng. Chem. Res. 2013, 52, 8856–8863. [Google Scholar] [CrossRef]
- Wu, B.; Tan, X.; Li, K.; Teo, W.K. Removal of 1,1,1-trichloroethane from water using a polyvinylidene fluoride hollow fiber membrane module: Vacuum membrane distillation operation. Sep. Purif. Technol. 2006, 52, 301–309. [Google Scholar] [CrossRef]
- Gryta, M. Concentration of aqueous solutions of caprolaclam by membrane distillation. Polimery 2022, 51, 665–670. [Google Scholar]
- Wu, B.; Tan, X.; Teo, W.K.; Li, K. Removal of Benzene/Toluene from Water by Vacuum Membrane Distillation in a PVDF Hollow Fiber Membrane Module. Sep. Sci. Technol. 2005, 40, 2679–2695. [Google Scholar] [CrossRef]
- Yue, C.; Peng, Y.; Chen, L.; Schaefer, L.A. Thermal analysis of a heat pump-based liquid gap membrane distillation H2SO4 system. Chem. Eng. Process. Process Intensif. 2021, 167, 108509. [Google Scholar] [CrossRef]
- Lipczynska-Kochany, E. Humic substances, their microbial interactions and effects on biological transformations of organic pollutants in water and soil: A review. Chemosphere 2018, 202, 420–437. [Google Scholar] [CrossRef] [PubMed]
- Naidu, G.; Jeong, S.; Vigneswaran, S. Interaction of humic substances on fouling in membrane distillation for seawater desalination. Chem. Eng. J. 2015, 262, 946–957. [Google Scholar] [CrossRef]
- Rodríguez, F.J.; Schlenger, P.; García-Valverde, M. A comprehensive structural evaluation of humic substances using several fluorescence techniques before and after ozonation. Part I: Structural characterization of humic substances. Sci. Total Environ. 2014, 476–477, 718–730. [Google Scholar] [CrossRef]
- Chowdhury, S.; Khan, N.; Kim, G.H.; Harris, J.; Longhurst, P.; Bolan, N.S. Chapter 22—Zeolite for Nutrient Stripping From Farm Effluents. In Environmental Materials and Waste; Prasad, M.N.V., Shih, K., Eds.; Academic Press: New York, NY, USA, 2016; pp. 569–589. [Google Scholar]
- Bond, T.; Goslan, E.H.; Parsons, S.A.; Jefferson, B. A critical review of trihalomethane and haloacetic acid formation from natural organic matter surrogates. Environ. Technol. Rev. 2012, 1, 93–113. [Google Scholar] [CrossRef]
- Amaya-Vías, D.; López-Ramírez, J.A.; Gray, S.; Zhang, J.; Duke, M. Diffusion behavior of humic acid during desalination with air gap and water gap membrane distillation. Water Res. 2019, 158, 182–192. [Google Scholar] [CrossRef]


| Properties | MSF | MED | SWRO | BWRO | ED | MD |
|---|---|---|---|---|---|---|
| Typical plant size (×1000 m3/day) | 50–70 | 5–15 | Up to 128 | Up to 98 | 2–145 | 24 |
| Recovery rate (%) | 15–50 | 15–50 | 35–50 | 50–90 | 50–90 | 60–80 |
| Tolerated feed salinity (ppm) | No restrictions | No restrictions | 30,000–60,000 | 500–10,000 | <5000 | No restrictions |
| Brine temperature (°C) | 90–120 | 50–90 | Ambient | Ambient | <45 | 60–90 |
| Produced water (ppm) | <10 | <10 | 300–500 for a single pass | 200–500 | 150–500 | <10 |
| Technology growth trend | Moderate | High | High | High | Moderate | R & D |
| Electrical energy (kWh/m3) | 2.5–5 | 2–2.5 | 4–6 with ERD 7–13 without ERD | 0.5–2.5 | 0.7–5.5 | 1.5–3.6 |
| Thermal energy (MJ/m3) | 190–282 | 145–230 | None | None | None | 360 |
| Equivalent electrical to thermal energy (kWh/m3) | 53–70 | 40–65 | None | None | None | 100 |
| Total energy (kWh/m3) | 55.5–85 | 42–67.5 | 4–13 | 0.5–2.5 | 0.7–5.5 | 101.5–103.65 |
| Cost of water ($/m3) | 0.56–1.75 | 0.52–1.01 | 0.26–0.54 | 0.1 | 0.6 | Varied |
| CO2 emission | 15.6–25.0 | 7.0–17.6 | 1.75–2.79 | 2.46 | 7.0–17.6 | |
| Process | Conditions | Plant Capacity (m3/h) | STEC (kWh/m3) | Advantages | Limitations |
|---|---|---|---|---|---|
| DCMD | PTFE, Tfeed = (29–33) °C, Tcondenser = (18–22) °C, Wastewater [43] | 0.002 | 1500 | Simple design, high flux potential [42] | High energy losses due to direct heating [42] |
| PTFE, Tfeed = (35–80) °C, Tcondenser = (5–30) °C, Radioactive solution [44] | 0.05 | ~600 | |||
| AGMD | Tfeed = (50–70) °C, Tap water, Synthetic seawater [45] | 0.007 | ~65 to ~127 | Lower thermal losses [46] | Lower flux due to air-gap resistance [46] |
| PTFE, Seawater [47] | 0.005 | 200–300 | |||
| PGMD | PTFE, Tfeed = 60 °C [48] | 0.005 | 200 | Effective heat recovery, high energy efficiency compared to DCMD, high flux compared to AGMD [46] | More complex module design [46] |
| PTFE, Tfeed = 82 °C Tcondenser = 15 °C Feed flow = (0.15–1.05) L/min Tap water [49] | 0.00024–0.0012 | 900–2300 |
| Module | Manufacture | Configuration | Membrane Area (m2) | Flow Rate (L/h) | Flux (kg/m2h) | STEC kWh/m3 |
|---|---|---|---|---|---|---|
| SC (AGMD) | Scarab AB, Sweden | Flat sheet AGMD | 2.8 | 1200 | 5.5 | 800–1200 |
| M33 (LGMD) | Keppel Seghers, Singapore | Flat sheet LGMD | 9 | 1560 | 3.1 | 800–1400 |
| PT5 (LGMD) | Keppel Seghers, Singapore | Flat sheet LGMD (3 in series) | 3 × 3 | 1020 | 5 | 400–600 |
| Oryx 150 (Spiral-wound LGMD) | Solar Spring, Germany | Spiral-wound LGMD | 10 | 600 | 3.2 | 210–350 |
| WTS-40A (V-MEMD) | Aquaver | Flat sheet V-MEMD | 5.76 | 70 | 7 | 200–400 |
| Materials | Thermal Conductivity (W/mK) | Flux (kg/m2h) | GOR |
|---|---|---|---|
| Copper (Cu) | 397 | 30.36 | ~0.390 |
| Aluminum (Al) | 239 | ~29 | ~0.395 |
| Brass | 126 | ~28 | ~0.400 |
| Stainless Steel (SS) | 25 | ~27 | ~0.405 |
| HDPE | 0.38–0.51 | ~14 | ~0.340 |
| Acrylic | 0.20 | ~14 | ~0.340 |
| Feed Temperature (°C) | Flux | Production Cost (US $/m3) | Energy Source | Reference |
|---|---|---|---|---|
| 90 | 136.3 kg/m2h | 7 | Electricity | [83] |
| 90 | 7.1 L/m2h (@20C 7.08 kg/m2h) | 3 | Electricity (20 insulated stages) | [144] |
| 70 | 322 kg/m2h | 8.243 | Propeller aided | [122] |
| 70 | 13.08 L/h m2 (@20C 13.05 kg/m2h) | 1.56 €/m3 (In May025 US $3.27/m3) | Waste heat | [145] |
| 70 | 550 L/h m2 (@20C 548.9 kg/m2h) | 1.8 | Waste heat (12 stages) | [85] |
| - | 0.25 kg/m2h (6 L/day/m2) | 16 | 40 solar FPCs | [30] |
Disclaimer/Publisher’s Note: The statements, opinions and data contained in all publications are solely those of the individual author(s) and contributor(s) and not of MDPI and/or the editor(s). MDPI and/or the editor(s) disclaim responsibility for any injury to people or property resulting from any ideas, methods, instructions or products referred to in the content. |
© 2025 by the authors. Licensee MDPI, Basel, Switzerland. This article is an open access article distributed under the terms and conditions of the Creative Commons Attribution (CC BY) license (https://creativecommons.org/licenses/by/4.0/).
Share and Cite
Rupakheti, E.; Koirala, R.; Vahaji, S.; Nirantar, S.; Date, A. A Comprehensive Review of Permeate Gap Membrane Distillation: Modelling, Experiments, Applications. Sustainability 2025, 17, 6294. https://doi.org/10.3390/su17146294
Rupakheti E, Koirala R, Vahaji S, Nirantar S, Date A. A Comprehensive Review of Permeate Gap Membrane Distillation: Modelling, Experiments, Applications. Sustainability. 2025; 17(14):6294. https://doi.org/10.3390/su17146294
Chicago/Turabian StyleRupakheti, Eliza, Ravi Koirala, Sara Vahaji, Shruti Nirantar, and Abhijit Date. 2025. "A Comprehensive Review of Permeate Gap Membrane Distillation: Modelling, Experiments, Applications" Sustainability 17, no. 14: 6294. https://doi.org/10.3390/su17146294
APA StyleRupakheti, E., Koirala, R., Vahaji, S., Nirantar, S., & Date, A. (2025). A Comprehensive Review of Permeate Gap Membrane Distillation: Modelling, Experiments, Applications. Sustainability, 17(14), 6294. https://doi.org/10.3390/su17146294