Article

Mapping and Potential Risk Assessment of Marine Debris in Mangrove Wetlands in the Northern South China Sea

South China Sea Ecological Center of Ministry of Natural Resources (MNR), Nansha Islands Coral Reef Ecosystem National Observation and Research Station, & Key Laboratory of Marine Environmental Survey Technology and Application, MNR, Guangzhou 510300, China
*
Authors to whom correspondence should be addressed.
Sustainability 2025, 17(14), 6311; https://doi.org/10.3390/su17146311
Submission received: 3 June 2025 / Revised: 25 June 2025 / Accepted: 8 July 2025 / Published: 9 July 2025
(This article belongs to the Section Sustainable Oceans)

Abstract

Mangrove wetlands, acting as significant traps for marine debris, have received insufficient attention in previous research. Here, we conduct the first comprehensive investigation into the magnitude, accumulation, source, and fate of marine debris across seven mangrove areas in the northern South China Sea (MNSCS) during 2019–2020. Systematic field surveys employed stratified random sampling, partitioning each site by vegetation density and tidal influence. Marine debris were collected and classified in sampling units by material (plastic, fabric, styrofoam), size (categorized into small, medium, and large), and origin (distinguishing between land-based and sea-based). Source identification and potential risk assessment were achieved through the integration of debris feature analysis. The results indicate relatively low debris levels in MNSCS mangroves, with plastics dominant. More than 70% of all debris weight with plastics (48.34%) and fabrics (14.59%) is land-based, and more than 70% comes from coastal/recreational activities. More than 90% of all debris items with plastics (52.50%) and Styrofoam (36.32%) are land-based, and more than 90% come from coastal/recreational activities. Medium/large-sized debris are trapped in mangrove wetlands under the influencing conditions of local tidal level, debris item materials, and sizes. Our study quantifies marine debris characteristics, sources, and ecological potential risks in MNSCS mangroves. From environmental, economic, and social sustainability perspectives, our findings are helpful for guiding marine debris management and mangrove conservation. By bridging research and policies, our work balances human activities with ecosystem health for long-term sustainability.

1. Introduction

Mangroves, as distinct woody plants in estuaries and coastal wetlands, can serve ecosystems in multiple ways, including providing wave/tidal absorption to protect shorelines, aiding biodiversity conservation, accelerating the degradation of pollutants, enhancing the esthetic appeal of mangroves, and enhancing carbon storage and mitigating global climate change [1,2]. In 2010, the total mangrove area covered ~137,600 km2 of coastline worldwide, including in Latin America and the Caribbean (20.3%), Africa (20%), and Asia (38.7%) [3]. Although mangroves cover only 0.5% of the total coastal area, they are estimated to contribute up to 16% of coastal carbon sequestration [4]. Mangrove wetlands, as sinks for anthropogenic debris, are highly vulnerable to marine debris exposure from all terrestrial and marine sources, due to their unique structural complexity and coastal habitats [5,6,7,8,9,10]. Marine debris on the forest floor can reduce the esthetic appeal of mangroves [11].
Marine debris (litter), which refers to any persistent, man-made, and processed solid material in the marine and coastal environment, including plastics, has become a global concern [12,13,14,15,16]. Plastic began to be widely used in the 1950s, and since then, its production has increased exponentially [17]. As daily “white pollution”, plastic is considered a hazardous waste and a form of planetary transboundary pollution [11], affecting marine organisms and human health. Approximately 50% of plastics produced globally are buoyant, and it is estimated that more than 60% of floating (buoyant) plastic debris is exported from coastal areas to the open ocean [18]. Mangrove wetlands are known to be debris traps, but have not yet received sufficient attention. Marine debris in mangroves has become a largely neglected problem [19]. Approximately two-thirds of plastic debris in the open ocean is estimated to enter twenty of the world’s rivers, and eighteen of these rivers are associated with mangroves [20]. The largest single mangrove forest in the world—the Sundarbans National Park, between Bangladesh and India—is reportedly becoming a plastic cesspit [11]. Mangroves should account for some of this “missing” plastics [18,21] due to difficulties with surveying and undetermined methods, insufficient survey data/information, etc. Although microplastics have been identified in mangrove sediments, there is a lack of data in this habitat [22]. However, the magnitude, accumulation, distribution, and fate of marine debris are still open questions. The total mangrove area in China is ~344.72 km, and mangroves are prominently distributed in the northern South China Sea (across Guangdong province, Hainan province, and Guangxi Zhuang Autonomous Region) [23,24]. In order to assess marine debris (particularly plastics) in typical mangrove areas of the northern South China Sea (MNSCS) caused by human activities in 2019, a debris survey was carried out in the Beilun Estuary mangrove region in Fangchenggang (BL) [2]. In 2020, six regional surveys of marine debris in mangrove wetlands were conducted in Guangdong province, Hainan province, and Guangxi Zhuang Autonomous Region. This is the first comprehensive introduction to the situation of marine debris in the MNSCS. We hope to understand and analyze the nature of marine debris (scale, source, etc.) in the northern South China Sea mangrove areas. This will help to determine the risks they pose and contribute to formulating targeted management strategies to reduce debris input.
Here, for the first time, we systematically map the magnitude, accumulation, and distribution and assess the sources, fate, and potential risks of marine debris in the MNSCS. This study fills a critical research gap, as our previous survey in this region [2] primarily focused on localized pollution assessments rather than comprehensive spatial-temporal analyses. Our study not only provides foundational datasets for ecological risk assessment, but also highlights mangrove ecosystems as critical “traps” for marine debris in coastal zones. We examine the distribution of marine debris items of different sizes (including plastics) across high, medium, and low tide levels to understand more about the controlling factors of debris entrapment in mangroves. By understanding how debris accumulates and is trapped in mangroves, it is helpful to formulate more effective measures to remove and prevent debris. The findings underscore the need for integrative management frameworks targeting both land-based pollution sources and in situ debris removal in these ecologically vital regions. Our results provide important information for the risk assessment and disposal of debris in mangroves, and assist in the conservation and restoration of these vital coastal forests. By quantifying debris characteristics and potential ecological risks, our findings inform sustainable mangrove management, bridging scientific research with policies to balance human activities and mangrove ecosystem health for long-term sustainability.

2. Materials and Methods

2.1. Sampling and Field Analysis

In 2019, a modified approach for marine debris assessment was applied in the Beilun Estuary mangrove region of Fangchenggang (BL) [2], systematically revealing the distribution, sources, accumulation patterns, and impacts of marine debris to provide critical data for coastal management strategies in the region. From April to December, 2020, marine debris was investigated in six regional areas of mangrove wetlands in the MNSCS (Figure 1 and SI Table S1), viz, Qi’ao Island in Zhuhai of Guangdong (QA), Hengmen Waterway in the Pearl River Estuary of Guangdong (HM), Futian District in Shenzhen of Guangdong (FT), Daya Bay in Huizhou of Guangdong (DY), Qinglan Port in Wenchang of Hainan (QL), and Qingmei Port in Sanya of Hainan (QM), respectively. Three stations (high-tide, medium-tide, and low-tide stations) were investigated in transects. Only two stations could ultimately be investigated (the high-tide and/or low-tide stations) due to their short transects. For the critical details of our entire surveys in the MNSCS, such as transect/station design, timing, and sampling frequency, refer to the relevant literature [2].
The type, quantity, weight, and size of marine debris items were recorded using the visual and weighting methods (if possible, photos were taken in situ and sufficient information recorded to identify the possible sources) [2]. Several simple and useful terms were used to describe the relative size of debris items, but were not part of the SI system previously reported [13]. The sizes of debris items were classified as small-sized (<2.5 cm, S-sz), medium-sized (≥2.5 cm and ≤10 cm, M-sz), big-sized (or large-sized) (>10 cm and ≤1 m, B-sz), and oversized (>1 m, O-sz). The visual inspection method is highly convenient for detecting medium-to-large debris (≥2.5 cm), but has inherent limitations in identifying small debris (<2.5 cm). This is because the recognition of small debris varies among individuals and is affected by environmental factors (e.g., lighting). As a result, the visual sampling method may miss small debris.

2.2. Data Statistics and Potential Risk Assessment

To identify the source of marine debris, the material characteristics and usage information of on-site marine debris (for details, refer to the literature [2]) were comprehensively analyzed to determine whether the debris originated from land-based or sea-based sources. Key quantification metrics (e.g., debris density, size distribution, material composition) were used, including mean values, standard deviations, and frequency distributions, to characterize the magnitude of marine debris in mangrove areas.
The quantity or mass density (D-Qt with the unit of item/m2 or D-Ms with the unit of g/m2) is equal to the quantity (Qts with the unit of item) or weight (Wts with the unit of g) of the debris items divided by the study area (Astd with the unit of m2). The mean density has the units of g/m2 and item/m2 (D-Mean) [2,15]. The density was calculated for the number (items) or mass (weights, g) of debris in each category in an area (A) as follows:
D = N umber   ( items )   or   Mass   ( g ) A
where D is the quantity density in items per 1.0 square meters (items/m2) or the mass density in terms of grams per 1.0 square meters (g/m2), respectively; A is the sampling area in square meters (m2). Additionally, for the entire mangrove region, the total quantity (items) and mass (kg) of each type of debris, e.g., plastics, were estimated based on the total area of the mangrove region. Ms-p.c. and Qt-p.c. represent the mass percentage and the quantity percentage of marine debris items, respectively. For the mass and quantity densities of marine debris in our study, the Poisson distribution was statistically applied to the mean value (±3σ).
To conduct a comprehensive potential risk assessment of marine debris in the mangrove wetland ecosystem, this study integrated multiple analytical methodologies. Debris density bar charts were utilized to quantitatively depict the spatiotemporal variations in marine debris distribution, facilitating the identification and quantification of the impacts of regional anthropogenic activities, including urbanization, industrial discharge, and maritime operations.
Pie charts were employed for a detailed multivariate analysis of the material composition of marine (plastic) debris, encompassing both quantitative (quantity or mass density) and qualitative (material types, degradation state) dimensions. This analysis enabled the precise dissection of the contribution ratios of land-based sources (e.g., municipal waste runoff, industrial waste disposal) and sea-based sources (e.g., fishing gear abandonment, shipping-related losses), thereby elucidating the complex influence mechanisms through which human activities modify the compositional structure and provenance of debris in mangrove habitats.
By mapping the spatial distribution of the percentage composition for all debris (with a particular focus on plastic debris) across stations at different tidal levels, this study allowed for a systematic investigation of the size class distribution patterns of debris under the dynamic influence of tidal regimes, in order to understand further the mechanisms by which tidal dynamics govern debris interception, retention, and transport processes within the mangrove wetland. This approach can help in exploring the internal relationships between debris accumulation and tides, as well as between source profiles and spatial distribution, and can provide critical scientific insights for the development of targeted conservation and management strategies.

3. Results

In seven areas of the MNSCS (data from SI Tables S2-1–S2-3), the mean densities and types of debris items in the mangrove are shown in Figure 2 and Figure 3. The densities of marine debris are 1.538~45.677 (19.557 ± 0.202) g/m2 and 0.047~0.362 (0.145 ± 0.017) item/m2, respectively. More than 60% of total debris weight is plastics, followed by fabric and styrofoam. More than 55% of total debris items are plastics, followed by styrofoam (~35%). For all plastic debris (plastic + styrofoam, the abbreviated form of the sum of plastic and styrofoam), the mean densities are 1.288~40.168 (13.743 ± 0.167) g/m2 and 0.040~0.341 (0.131 ± 0.017) item/m2, respectively.
In terms of spatial distribution, QA has the highest mass density (45.677 g/m2), followed by DY, FT, and BL, yet QM has the lowest mass density (1.538 g/m2). In terms of plastic debris, QA has the highest mass density (40.168 g/m2), followed by BL (15.457 g/m2), but QM has the lowest mass density (1.288 g/m2). In terms of spatial distribution, QA has the highest quantity density (0.362 item/m2), followed by BL (0.163 item/m2), but DY has the lowest quantity density (0.047 item/m2).
In terms of plastic debris, QA and BL have higher quantity densities (0.341 item/m2 and 0.146 item/m2), but QM has the lowest density (0.040 item/m2). Marine debris in the MNSCS consists primarily of light-weight, floating materials, such as plastics (bags, bottles, ropes), styrofoam, wood products, etc. Plastic bags are retained in mangroves with the highest capture rates [25].

4. Discussion

All the marine debris in the MNSCS were identified as having either a land-based or a sea-based source. The spatial distribution of the debris by size was analyzed to investigate the impact of tidal dynamics on accumulation. Then, the findings were synthesized in order to propose evidence-based strategies linking scientific analysis and potential risk assessment with mitigation.

4.1. Source of Marine Debris in the MNSCS

Figure 4 shows that more than 70% of total debris weight is land-based, comprising plastics (48.34%), fabrics (14.59%), and styrofoam (11.05%) (data from SI Tables S3-1–S3-3). In sea-based debris, 97.20% of the debris weight is plastics, with only small amounts of styrofoam and wood products. More than 90% of total debris items are land-based, comprising plastics (52.50%) and styrofoam (36.32%). In sea-based debris, 86.67% of the debris items are plastics, followed by styrofoam (11.11%) and some wood products.
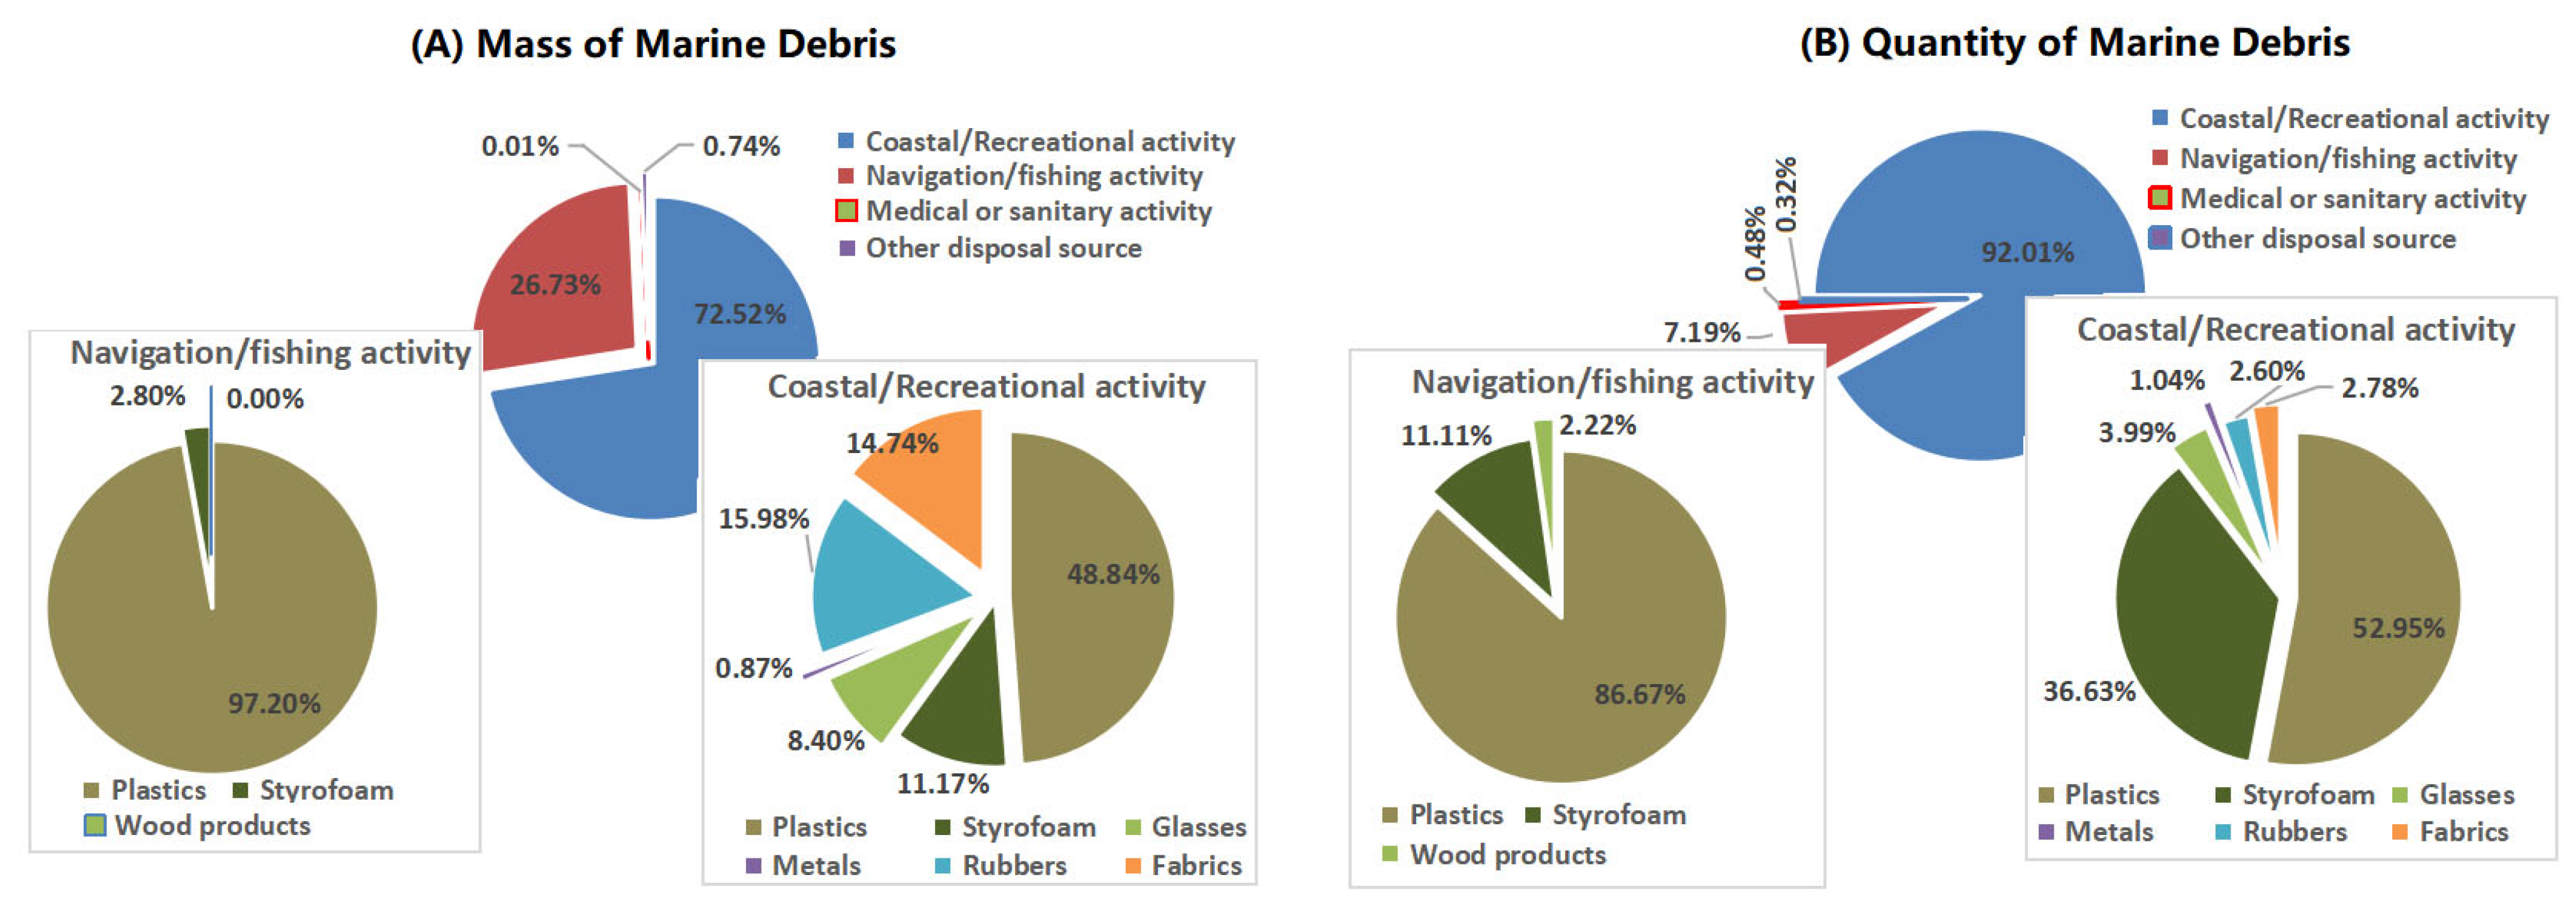
Regarding the anthropogenic sources (Figure 5), more than 70% of total debris weight come from coastal/recreational activities, and ~50% of total debris weight is plastics (48.84%), followed by rubbers (15.98%), fabrics (14.74%), and styrofoam (11.17%). More than 25% of total debris weight come from navigation/fishing activities, including plastics (97.20%) and styrofoam (2.8%). More than 90% of total debris items come from coastal/recreational activity, dominated by plastics (52.95%) and styrofoam (36.63%). About 7% of total debris items come from navigation/fishing activity, dominated by plastics (86.67%), followed by styrofoam (11.11%).
Our data show that a major source of marine debris in the MNSCS is land-based activities, especially coastal/recreational activities, suggesting that mangroves are susceptible to trapping debris in estuarine or coastal wetlands due to these associated activities. Sea-based debris also comes from the navigation/fishing activities, with plastic debris (plastic and styrofoam) dominating from this source, such as waste fishing nets/cages, broken buoys, ropes, foam, etc.

4.2. Spatial Distribution of Various-Sized Debris Items and Tidal Influence

Trapping of marine debris in mangroves (including plastics and microplastics) depends on the debris itself, mangrove habitats, natural local environmental factors, and anthropic factors [22,24,25,26,27,28]. Similarly to sediment deposition, marine debris capture occurs directly in mangroves due to the three-dimensional environment and complex structure of mangroves, which can significantly reduce wave height and slow down water flow [26]. Whether a debris item can be captured depends firstly on its own properties, such as its material, density, shape, size, and surface properties, and so on. Size and shape can affect an item’s behavior in the environment, including its transport and further degradation [2,13]. However, some reports indicate that there is no pattern as to which sections of mangroves have the most or least debris when comparing debris across multiple tidal levels (low-, medium-, and high-tide stations) [29]). Larger pieces of floating debris are easily captured at the edges of mangrove forests, while smaller pieces of debris can penetrate deeper into the forests [19].
In the MNSCS, the M-sz, B-sz, and O-sz debris items are all found, whereas S-sz items are not (data from SI Figure S1, SI Table S5). The mass densities of the M-sz, B-sz, and O-sz debris are 0.210, 14.404, and 4.943 g/m2, with the percentages of 1.07%, 73.65%, and 25.27%, respectively. The quantity densities of the M-sz, B-sz, and O-sz debris are 0.007, 0.068, and 0.006 item/m2, with percentages of 8.65%, 84.15%, and 7.20%, respectively. Our results show that mangroves can easily trap floating debris ≥ 2.5 mm size, but never S-sz debris. This is because mangroves are not conducive to the deposition of micro and small-sized debris, including microplastics [30].
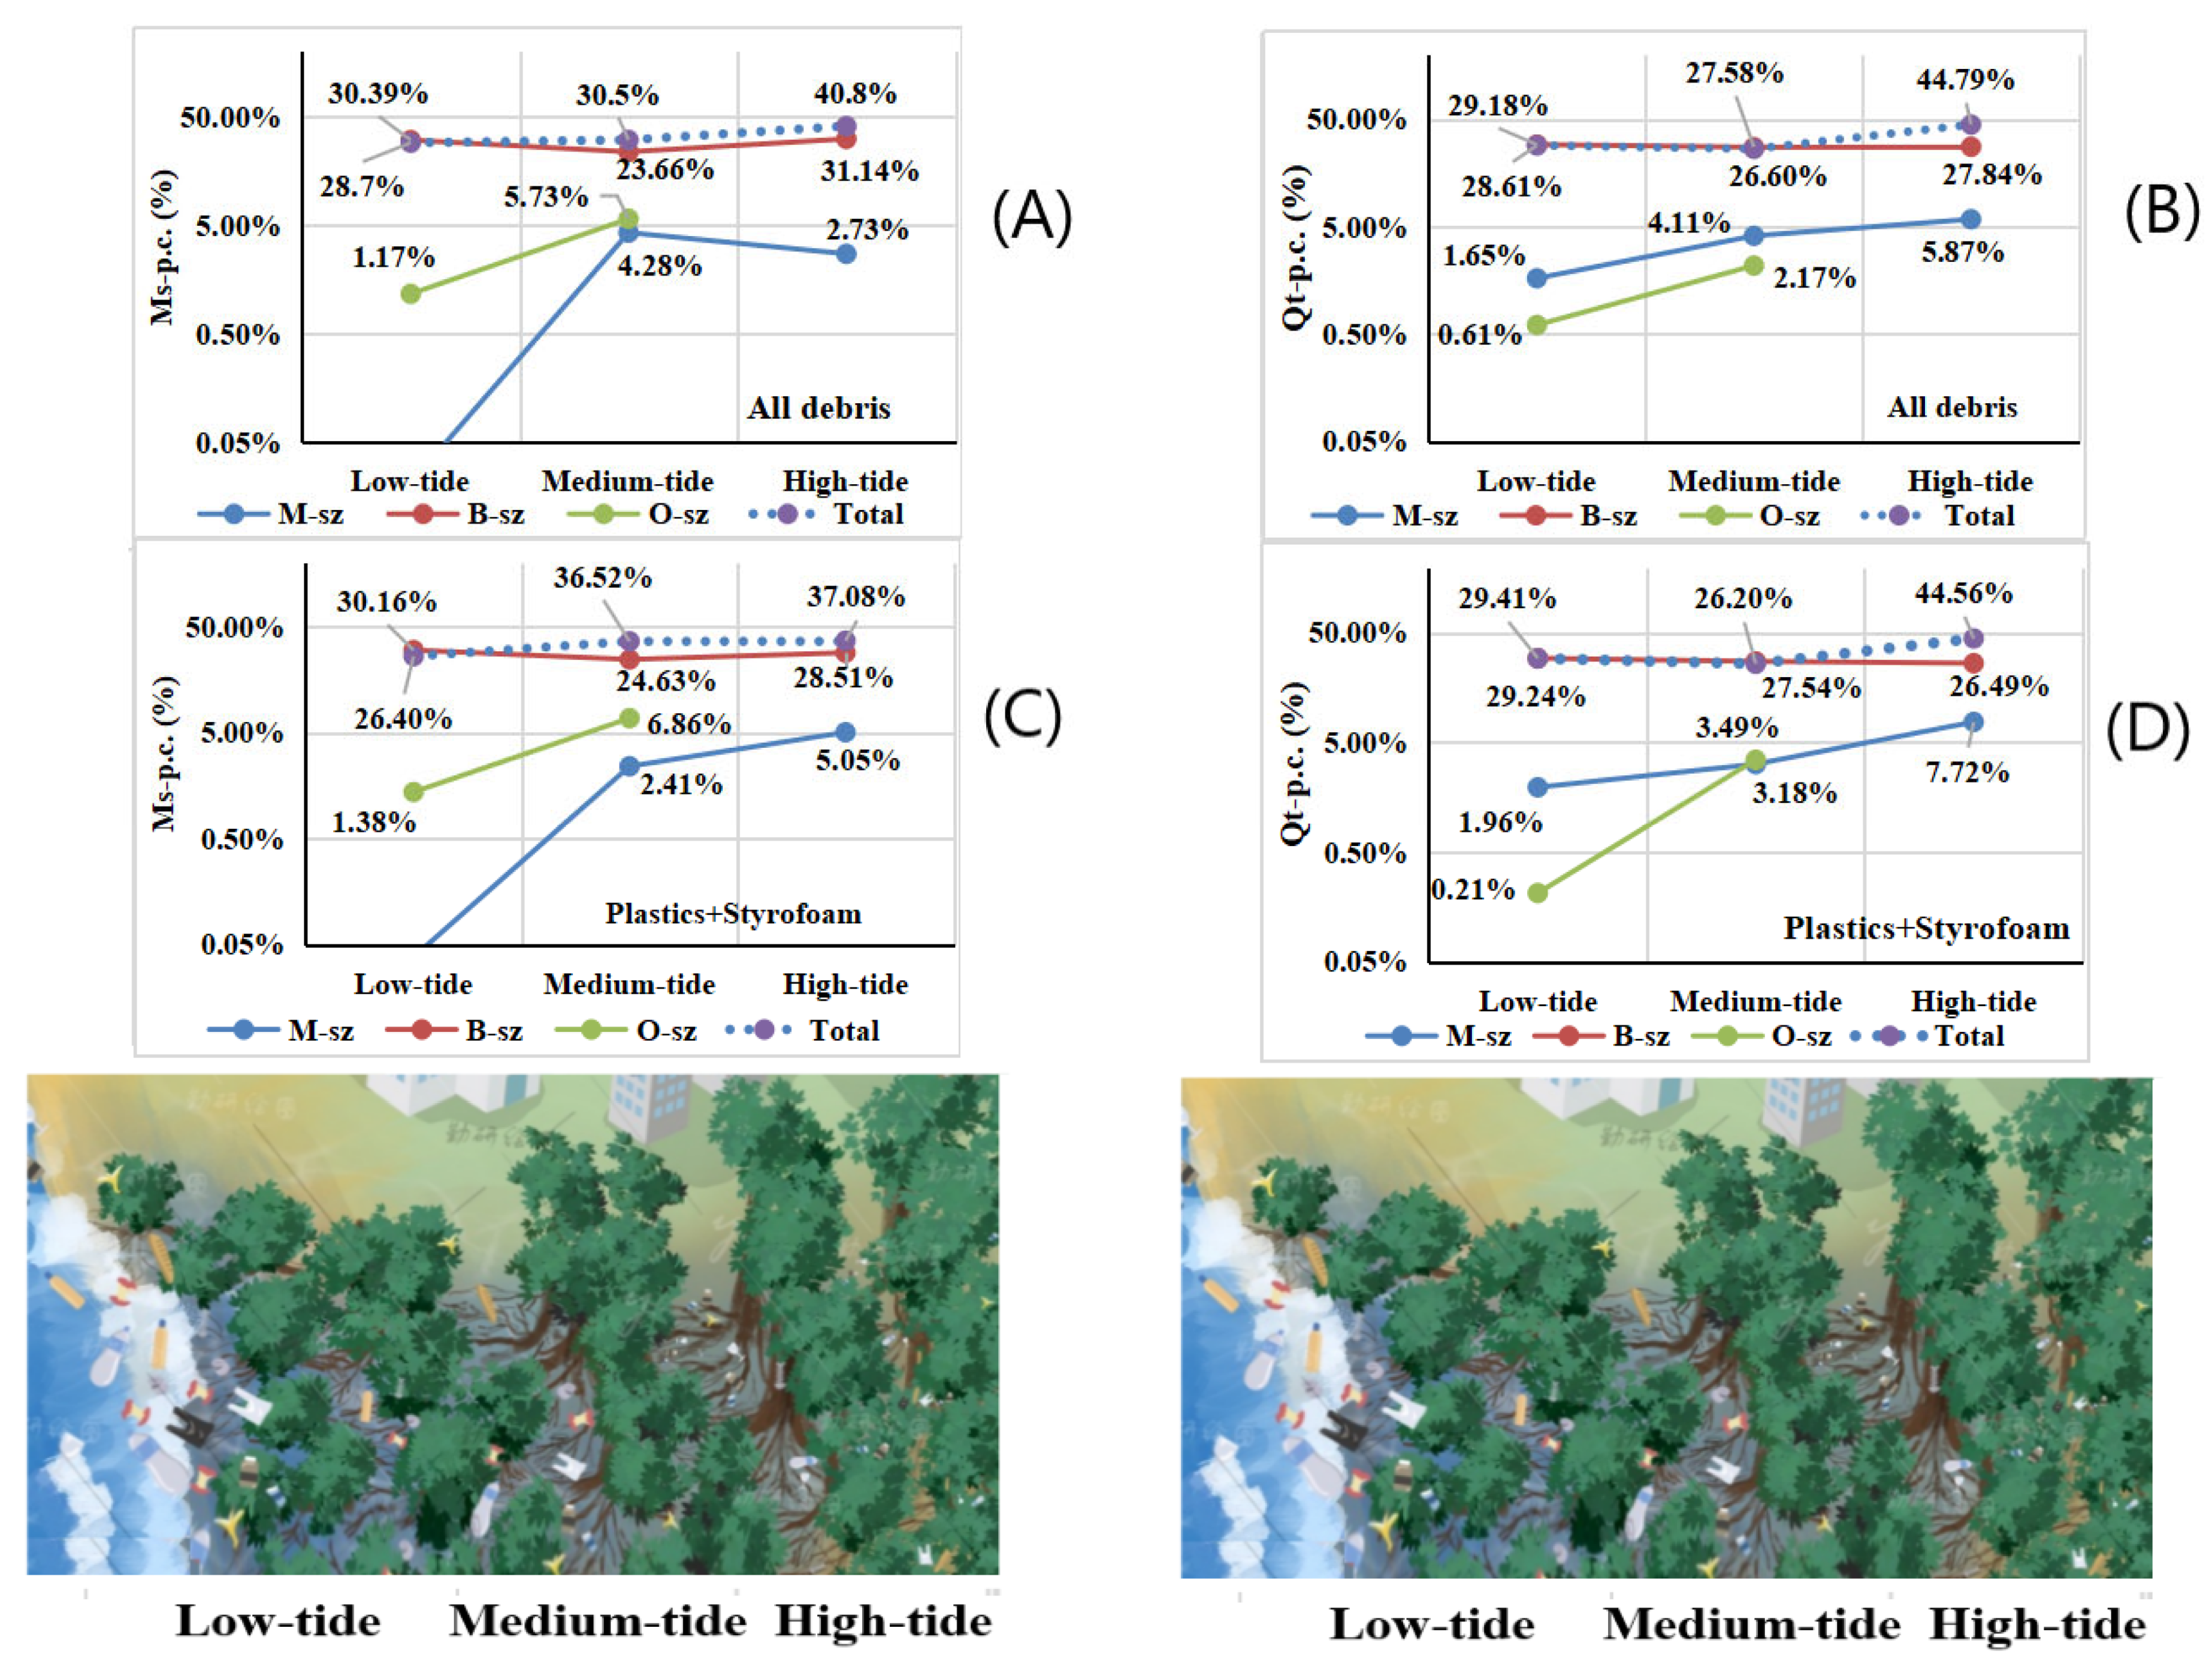
Figure 6 and SI Figure S2 show that there is a positive correlation between the debris size and the local tidal level (data from SI Tables S6-1 and S6-2). The spatial distribution of debris sizes is influenced by tides in the MNSCS. At the low-tide stations, the quantity percentages of total debris items and plastic (plastic + styrofoam) items are lower than those at the medium- and high-tide stations. For total debris items, the mass and quantity percentages at the low- and/or medium-tide stations are consistent, but they are lower than those at the high-tide stations. For the total plastic items (plastics and styrofoam), the mass percentages at the high- and medium-tide stations are higher than those at the low-tide stations, but the quantity percentages at the high-tide stations are higher than those at the low- and/or medium-tide stations. Our results are similar to those reported for Penang Island, Malaysia [29], and Mauritius [31] (SI Figures S3-1 and S3-2), suggesting that mangroves are akin to marine debris sinks and act as a barrier to land/ocean-based debris [6,25].
It is hypothesized that mangrove forests act as traps and retain sea-based debris, but direct dumping of land-based debris could have serious impacts on coastal mangrove forests [10,21]. Here, our results show that at the low-tide stations, both the mass and quantity percentages of the M-sz items are lower than those at the high- and/or medium-tide stations. Similarly, the mass/quantity percentages of the M-sz plastic items (plastics and styrofoam) are lower than those at the high- and/or medium-tide stations. For the B-sz debris items, the mass percentages are highest at the high-tide stations and the quantity percentages are highest at the low-tide stations. However, the mass and/or quantity percentages at the three tidal stations are generally of the same order of magnitude, and there is no significant difference in distribution between the three tidal stations. For both the O-sz debris and O-sz plastic items (plastics and styrofoam), the mass and/or quantity percentages are zero (never found items) at the high-tide stations. The mass and/or quantity percentages at the medium-tide stations are higher than those at the low-tide stations.
In fact, the smaller the size of the debris items, the stronger their mobility. The M-sz items have greater mobility, followed by the B-sz items, and the mobility of the O-sz items is the worst. B-sz items, with moderate mobility, are easily trapped by mangroves, and their mass/quantity percentages are at a uniform level distribution of (23.66~31.44) %. M-sz items, with the strongest mobility, not only easily enter mangrove forests, but also flow out of mangrove forests with the tide. Thus, the mass/quantity percentages of the M-sz items at the three tide stations are relatively low, as follows: <8% for the high-tide stations, <6% for the middle-tide stations, and <1.6% for the low-tide stations. O-sz items have the worst mobility, and their mass/quantity percentages are at a low level of (3.49~6.83)%. Under strong driving forces (of tidal currents and waves), O-sz items can only enter mangroves via low-tide stations, and quickly become trapped at medium-tide stations. O-sz items face a dilemma, because it is difficult for them to reach high-tide stations when there are no strong tidal drivers or storm surges. In addition, the size distribution helps to identify the source of the debris. All O-sz items are extremely concentrated at both the low-tide and the medium-tide stations, indicating that they originated from the surrounding estuaries or nearshore waters. Due to their poor mobility, the O-sz items are susceptible to entanglement by branches/roots, and are prevented from entering the high-tidal stations from the terrestrial environment. When O-sz items come from the terrestrial environment (nearby roads, beaches, or direct dumping), they will be trapped by mangrove plants and stuck at high-tide stations.
Various characteristics of mangrove habitats influence the efficiency of wave energy reduction [27], e.g., tree species, root characteristics, diversity, density and spacing, etc. Many true mangrove species appear to have great potential to trap M-sz and B-sz debris due to their highly specialized and complex aerial root systems [21,32], such as Kandekia candel, Aegiceras corniculatum, Laguncularia racemosa, Bruguicra gymnorrhiza, Avicennia marina, Sonneratia apetala, Excoecaria agallocha, Acanthus ilicifolius, etc. Root characteristics and sediment types within mangroves have been reported to affect how efficiently plastic items become trapped and influence their accumulation and dispersal [33,34]. Rhizophora stylosa can form a complex barrier to efficiently trap marine debris items due to its prop and stilt roots descending from the trunk and branches [20,27]. For Avicennia marina, Sonneratia apetala, and Laguncularia racemosa, their dense thriving clusters of pneumatophores may be highly efficient traps for debris items, especially for the film-like plastics [6]. The diversity of mangrove plants should play an important role in the trapping potential of debris items, as the structural complexity of their root and branch systems varies greatly among species. This geographic pattern of mangrove plants could influence their trapping efficiency of debris items [21], but there is no positive statistical relationship between the density of young and adult plants and the abundance of debris items [35].
In addition, natural local environmental factors and anthropic factors influence the efficiency of debris capture. Natural local environmental factors include hydrological conditions (e.g., tides, wave heights, etc.), geological conditions (e.g., topography, slope and length, sediment types), and weather or climate conditions (e.g., wind, rainfall, etc.). Local topography can affect the accumulation of marine debris items, and there is a positive statistical relationship between the shore slope and the abundance of debris items [35,36]. Anthropic factors include the socio-economic industrial structure, mariculture, tourism, population density, some habits and customs, coastal dumping, etc.
Here, the total weights of marine debris found in the mangroves of Beilun Estuary, Qi’ao Island, Futian, Qinglan Port, Fanhegang of Daya Bay, Hengmen Waterway, and Qingmei Port were 274.6 (30.65~672.9), 226.6 (43.60~5076.9), 65.1 (27.0~109.7), 3.3 (2.5~6.6), 0.28 (0.06~0.50), and 0.14 (0.04~0.25) tons, respectively. In the MNSCS (2890.2 × 104 m2), there is about 565.2 (±5.8) (44.4~1320.2) tons of debris, including 347.2 (±4.6) (37.2~1076.0) tons of plastics and 50.0 (±1.7) (0~130.4) tons of styrofoam. In the total mangrove area of 344.72 km2 in China, the total weight of plastic debris is 4737 (±58) tons, including 4141 (±54) tons of plastics and 596 (± 21) tons of styrofoam (SI Table S4-1).

4.3. Potential Risk Assessment

The potential risks of marine debris in mangroves exhibit remarkable spatial heterogeneity and multi-dimensional threats. Our results indicate relatively low debris levels in MNSCS mangroves, with plastics dominant. However, QA emerges as a spatially high-risk zone for debris mass density (45.677 g/m2) and plastics accumulation (40.168 g/m2) due to land-based inputs and tidal dynamics in the Pearl River Estuary. Larger debris (B-sz, 73.65% mass proportion) are trapped in high-tide areas via physical interception by mangrove roots (e.g., prop roots of Rhizophora stylosa). Larger debris items can smother mangrove seedlings [37] and reduce water quality, inhibit natural growth and expansion, and hinder subsequent restoration efforts [35,38]. Oxygen penetration within the mangrove rhizosphere may also be impeded by the stationary plastic debris in the fringe or sediment, resulting in low growth or pneumatophore deformation [38,39]. In mangroves, the root zone can be covered with plastics, resulting in tree mortality [39].
Ecologically, plastic debris (accounting for >60%) induces respiratory obstruction in mangroves and hinders seedling establishment through root entanglement, while microplastics infiltrating sediments disrupt benthic habitats. Chemical pollutants from plastic degradation further threaten fish and avian species via food chain bioaccumulation. Economically, some potential risks of marine debris include reduced ecotourism value (e.g., Qi’ao island is an eco-tourism zone), substantial cleanup costs (millions of yuan required for MNSCS), and other latent impacts. Managerially, cross-departmental regulatory gaps for land-based debris (70% from coastal recreation and domestic waste), traceability challenges for sea-based inputs (e.g., shipping/fishing waste), and lagging microplastics monitoring systems exacerbate risk mitigation difficulties.
By quantifying debris characteristics and potential ecological risks, our findings inform sustainable mangrove management, bridging scientific research with policies. Since debris can affect the health and function of mangrove ecosystems, proper management enforcing total debris discharge control based on this study’s results can contribute to maintaining and restoring these important wetland ecosystems. There is an urgent need to assess the risk of invasion of mangrove wetlands by marine debris, and to promote a cultural shift in public perception of mangrove protection and restoration. This is because plastics exposed to solar radiation are subject to photodegradation, embrittlement, and fragmentation [40], ultimately leading to the formation of microplastics.

5. Conclusions

As a widespread problem related to marine pollution, marine debris has become one of the most serious threats to the conservation and sustainable use of our region’s marine and coastal resources. Scientific investigation and assessment form the first step in safeguarding mangroves. The collaborative promotion of mangrove protection and marine debris governance lies at the core of sustainable development. Environmentally, cutting marine debris pollution preserves biodiversity and ecosystem stability. Economically, healthy mangroves boost fisheries and ecotourism. Socially, they safeguard coastal livelihoods and cultural heritage and foster community governance participation, enhancing social cohesion.
It is necessary to further strengthen the monitoring of marine debris and to collect sufficient data in mangrove ecosystems. The following recommendations are made: First, given the methods of monitoring and assessment, surveys should include as much detailed information as possible, including size, quantity, weight, classification, type, source, and so on. Source identification is always difficult in the investigation process, so more information about the source of marine debris needs to be recorded, including its label, shape, place of manufacture, secondary use, and so on. Some evaluation indicators include density, coverage, spatial distribution, and source discrimination. If possible, some attention should also be paid to the age and accumulation history of marine debris in mangroves, especially for new debris. This may provide more useful information for subsequent identification, assessment, and management policy formulation.
Second, the study of marine debris is not an end, but is a means to solve the problem of the debris management. More and more governments are currently working to minimize debris dumping in mangroves and the ocean, but the enforcement initiatives are insufficient during the monitoring process. A basic approach to marine debris management is to control its source, reduce its discharge, and recycle waste and turn it into new items of value. Legislation and policy formulation are important. Both river basin management and coastal zone management are also important, because land-based debris in mangroves comes almost entirely from riverine inputs and coastal human activities.
Additionally, it is very important to carry out mangrove restoration to remove debris and reduce its negative impacts. Because of the characteristics of mangrove forests, marine debris in mangroves can only enter, and cannot leave, which accelerates its accumulation.

Supplementary Materials

The following supporting information can be downloaded at https://www.mdpi.com/article/10.3390/su17146311/s1: details of data and figures are shown in SI Tables S1–S6 and SI Figures S1–S3 in the Supplementary Material.

Author Contributions

P.Z.: conceptualization, methodology, data processing, writing—reviewing and editing. Z.J. and L.Z.: diagrams, analysis, data processing. P.Z.: sampling and data processing, diagrams, analysis. P.Z., D.L., Z.J. and H.H.: data processing, writing—reviewing and editing. All authors discussed the results and commented on the paper. All authors have read and agreed to the published version of the manuscript.

Funding

This research was funded by the Science and Technology Development Foundation of South China Sea Bureau, Ministry of Natural Resources of China (23YD03, 202404), and the Fund of Key Laboratory of Global Change and Marine-Atmospheric Chemistry (GCMAC) of the Ministry of Natural Resources (MNR) (GCMAC202207).

Data Availability Statement

The data presented in this study are available in insert article here.

Acknowledgments

This work was financially supported by the Science and Technology Development Foundation of South China Sea Bureau, Ministry of Natural Resorces of China (202404, 23YD03), and the Fund of Key Laboratory of Global Change and Marine-Atmospheric Chemistry (GCMAC) of the Ministry of Natural Resources (MNR) (GCMAC202207). We are extremely grateful for the help from Haikou Marine Center and Sansha Marine Center, MNR of China (Shichang He), Fangchenggang Ocean Bureau (Wanci Luo and Xiong Liu) of Cuangxi Zhuang Autonomous Region, and Cuangxi Beilun Estuary National Nature Reserve Administration (Zhihe Wu).

Conflicts of Interest

The authors declare no conflicts of interest.

References

  1. Rovai, A.S.; Twilley, R.R.; Castañeda-Moya, E.; Riul, P.; Cifuentes-Jara, M.; Manrow-Villalobos, M.; Horta, P.A.; Simonassi, J.C.; Fonseca, A.L.; Pagliosa, P.R. Global controls on carbon storage in mangrove soils. Nat. Clim. Change 2018, 8, 534–538. [Google Scholar] [CrossRef]
  2. Li, D.; Zhao, L.; Guo, Z.; Yang, X.; Deng, W.; Zhong, H.; Zhou, P. Marine Debris in the Beilun Estuary Mangrove Forest: Monitoring, Assessment and Implications. Int. J. Environ. Res. Public Health 2021, 18, 10826. [Google Scholar] [CrossRef]
  3. Bunting, P.; Rosenqvist, A.; Lucas, R.M.; Rebelo, L.M.; Hilarides, L.; Thomas, N.; Hardy, A.; Itoh, T.; Shimada, M.; Finlayson, C.M. The Global Mangrove Watch—A New 2010 Global Baseline of Mangrove Extent. Remote Sens. 2018, 10, 1669. [Google Scholar] [CrossRef]
  4. Donato, D.C.; Kauffman, J.B.; Murdiyarso, D.; Kurnianto, S.; Stidham, M.; Kanninen, M. Mangroves among the most carbon-rich forests in the tropics. Nat. Geosci. 2011, 4, 293–297. [Google Scholar] [CrossRef]
  5. Costa, M.F.; Silva-Cavalcanti, J.S.; Barbosa, C.C.; Portugal, J.L.; Barletta, M. Plastics buried in the inter-tidal plain of a tropical estuarine ecosystem. J. Coast. Res. 2011, S64, 339–343. [Google Scholar]
  6. Martin, C.; Almahasheer, H.; Duarte, C.M. Mangrove forests as traps for marine litter. Environ. Pollut. 2019, 247, 499–508. [Google Scholar] [CrossRef]
  7. Martin, C.; Baalkhuyur, F.; Valluzzi, L.; Saderne, V.; Cusack, M.; Almahasheer, H.; Krishnakumar, P.K.; Rabaoui, L.; Qurban, M.; Arias-Ortiz, A.; et al. Exponential increase of plastic burial in mangrove sediments as a major plastic sink. Sci. Adv. 2020, 6, eaaz5593. [Google Scholar] [CrossRef]
  8. Riascos, J.M.; Valencia, N.; Peña, E.J.; Cantera, J.R. Inhabiting the technosphere: The encroachment of anthropogenic marine litter in Neotropical mangrove forests and its use as habitat by macrobenthic biota. Mar. Pollut. Bull. 2019, 142, 559–568. [Google Scholar] [CrossRef]
  9. Not, C.; Lui, C.Y.I.; Cannicci, S. Feeding behavior is the main driver for microparticle intake in mangrove crabs. Limnol. Oceanogr. Lett. 2020, 5, 84–91. [Google Scholar] [CrossRef]
  10. Luo, Y.Y.; Vorsatz, L.D.; Not, C.; Cannicci, S. Landward zones of mangroves are sinks for both land and water borne anthropogenic debris. Sci. Total Environ. 2021, 818, 151809. [Google Scholar] [CrossRef]
  11. Adyel, T.M.; Macreadie, P.I. World’s Largest Mangrove Forest Becoming Plastic Cesspit. Front. Mar. Sci. 2021, 8, 766876. [Google Scholar] [CrossRef]
  12. UNEP (United Nations Environment Programme). Marine Plastic Debris and Microplastics-Global Lessons and Research to Inspire Action and Guide Policy Change; United Nations Environment Programme (UNEP): Nairobi, Kenya, 2016; 252p. [Google Scholar]
  13. GESAMP. Guidelines or the Monitoring and Assessment of Plastic Litter and Microplastics in the Ocean; Kershaw, P.J., Turra, A., Galgani, F., Eds.; (IMO/FAO/UNESCO-IOC/NIDO/WMO/IAEA/UN/UNEP/UNDP/ISA Joint Group of Experts on the Scientific Aspects of Marine Environmental Protection). Rep. Stud. GESAMP No. 99; GESAMP: London, UK, 2019; p. 130. [Google Scholar]
  14. Roman, L.; Hardesty, B.D.; Leonard, G.H.; Pragnell-Raasch, H.; Mallos, N.; Campbell, I.; Wilcox, C. A global assessment of the relationship between anthropogenic debris on land and the seafloor. Environ. Pollut. 2020, 264, 114663. [Google Scholar] [CrossRef] [PubMed]
  15. Zhou, P.; Huang, C.; Fang, H.; Cai, X.; Li, D.; Li, H.; Yu, H. The abundance, composition and sources of marine debris in coastal seawaters or beaches around the northern South China Sea (China). Mar. Pollut. Bull. 2011, 62, 1998–2007. [Google Scholar] [CrossRef] [PubMed]
  16. Santos, R.G.; Machovsky-Capuska, G.E.; Andrades, R. Plastic ingestion as an evolutionary trap: Toward a holistic understanding. Science 2021, 373, 56–60. [Google Scholar] [CrossRef]
  17. MacLeod, M.; Arp, H.P.H.; Tekman, M.B.; Jahnke, A. The global threat from plastic pollution. Science 2021, 373, 61–65. [Google Scholar] [CrossRef]
  18. Cózar, A.; Echevarría, F.; González-Gordillo, J.I.; Irigoien, X.; Úbeda, B.; Hernández-León, S.; Palma, Á.T.; Navarro, S.; García-De-Lomas, J.; Ruiz, A.; et al. Plastic debris in the open ocean. Proc. Natl. Acad. Sci. USA 2014, 111, 10239–10244. [Google Scholar] [CrossRef]
  19. Debrot, A.O.; Meesters, H.W.G.; Bron, P.S.; De Leon, R. Marine debris in mangroves and on the seabed: Largely-neglected litter problems. Mar. Pollut. Bull. 2013, 72, 1. [Google Scholar] [CrossRef]
  20. Lebreton, L.C.M.; van der Zwet, J.; Damsteeg, J.-W.; Slat, B.; Andrady, A.; Reisser, J. River plastic emissions to the world’s oceans. Nat. Commun. 2017, 8, 15611. [Google Scholar] [CrossRef]
  21. Luo, Y.Y.; Not, C.; Cannicci, S. Mangroves as unique but understudied traps for anthropogenic marine debris: A review of present information and the way forward. Environ. Pollut. 2021, 271, 116291. [Google Scholar] [CrossRef]
  22. Nor, N.H.M.; Obbard, J.P. Microplastics in Singapore’s coastal mangrove ecosystems. Mar. Pollut. Bull. 2014, 79, 278–283. [Google Scholar] [CrossRef]
  23. Dan, X.; Liao, B.; Wu, Z.; Wu, H.; Bao, D.; Dan, W.; Liu, S. Resources, Conservation Status and Main Threats of Mangrove Wetlands in China. Ecol. Environ. Sci. 2016, 25, 1237–1243, (In Chinese with English Abstract). [Google Scholar] [CrossRef]
  24. Zhou, Q.; Tu, C.; Fu, C.; Li, Y.; Zhang, H.; Xiong, K.; Zhao, X.; Li, L.; Waniek, J.J.; Luo, Y. Characteristics and distribution of microplastics in the coastal mangrove sediments of China. Sci. Total Environ. 2020, 703, 134807. [Google Scholar] [CrossRef] [PubMed]
  25. do Sul, J.A.I.; Costa, M.F.; Silva-Cavalcanti, J.S.; Araújo, M.C.B. Plastic debris retention and exportation by a mangrove forest patch. Mar. Pollut. Bull. 2014, 78, 252–257. [Google Scholar] [CrossRef]
  26. Feller, I.C.; Lovelock, C.E.; Berger, U.; McKee, K.L.; Joye, S.B.; Ball, M.C. Biocomplexity in mangrove ecosystems. Annu. Rev. Mar. Sci. 2010, 2, 395–417. [Google Scholar] [CrossRef]
  27. Dahdouh-Guebas, F.; Jayatissa, L.P.; Di Nitto, D.; Bosire, J.O.; Lo Seen, D.; Koedam, N. How effective were mangroves as a defence against the recent tsunami? Curr. Biol. 2005, 15, R443–R447. [Google Scholar]
  28. Lima, A.R.A.; Barletta, M.; Costa, M.F.; Ramos, J.A.A.; Dantas, D.V.; Melo, P.A.M.C.; Justino, A.K.S.; Ferreira, G.V.B. Changes in the composition of ichthyoplankton assemblage and plastic debris in mangrove creeks relative to moon phases. J. Fish Biol. 2016, 89, 619–640. [Google Scholar] [CrossRef]
  29. Chee, S.Y.; Chai, Y.E.E.J.; Danielle, C.; Yusri, Y.; Barry, J. Anthropogenic marine debris accumulation in mangroves on Penang island, Malaysia. J. Sustain. Sci. Manag. 2020, 15, 41–67. [Google Scholar] [CrossRef]
  30. Deng, J.; Guo, P.; Zhang, X.; Su, H.; Zhang, Y.; Wu, Y.; Li, Y. Microplastics and accumulated heavy metals in restored mangrove wetland surface sediments at Jinjiang Estuary (Fujian, China). Mar. Pollut. Bull. 2020, 159, 111482. [Google Scholar] [CrossRef]
  31. Seeruttun, L.D.; Raghbor, P.; Appadoo, C. First assessment of anthropogenic marine debris in mangrove forests of Mauritius, a small oceanic island. Mar. Pollut. Bull. 2021, 164, 112019. [Google Scholar] [CrossRef]
  32. Srikanth, S.; Lum, S.K.Y.; Chen, Z. Mangrove root: Adaptations and ecological importance. Trees 2015, 30, 451–465. [Google Scholar] [CrossRef]
  33. Sandilyan, S.; Kathiresan, K. Plastic- a formidable threat to unique biodiversity of Pichavaram mangroves. Curr. Sci. 2012, 103, 1262–1263. [Google Scholar]
  34. Duan, J.; Han, J.; Cheung, S.G.; Chong, R.K.Y.; Lo, C.-M.; Lee, F.W.-F.; Xu, S.J.-L.; Yang, Y.; Tam, N.F.-Y.; Zhou, H.-C. How mangrove plants affect microplastic distribution in sediments of coastal wetlands: Case study in Shenzhen Bay, South China. Sci. Total Environ. 2021, 767, 144695. [Google Scholar] [CrossRef] [PubMed]
  35. Cordeiro, C.A.M.M.; Cózar, T.M. Evaluation of solid residues removed from a mangrove swamp in the Sao Vicente Estuary, SP, Brazil. Mar. Pollut. Bull. 2010, 60, 1762–1767. [Google Scholar] [CrossRef] [PubMed]
  36. Vermeiren, P.; Muñoz, C.C.; Ikejima, K. Sources and sinks of plastic debris in estuaries: A conceptual model integrating biological, physical and chemical distribution mechanisms. Mar. Pollut. Bull. 2016, 113, 7–16. [Google Scholar] [CrossRef]
  37. Gorman, D.; Turra, A. The role of mangrove revegetation as a means of restoring macrofaunal communities along degraded coasts. Sci. Total Environ. 2016, 566, 223–229. [Google Scholar] [CrossRef]
  38. Smith, S.D. Marine debris: A proximate threat to marine sustainability in Bootless Bay, Papua New Guinea. Mar. Pollut. Bull. 2012, 64, 1880–1883. [Google Scholar] [CrossRef]
  39. van Bijsterveldt, C.E.; van Wesenbeeck, B.K.; Ramadhani, S.; Raven, O.V.; van Gool, F.E.; Pribadi, R.; Bouma, T.J. Does plastic waste kill mangroves? A field experiment to assess the impact of macro plastics on mangrove growth, stress response and survival. Sci. Total Environ. 2021, 756, 143826. [Google Scholar] [CrossRef]
  40. Andrady, A.L. Microplastics in the marine environment. Mar. Pollut. Bull. 2011, 62, 1596–1605. [Google Scholar]
Figure 1. Locations of sampling areas in the MNSCS (Note: the seven regions surveyed were the Beilun Estuary in Fangchenggang (BL) in 2019; Qi’ao Island in Zhuhai (QA) in 2020; Hengmen Waterway in the Pearl River Estuary (HM) in 2020; Futian District in Shenzhen (FT) in 2020; Daya Bay in Huizhou (DY) in 2020; Qinglan Port in Wenchang (QL) in 2020; and Qingmei Port in Sanya (QM) in 2020, respectively).
Sustainability 17 06311 g001
Figure 2. The mean densities of plastic, styrofoam, all plastic debris (plastic + styrofoam, the sum of plastic and styrofoam), and all marine debris in the MNSCS. (A) Mass density (g/m2), (B) quantity density (item/m2).
Sustainability 17 06311 g002
Figure 3. Types of marine debris in the MNSCS. (A) Mass percentages of debris items, (B) quantity percentages of debris items.
Sustainability 17 06311 g003
Figure 4. Land/sea-based debris in the MNSCS, classified according to their materials. (A) Mass percentages of debris items; (B) quantity percentages of debris items.
Sustainability 17 06311 g004
Figure 5. Anthropogenic activity-based sources of marine debris in the MNSCS. (A) Mass percentages of debris items; (B) quantity percentages of debris items.
Sustainability 17 06311 g005
Figure 6. Spatial distribution of all debris items by size and tidal influence in the MNSCS. (A) Mass percentages of debris items; (B) quantity percentages of debris items; (C) mass percentages of plastic and styrofoam items; (D) quantity percentages of plastic and styrofoam items.
Sustainability 17 06311 g006
Disclaimer/Publisher’s Note: The statements, opinions and data contained in all publications are solely those of the individual author(s) and contributor(s) and not of MDPI and/or the editor(s). MDPI and/or the editor(s) disclaim responsibility for any injury to people or property resulting from any ideas, methods, instructions or products referred to in the content.