Article

Urban Projects and the Policy-Making Cycle: Indicators for Effective Governance

by
Francesca Abastante
and
Beatrice Mecca
*
Interuniversity Department of Regional and Urban Studies and Planning (DIST), Politecnico di Torino, 10125 Torino, Italy
*
Author to whom correspondence should be addressed.
Sustainability 2025, 17(14), 6305; https://doi.org/10.3390/su17146305
Submission received: 10 June 2025 / Revised: 4 July 2025 / Accepted: 7 July 2025 / Published: 9 July 2025

Abstract

Assessing sustainability in urban projects became a key priority in the face of growing urban complexity. Therefore, how can global sustainability indicators be effectively adapted to assess urban projects at local scales? The paper proposes a framework for integrating sustainability into the decision-making process, aligning urban governance with the 2030 Agenda at the district and building levels. Governments’ growing demand for reliable monitoring, reporting, and evaluation systems underscores the urgency of data-driven tools to guide and adjust policies. In this context, indicators are essential instruments, making sustainability measurable and transparent. Anchored in the global framework of the 17 Sustainable Development Goals (SDGs), the paper focuses on SDG 11, integrating strategic targets with operational metrics from Sustainable Assessment Tools (SATs). The research adopts a multi-method approach, combining inductive analysis—guided by the PRISMA methodology for systematic reviews—with deductive analysis based on surveys. This study represents the theoretical foundation of the GLOSSA project (GLOcal knowledge-System for the Sustainable Assessment of urban projects), aiming to provide a set of indicators for measuring and evaluating sustainable urban transformation projects. This paper highlights the need to integrate sustainability into urban decision-making, providing an operational framework for sustainable urban governance.

1. Introduction

This paper aims to contribute to the growing need for a sustainability assessment, intertwining the concept of the policy-making cycle [1,2], the 2030 Agenda, and the Sustainable Assessment Tools (SATs) by proposing an empirical framework useful for monitoring and evaluating the sustainability of urban projects at the district and building scale.
Currently, governments require robust systems for monitoring, reporting, and evaluation to develop consistent and sustainable strategies. These should enhance mechanisms and capacities to monitor policy progress and make data-driven adjustments, particularly in response to the potential negative or unintended effects [3]. Evaluation, along with its associated tools and methods, can enhance the effectiveness of development programs by supporting policymakers in formulating urban transformation policies and strategies [4,5,6,7].
Various tools and methods for evaluation exist [8,9,10,11], such as the Environmental Impact Assessment (EIA), Strategic Environmental Assessment (SEA), Cost–Benefit Analysis (CBA), Social Return on Investment (SROI), Life Cycle Assessment (LCA), and Sustainability/Environmental Rating Systems. However, in the existing literature, one of the most employed tools for managing and evaluating various sustainability dimensions is the “set of indicators” [12]. Indicators play a crucial role in rendering sustainable development both visible and transparent, as they provide relevant information to support decision-making processes and the formulation of urban and territorial policies [13].
In this sense, indicators play an important role, offering opportunities to anticipate and plan future actions [3]. This is evident in the operational monitoring of sustainable development, where the 17 Sustainable Development Goals (SDGs) place a strong emphasis on developing a framework of indicators and statistical data to globally measure and monitor progress. The SDG indicators are designed as a broad global framework to be translated and adapted at the national and local levels. They hold no legislative authority; in other words, they function as political objectives without a normative binding force [14].
In particular, SDG11 monitors the sustainable, inclusive, safe, and resilient development of cities through 10 targets and 15 global indicators [15]. Nationally, the planned indicators amount to 32, referring to 7 out of 10 targets [16,17]. In Italy, the SDGs are a priority. The main reference tool is the National Sustainable Development Strategy (NSDS), which defines the economic, social, and environmental guidelines for achieving national sustainable goals [18]. In turn, each region defines its own Regional Sustainable Development Strategy (RSSD) aimed at monitoring a territory with specific characters according to the NSDS and assessing its positioning with respect to the various phenomena of the 2030 Agenda.
However, the indicators and tools proposed by ISTAT, the NSDS, and the RSSDs are not entirely appropriate for use at the urban or district scale, as they focus on the national and regional levels, respectively.
Alongside monitoring through the SDGs, it is important to highlight that the European Commission [19] emphasizes the need for the active use of decision-making and assessment tools in policy development. Governments at all levels can influence the conditions necessary for a circular urban sector—promoting the sharing, reuse, and recycling of existing materials and products with the goal of maximizing the lifespan of manufactured goods and reducing emissions. Despite the extensive array of documents, strategies, and actions characterizing the sustainability paradigm, there remains a lack of an empirical framework that identifies a set of indicators capable of operationally contributing to effective governance and supporting the policy-making cycle [1,2,20]. With the intent to address this gap, this research proposes a novel framework for implementing the operative relationship between urban sustainability and the policy-making cycle. This framework aims to (i) study existing indicators by taking into consideration numerous aspects of sustainability such as the environment, society, and the economy; (ii) apply inclusive methodologies for the identification of operational indicators in territorial transformations; (iii) support the definition of the policy-making cycle to access policy processes and consider stakeholders’ opinions; and (iv) develop an inclusive research methodology that is adaptable and replicable across diverse contexts.
By achieving these aims, the research proposes a novel set of indicators based on the indicators of the SDG11 while integrating operational indicators derived from the SATs. In order to propose a robust and valid set of indicators, the research applies an inductive systematic review of the literature based on the Preferred Reporting Items for Systematic Reviews and Meta-Analyses [21,22] validated through a deductive analysis based on direct surveys.
The originality of this study lies in its dual contribution to the existing body of literature on indicators for sustainable urban development. First, it seeks to adapt indicators recognized at global, national, and regional levels to the urban and building scales. Second, it integrates these indicators based on their alignment with, and relevance to, the policy and decision-making cycle. In this light, the proposed set of indicators is designed to serve as a practical tool for Italian public authorities and urban planners, supporting territorial monitoring and the evaluation of urban transformations in line with sustainable development objectives.
This paper constitutes the preliminary theoretical phase of a nationally significant research project (PRIN) called GLOSSA, “GLOcal knowledge-System for the Sustainable Assessment of urban projects”. The project localizes and adapts global indicators to both national and local levels, supporting the measurement of progress toward sustainable development.
This paper is structured as follows: Section 2 delineates the theoretical framework underpinning the indicator tool, highlighting its significance within the decision-making cycle and the 2030 Agenda. Section 3 details the research design, while Section 4 presents and critically examines the proposed set of indicators. Finally, Section 5 provides concluding remarks and outlines avenues for future research and development.

2. Indicators for Urban and Architectural Sustainability

The indicator can be defined as a synthetic quantitative measure that provides a representation of a phenomenon by summarizing its trends [23] and offering information on the state of a phenomenon, domain, area, or element [24].
This evaluation tool can support decision-making in the context of urban and architectural planning in various ways, depending on the phase of the policy-making cycle [2,20]. The policy-making cycle is understood as a framework for analyzing contemporary public policy processes, enabling an understanding of the context in which political decisions are made, implemented, and monitored, evolving through a sequence of four distinct phases: (i) problem identification and framing; (ii) formulation and development of alternatives; (iii) implementation of actions; and (iv) monitoring, evaluation, and reporting (for further details, see [2]).
Public urban and architectural projects are the tangible means through which political visions are transformed into physical realities and are therefore closely tied to the duration of the political cycle. For example, a Public Administration (PA) may emphasize urban regeneration through the development of infrastructure or public housing plans, while its successor might focus on environmental sustainability or social inclusion projects. In this sense, the length of the political cycle influences project realization, as projects may be subject to changes based on shifting political or economic priorities. Such projects must not only address development needs but also pursue sustainability and urban quality of life as mandated by global and European urban agendas [25,26]. For instance, the design of green public spaces, energy-efficient buildings, and inclusive neighborhoods are responses to emerging needs arising from urban planning that is mindful of climate change and social inequalities.
To ensure that such projects align with emerging policies and needs, they must be thoroughly evaluated before being implemented. Similarly, it is necessary to monitor territories and cities to identify problems on which to build intervention priorities and define development themes [27]. In this context, indicators play a crucial role as evaluation tools, capable of synthesizing and providing essential and meaningful information regarding specific urban phenomena, geographic areas, projects, or public policies [28,29,30,31]. In particular, the importance of the indicator becomes clear in supporting the realization process of urban and architectural projects in line with the policy-making cycle. This applies particularly to phases (i), (iii), and (iv), where it helps to identify priority issues, implement operational choices, and monitor areas, plans, projects, and programs as well as in phase (ii) in which it supports the evaluation of project alternatives. It is important to highlight that indicators assume different characteristics and meanings depending on the phase of the policy-making cycle in which they are applied (e.g., ex ante evaluation, monitoring, or in itinere evaluation) and the territorial scale of the project [27,32]. For example, an indicator for monitoring problems in a district area will naturally differ from an indicator used to evaluate an architectural project.
Within the debate on the role of indicators in supporting the policy-making cycle, the 2030 Agenda plays a significant role [15] as it provides a tangible example of the use and relevance of the indicator to identify problems and establish a positive or negative positioning framework for continents, countries, and regions concerning specific phenomena. This approach aligns perfectly with the policy-making cycle, particularly in phases (i) and (iv).
This process and the use of SDGs’ indicators are also reflected in Italian national tools related to the implementation of sustainable development [18]. Initially, both the national and regional authorities in Italy assess their positive or negative positioning concerning the various phenomena monitored by the indicators and targets of the 2030 Agenda [16]. Based on this assessment, specific national and regional strategies aimed at achieving sustainable goals are developed.
However, the current 2030 Agenda indicators at the national level [16] are not specific or operational with regard to the district and building scales. They are also not suitable for supporting the evaluation and implementation phases corresponding to stages (ii) and (iii) of the policy-making cycle.
This research addresses this gap by proposing a set of indicators as an extension of the SDG11 indicators’ set, to be used for supporting various phases of the policy decision-making cycle at all scales, including district and building levels. The following section outlines the process followed for the collection and identification of these indicators.

3. Research Design

The research design includes two phases: (i) The literature review, related to the collection and selection of scientific papers and documents (described in Section 3.1); (ii) indicators identification, related to the identification and selection of the indicators, proposed and reported in the previous papers and documents, that can potentially be relevant for the urban and architectural project context (detailed in Section 3.2). Both phases have been addressed through specific methodologies and procedures, as summarized in Figure 1 and explained in detail in the following sub-sections (Section 3.1 and Section 3.2).

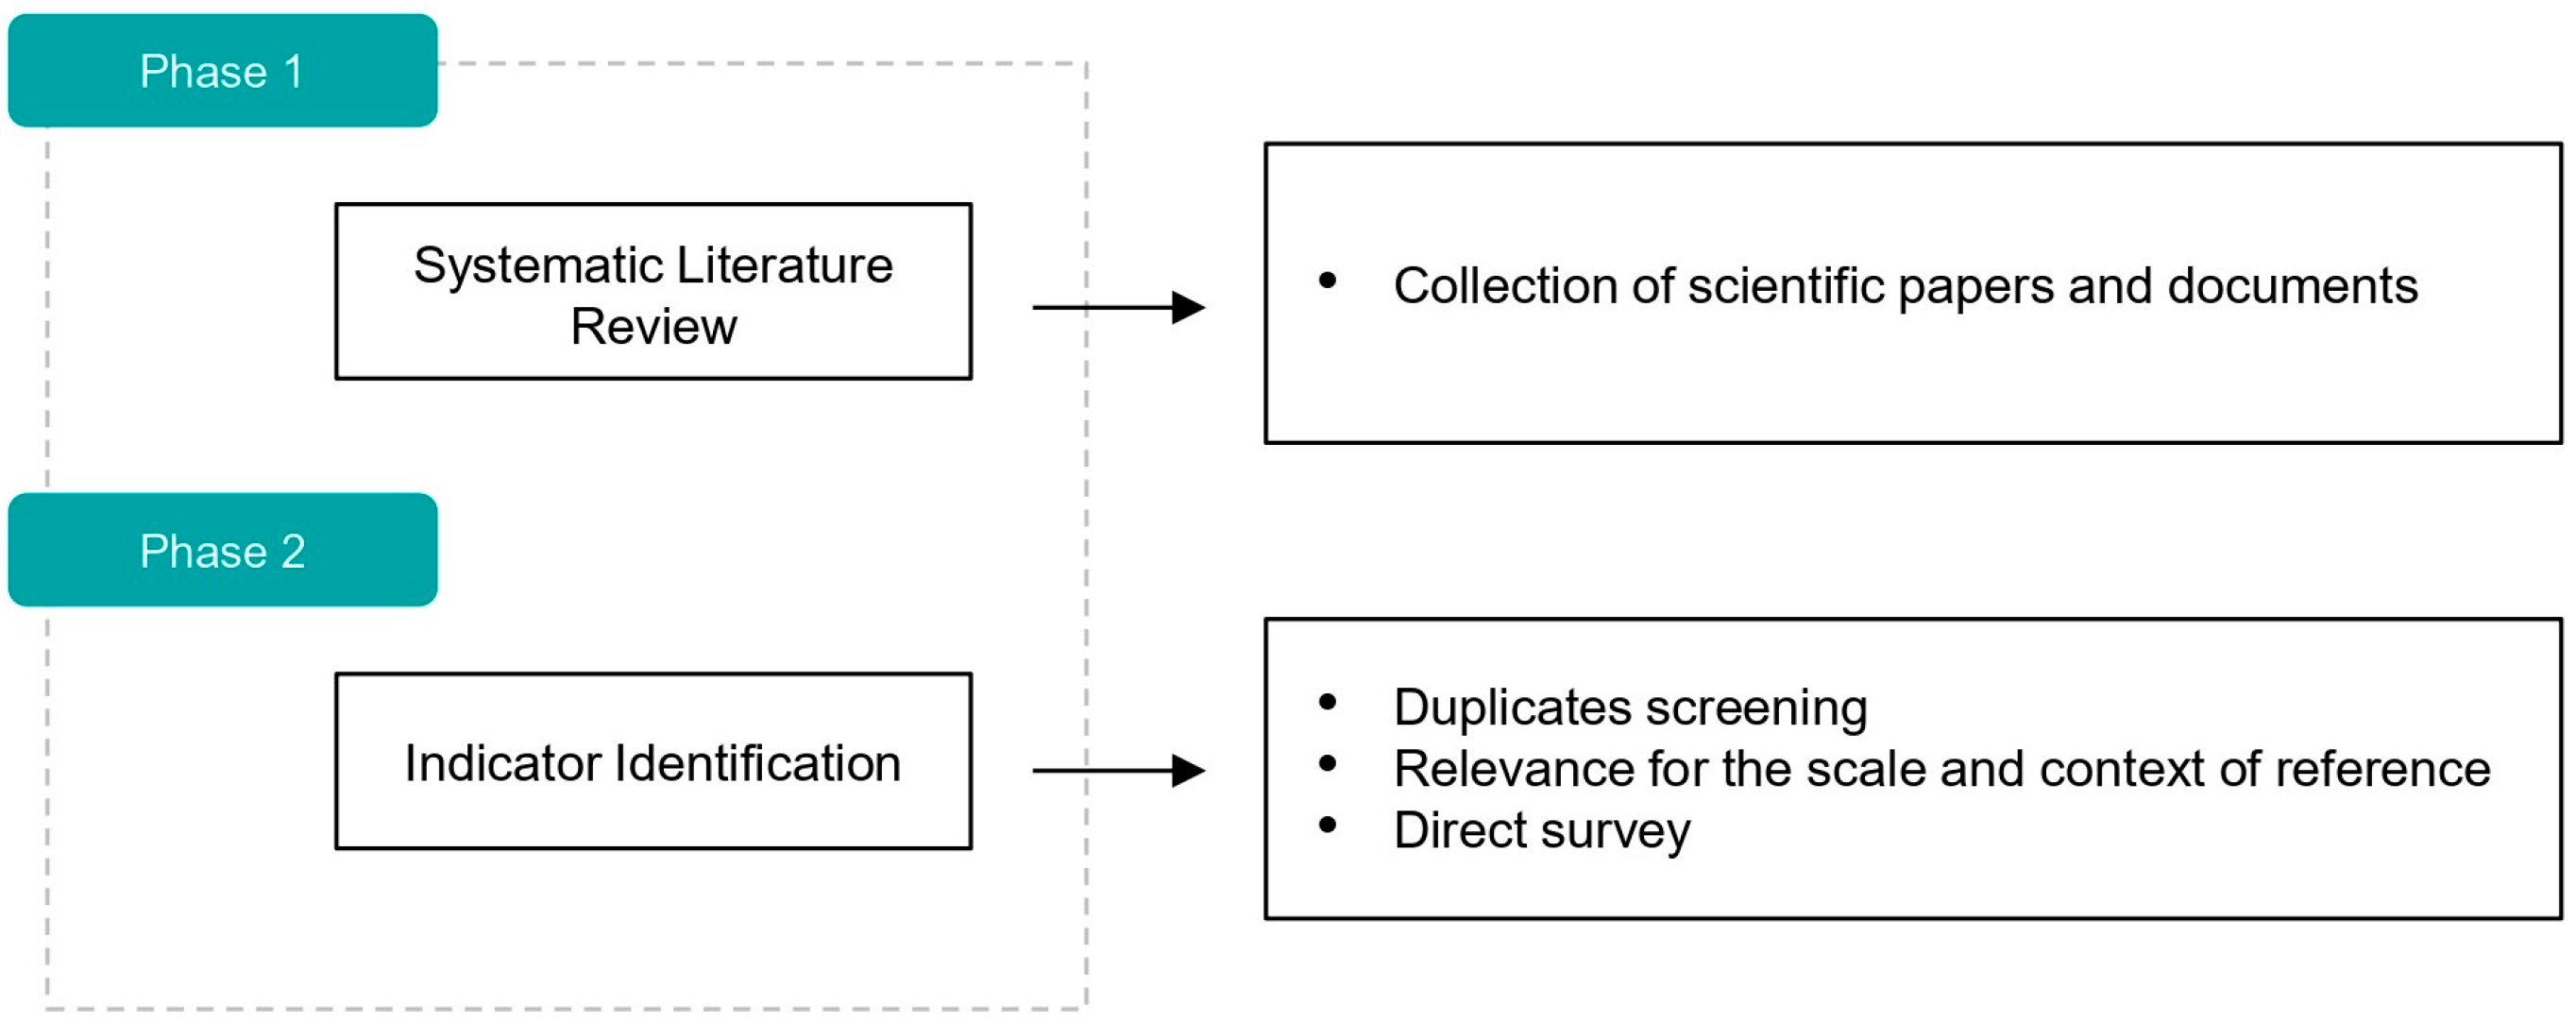
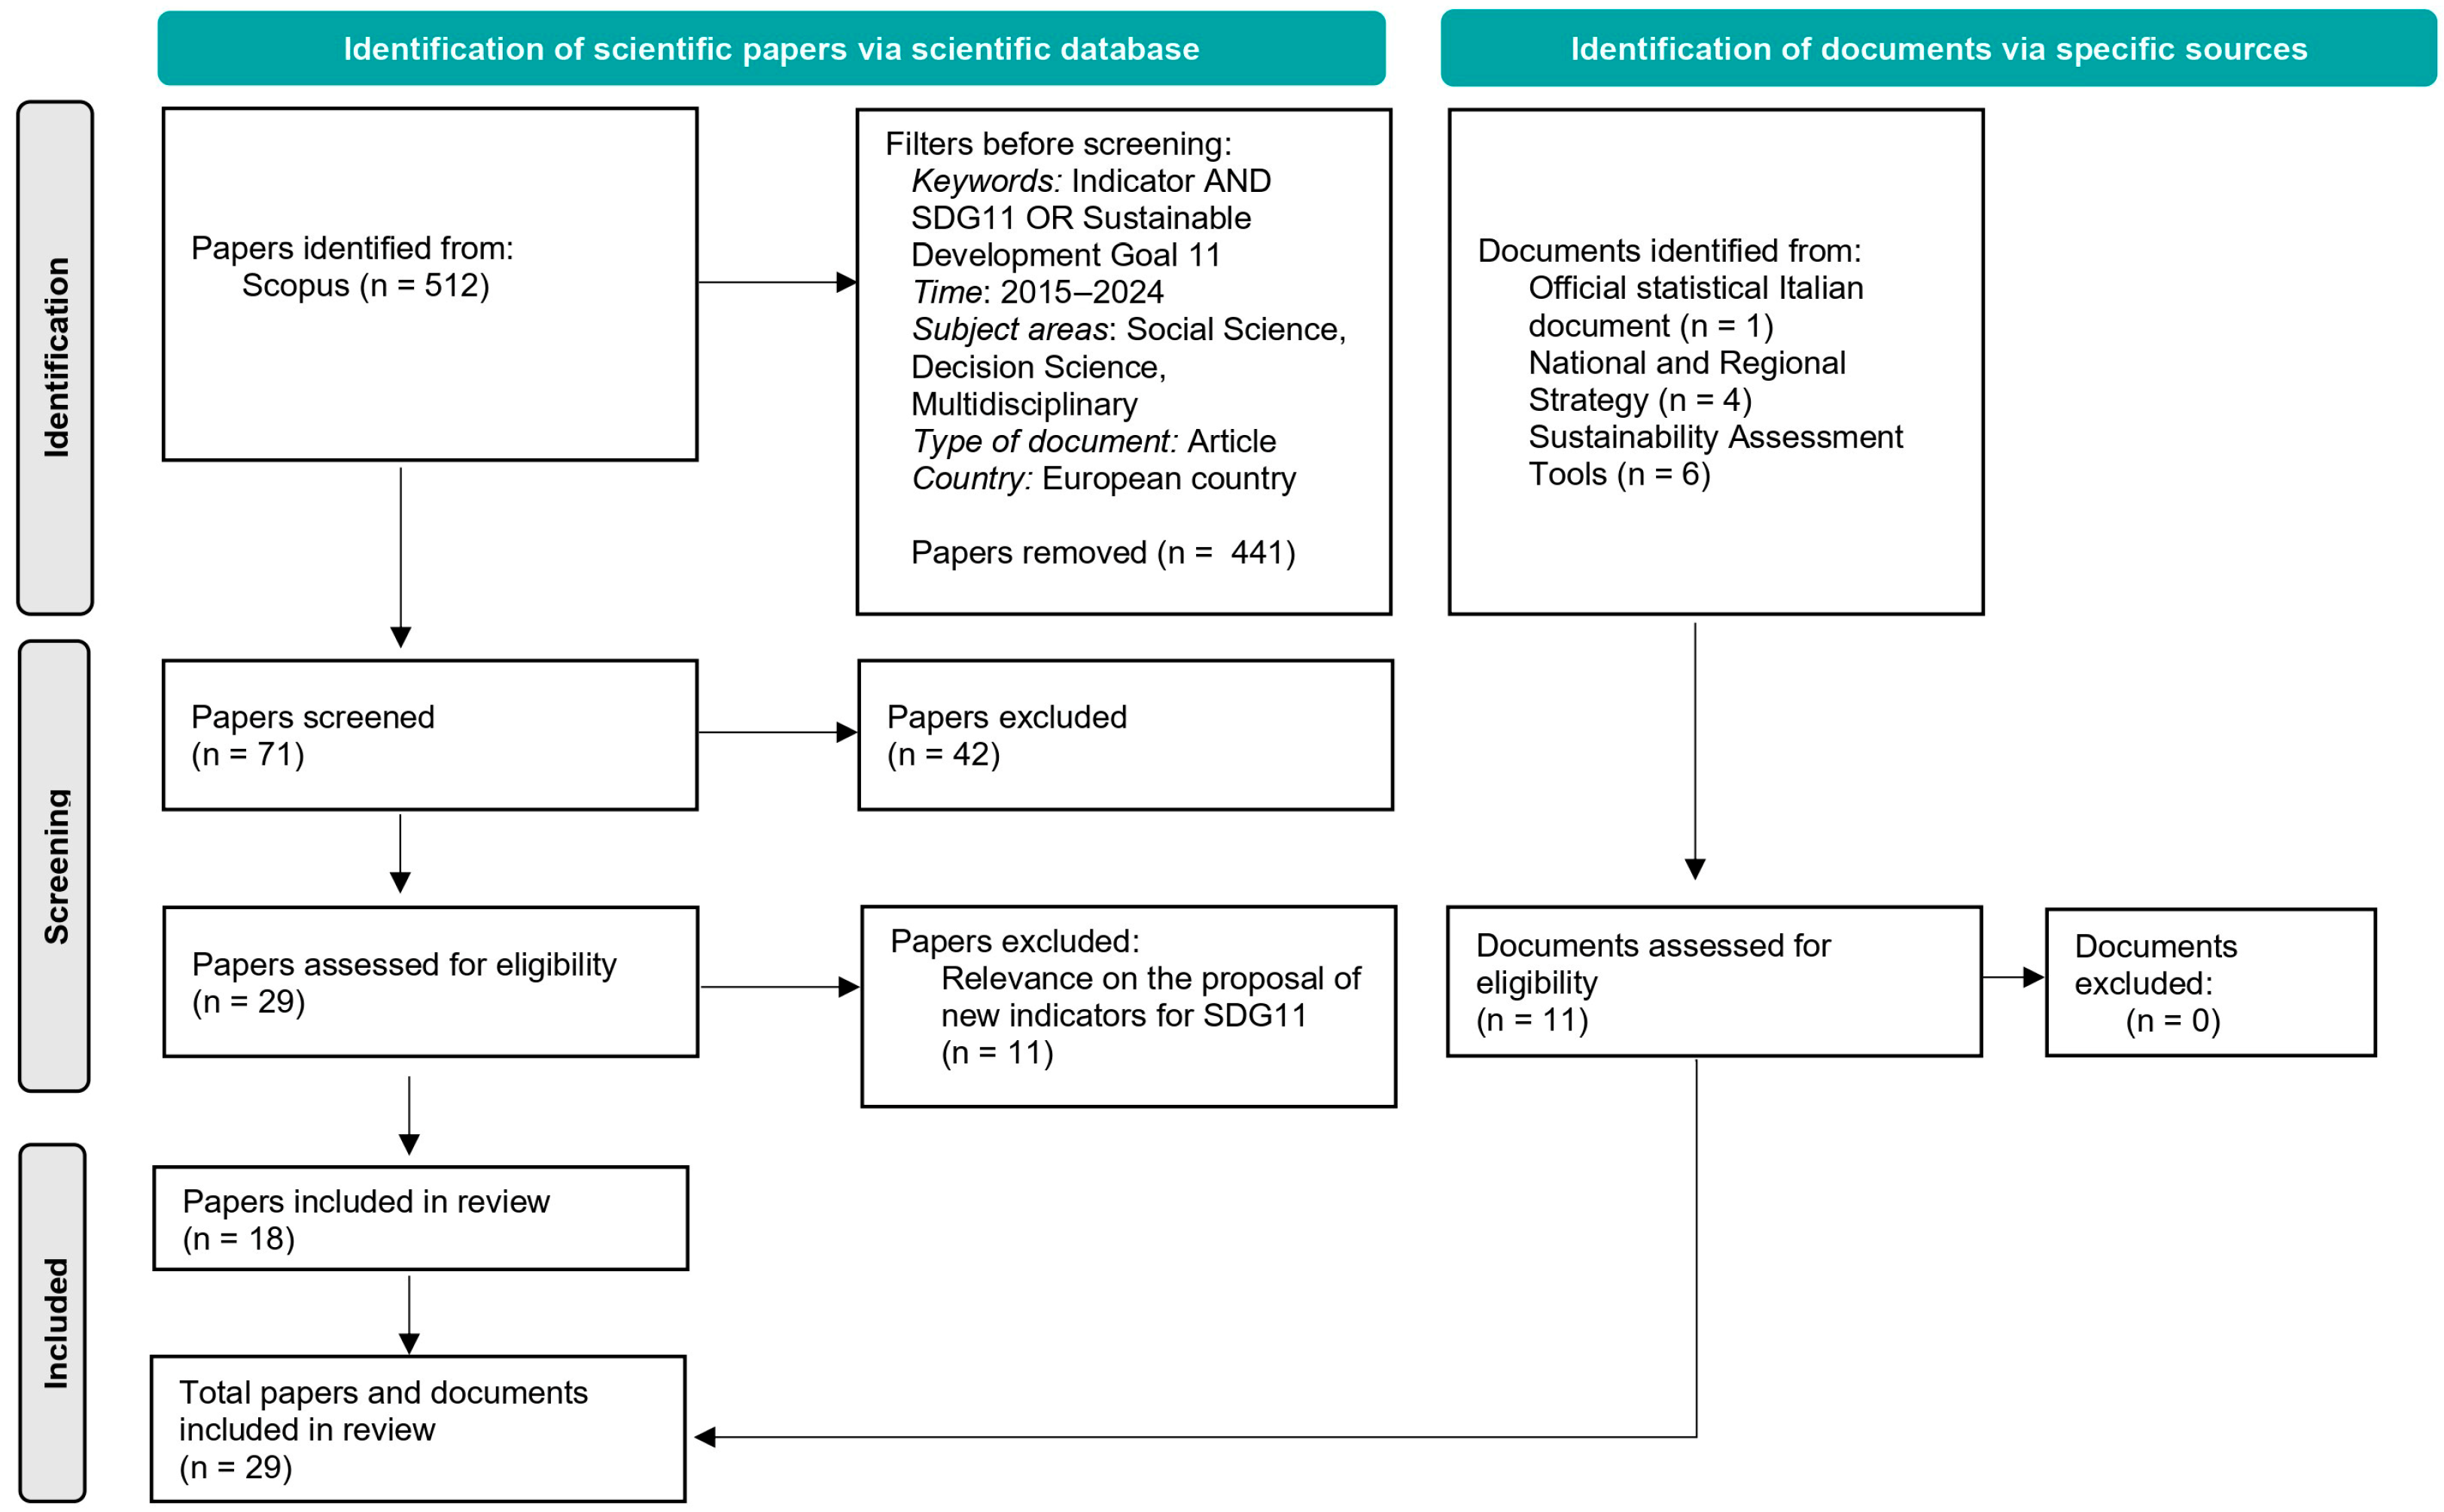
3.1. The Systematic Literature Review

The methodology used for the systematic literature review is based on the updated PRISMA [21] methodology [21,22]. Figure 2 represents the process followed for the search and selection according to the flow diagram of the PRISMA (2020). This flow diagram maps the different information related to the systematic literature review at different stages highlighting the number of papers identified, included, excluded, and analyzed [22].
The analysis involved the search of papers on the Scopus indexed database with the query string related to “Indicator”, “SDG11”, or “Sustainable Development Goal 11” in titles, abstracts, and keywords, resulting in a total of 512 papers. These were initially selected from the database by limiting the analysis to papers published from the introduction of the 2030 Agenda to the present day, covering the period of 2015–2024. The search was further restricted to documents published within the European context. Given that the GLOSSA project is an Italian national research initiative, it was deemed appropriate to consider the literature aligned with the same regulatory framework as the European Green Deal and the Urban Agenda for the EU. Moreover, limits were imposed on documents focusing on the thematic areas of social sciences, decision sciences, and multidisciplinary studies.
This resulted in a set of 71 papers, which were screened in the abstracts to exclude those unrelated to the research objective. This led to 29 papers, which were subject to a complete review, selecting only those that proposed a new indicator in relation to SDG11 (18 papers).
For the readers’ interest, Table 1 summarizes the reasons for the exclusion of papers from the final set.
In parallel, a review of the gray literature—non-traditional academic sources—was conducted. This included 11 documents produced by specific institutions: one by the Italian National Institute of Statistics (ISTAT) [16], which is responsible for monitoring sustainable development; four related to national and regional strategies for sustainable development in Italy; and six documents consisting of Sustainability Assessment Tools (SATs) applied at the scale of residential buildings and urban districts.
Concerning national and regional strategies, reference is made to SNSvS [18] and the SRSvS of the Piedmont, Campania, and Sardinia Regions [33,34,35]. This specific choice is due to the national framework of the research. Therefore, the three regions involved in the GLOSSA project were selected—one from the North (Piedmont), one from the Center-South (Campania), and one from the Islands (Sardinia) (Figure 3).
This geographical distribution aims to capture the socioeconomic, infrastructural, and environmental diversity present in Italy, thereby improving the internal generalizability of the model and the set of indicators across different national contexts.
Regarding the SATs at the scale of residential buildings and districts, we took into consideration the BREEAM [36,37] as the most widely SAT used worldwide [38,39,40] and the ITACA and GBC [41,42,43,44] as the most applied in Italy. These tools play a significant role in the study and promotion of fundamental sustainability principles, contributing to the design of building and urban interventions in line with sustainable criteria.
This collection led to a total of 29 papers and documents included in the review.

3.2. Indicator Identification

Once the articles and documents were collected, they were thoroughly analyzed to extract an initial set of indicators focused on the district and building scales aligned with the SDG11 framework. This initial set was subsequently refined using three criteria: uniqueness, relevance, and significance.
First, a screening of the indicators was conducted to eliminate duplicates and establish a unique set of indicators. Second, indicators that were not relevant to the district and building scales were removed. This lack of relevance stems from the fact that some indicators are designed for application at macro scales (national or regional) and, when transferred to micro scales, fail to provide meaningful or useful information. The selection process was therefore guided by the need to include indicators that are useful for monitoring and assessing sustainability at the micro scale, in line with the objectives of this study. Finally, a direct validation was carried out through a questionnaire—composed by scoring and open-ended questions—with three senior academic experts, in real estate appraisal, indicator-based evaluation methods, and urban planning. Each expert is affiliated with one of the three Italian regions analyzed (Piedmont, Campania, and Sardinia), which was essential to capture context-specific insights on the measurability and territorial relevance of the proposed indicators. They were asked to assess the validity, relevance, and potential calculation challenges of the indicators. All experts involved were informed of the objective to observe and evaluate the indicators in terms of their relevance and calculability with respect to the Italian context and their specific regional background.
The selected indicators were submitted to the experts, who were asked to
  • Provide an informed opinion on the relevance/importance and calculability of each individual indicator using a qualitative scale (high, medium, low, none, and unknown);
  • Share their perspective on potential issues related to data availability for measuring the indicators (e.g., incomplete data, proprietary data, unreliable data, or data absence);
  • Offer general positive or negative feedback for each indicator.
The collected data were aggregated using basic statistical synthesis procedures, with particular reference to the use of the mode as a measure of central tendency to represent the distribution of observations.

4. Results: Indicators’ Set Proposal

The collection of indicators starts with those proposed for monitoring SDG11 in the official document produced by ISTAT, the Italian National Institute of Statistics. A total of 32 indicators were gathered, corresponding to 7 out of the 10 targets [16,17,27,32]. It is worth noting that the targets 11.a, 11.b, and 11.c, were excluded based on the scope of the research, which adopts a design-oriented perspective focused on the district and building scales. These specific targets do not address design-related actions but instead emphasize broader urban issues, such as connections between urban, rural, and peri-urban areas, as well as the implementation of policies and programs for inclusion, efficiency, and climate change mitigation [16,17]. As such, they fall outside the scope of this study.
After analyzing and considering the “official” indicators, we examined those proposed in national and regional sustainable development strategies. As detailed in Section 3.1, the SNSvS [18] and the SRSvS of the regions involved in the research [33,34,35] were closely analyzed, resulting in the identification of 121 relevant indicators.
The same procedure was applied to the SATs. Specifically, the ITACA protocol [37], the GBC protocols at the district scale [42,43] and building scale [44], and the BREEAM protocols at the district scale [36] and building scale [37] were analyzed, resulting in the collection of 109 indicators.
Lastly, 18 scientific articles identified through the literature review were considered to further expand the SDG11 indicator set. From these references, 79 potentially useful indicators at the district and building scales were extracted.
This process resulted in an initial set of 341 indicators, organized into 17 thematic categories assigned to the seven SDG11 targets.
The definition of thematic categories followed an analytical process, which involved, on the one hand, observing the categories already established by the SDG11 targets and, on the other, studying each individual indicator to define new categories where necessary.
Certain SDG11 targets already provide a categorization of indicators. For example, Target 11.3 is divided into two categories: Land Consumption (11.3.1) and Participation in Urban Planning and Management (11.3.2). Other targets, such as 11.1, lack predefined categories, despite these being crucial for constructing a coherent set of indicators. For such targets, new categories were defined based on the themes addressed by the indicators themselves (Table 2).
Once the categories have been defined and the preliminary set of indicators collected, we moved to the filtering processes. The first filtering step involved a duplicates screening to eliminate duplicates and obtain a unique set of indicators. This step led to reducing the set to 244 indicators. Table 3 shows the distribution of the set of indicators, before and after the duplicates screening step, with respect to the SDG11 categories and targets.
As can be seen from Table 3, the duplicates screening allowed us to observe that the least widespread indicators supporting sustainable development refer to targets 11.3, 11.4, 11.5, and 11.7, which are also those targets against which fewer indicators are available. It is also worth noting that most of the indicators removed during the duplicates screening process correspond to those officially proposed by ISTAT. This suggests that, despite the availability of a broad range of potentially useful tools and references, the use of indicators remains largely confined to official systems. As a result, there is limited exploration and shared adoption of alternative indicators which struggle to be integrated into decision-making and evaluation processes outside consolidated regulatory frameworks.
Once a set of 244 unique indicators was established, it was further analyzed by the GLOSSA research team for multiple purposes.
First, this analysis allowed for the refinement of the set by excluding indicators that were not relevant to the research objectives or were overly complex in terms of calculation methods. For some indicators, the literature failed to provide specific information regarding their definition, unit of measurement, or method of assessment, rendering them operationally unusable. Such indicators were either removed or replaced with proxy indicators. For example, the indicator “Global Non-Renewable Primary Energy” [41], calculated by the ITACA Protocol as the “Percentage reduction of the non-renewable energy performance index”, was excluded. While this measure is highly sophisticated, it adopts a performance-based perspective rather than a prescriptive one and does not specify which sustainable and renewable technologies should be adopted in a project. This indicator was replaced by the “Energy Sustainability” indicator [45], derived from the National Innovative Program for Housing Quality. This proxy indicator is quantified on a qualitative scale from 0 to 5, assessing the number of renewable energy systems employed (none, +1 solar, +1 wind, +1 hydroelectric, +1 geothermal, and +1 biomass) therefore making this indicator most operative in a prescriptive perspective.
This process resulted in a final set of 57 indicators organized into 13 thematic categories. The removal of some indicators also led to the elimination of some categories: expenditures on cultural goods or services (Target 11.4), deaths or injuries due to natural or road disasters (Target 11.5), emissions (Target 11.6), and assaults and harassment (Target 11.7).
Furthermore, this additional analysis enabled the classification of the 57 indicators based on their spatial scale and their relevance to specific stages of evaluation (ex ante, in itinere, and ex post), aligning with the policy-making cycle [2,20].
The indicators were categorized as applicable either to the district scale or the building scale and classified according to their utility in the following phases:
  • Monitoring urban sustainability levels: Indicators useful for prioritizing intervention areas based on emerging issues (ex ante stage of evaluation—phase (i) of the policy-making cycle) or challenges and for observing and quantifying changes resulting from the implementation of specific urban and architectural projects (ex post stage of evaluation—phase (iv) of the policy-making cycle). For instance, if the “Outdoor Commons Space” indicator were to reveal, during the ex ante evaluation phase, a shortage of such spaces in a specific area, this would highlight the need for localized and targeted interventions to address the deficiency. Once this issue is acknowledged and incorporated into the project planning phase, subsequent ex post monitoring could, in the best-case scenario, demonstrate an improvement—thus validating the effectiveness of the implemented actions. Conversely, the monitoring may reveal either the deterioration or the persistence of the issue, indicating the need for further intervention or a reassessment of the strategies applied.
  • Evaluating project sustainability: Indicators applicable to both district and building scales to assess the sustainability of projects before their implementation within the urban context (in itinere stage of evaluation—phase (ii) of the policy-making cycle). For example, if the “Outdoor Commons Spaces” indicator revealed low performance for the project(s) in this aspect, it would suggest that, prior to implementation, the project should be revised to better ensure social sustainability. Conversely, if the indicator showed good performance for the project(s) under analysis, it would indicate that adequate and satisfactory measures have been planned in terms of the provision of outdoor common spaces.
Figure 4 reports the classification of the 57 indicators.
The final validation of the indicator set was conducted with experts in urban and architectural evaluation to assess the validity, relevance, and potential calculation challenges of the indicators.
All experts considered the 57 indicators in the set to be valid, although with different levels of relevance and calculability:
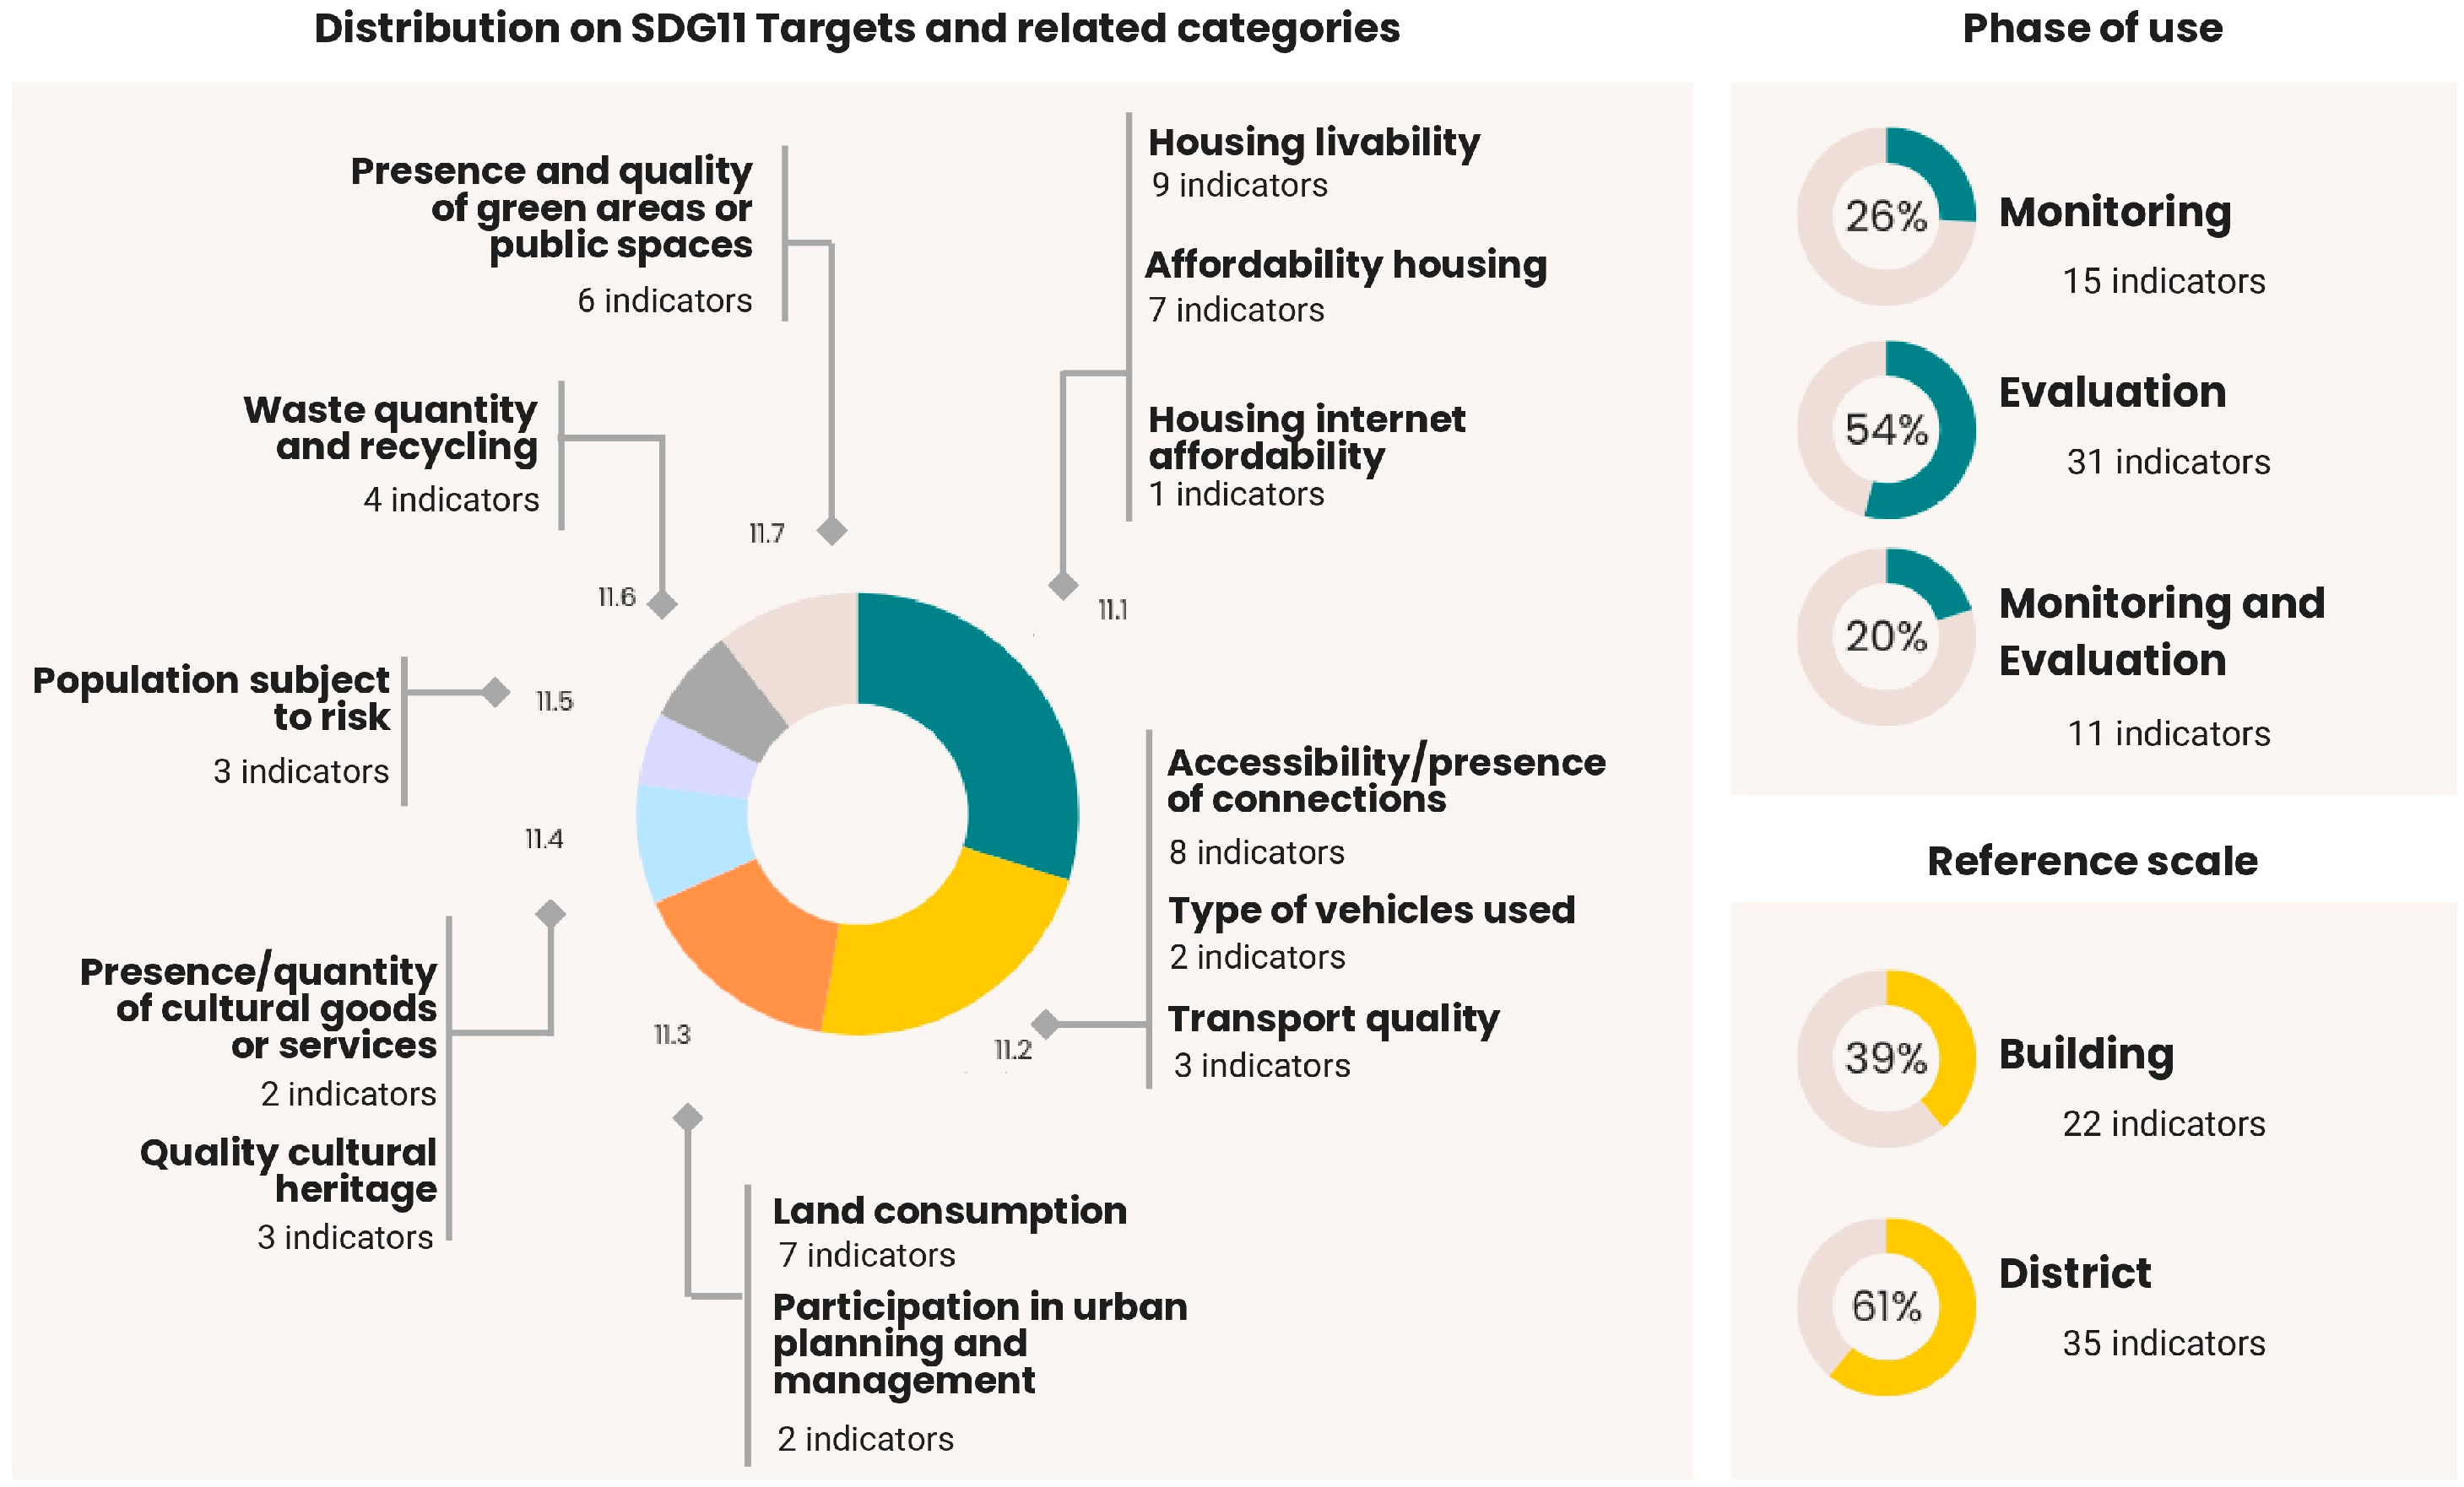
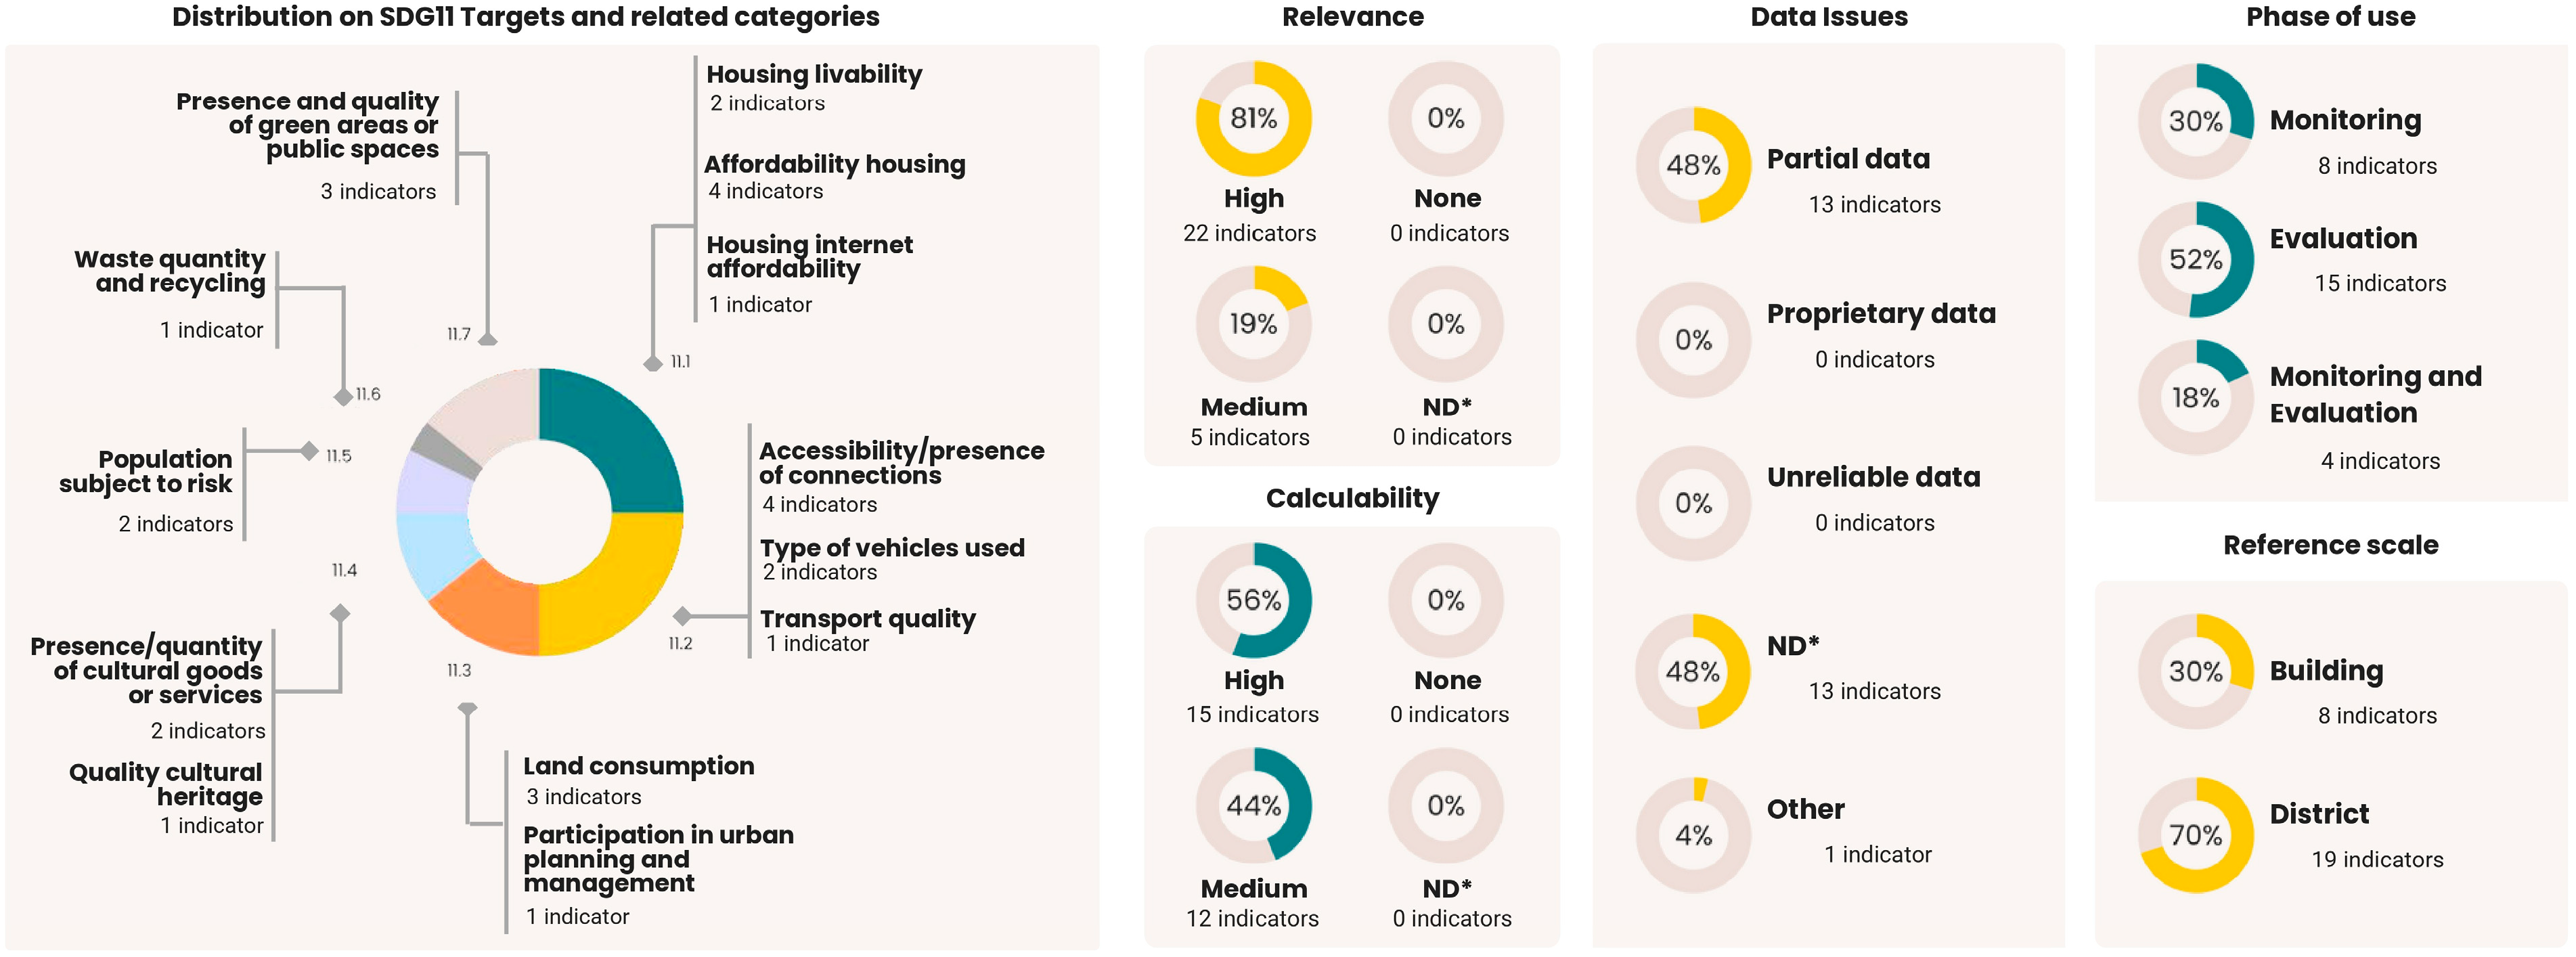
  • 15 indicators were regarded as highly relevant and easily calculable;
  • 15 indicators were considered as highly relevant but with average calculability;
  • 4 indicators were considered as moderately relevant but easily calculable;
  • 14 indicators were considered as moderately relevant and with average calculability;
  • 9 indicators were finally considered as not relevant and/or difficult to calculate.
The final set was identified by first selecting highly relevant indicators with high calculability (15 indicators). Once selected, their distribution over the 13 categories was observed. The intention was to construct a set that included a complete package of indicators for each category, i.e., at least one indicator for both monitoring and evaluation and at both the building and district scale on both phases (monitoring and evaluation). However, as this assumption was not fulfilled, indicators assessed by the experts as “highly relevant and moderately calculable” were selected and included for the empty categories. For example, the category “Housing livability” had only one monitoring indicator on the district scale that was extremely relevant and calculable, while a monitoring indicator on the building scale and evaluation indicators on both scales was missing. In this case, an evaluation indicator at the building scale was added, indicated by the experts as “highly relevant and moderately calculable”. However, the other indicator types necessary to have a complete package for the category were not included as they were not present in the initial set (57 indicators). The same procedure was followed for all categories. Therefore, we emphasize that despite the assumptions outlined above, it was not possible to propose a set of indicators that contained for each of the 13 categories at least one indicator for monitoring and evaluation at both the building and district level, as the analysis is based on the availability of the indicators collected in the preliminary set derived from the literature review.
This procedure led to a final set of 27 indicators distributed in 13 thematic categories (Figure 5).
The validation process with experts highlighted the fragmentation of the indicator set, with a high general relevance but numerous critical issues related to data availability and quality. As shown in Figure 5, firstly, a significant portion of the indicators (13) present issues related to the partiality or absence of available data. Secondly, only 18% of the indicators (5) are suitable for both the monitoring and evaluation phases. Lastly, the reference scale for the majority of the indicators (70%) is at the district level. The focus on the district scale is consistent with the objective of providing broader measurements, leaving the building scale to specific existing instruments.
Table 4 shows the entire set of 27 indicators with their respective specifications (Further information is available in the Supplementary Materials, Table S1).
From Table 4, the proposed set of indicators covers 7 of the 10 SDG11 targets and is divided into 13 categories. These broaden the themes covered by the SDG11 targets, for example:
  • Open outdoor spaces for interaction, housing cost overruns, energy efficiency and accessibility, for Target 11.1;
  • Availability of bicycle lanes, pedestrian distances from transformation sites to public transport stations, maximum availability of parking and interchange spaces, for Target 11.2;
  • Unused buildings and areas to be reclaimed, for Target 11.3;
  • The quantification of the available cultural heritage and the inclusive accessibility of school buildings, for Target 11.4;
  • Finally, the distribution of green spaces in the city for Target 11.7.

5. Discussions and Conclusions

This research contributes to the debate on the relationship between sustainability and the policy-making cycle, with the aim of supporting effective indicator-based governance and filling an operational gap that exists in the SDG11 indicators. Indeed, the policy-making cycle comprises four distinct phases [2,20]: (i) problem identification and framing, (ii) formulation and development of alternatives, (iii) implementation of actions, and (iv) monitoring, evaluation, and reporting. However, SDG11 indicators are insufficient for stages (ii) and (iii), due to their strategic, non-operational nature.
This research proposes an empirical framework that applies an inductive systematic review of the literature based on PRISMA [21,22] and validated through a deductive analysis based on direct surveys to propose a robust set of indicators capable of evaluating projects at the district or building level.
The literature review involved multiple academic and institutional levels, combining indicators from official statistical monitoring frameworks and SATs making the approach proposed robust and valid. The preliminary collection revealed that the currently least explored indicators for sustainable urban development concern targets 11.3, 11.4, 11.5, and 11.7, while the most used indicators come from national sources (ISTAT), although they are based on European and global frameworks. This confirms the basic hypothesis of the research on the still limited use of the indicator outside the statistical framework and national and supranational strategies.
Starting from an initial set of 341 indicators identified through a systematic review of the scientific and technical literature, the selection process was further refined through deductive analysis. This refinement considered the spatial relevance of the indicators in relation to the district and building scales and was complemented by direct consultations with experts. As a result, a final set of 27 indicators was selected, encompassing both qualitative and quantitative measures.
The resulting set is aligned with the goals of SDG 11, but it is distinguished by the inclusion of indicators derived from non-institutional sources, thereby broadening the perspective offered by official frameworks. This integration allows for the consideration of contextual dimensions of urban sustainability that are often overlooked in standardized metrics.
The added value of this research lies not only in the careful selection of indicators but also in their strategic positioning within the urban policy-making cycle. The proposed set serves as an operational tool capable of supporting the various stages of the policy-making cycle, offering analytical and informational support to analysts and/or public decision-makers at both the building and district scales.
It is important to note that, among the 57 indicators considered, none were deemed irrelevant by the experts; rather, the primary reason for exclusion from the set was related to issues of calculability or data availability. A notable example is the “Availability Index of Outdoor Spaces within the Dwelling” indicator, which, despite its high informational value, proved difficult to calculate due to the lack of specific and detailed data on individual dwellings. Nonetheless, this study acknowledges certain limitations. First, the use of specific filters in the literature review and a strong focus on European and national SATs may have led to the exclusion a priori of some useful indicators. Second, the direct surveys and consultations with experts were limited to the knowledge of three regions involved in the GLOSSA national research project (Piedmont, Campania, and Sardinia) in which the research conveyed here is embedded. The proposed set of 27 indicators is therefore specific to the contexts of these regions, emphasizing validity, relevance, and calculability. Third, the paper presented does not go into the merits of the units of measurement used to calculate the indicators making up the final set. Some indicators derived from SATs envisage calculation methodologies based on “scenarios” that vary according to the project and involve several measurement phases and may not be relevant for some contexts. Fourth, some indicators identified in the literature were excluded from the final set during the initial screening phase, as no specific information was provided regarding their definition, unit of measurement, or assessment method. This led to the removal of certain categories—such as “Expenditure on cultural goods or services”, “Deaths or injuries from disasters”, and “Emissions”—which remain highly relevant to urban sustainability. Nonetheless, the set of indicators collected and proposed in this study is based on existing sources and was developed following a defined methodological framework. We believe that this limitation highlights a promising direction for future research aimed at constructing new indicators to address current gaps in the measurement of sustainability at both the district and building scales.
Future research therefore envisages resolving the current limitations of the work by applying the multi-methodological framework to a larger number of supra-national SATs to potentially include new indicators, if relevant. It will also be necessary to validate the set of indicators with the PAs of the three regions involved so far and then continue with the generalization to the national level through further studies and expert consultations. It is also planned to consider in detail all the calculation methods of each individual indicator component of the set to understand whether these methods are really useful and applicable. Finally, integration into an open-source tool and testing on three different case studies, relating to the three different phases of the political decision-making cycle, is planned and underway in order to verify the operational behavior of the set of indicators. In this forthcoming testing phase using the open-source tool, it will also be possible to reflect on the weighting and relevance of the indicators in relation to the specific characteristics of the case under analysis.
Despite the limitations, the relevance of the proposed approach goes beyond the scope of the paper. Indeed, the framework is replicable and implementable in multiple directions. Firstly, the identified set of indicators can be applied to the evaluation of projects located in different national realities as it considers numerous aspects of sustainability in support of the policy-making cycle. It does not replace the official SDG11 indicator framework, but rather complements it, serving as a foundation that can be further developed and expanded. Secondly, the methodological approach combines inductive and deductive methodologies that can be easily replicated. Therefore, although the results are specific to Italy, we believe that the methodological approach and the operationalization process can offer valuable insights for similar exercises in other countries. In this sense, the proposed empirical framework can be applied to multiple, extended, or different sets of indicators, making the approach flexible to different needs. Lastly, although in this study the empirical framework is proposed at the district and building scale, this can be implemented by broadening the perspective to broader scales (such as city or province) on the one hand and to more local scales on the other. This is crucial to consider the value system of local stakeholders and to keep the set of indicators operational.

Supplementary Materials

The following supporting information can be downloaded at: https://www.mdpi.com/article/10.3390/su17146305/s1, Table S1: Final set of indicator.

Author Contributions

Conceptualization, F.A.; methodology, F.A. and B.M.; validation, F.A. and B.M.; investigation, F.A. and B.M.; resources, F.A. and B.M.; data curation, B.M.; writing—original draft preparation, B.M.; writing—review and editing, F.A. and B.M.; visualization, F.A. and B.M.; funding acquisition, F.A. All authors have read and agreed to the published version of the manuscript.

Funding

This research was funded by Ministero dell’Istruzione e del Merito (MIUR), grant number 2022JPWKCS.

Institutional Review Board Statement

Not applicable.

Informed Consent Statement

Not applicable.

Data Availability Statement

The original contributions presented in this study are included in the article. Further inquiries can be directed to the corresponding author.

Conflicts of Interest

The authors declare no conflicts of interest.

References

  1. Asian Development Bank and the United Nations Environment Programme (ADB and UN Environment Programme). Strengthening the Environmental Dimensions of the Sustainable Development Goals in Asia and the Pacific. Tool Compendium. 2019. Available online: https://www.adb.org/publications/environmental-dimensions-sdgs-tool-compendium (accessed on 19 July 2021).
  2. Mecca, B.; Gaballo, M.; Todella, E. Measuring and evaluating urban sustainability. Valori Valutazioni 2023, 32, 17–29. [Google Scholar]
  3. OECD. Implementing the OECD Recommendation on Policy Coherence for Sustainable Development: Guidance Note. 2021. Available online: https://alnap.org/documents/19459/pcsd-guidance-note-publication.pdf (accessed on 14 February 2022).
  4. OECD. Evaluation in Development Agencies. Better Aid. 2010. Available online: https://www.oecd.org/content/dam/oecd/en/publications/reports/2010/12/evaluation-in-development-agencies_g1g1199c/9789264094857-en.pdf (accessed on 15 November 2024).
  5. Thomas, V.; Chindarkar, N. Economic Evaluation of Sustainable Development. 2019. Available online: https://library.oapen.org/bitstream/id/2e243f93-6068-4ae0-b74e-93bf2497bdce/1006970.pdf (accessed on 14 February 2022).
  6. Baffo, I.; Leonardi, M.; Bossone, B.; Camarda, M.E.; D’Alberti, V.; Travaglioni, M. A decision support system for measuring and evaluating solutions for sustainable development. Sustain. Futures 2023, 5, 100109. [Google Scholar]
  7. World Bank. Innovation Policy Learning from Korea: The Case of Monitoring and Evaluation (M&E). 2024. Available online: https://documents1.worldbank.org/curated/en/099435005132470189/pdf/IDU108b015321579b14079183af1de18cf7459ba.pdf (accessed on 12 December 2024).
  8. Poveda, C.A.; Lipsett, M.G. A Review of Sustainability Assessment and Sustainability/Environmental Rating Systems and Credit Weighting Tools. J. Sustain. Dev. 2011, 4, 36–55. [Google Scholar]
  9. Bond, A.; Morrison-Saunders, A.; Pope, J. Sustainability assessment: The state of the art. Impact Assess. Proj. Apprais. 2012, 30, 53–62. [Google Scholar]
  10. Cohen, M. A Systematic Review of Urban Sustainability Assessment Literature. Sustainability 2017, 9, 2048. [Google Scholar] [CrossRef]
  11. Morano, P.; Tajani, F.; Di Liddo, F.; La Spina, I. The Evaluation in the Urban Projects Planning: A Logical-Deductive Model for the Definition of “Warning Areas” in the Esquilino District in the City of Rome (Italy). Smart Cities 2023, 6, 469–490. [Google Scholar]
  12. Boggia, A.; Cortina, C. Measuring sustainable development using a multi-criteria model: A case study. J. Environ. Manag. 2010, 91, 2301–2306. [Google Scholar]
  13. Hiremath, R.B.; Balachandra, P.; Kumar, B.; Bansode, S.S.; Murali, J. Indicator-based urban sustainability, A review. Energy Sustain. Dev. 2013, 17, 555–563. [Google Scholar]
  14. Kim, R.E. The Nexus between International Law and the Sustainable Development Goals. Rev. Eur. Comp. Int. Environ. Law 2016, 25, 15–26. [Google Scholar] [CrossRef]
  15. United Nations. General Assembly Global Indicator Framework for the Sustainable Development Goals and Targets of the 2030 Agenda for Sustainable Development. 2024. Available online: https://unstats.un.org/sdgs/indicators/Global-Indicator-Framework-after-2024-refinement-English.pdf (accessed on 12 December 2024).
  16. ISTAT. Rapporto SDGs Informazioni Statistiche per l’Agenda 2030 in Italia. 2024. Available online: https://www.istat.it/storage/rapporti-tematici/sdgs/2024/Rapporto-SDGs2024-Ebook.pdf (accessed on 6 December 2024).
  17. ISTAT. Metadata. 2024. Available online: https://www.istat.it/statistiche-per-temi/focus/benessere-e-sostenibilita/obiettivi-di-sviluppo-sostenibile/gli-indicatori-istat/ (accessed on 11 November 2024).
  18. Ministero Dell’Ambiente e della Tutela del Territorio e del Mare (MATTM). Strategia Nazionale per Lo Sviluppo Sostenibile. 2022. Available online: https://www.mase.gov.it/portale/documents/d/guest/snsvs_2022-pdf (accessed on 19 July 2021).
  19. European Commission. Circular Economy. Principles for Buildings Design. 2020. Available online: https://ec.europa.eu/docsroom/documents/39984 (accessed on 14 February 2022).
  20. Jann, W.; Wegrich, K. Theories of the Policy Cycle. In Handbook of Public Policy Analysis: Theory, Politics, and Methods, 1st ed.; Fischer, F., Miller, G.J., Eds.; Routledge: London, UK, 2007. [Google Scholar]
  21. PRISMA. 2020. Available online: https://www.prisma-statement.org/prisma-2020 (accessed on 15 November 2024).
  22. Page, M.J.; Moher, D.; Bossuyt, P.M.; Boutron, I.; Hoffmann, T.C.; Mulrow, C.D.; Shamseer, L.; Tetzlaff, J.M.; Akl, E.A.; Brennan, S.E.; et al. PRISMA 2020 explanation and elaboration: Updated guidance and exemplars for reporting systematic review. BMJ 2021, 372, 160. [Google Scholar]
  23. Dente, B.; Vecchi, G. La valutazione e il controllo strategico. In Valutare per Governare. Il Nuovo Sistema dei Controlli Nelle Pubbliche Amministrazioni; Azzone, G., Dente, B., Eds.; Etas: Milano, Italy, 1999. [Google Scholar]
  24. OECD. Core Set of Indicators of Environmental Performance Reviews, Environment Monographs N° 83, Parigi (OECD/GD (93)179). 1993. Available online: https://one.oecd.org/document/OCDE/GD(93)179/en/pdf (accessed on 19 July 2021).
  25. United Nations. New Urban Agenda. 2017. Available online: https://habitat3.org/wp-content/uploads/NUA-English.pdf (accessed on 6 December 2024).
  26. European Commission. Urban Agenda for the EU Multi-Level Governance in Action. 2019. Available online: https://ec.europa.eu/regional_policy/sources/brochure/urban_agenda_eu_en.pdf (accessed on 6 December 2024).
  27. Lami, I.M.; Abastante, F.; Gaballo, M.; Mecca, B.; Todella, E. Fostering sustainable cities through additional SDG11-related indicators. Valori Valutazioni 2023, 32, 45–61. [Google Scholar]
  28. Bossel, H. Indicators for Sustainable Development: Theory, Method, Applications; International Institute for Sustainable Development: Winnipeg, MB, Canada, 1999. [Google Scholar]
  29. Marchi, G.; Lenti, L. La Valutazione Nei Processi di Piano.Strumenti di Trasformazione Urbana; Angeli: Milano, Italy, 2003. [Google Scholar]
  30. Batty, M. Cities and complex systems: Scaling, interaction, networks, dynamics and urban morphologies. In Encyclopedia of Complexity and Systems Science; Meyers, R., Ed.; Springer: New York, NY, USA, 2009. [Google Scholar]
  31. Okraszewska, R.; Jamroz, K.; Michalski, L.; Żukowska, J.; Grzelec, K.; Birr, K. Analysing Ways to Achieve a New Urban Agenda-Based Sustainable Metropolitan Transport. Sustainability 2019, 11, 813. [Google Scholar] [CrossRef]
  32. Lami, I.M.; Abastante, F.; Mecca, B.; Todella, E. Maps and SDG11: A complex but possible relationship. Int. J. Sustain. Dev. Plan. 2024, 19, 1217–1237. [Google Scholar]
  33. Regione Piemonte Strategia per lo Sviluppo Sostenibile del Piemonte. 2022. Available online: https://www.regione.piemonte.it/web/sites/default/files/media/documenti/2022-07/srsvs_luglio_2022.pdf (accessed on 14 November 2024).
  34. Regione Campania Campania Sostenibile. Strategia Regionale per lo Sviluppo Sostenibile. 2023. Available online: https://europa.regione.campania.it/wp-content/uploads/2023/06/CAMPANIA-SOSTENIBILE_21-27_SRSvS_DEFF.pdf (accessed on 14 November 2024).
  35. Regione Sardegna Sardegna 2030. La Strategia della Regione Sardegna per lo Sviluppo Sostenibile. 2021. Available online: https://www.cittametropolitana.bo.it/agenda_sviluppo_sostenibile/Engine/RAServeFile.php/f/Sardegna_Strategia_Regionale_Sviluppo_Sostenibile_2021.pdf (accessed on 15 November 2024).
  36. Building Research Establishment Environmental Assessment Method (BREEAM). BREEAM Communities. Technical Manual. 2012. Available online: https://breeam.com/standards/technical-manuals-form (accessed on 13 November 2024).
  37. Building Research Establishment Environmental Assessment Method (BREEAM). BREEAM International New Construction. 2021. Available online: https://breeam.com/standards/technical-manuals-form (accessed on 13 November 2024).
  38. Abastante, F.; Gaballo, M.; Mecca, B. Adaptive Reuse and Sustainability Protocols in Italy: Relationship with Circular Economy. Sustainability 2021, 13, 8077. [Google Scholar] [CrossRef]
  39. Abastante, F.; Lami, I.M.; Gaballo, M. Pursuing the SDG11 targets: The role of the sustainability protocols. Sustainability 2021, 13, 3858. [Google Scholar] [CrossRef]
  40. Penza, M.; Abastante, F. ITACA Plus: A New Methodology to Support Urban Design. In INTERNATIONAL SYMPOSIUM: New Metropolitan Perspectives; Springer Nature: Cham, Switzerland, 2024; pp. 17–28. [Google Scholar]
  41. Istituto per l’innovazione e Trasparenza Degli Appalti e la Compatibilità Ambientale (ITACA). Sostenibilità Ambientale Nelle Costruzioni-Strumenti Operativi per la Valutazione della Sostenibilità-Edifici Residenziali. 2019. Available online: http://www.registroprotocolloitaca.org/protocollo.asp (accessed on 15 November 2024).
  42. Green Building Council. Manuale GBC QUARTIERI. Per Progettare, Realizzare E Riqualificare Aree e Quartieri Sostenibili. 2015. Available online: https://gbcitalia.org/gbc-quartieri/gbc-quartieri-documenti/ (accessed on 15 November 2024).
  43. Green Building Council. GBC Condomini. Riqualificazione, Conduzione e Manutenzione delle Residenze Condominiali Esistenti. 2022. Available online: https://gbcitalia.org/gbc-condomini/gbc-condomini-documenti/ (accessed on 15 November 2024).
  44. Green Building Council. Manuale GBC HOME. Progettare, Costruire e Ristrutturare Edifici Residenziali. 2022. Available online: https://gbcitalia.org/certificazione/gbc-home/gbc-home-documenti/ (accessed on 15 November 2024).
  45. Brisku, C.; Capone, G.; Ciferri, D.; De Leo, V.; Liccardi, S. PINQUA. Programma Innovativo Nazionale per la Qualità Dell’Abitare. Progetti e Prime Evidenze. 2022. Available online: https://www.mit.gov.it/nfsmitgov/files/media/notizia/2022-06/Report%20PINQuA.pdf (accessed on 15 November 2024).
  46. Regione Piemonte Piano Paesaggistico Regionale (PPR). 2021. Available online: https://www.regione.piemonte.it/web/temi/ambiente-territorio/paesaggio/piano-paesaggistico-regionale-ppr# (accessed on 11 November 2024).
  47. Ministero Dell’istruzione e del Merito Catalogo Dataset Edilizia Scolastica. 2021. Available online: https://dati.istruzione.it/opendata/opendata/catalogo/elements1/leaf/?datasetId=DS0156EDISUPBARARCSTA2021 (accessed on 12 November 2024).
  48. Martínez Chao, T.E. Analysis and representation of accessibility parameters of urban open spaces. Sustain. Mediterr. Constr. 2022, 14, 222–226. [Google Scholar]
  49. Battisti, F. SDGs and ESG Criteria in Housing: Defining Local Evaluation Criteria and Indicators for Verifying Project Sustainability Using Florence Metropolitan Area as a Case Study. Sustainability 2023, 15, 9372. [Google Scholar] [CrossRef]
Figure 1. Research design.
Sustainability 17 06305 g001
Figure 2. Flow diagram of the literature selection and data extraction.
Sustainability 17 06305 g002
Figure 3. Three regions selected and involved in the GLOSSA project.
Sustainability 17 06305 g003
Figure 4. Characteristics of the 57 indicators’ set.
Sustainability 17 06305 g004
Figure 5. Characteristics of the set of 27 indicators.
Sustainability 17 06305 g005
Table 1. Motivation of exclusion of papers from the final set.
PhaseMotivation of ExclusionNo. of Papers Excluded
Identification
-
Papers outside the selected timeframe; therefore, the ones before the introduction of the Agenda 2030 and SDGs;
-
Papers with a geographical scope outside the European context, which was a central criterion for relevance to our framework;
-
Papers not relevant to social, decision-making, or multidisciplinary studies.
441
Screening
-
Papers dealing with indicators treated simply as numerical metrics, without a conceptual or analytical role in relation to sustainability paradigms or urban and architectural design;
-
Papers dealing with site-specific applications of indicator sets, lacking a theoretical or generalizable framework;
-
Papers lacking methodological justifications or explanations for the selection of indicators or the use of data;
-
Papers not focused on urban planning, with indicators applied in unrelated fields.
42
Assessment for eligibility
-
Papers proposing indicators not explicitly linked to the SDGs, which was a fundamental requirement for alignment with the strategic objectives of the GLOSSA project.
11
Table 2. Targets and proposed category.
TargetCategory
Target 11.1. By 2030, ensure access for all to adequate, safe, and affordable housing and basic services and upgrade slumsLivability of dwellings
Housing affordability
Housing internet affordability
Target 11.2. By 2030, provide access to safe, affordable, accessible, and sustainable transport systems for all, improving road safety, notably by expanding public transport, with special attention to the needs of those in vulnerable situations, women, children, persons with disabilities, and older personsAccessibility/presence of connections
Type of vehicles used
Transport quality
Target 11.3. By 2030, enhance inclusive and sustainable urbanization and capacity for participatory, integrated, and sustainable human settlement planning and management in all countriesLand consumption
Participation in urban planning and
management
Target 11.4. Strengthen efforts to protect and safeguard the world’s cultural and natural heritagePresence of cultural goods or services
Expenditure on cultural goods or
services
Cultural heritage quality
Target 11.5. By 2030, significantly reduce the number of deaths and the number of people affected, and substantially decrease the direct economic losses relative to global gross domestic product caused by disasters, including water-related disasters, with a focus on protecting the poor and people in vulnerable situationsPopulation subject to risk
Deaths or injuries from natural or road disasters
Target 11.6. By 2030, reduce the adverse Per Capita environmental impact of cities, including by paying special attention to air quality and municipal and other waste managementWaste quantity and recycling
Emissions
Target 11. 7. By 2030, provide universal access to safe, inclusive, and accessible green and public spaces, in particular for women and children, older persons, and persons with disabilitiesPresence and quality of green areas or public spaces
Aggression and harassment
Table 3. Distribution of the set of indicators from the Literature Review (LR) and after the Duplicates screening (DS) step, with respect to the SDG11 categories and targets.
No. of indicators
from LR after DS
Target 11.1 7343
Category No. of indicators
from LR after DS
Livability of dwellings3319
Housing affordability2613
Housing internet affordability1411
Target 11.2 7052
Category No. of indicators
from LR after DS
Accessibility/presence of connections3021
Type of vehicles used2015
Transport quality2016
Target 11.3 3320
Category No. of indicators
from LR after DS
Land consumption2412
Participation in urban planning and management98
Target 11.4 2928
Category No. of indicators
from LR after DS
Presence of cultural goods or services77
Expenditure on cultural goods or services76
Cultural heritage quality1515
Target 11.5 2314
Category No. of indicators
from LR after DS
Population subject to risk157
Deaths or injuries from natural or road disasters87
Target 11.6 9571
Category No. of indicators
from LR after DS
Waste quantity and recycling6044
Emissions3527
Target 11.7 1816
Category No. of indicators
from LR after DS
Presence and quality of green areas or public spaces1412
Aggression and harassment44
Total 341244
Table 4. Final indicators’ set.
CategoryThemeIndicatorDescriptionUnits of
Measurements
Reference
Scale
Phase
of Use
References
Target 11.1
Housing LivabilityOvercrowdingPercentage of people living
in overcrowded dwellings
The indicator measures the percentage of people living in overcrowded housing.%DistrictMonitoring[16,17]
Housing LivabilityOutdoor
spaces
Common areas:
interaction and common spaces
The indicator measures the endowment of multi-family buildings with outdoor common areas and spaces, which perform the function of “relationship spaces” owned and used by the entire building.scenario-
based
BuildingEvaluation[42]
Affordable housingCostHousing cost overloadThe indicator measures the percentage of people living in households where the total cost of running a home represents more than 40% of net household income.%DistrictEvaluation[27]
Affordable housingCostHousing types and
social housing
The indicator measures housing and social housing types to promote a fair and supportive community, allowing a wide range of resident citizens belonging to different economic and social levels to live in the same community.scenario-
based
DistrictEvaluation[46]
Affordable housingEnergy
efficiency
Energy
sustainability
The indicator assesses the number of plant types from renewable sources (none, +1 solar, +1 wind, +1 hydro, +1 geothermal, and +1 biomass)Qualitative
0–5
BuildingEvaluation[45]
Affordable housingEnergy
efficiency
Energy efficiencyThe indicator measures the number of increases in the energy classes of buildings.Qualitative
0–5
BuildingEvaluation[41]
Housing
Internet affordability
ConnectionsUtilityThe indicator assesses the provision of access to the site’s service infrastructure (gas, electricity, water, internet, etc.) and communication infrastructure—with minimal disruption and minimal need for reconstruction—and their readiness for future growth of services.scenario-
based
DistrictEvaluation[36]
Target 11.2
Accessibility/
presence of connections
ConnectionsCycle pathsThe indicator measures the increase or new construction of cycle paths.mDistrictEvaluation[45]
Accessibility/
presence of connections
ConnectionsPublic mobilityThe indicator measures the pedestrian distance from the center of the intervention area to the nearest public transport hub.mDistrictEvaluation[41]
Accessibility/
presence of connections
ConnectionsHouseholds reporting difficulties with public transport connections in the area where they liveThe indicator measures households that declare difficulties in connecting with public transport in the area in which they reside (for 100 households with the same characteristics).%DistrictMonitoring[16,17]
Accessibility/
presence of connections
ConnectionsAccessibility to
public transport
The indicator measures accessibility to public transport.scenario-
based
DistrictMonitoring[41]
Type of
vehicles used
Parking
spaces
Supporting the
use of bicycles
The indicator measures the percentage between the number of bicycles that can actually be parked in a functional and safe way and the number of users in the building.%BuildingEvaluation[37]
Type of
vehicles used
Parking
spaces
Maximum parking
capacity
The indicator measures the amount of parking spaces according to the users of the building with a view to promote the use of alternative means of transport to and from the building as an alternative to the private car. In this sense, it is intended to help reduce transport-related emissions and traffic congestion associated with the operation of the building.scenario-
based
BuildingEvaluation[37]
Transport qualitySustainable
organization
Interchange pointsThe indicator assesses the design strategies regarding collective transport (comfortable and safe stops, guarantee of the construction of new stops within a predefined time, preparation of bicycle racks, etc.). in the proximity of the project.scenario-
based
DistrictEvaluation[42]
Target 11.3
Land
consumption
Soil
preservation
Soil sealing from
artificial cover
The indicator measures the total amount of artificial cover land that exists at a given time.%DistrictMonitoring and Evaluation[18]
Land
consumption
Building reuseUnused buildings
by state of use
The indicator quantifies the number of empty buildings. According to the ISTAT glossary (2013), a building not in use is defined as a building/complex not yet ready to be used for residential purposes and/or for the production of goods or services because it is under construction; a building/complex no longer suitable for use for residential purposes and/or for the production of goods or services because it is falling down, in a state of disrepair, and similar.nDistrictMonitoring[27]
Land
consumption
Building reuseEnvironmental
reclamation
The indicator measures the surface area of the project subjected to environmental remediation, i.e., elimination of causes of pollution and hazardous materials present inside the buildings or in the areas subject to intervention.m2BuildingEvaluation[45]
Participation in
urban
planning and management
ParticipationInvolvement and openness
towards the community
The indicator evaluates strategies for raising awareness of the needs of the community by activating participation and involving the people who live within it in the design and planning of the intervention and in the decisions concerning the improvement or lasting change in their urban reality.scenario-
based
DistrictEvaluation[42]
Target 11.4
Presence/quality of cultural goods and servicesHeritageCultural heritage and
landscape assets
The indicator monitors the number of cultural and historical heritage assets and landscape assets.nDistrictMonitoring[33,46]
Presence/quality of cultural goods and servicesBuilding accessibilitySecurity for inclusivenessThe indicator quantifies the buildings equipped with specific measures for overcoming architectural barriers.nBuildingMonitoring and Evaluation[45]
Quality of
cultural
heritage
InclusionBuildings equipped with specific measures to overcome architectural barriers (meaning school buildings)The indicator measures the number of cultural or non-profit associations involved in the project on the project’s covered area.n/m2DistrictEvaluation[33,47]
Target 11.5
Population subject to riskEnvironmental disastersPopulation exposed
to flood risk
The indicator measures the percentage of the population residing in areas with medium hydraulic hazard (return time 100–200 years pursuant to Legislative Decree 49/2010), identified on the basis of the ISPRA National Mosaic of Hydrogeological Plans (PAI, Italian acronym) and related updates, with reference to the P2 risk scenario. The population considered is that of the 2011 Census.%DistrictMonitoring[16,17]
Population subject to riskEnvironmental disastersPopulation exposed
to the risk of landslides
The indicator measures the percentage of the population residing in areas with high and very high landslide hazard, identified on the basis of the ISPRA National Mosaic of the Hydrogeological Plans (PAI, Italian acronymic) and related updates. The population considered is that of the 2011 Census.%DistrictMonitoring[16,17]
Target 11.6
Waste quality and recyclingWasteRecycled/recovered
materials
The indicator measures the percentage by weight of recycled and/or recovered materials used in the intervention in addition to the legal limit percentage.%BuildingEvaluation[41]
Target 11.7
Presence and quality of green areas and public spacesGreen spacesDistribution of
green spaces
The indicator measures the distribution of spaces, in particular green areas in relation to the total study area and the number of inhabitants.m2/abDistrictMonitoring and Evaluation[48]
Presence and quality of green areas and public spacesGreen spacesGreen areaThe indicator measures the ratio of vegetation area to mineral area.m2/m2DistrictMonitoring and Evaluation[45]
Presence and quality of green
areas and public spaces
DegradationDissatisfaction with the
landscape of the living place
The indicator measures the percentage of people aged 14 and over who declare that the landscape of the place of living is affected by evident degradation%DistrictMonitoring[16,17,49]
Disclaimer/Publisher’s Note: The statements, opinions and data contained in all publications are solely those of the individual author(s) and contributor(s) and not of MDPI and/or the editor(s). MDPI and/or the editor(s) disclaim responsibility for any injury to people or property resulting from any ideas, methods, instructions or products referred to in the content.

