Article

Spatiotemporal Variation and Driving Forces of Ecological Security Based on Ecosystem Health, Services, and Risk in Tianjin, China

School of Environmental Science and Engineering, Tianjin University, Tianjin 300350, China
*
Author to whom correspondence should be addressed.
Sustainability 2025, 17(14), 6287; https://doi.org/10.3390/su17146287
Submission received: 29 May 2025 / Revised: 3 July 2025 / Accepted: 7 July 2025 / Published: 9 July 2025
(This article belongs to the Special Issue Sustainable Land Management: Urban Planning and Land Use)

Abstract

Ecological security underpins sustainable regional development and human well-being. Tianjin is in the eastern coastal area of China and features coastal wetlands and river systems. Over the past decade, Tianjin has undergone rapid urbanization. Tianjin faces the dual challenges of maintaining ecological security with economic growth, making it crucial to assess Tianjin’s ecological security status. This study constructed a comprehensive framework incorporating ecosystem health, services, and risk data to evaluate the ecological security status of Tianjin in 2012, 2017, and 2022. The results show the following: (1) Land use transfer mainly shows other land use types transferred to construction land. (2) The ecological security index of Tianjin ranges from 0.003 to 0.865, and the annual average values from 2012 to 2022 are 0.496, 0.493, and 0.499, with security levels dominated by medium, medium-high, and high security levels, respectively. The change in ecological security was relatively stable and was dominated by areas with unchanged levels, accounting for 63.72% of the total area. (3) The natural environment, human activities, and ecosystem status jointly influence Tianjin’s ecological security level. Shannon diversity, Shannon evenness, vegetation type, elevation, and mean annual temperature were the main factors affecting changes in ecological security in Tianjin, among which the interaction of Shannon diversity and vegetation type had the most significant influence. This study combines positive and negative aspects to assess ecological security, providing a reference for other regions to conduct ecological security assessments and a scientific basis for ecological management and urban planning decisions in similar regions.

1. Introduction

As economic growth and industrialization accelerate, the impact of human activities on the composition, structure, and functioning of ecosystems is increasing, and ecological problems are becoming increasingly apparent globally. Climate change has exacerbated land degradation, triggered the destruction of forests and grasslands, led to the sharp decline in biodiversity, and forced species to make adaptive adjustments through migrating their ranges, among other things [1,2,3]. Ecosystems are also at risk of impaired health and functional degradation, which negatively affect a region’s ecological security and sustainable development [4]. The decline of ecological security can exacerbate habitat fragmentation and impede human society’s sustainable development [5,6]. Therefore, maintaining ecological security and promoting sustainable socioeconomic development on regional scales is a common goal pursued by all countries in the world today [7]. There has been a significant increase in the literature on the construction of ecological security evaluation systems in recent years [8,9,10]. Ecological security, as a pillar of sustainable urban development, plays an essential role in building regional economies, national security, and social stability and is particularly important in the current sustainable development agenda that is actively promoted globally [11]. Research on ecological security is theoretically and practically important [12]. In-depth research on ecological security can guide urban planning and construction, help economic development while effectively controlling environmental pollution and resource consumption, reduce the ecological burden, and safeguard the quality of water, soil, and air, thus enhancing a region’s sustainable development [13,14].
The International Institute for Applied Systems Analysis (IIASA) gives a broad and narrow interpretation of ecological security [15]. Broadly speaking, ecological security involves human living conditions, a state of health and well-being, basic rights, living resources, social harmony, and the ability to cope with environmental change [16]. Narrow interpretations focus on the stability of ecological systems with varying degrees of naturalness [17]. Many techniques, methods, and models are currently being used for ecological security assessment, such as the Geographic Information System (GIS) technique [18], the Pressure–State–Response (PSR) model [19], the Driver–Pressure–State–Impact–Response (DPSIR) model [20], the ecological footprint method [21], and the landscape ecology method [22]. Specifically, Cheng et al. applied the PSR model to develop an evaluation method to analyze China’s overall land ecological security. They found that security was markedly greater southeast of the Hu Huanyong Line [23]. Liu et al. conducted a systematic evaluation of Baishuijiang National Nature Reserve using a modified DPSIR model. The results showed that the interaction between social and economic factors is the main external driver of ecological security in Baishuijiang National Nature Reserve [24]. Zhang et al. used the ecological footprint method to evaluate the trend in ecological security in Shaanxi Province. They found that the ecological security of Shaanxi Province is characterized by “overall deterioration and local improvement” [25]. Moreover, previous studies have predominantly concentrated on specific aspects of ecological security, such as ecological risk or ecosystem services. For instance, Li et al. examined the spatiotemporal dynamics of ecological security in the Guizhou Plateau karst basin using GIS and landscape indices, observing a consistent upward trend in the overall ecological security index [26]. Sun et al. developed a framework for ecological security assessment based on ecosystem services, advocating for the promotion of clean industries [16]. In contrast to these studies, this research establishes a multi-dimensional evaluation framework that integrates ecosystem health, ecosystem services, and ecological risk into a unified system. This comprehensive approach provides a more holistic understanding of ecological security.
Tianjin, located in northern coastal China within the Bohai Economic Rim, plays a vital role in the socioeconomic and ecological dynamics of the region [27]. As a central part of the Beijing–Tianjin–Hebei urban agglomeration, its rapid industrialization and urban expansion have resulted in substantial land use changes, notably, the conversion of cropland into construction land, thereby exacerbating ecological pressures [28]. The city’s diverse landscape combines coastal wetlands, agricultural zones, and urban areas. This integration intensifies land use conflicts, a ubiquitous challenge in coastal cities [29,30,31]. Due to its significant ecological challenges, Tianjin serves as a critical case study for understanding ecological security dynamics in rapidly urbanizing coastal cities. This study is urgently needed to reconcile development with ecological sustainability, safeguarding the long-term health of both the region’s ecosystems and its population. Therefore, we assessed Tianjin’s ecological security using a multi-perspective evaluation framework that incorporates ecosystem health, ecosystem services, and ecological risk. The research framework of this study is shown in Figure 1. First, we analyzed land use transformation characteristics in Tianjin. Then, we applied the Vigor–Organization–Resilience (VOR) model, the InVEST model, and landscape ecology methods to evaluate ecosystem health, ecosystem services, and ecological risk. Based on the results, we examined the spatial and temporal dynamics of ecological security in Tianjin from 2012 to 2022. We further employed the Optimal Parameter Geo-Detector (OPGD) model to quantitatively analyze the effects of individual factors on ecological security and their interactions. This study provides a decision-support tool for balancing Tianjin’s conservation and development priorities. Furthermore, this study provides a multi-dimensional ecological security assessment framework, helping researchers to quantify ecological security dynamics and formulate targeted sustainable development policies.

2. Materials and Methods
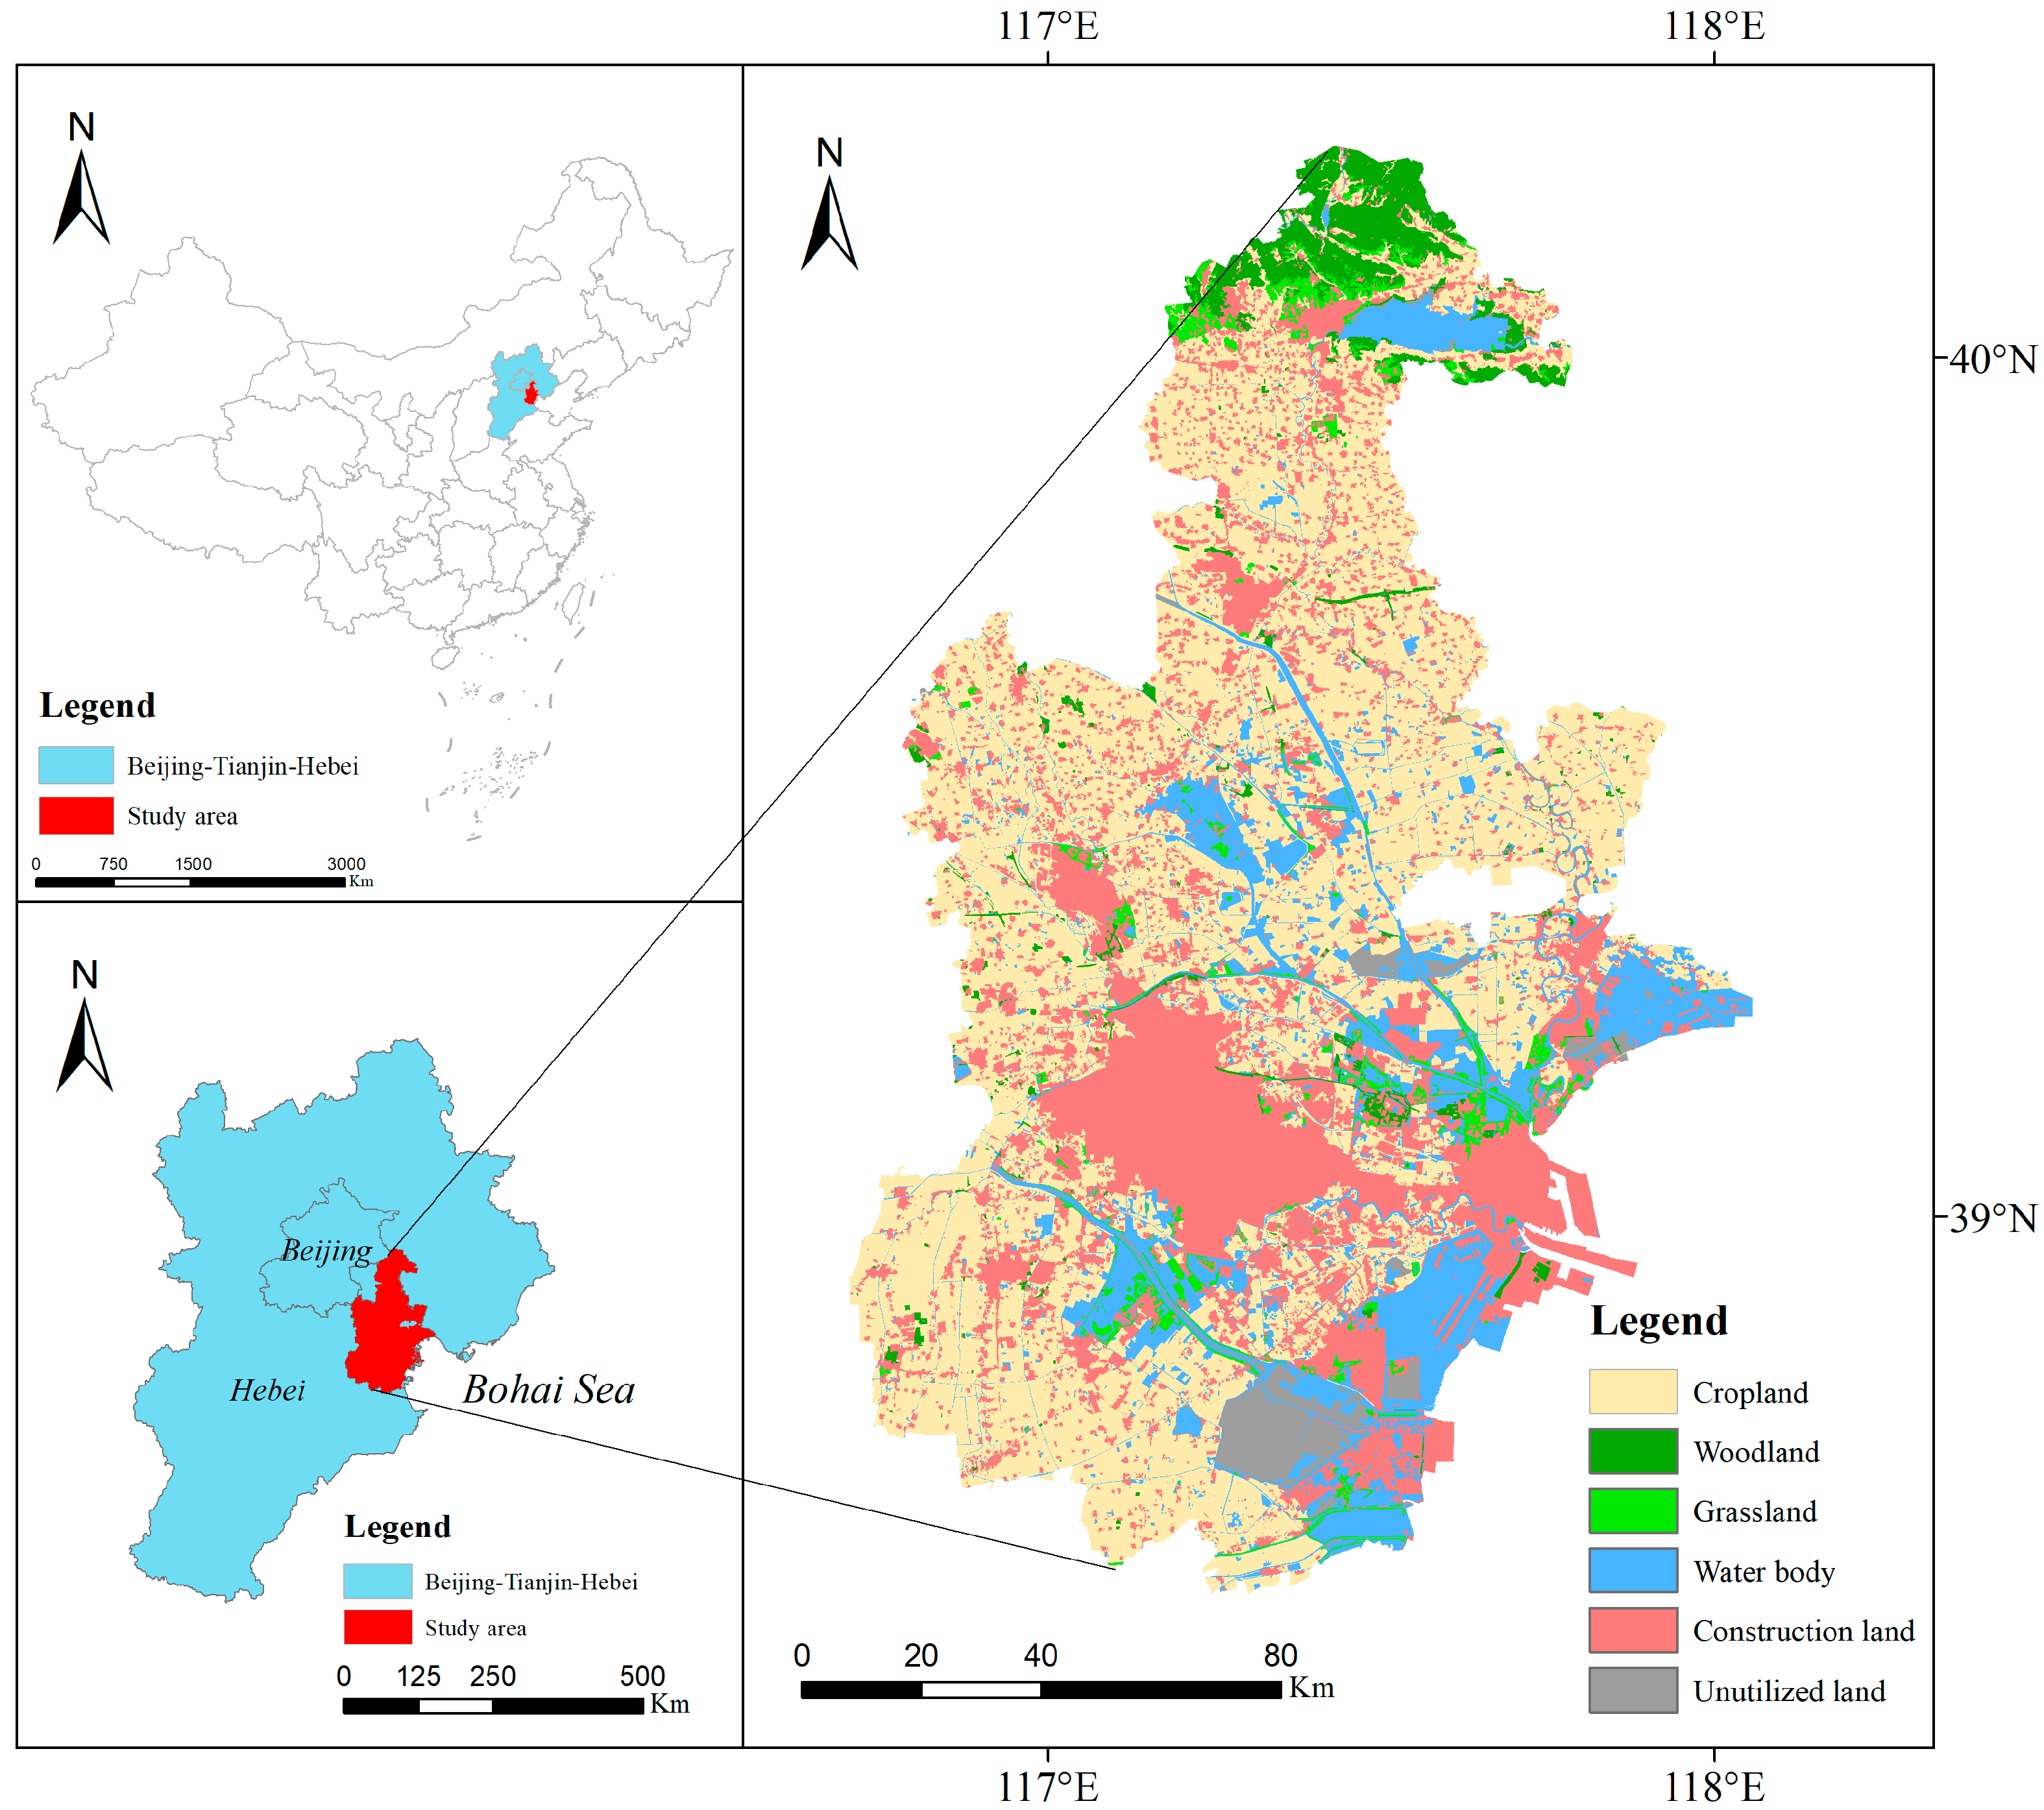
2.1. Study Area

Tianjin (38°34′–40°15′ N, 116°43′–118°4′ E), located in the northern coastal area of China, is a state-level administrative municipality and a mega-city with a population of more than 10 million (Figure 2). Tianjin straddles the Yanshan Mountains and the northeastern part of the North China Plain, and the southeastern part of the city is bordered by Bohai Bay, which is characterized by plains, mountains, and coastal landscapes. It has a warm, temperate, semi-moist monsoon climate, with four distinct seasons, cold and dry winters, high temperatures and heavy rainfalls in summers, and unique geography that has fostered regional biodiversity [32]. Tianjin is an important economic and transportation hub in China. In 2024, its gross regional product exceeded CNY 1800 billion, and its financial position will continue to be strengthened based on the dual positioning of “the Belt and Road” strategic node and the synergistic development of the Beijing–Tianjin–Hebei urban agglomeration. Supported by its economic foundation, Tianjin Port is a strategic fulcrum of the 21st Century Maritime Silk Road, assuming a key role as an essential outlet to the sea for neighboring landlocked countries [33].

2.2. Data Sources

Various datasets were collected to quantify ecosystem health, ecosystem services, ecological risk levels, and ecological security levels. These data included land use, Normalized Difference Vegetation Index (NDVI), precipitation, potential evapotranspiration, soil depth, and a Digital Elevation Model (DEM); the data sources and spatial resolutions are presented in Table S1. Based on the specific characteristics of land use in the study area, the land use data were reclassified into six main categories: cropland, woodland, grassland, water body, unutilized land, and construction land. Owing to differences in the data source, accuracy, and storage format, all raster data were resampled to a uniform spatial resolution of 30 m × 30 m using ArcGIS 10.8.

2.3. Assessing Land Use Change

The land use transfer matrix is a two-dimensional matrix used to quantitatively study the transformation relationship between different land use types in the study area during the study period, through which the transfer area and direction of each land use type from the beginning to the end of the study can be clarified [34]. The land use data was applied to calculate the transfer matrix in Tianjin. The formula for calculating the land use transfer matrix is as follows:
S i j = S 11 S 12 S 16 S 21 S 22 S 26 S 61 S 62 S 66
where S i j is the transfer matrix from land use type i to land use type j .

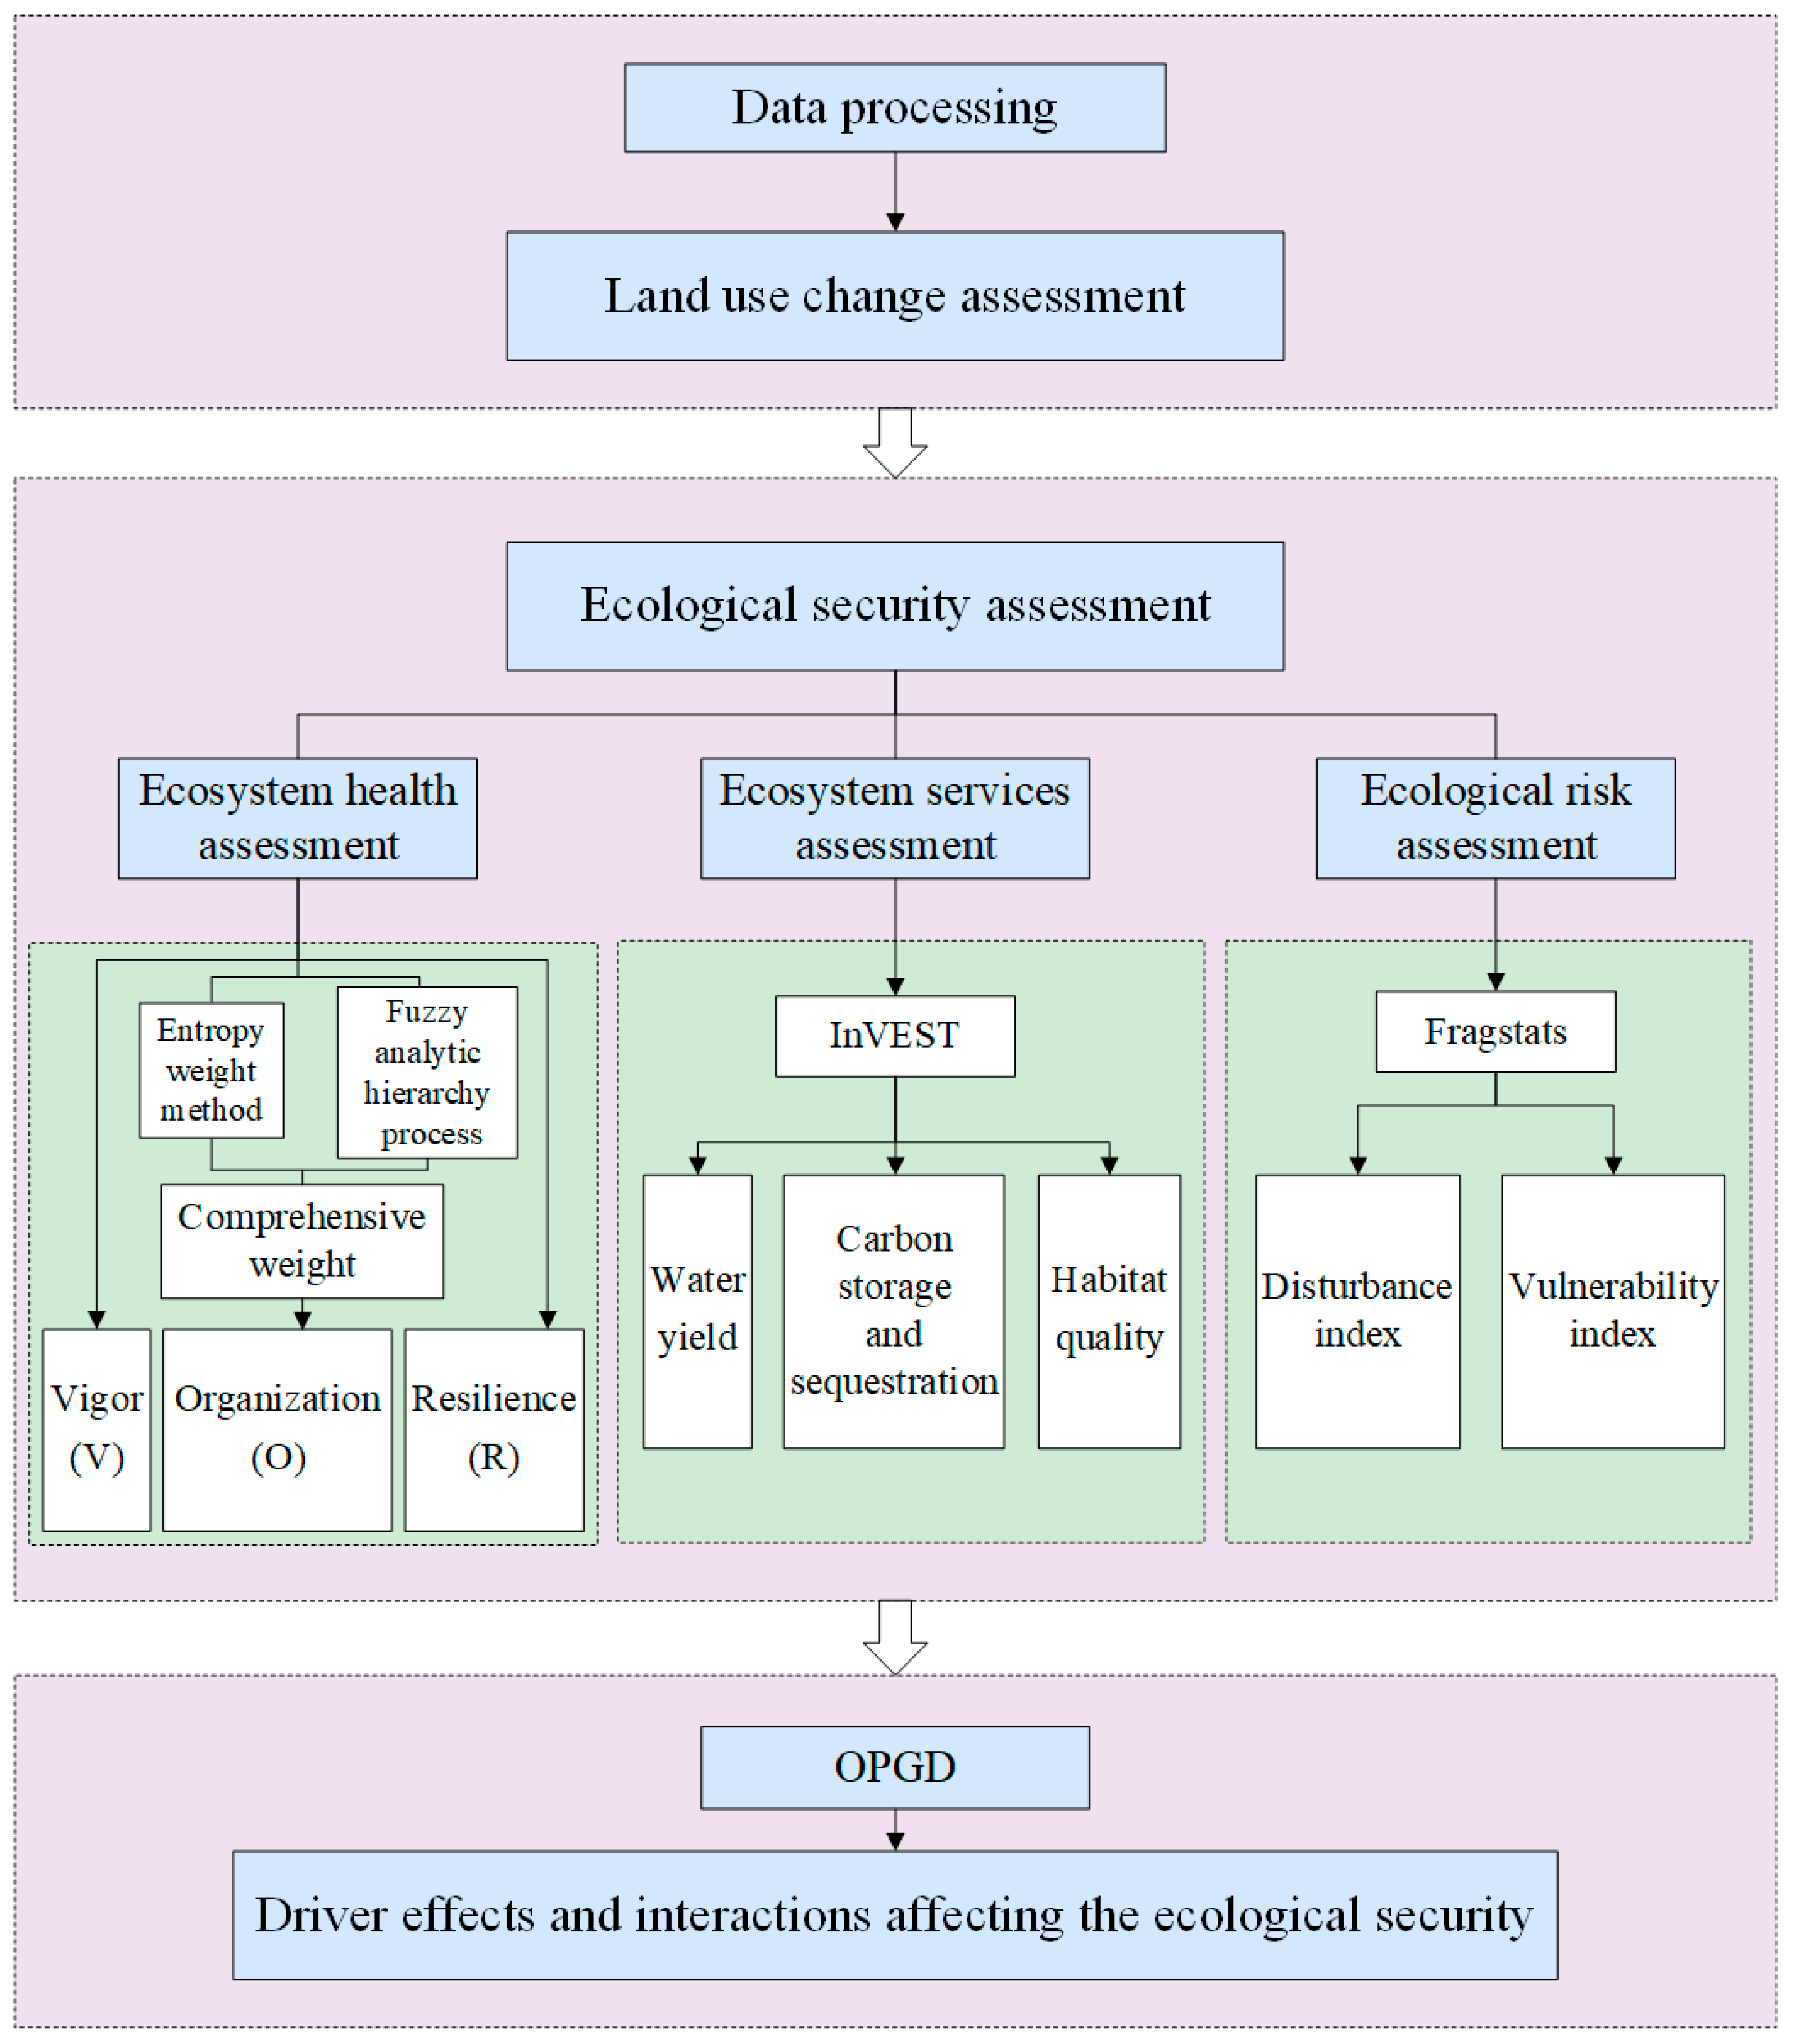
2.4. Integrated Framework for Assessing Ecological Security

This study characterized the level of ecological security in Tianjin based on three aspects: ecosystem health, ecosystem services, and ecological risk. Specifically, ecosystem health is the carrier of ecosystem service supply, while ecological risk reveals the possible disturbances to the ecosystem from the opposite perspective [35]. Ecosystem health reflects the ecological security status through vegetation characteristics and landscape structure; ecosystem services quantify ecological security through the provision of material supplies and regulatory services; and ecological risk reflects ecological security through the degree of disturbance and vulnerability. Although the three have intersections, their focuses and measurement dimensions are different. Ecosystem health focuses on the ecosystem itself; ecosystem services measure ecological contributions from the perspective of human benefits. In contrast, ecological risk focuses on potential negative impacts [36,37]. The ecosystem health, ecosystem service, and ecological risk indices of Tianjin were normalized to a range of 0–1 and used to calculate the Integrated Ecological Security Index (IESI) of Tianjin [38].
I E S I = E H I × E S I × ( 1 E R I ) 3
Here, IESI is the ecological security index, EHI is the ecosystem health index, ESI is the ecosystem service index, and ERI is the ecological risk index. Based on the actual situation of Tianjin and the natural breaks method [37], we classified the IESI into five levels: low security [0, 0.35), medium-low security [0.35, 0.40), medium security [0.40, 0.45), medium-high security [0.45, 0.50), and high security [0.50, 1]. The classification of the EHI, ESI, and ERI also followed the same method. The EHI, ESI, and ERI were calculated as follows.

2.4.1. Ecosystem Health

Ecosystem health assessments explore the ecosystems’ stability and resilience in their natural state or under human intervention, which helps formulate conservation and restoration strategies [39]. The VOR model can effectively reflect the interaction of various ecological processes [40]. Therefore, the VOR model was selected for the ecosystem health assessment. In addition, we categorized the EHI into five classes from low to high: sick [0, 0.21), poor [0.21, 0.37), general [0.37, 0.53), good [0.53, 0.69), and excellent [0.69, 1]. The EHI was calculated using the following equation [41]:
E H I = V × O × R 3
where V is the ecosystem vitality index, O is the ecosystem organization index, and R is the ecosystem resilience index.
Since NDVI was significantly and positively correlated with vegetation yield, it was selected as an indicator of ecosystem vitality in this study [42,43]. Ecosystem organizational power refers to the stability of its structure and is usually measured by the landscape pattern index based on spatial adjacency [44]. The Shannon Diversity Index (SHDI), Shannon Evenness Index (SHEI), Landscape Shape Index (LSI), Interspersion and Juxtaposition Index (IJI), and Perimeter–Area Fractal Dimension Index (PAFRAC) were selected as indicators of ecosystem organizational strength indicators [45] (Table S2). The weighting framework integrated fuzzy analytic hierarchy and entropy weight to derive dual weights (subjective/objective) for organizational power metrics, subsequently employing game theory for comprehensive weights [46,47,48]. Finally, the comprehensive weights of the SHDI, SHEI, LSI, IJI, and PAFRAC were 0.226, 0.222, 0.333, 0.118, and 0.102, respectively. Ecosystem resilience can be regarded as the ability of an ecosystem to resist external influences and restore its original functions after being subjected to external disturbances [49]. Therefore, this study selected the resilience and resistance indices as ecosystem resilience indices [50]. The weight settings are shown in Table 1, and the calculation formula was as follows [41,45,51,52,53,54]:
R = 0.6 × C r e s i l i e n c e + 0.4 × C r e s i s t a n c e
where R denotes ecosystem resilience, and C r e s i l i e n c e and C r e s i s t a n c e denote the ecosystem resilience coefficient and resistance coefficient, respectively.

2.4.2. Ecosystem Services

Ecosystem services mainly explore the various beneficial functions that ecosystems provide to humans directly or indirectly and can positively characterize ecosystem security [55]. The InVEST model is easy to operate and has a good spatial visualization effect [56]. Therefore, we selected three important ecosystem services—water yield, carbon storage and sequestration, and habitat quality—and used the InVEST model to quantify the supply capacity and the spatial and temporal variation in these services. By comparing the results of running the model with the actual values, the empirical constant in the water yield model used in this study was determined to be 5. The calculation formulas were as follows:
Y x = 1 A E T x P x × P ( x )
where Y x is the annual water production in raster x , A E T x is the annual actual evapotranspiration in raster x , and P x is the annual precipitation in raster x .
C _ t o t a l = C _ a b o v e + C _ b e l o w + C _ s o i l + C _ d e a d
Here, C _ t o t a l is the total carbon stock, C _ a b o v e is the aboveground biogenic carbon stock, C _ b e l o w is the belowground biogenic carbon stock, C _ s o i l is the soil carbon stock, and C _ d e a d is the dead organic matter carbon stock.
S H Q i j = H j 1 D i j z D i j z + k z
Here, S H Q i j is the habitat quality of land use type j in raster i , H j is the habitat suitability of land use type j , D i j is the total threat level of land use type j in raster i , K is the half-saturation constant (usually 0.5), and Z is the standardization constant [57].
This study employed ESI to assess ecosystem services in Tianjin, with quantified results categorized into five levels: missing service [0, 0.10), weaker service [0.10, 0.20), average service [0.20, 0.30), better service [0.30, 0.40), and high-quality service [0.40, 1]. ESI was calculated using the following formula [58]:
E S I = i = 1 3 W i × E S i
where E S I is the comprehensive ecosystem service index and W i and E S i are the weight coefficients of ecosystem service i and the standardized value of the index, respectively. The weights of each ecosystem service were equal in this study.

2.4.3. Ecological Risk

Ecological risk mainly explores the risks borne by ecosystems and their components and can characterize the security status of ecosystems from the opposite side. Urbanization reduced ecological space and disrupted landscape structure and function [59]. These resulted in soil erosion and loss of biodiversity, which heightened ecological risks [60]. Landscape ecological risk evaluation is beneficial for supporting landscape ecological construction [61]. Therefore, this study used landscape ecology methods to construct an ecological risk evaluation system for Tianjin by selecting the fragmentation index, separation index, dominance index, and vulnerability index from the perspectives of landscape disturbance and landscape vulnerability, respectively, to quantify the ecological risk level in Tianjin [62]. We classified the ERI into five levels: low risk [0, 0.025), relatively lower risk [0.025, 0.040), average risk [0.040, 0.055), relatively higher risk [0.055, 0.070) and high risk [0.070, 1]. The formula for calculating the ERI was calculated as follows:
E R I = i = 1 6 A k i A k × P i × K i
where E R I is the ecological risk index, A k i is the area of landscape type i in the risk evaluation unit k in the study area, A k is the total area of the risk evaluation unit k in the study area, P i is the disturbance index of landscape type i , and K i is the vulnerability index of landscape type i . Referring to relevant research and assigning values in combination with the actual, unutilized land = 6, water body = 5, cropland = 4, grassland = 3, woodland = 2, construction land = 1, and normalized [63].

2.5. Optimal Parameter Geo-Detector Model

A geo-detector is a new model for exploring driving factors. OPGD is an optimization based on the geo-detector that determines the optimal parameters for spatial heterogeneity by discretizing the data, which can more accurately measure the degree of explanation of drivers on ecological security [64,65]. Among them, the q-value reveals the relative importance of the driving factor [14]. For the influencing factors of ecological security, this study selected 11 typical influencing factors in terms of the natural environment, anthropogenic activities, and ecosystem state for analysis, including vegetation type, mean annual temperature, mean annual precipitation, Nighttime Light (NTL), population density, SHDI, SHEI, slope, Enhanced Vegetation Index (EVI), elevation, and aspect. In this study, the explanatory power of the selected influencing drivers on ecological security was calculated using the factor detector by OPGD. The main influencing factors were identified, and the combined effects of the factors were explored using the interaction detector. The formula for determining the value of q is as follows [66]:
q = 1 h = 1 L N h σ h 2 N σ 2
where q is the explanatory power of the independent variables on the ecological security of Tianjin, h = 1, …, L is the stratification of variable Y or driver X, N h is the number of samples for each driver in stratum h, N is the number of samples for each driver in the entire region, σ h 2 is the Y value of the entire region of the corresponding stratum, and σ 2 is the variance in the Y values in stratum h. The value of q is typically between zero and one. Higher q-values indicate a superior explanation of the dependent variable by its associated independent variable.

2.6. Data Analysis

The land use transfer matrix was generated in ArcGIS 10.8. The areas of five ecological security levels were extracted in ArcGIS 10.8, with inter-level transitions mapped using Sankey diagrams in Origin 10.15, highlighting spatiotemporal evolution trends in ecological security.

3. Results

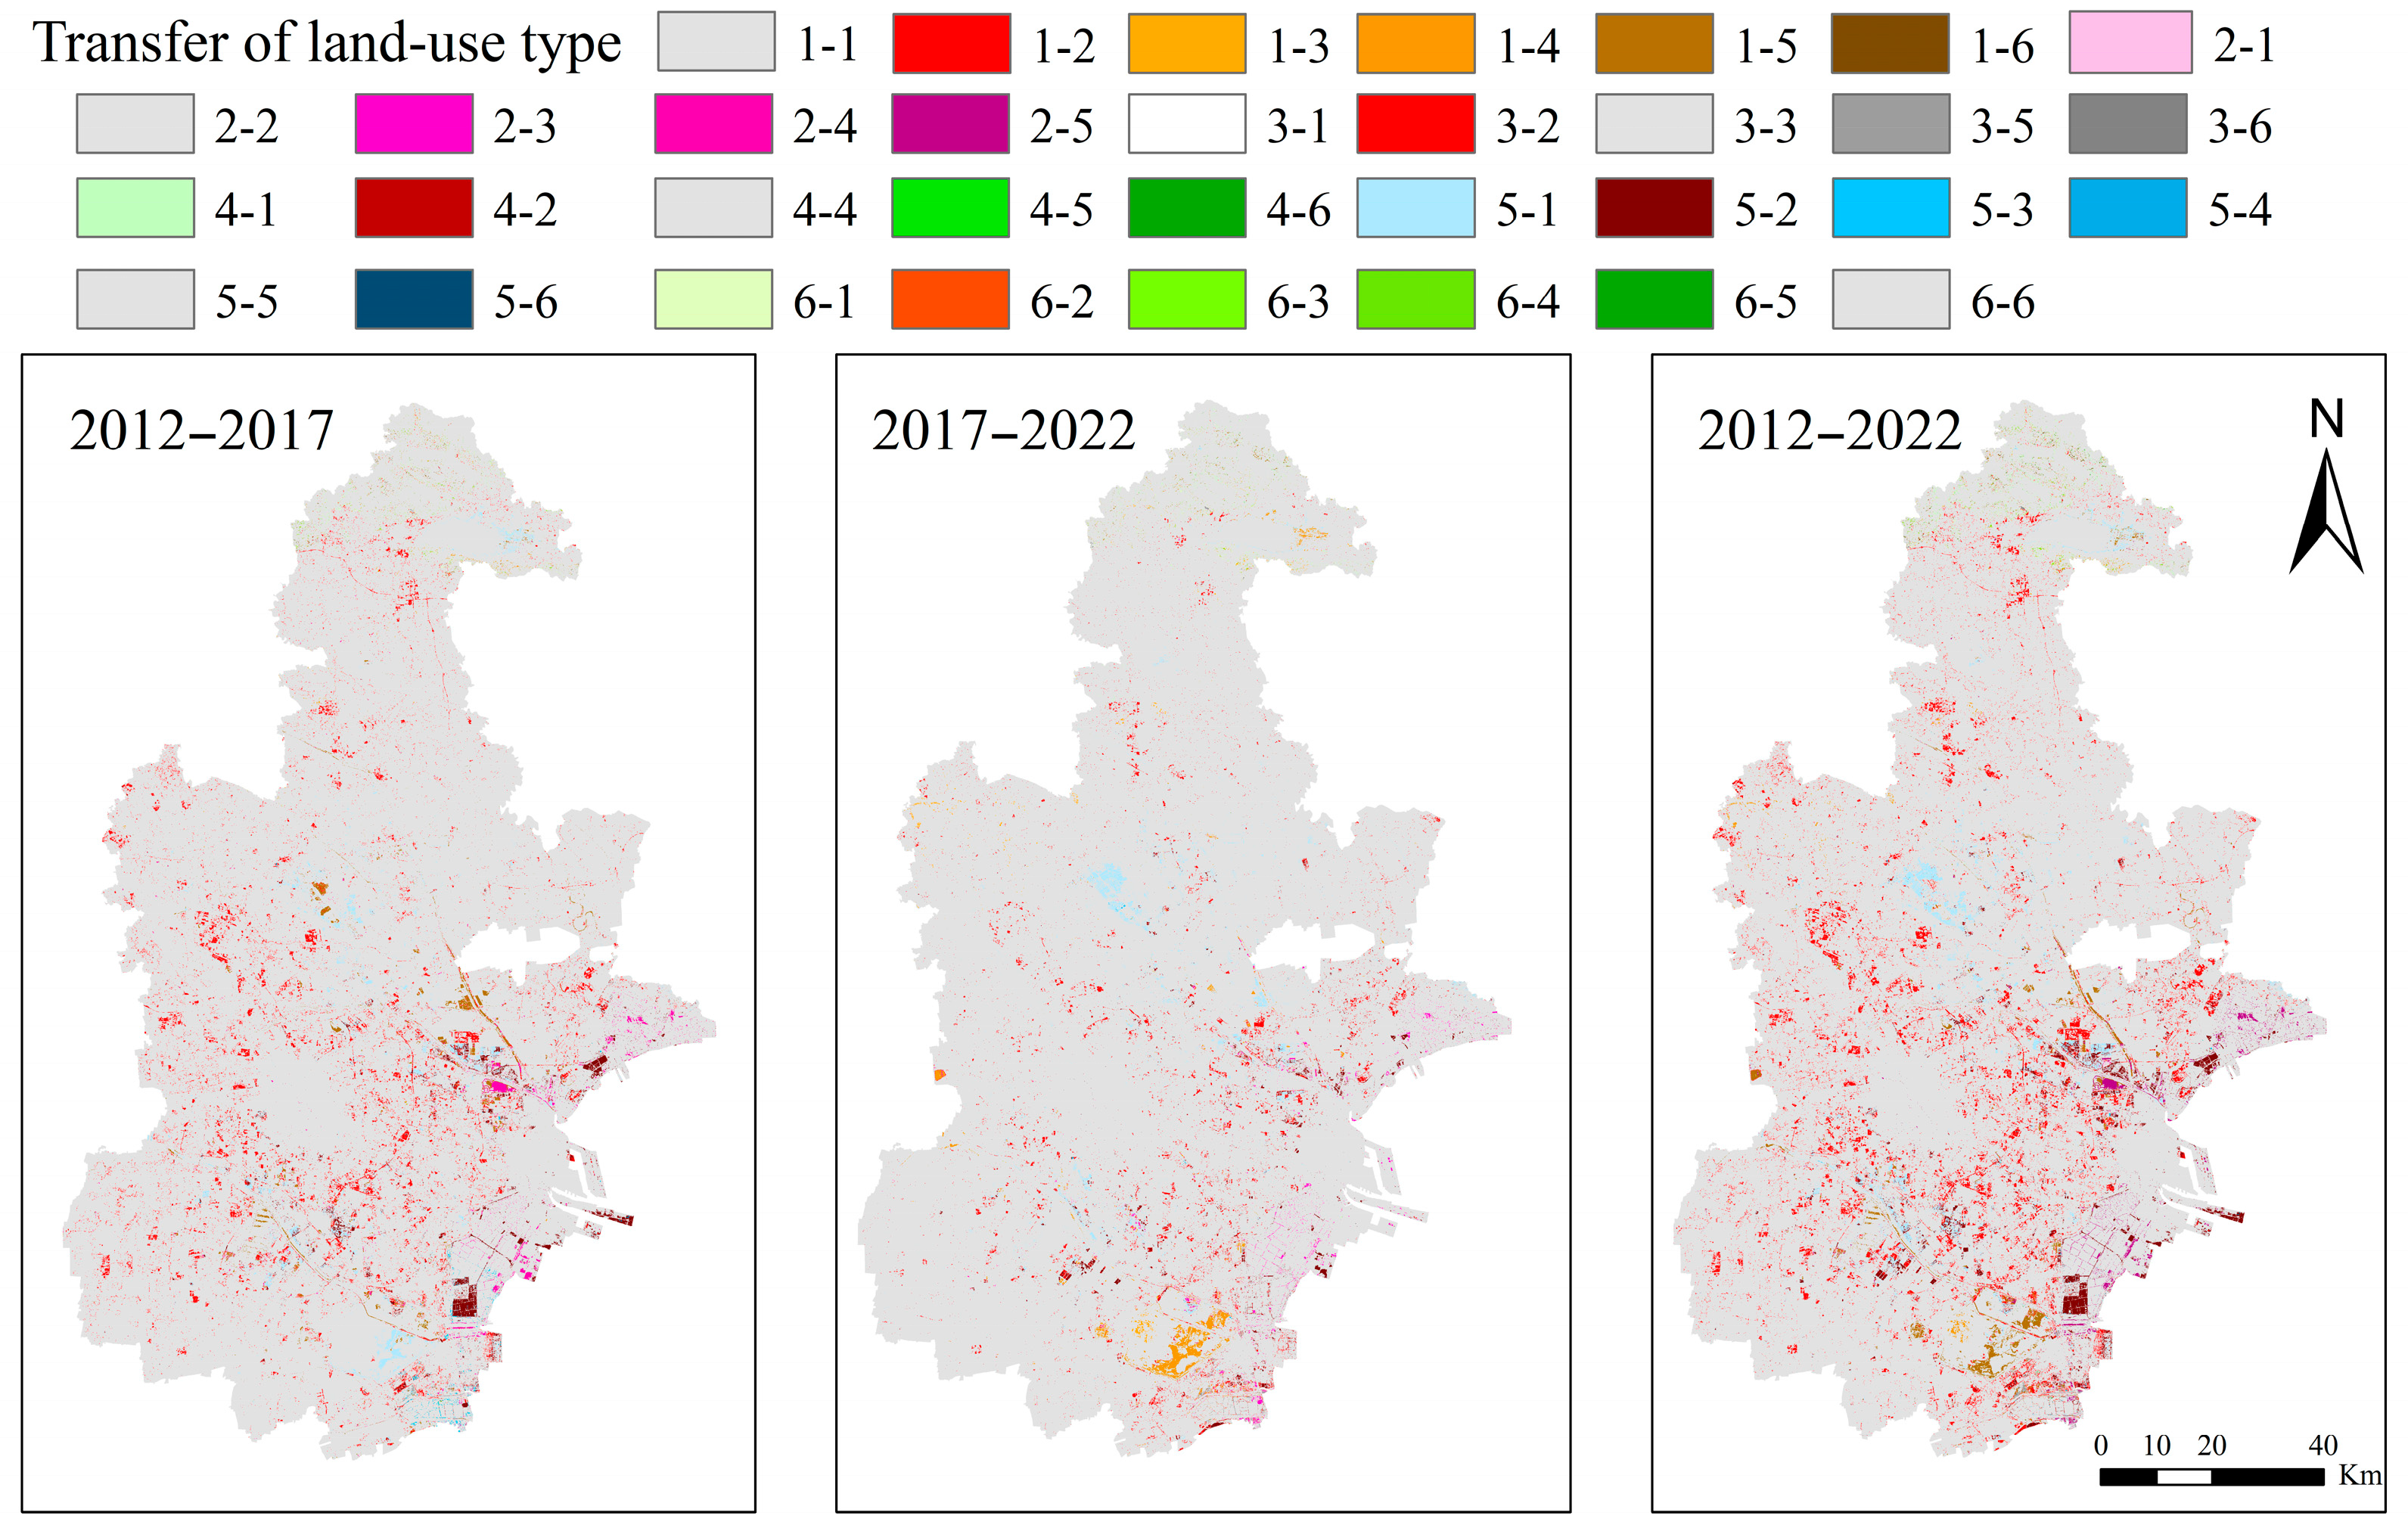
3.1. Variations in Land Use Transfer

Spatial analysis was employed to examine the changes in land use types from 2012 to 2022 (Figure 3). From 2012 to 2017, 406.3 km2 of cropland was transferred to other land use types, with the most significant area being transferred to construction land, accounting for 82.38% of the total area transferred (Table 2). Most of the unutilized land was transferred to construction land (55.88%) and water body (34.31%). A total of 42.4 km2 of construction land was converted into water body, accounting for 98.15% of the total converted area. The remaining three land use types (woodland, water body, and grassland) were mainly converted to cropland, accounting for 92.78%, 52.64%, and 40.91% of the total area transferred, respectively. From 2017 to 2022, the transfer between various land use types in Tianjin was smoother, and land use dynamics were significantly slower. Among them, the amount of cropland area transferred out to construction land is 158.0 km2, which is also reduced compared to 2012–2017, accounting for 66.36% of the total area transferred out (Table 3). Construction and unutilized land were mainly transferred to the water body, much more so than other land use types. Woodland, water body, and grassland were mainly converted to cropland, accounting for 95.48%, 68.56% and 68.42%.
From 2012 to 2022, cropland and unutilized land were mainly converted into construction land, of which the area of cropland converted into construction land amounts to 482.5 km2, and the area of unutilized land converted into construction land is 8.9 km2, accounting for 54.60% of the total area transferred out (Table 4). Water body was primarily converted into cropland and construction land, accounting for 54.55% and 44.82% of the total area, respectively. Reduced woodland and grassland were primarily converted to cropland, and construction land was mainly transferred to water body. In addition, the regions transferred out of and into cropland, construction land, and water body were at least one order of magnitude higher than those of the other use types and were the three land use types with more active transfer changes during the study period.

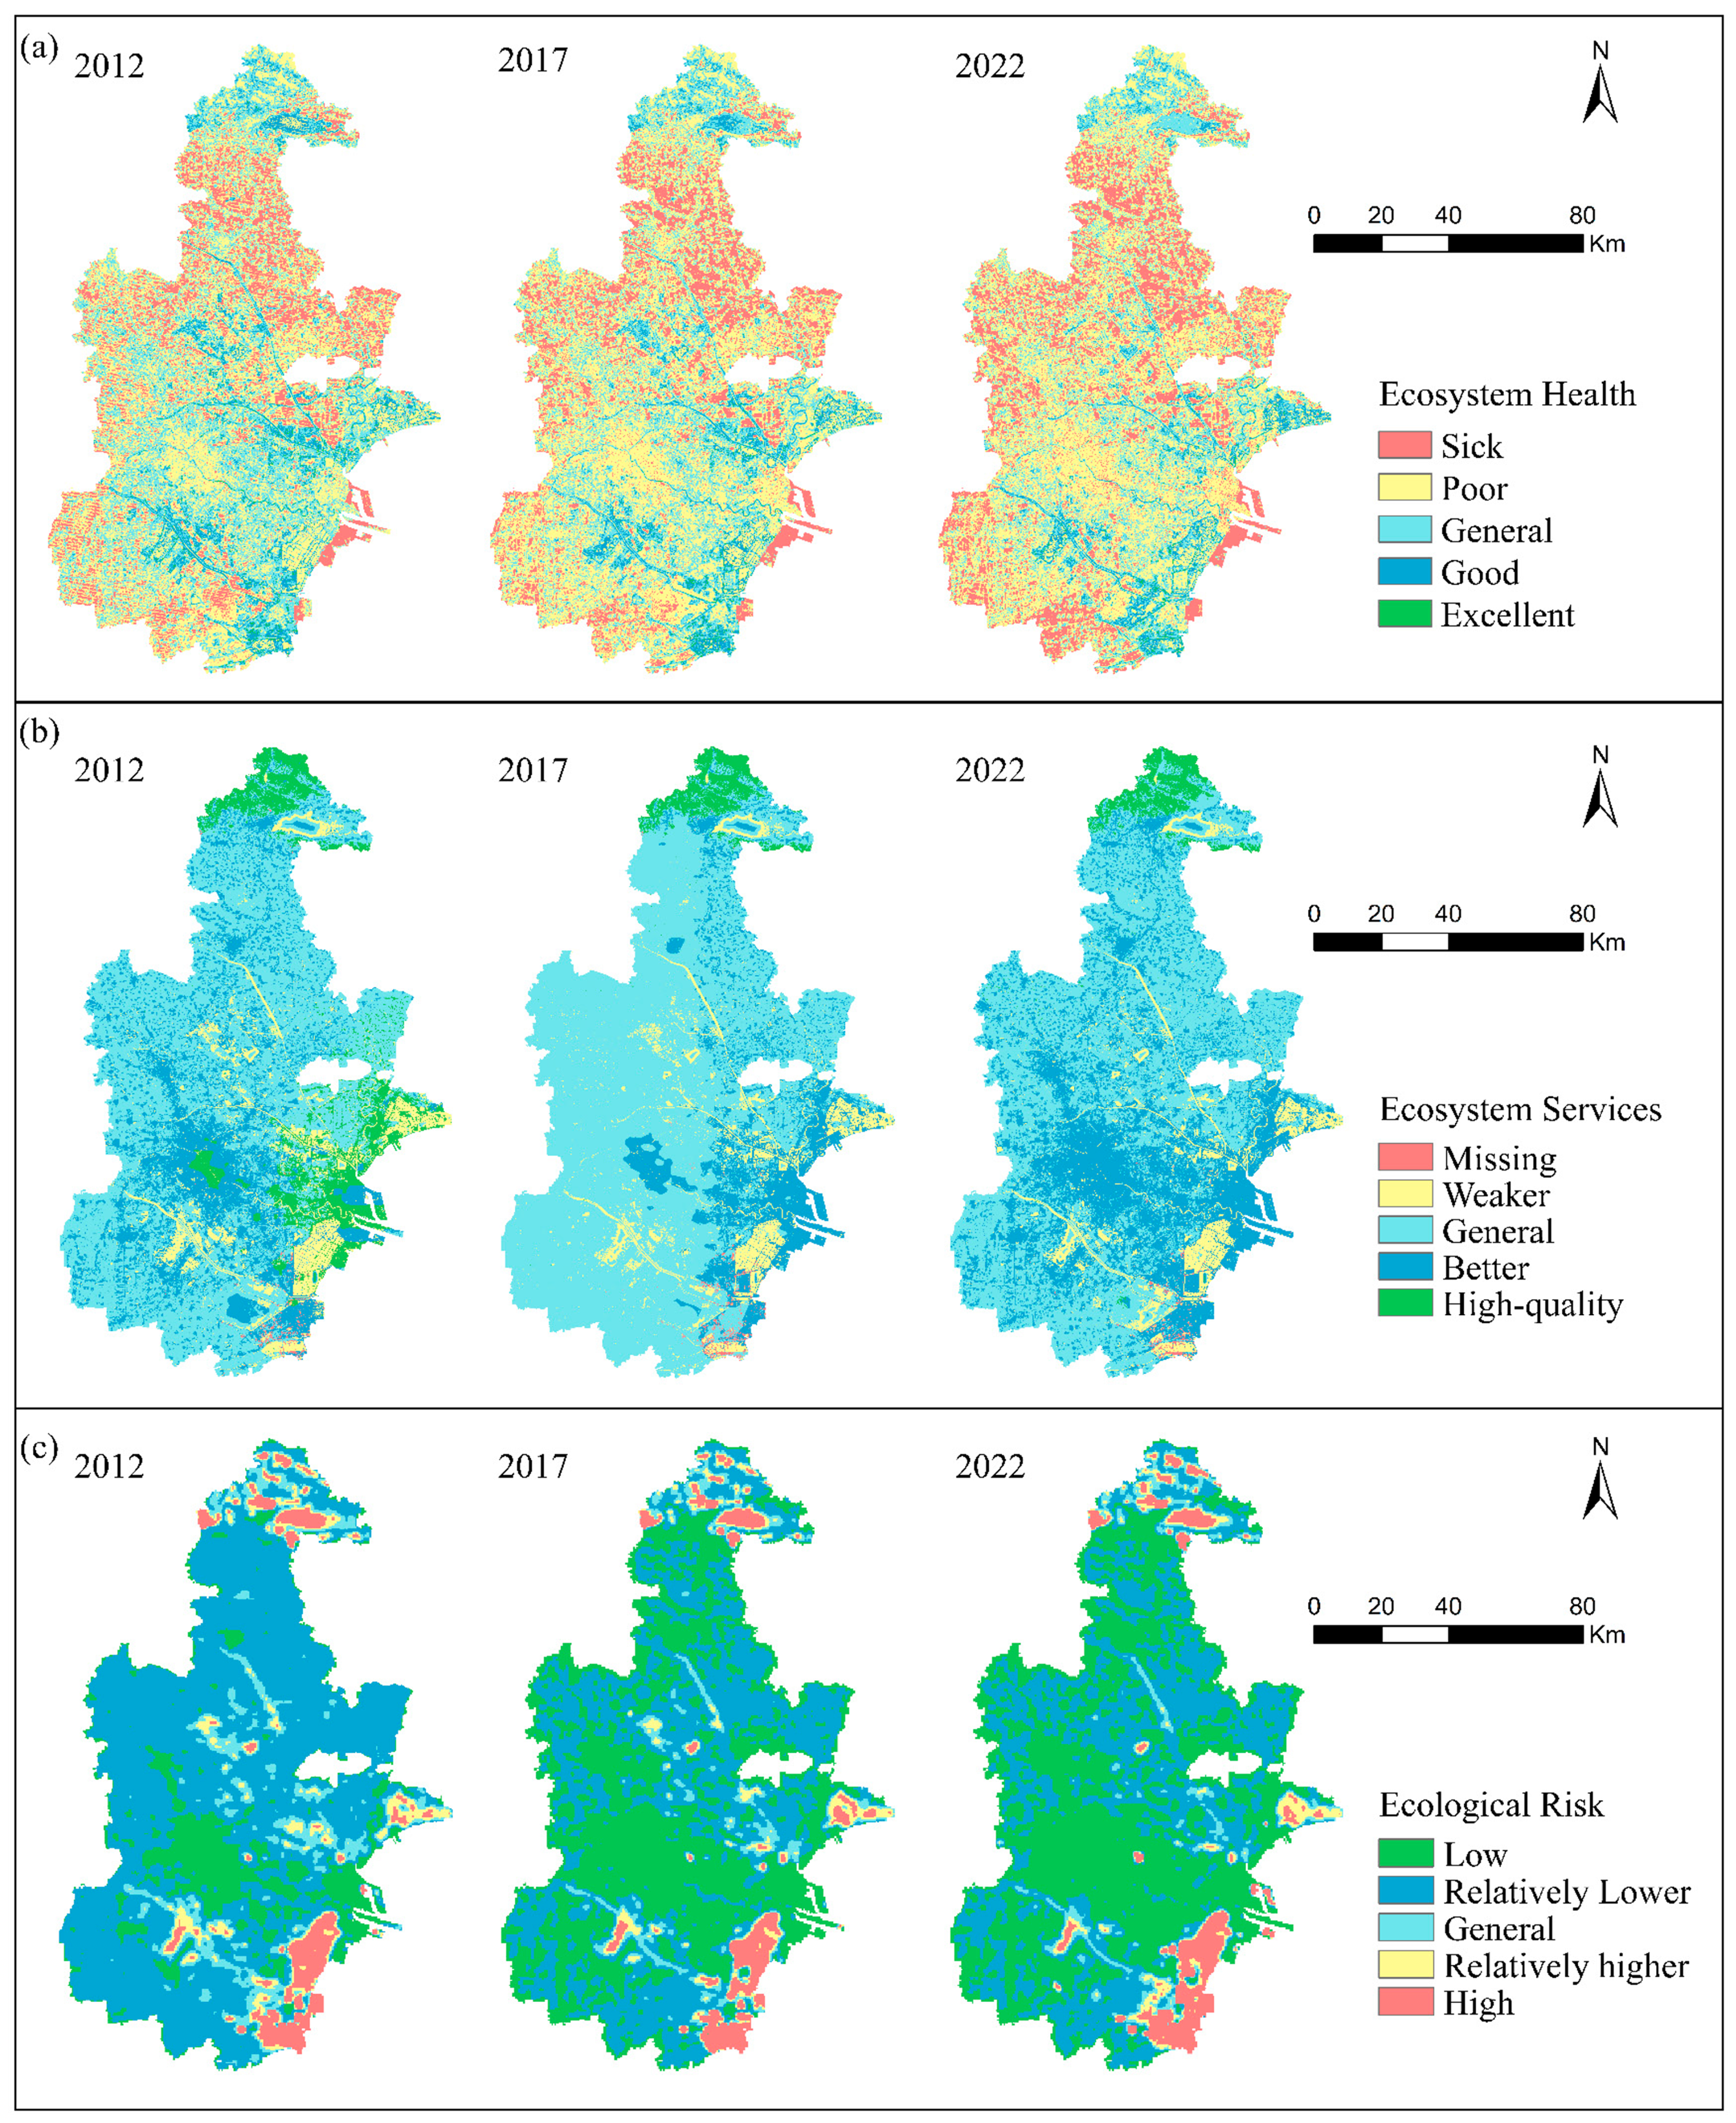
3.2. Integrated Assessment of Ecosystem Health, Ecosystem Services, and Ecological Risk

Significant differences were observed spatially in the distributions of ecosystem health, ecosystem services, and ecological risk levels in Tianjin (Figure 4). Overall, the ecosystem health in Tianjin was higher in the northern and central parts of the city and lower in the surrounding areas (Figure 4a). From 2012 to 2022, the area of Tianjin with general health status and above exhibited an initial decline followed by subsequent growth, with the sum of the area accounting for 56.0% in 2012, 51.8% in 2017, and 52.9% in 2022, which shows that the overall ecosystem health in Tianjin during the period of 2017–2022 is not as good as that of the surrounding areas. Regarding the value of 52.9% in 2022, it can be seen that the overall ecosystem condition of Tianjin in the period of 2017–2022 shows a gradually improving trend compared with that of 2012–2017. The overall spatial distribution of the ecosystem service level was higher in the central and western parts of the city and lower in the eastern and southern parts of the coastal region (Figure 4b). Specifically, the sum of the areas with high-quality and better service levels demonstrates a decline followed by a rise, with the sum of the areas decreasing from 34.2% in 2012 to 18.4% in 2017 and then increasing to 38.4% in 2022. The overall functioning of ecosystem services increased. Moreover, Tianjin’s ecological risk level rating showed a spatial distribution pattern that was lower in the north and southeast and higher in the central region (Figure 4c). Specifically, the areas with low risk and relatively lower risk levels show a continuous upward trend, with the sum of the areas rising from 80.3% in 2012 to 86.0% in 2017 and then decreasing to 86.6% in 2022. The overall risk level in Tianjin showed a decreasing trend during 2012–2022, indicating that Tianjin has succeeded in responding to and mitigating threats to the ecosystem. The ecosystem risk was partially mitigated.

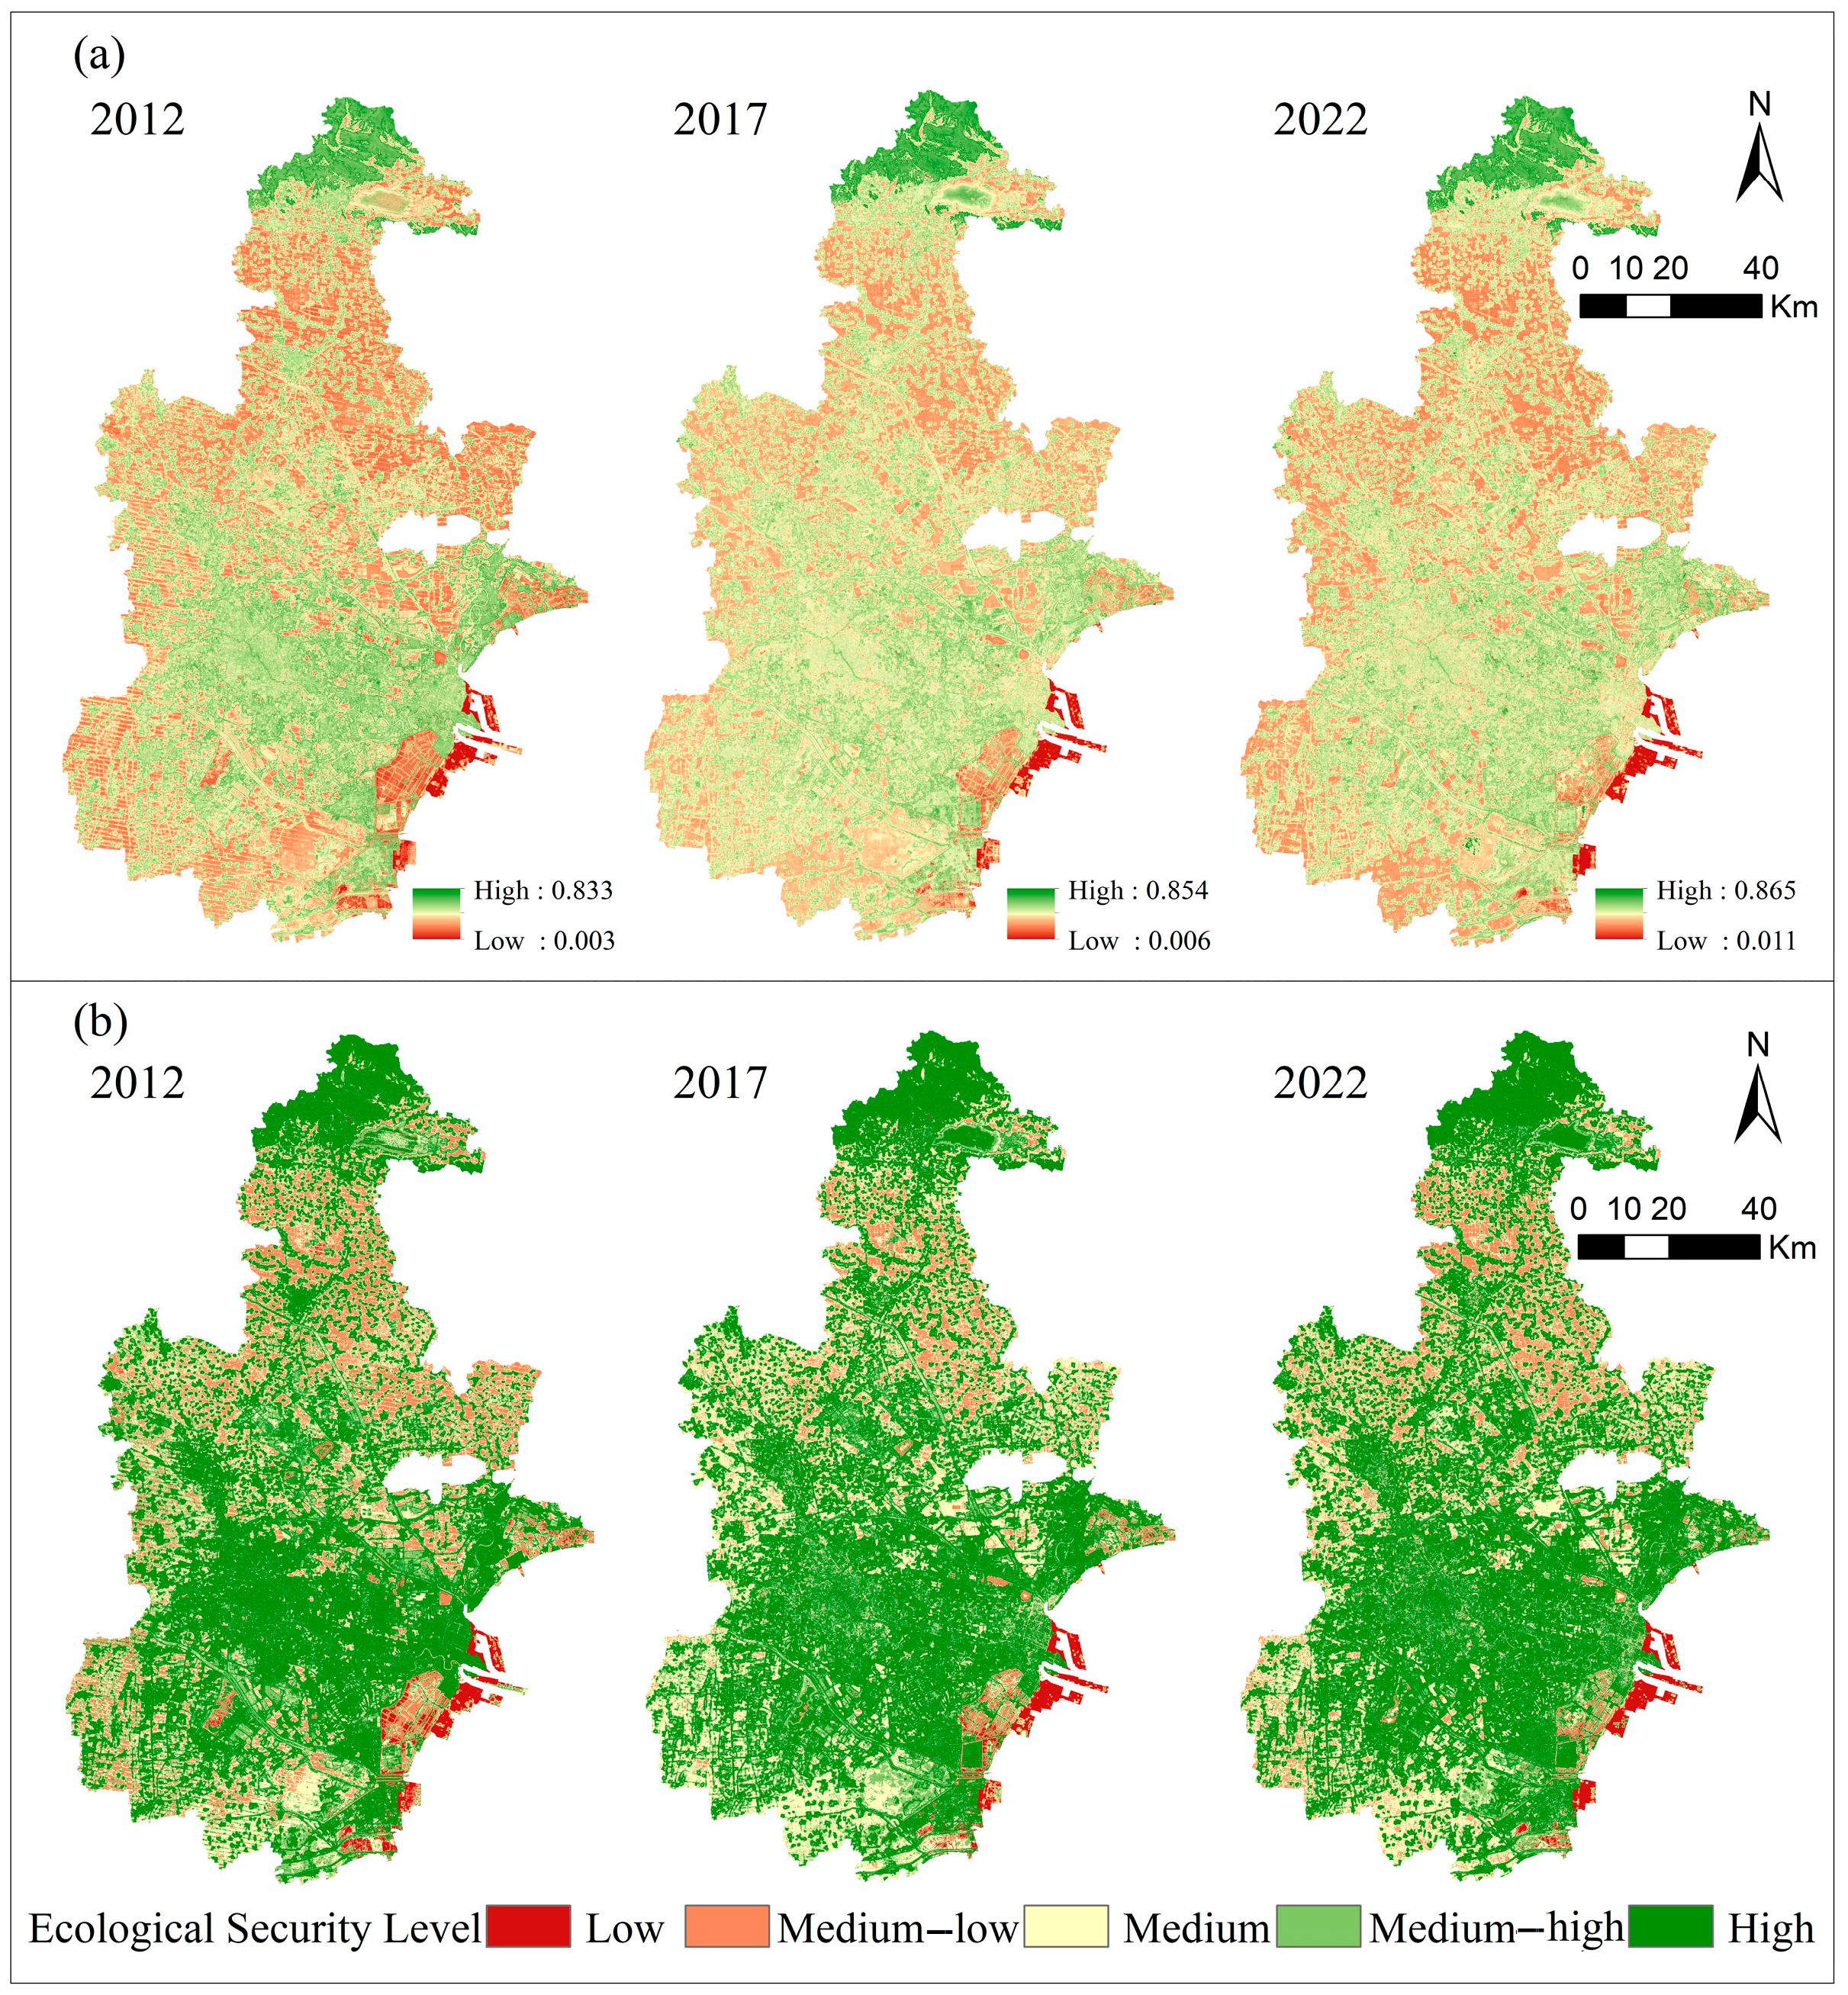
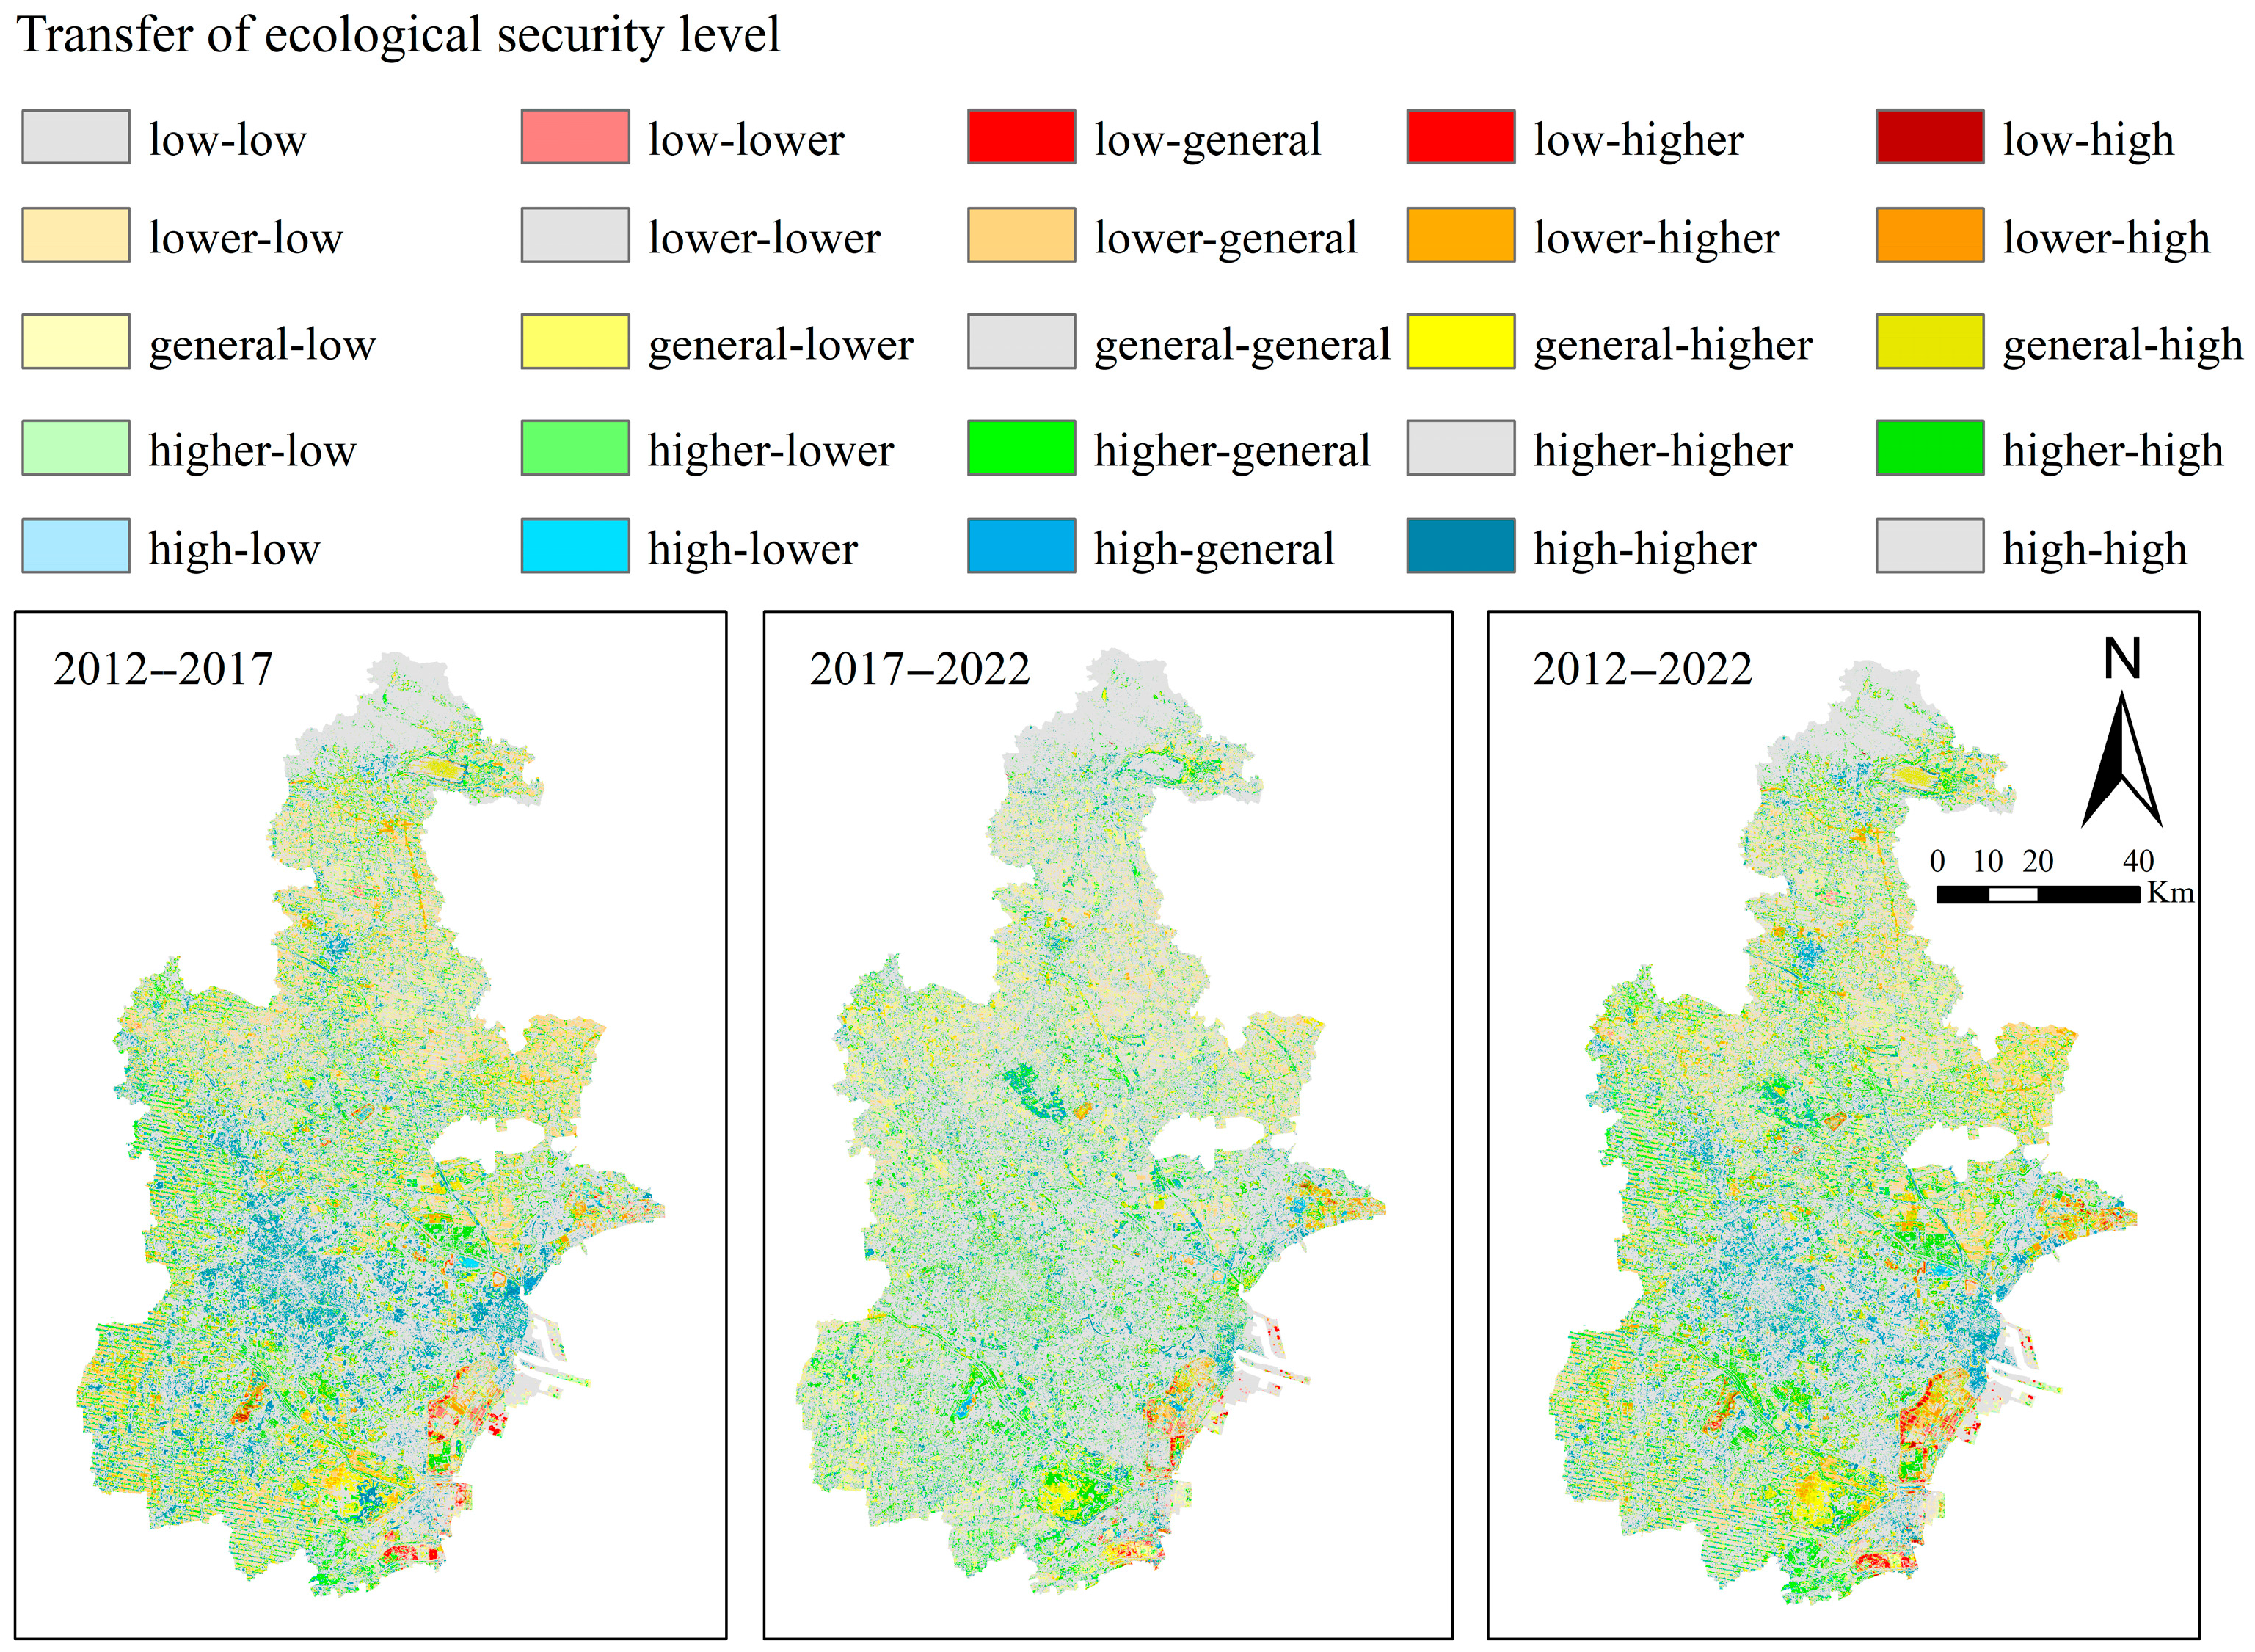
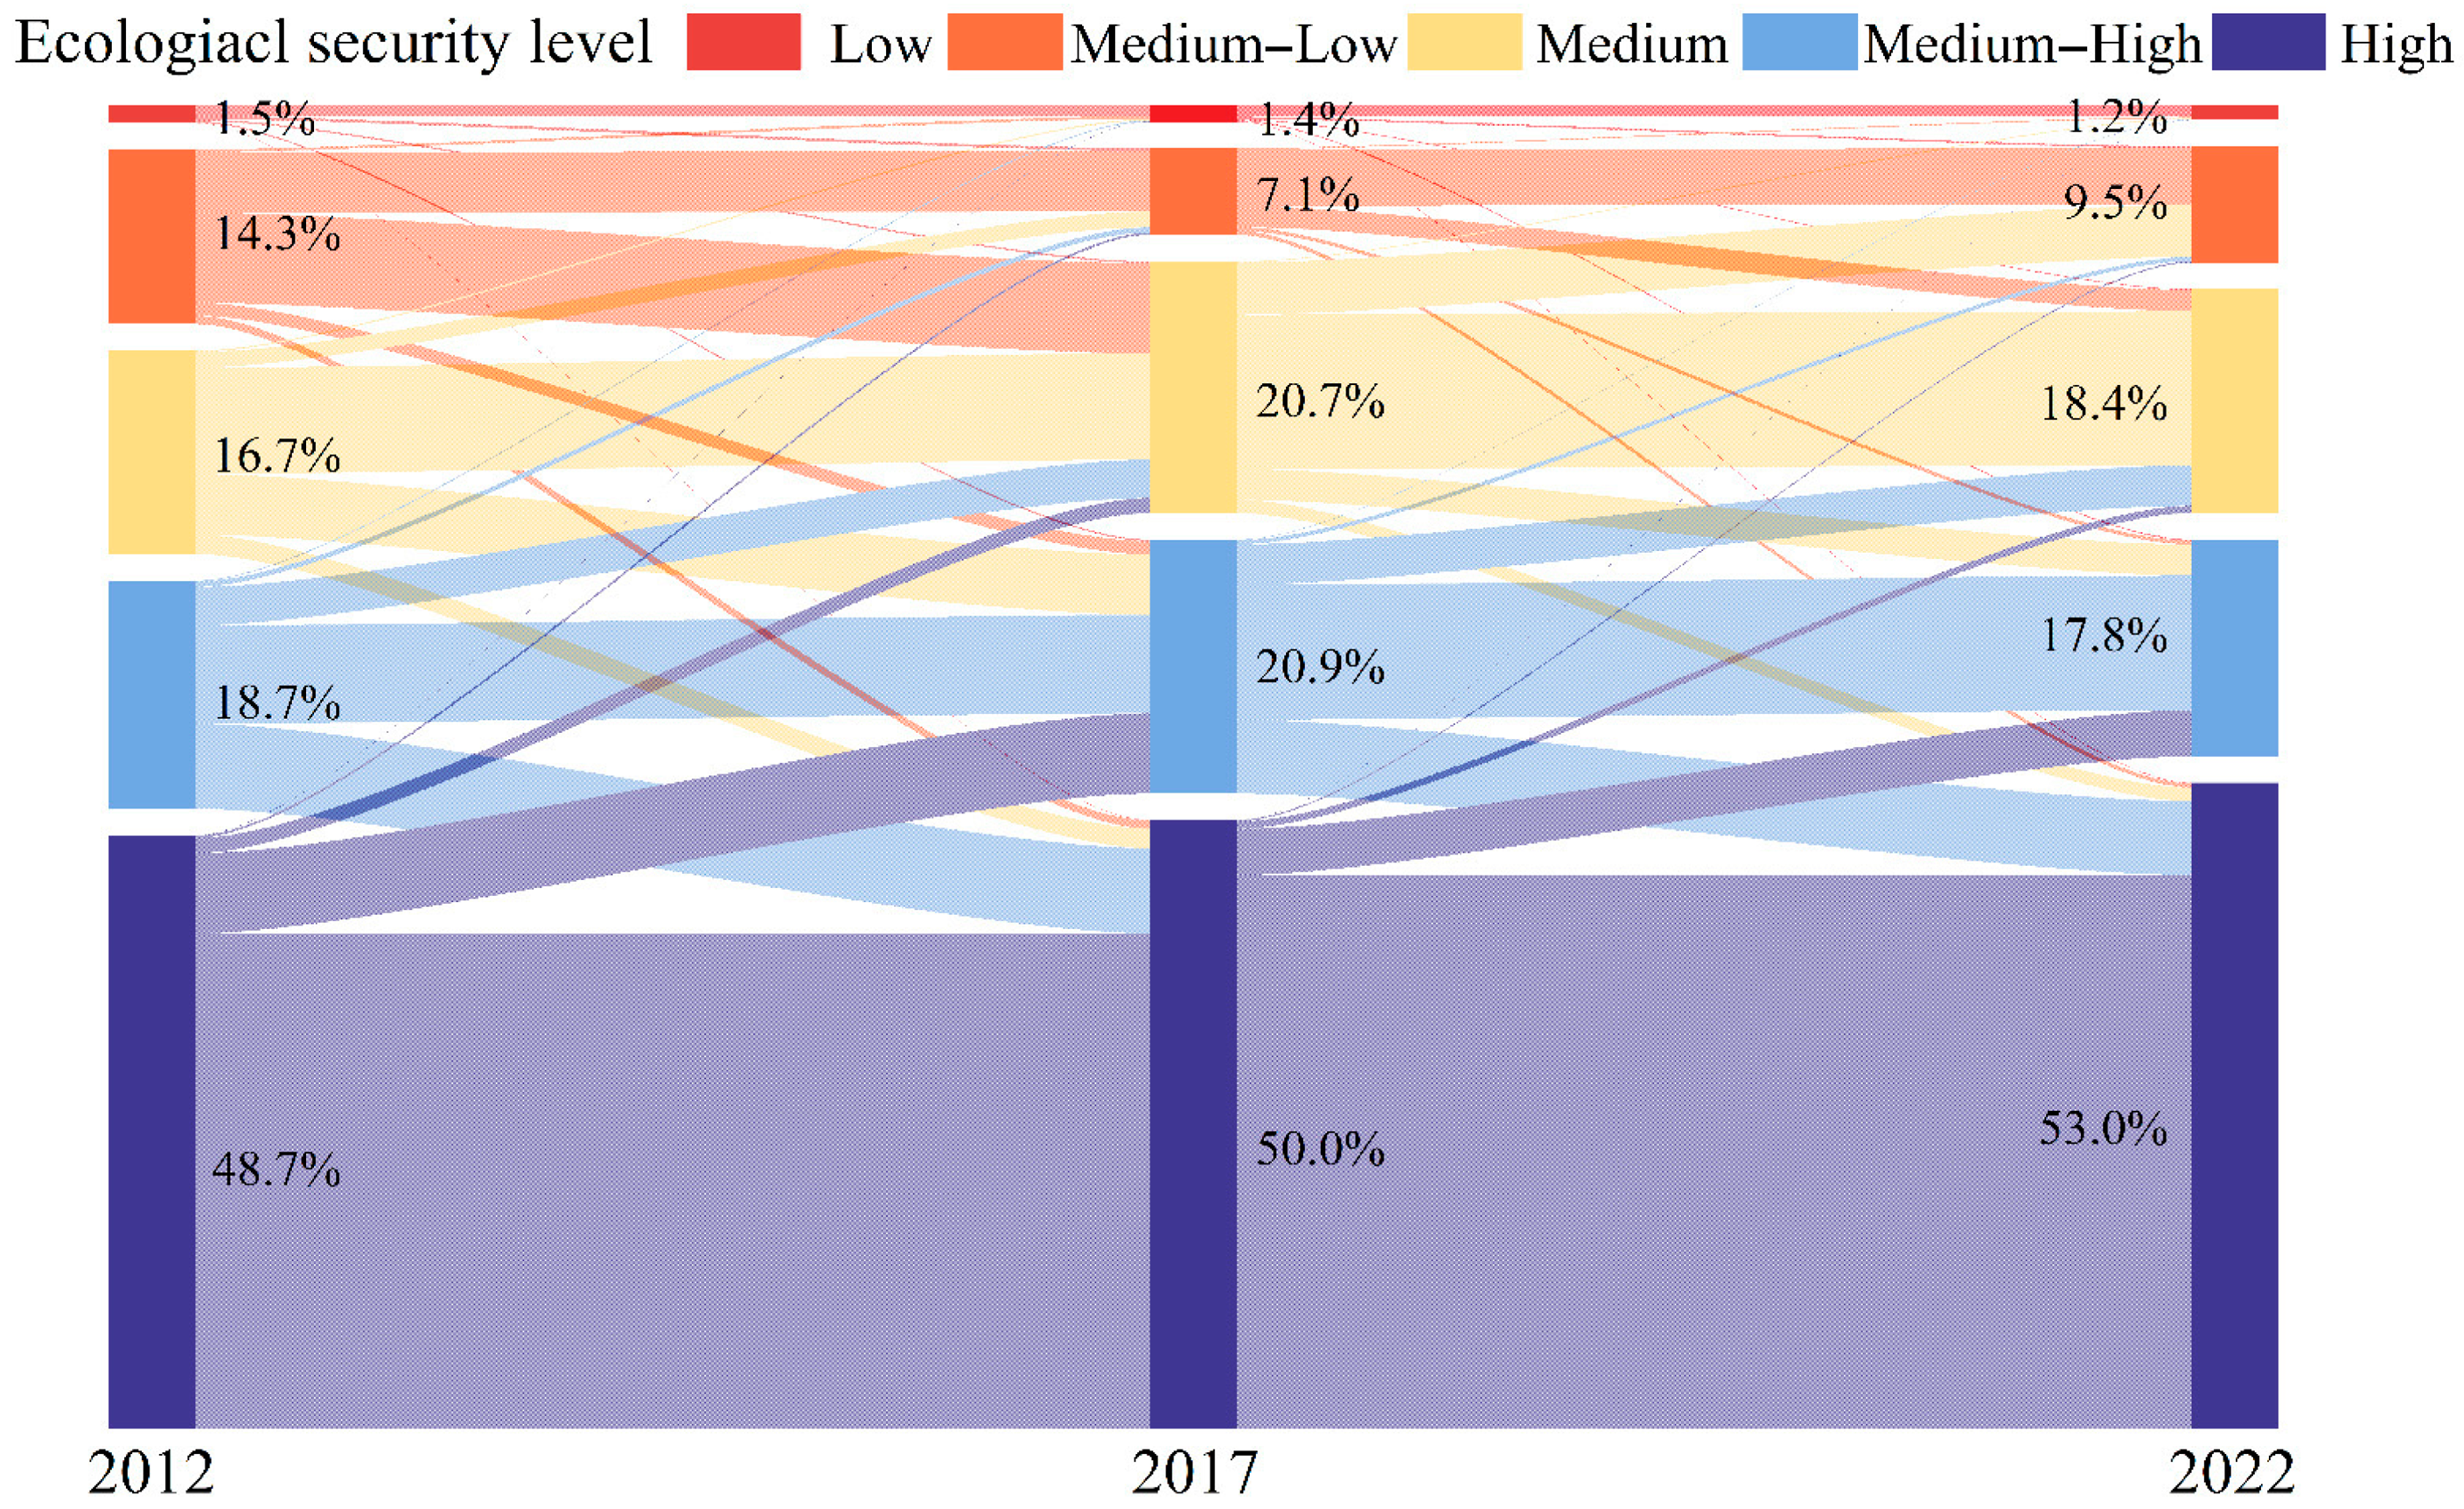
3.3. Spatial and Temporal Changes in Ecological Security

The annual average values of ecological security in Tianjin were 0.496, 0.493, and 0.499, respectively, revealing that the ecological security status was stable during the study period, exhibiting a decline followed by a rise, with an increase of 0.605%. Overall, the ecological security level of Tianjin is high in the north and center and low in the surrounding areas, especially in the coastal area (Figure 5). The ecological security level in Tianjin from 2012 to 2022 is dominated by medium-high and high security levels, accounting for approximately 69.70% of the city. The data show that a high security level represents the most significant proportion, accounting for 50.57% of the total. This is followed by a medium-high security level at 19.13% and a medium security level at 18.60%, which are similar in proportion. Medium-low and low security levels have the smallest shares at 10.30% and 1.37%, respectively (Figure 5). Spatially, medium-low and low security levels are mainly concentrated in the southern part of Jizhou District, Baodi District, the southern part of Xiqing District, and the central coastal area of the Binhai New Area; medium security levels are distributed in Wuqing and Ninghe Districts; and medium-high and high security levels are distributed in Beichen, Dongli, Jinnan, Hongqiao, Heping, Hedong, Hexi, Heibei, Nankai, and Jinghai Districts (Figure 5). Ecological security assessment can serve as a scientific basis for regional spatial planning. For example, Zhang et al. evaluated the ecological security level of the central plains urban agglomeration and proposed a regional optimization plan of “three zones, two belts and one zone” [14]. Xu et al. quantified the ecological security status of the Xiliu Ditch Basin of the Yellow River and divided it into security value areas of different levels, providing a basis for constructing the regional pattern [67].
To observe the changes at different ecological security levels, spatial analysis was used to detect the change processes from 2012 to 2022 (Figure 6). Furthermore, a Sankey diagram was used to show the changes in different ecological security levels (Figure 7). From 2012 to 2022, the area with low security levels shows a continuous downward trend, the area with medium-low security levels shows a downward trend followed by an upward trend, and the areas with both medium and medium-high security levels show an upward trend followed by a downward trend. High-security areas show a continuous upward trend. The overall ecological security level showed an increasing trend from 2012 to 2017, mainly concentrated in the central-northern region of Tianjin and the southern part of the city. Specifically, low- and medium-low security level areas decreased, whereas medium and above security level areas increased. Moreover, ecological security levels showed a stable trend from 2017 to 2022. Overall, the ecological environment of Tianjin improved, and the ecological security level showed an increasing trend from 2012 to 2022. The ecological security changes were relatively stable and dominated by areas with unchanged levels, accounting for 63.72% of the total area; areas with increased levels accounted for 23.09% of the total area, and areas with decreased levels accounted for 13.20% of the total area (Figure 8).

3.4. Driving Mechanism of Ecological Security

3.4.1. Single-Factor Analysis

The results of the factor detector revealed variations in the explanatory power of different factors for ecological security. Table 5 lists the explanatory power of the 11 drivers of ecological security in Tianjin in 2012, 2017, and 2022. The average explanatory power of each driver was obtained by calculating the average explanatory power of each driver over the three years. The average explanatory powers of the drivers were ranked. The results are as follows: SHDI (0.3531), SHEI (0.3230), vegetation type (0.2836), elevation (0.2121), mean annual temperature (0.2091), aspect (0.1487), NTL (0.1269), EVI (0.1142), population density (0.0782), mean annual precipitation (0.0555), and slope (0.0555).
From the perspective of explanatory power, SHDI was considered the dominant factor influencing changes in ecological security in Tianjin, with an explanatory power of more than 35% and the highest q-value. This was followed by SHEI, vegetation type, elevation, and mean annual temperature, with an explanatory power of more than 20%. The explanatory power of the other factors on ecological security was weaker, especially population density, mean annual precipitation, and slope, whose q-values were lower than 0.079. Among the natural environment factors, elevation, mean annual temperature, and aspect were the three drivers with the most substantial explanatory power, with an average q-value of more than 0.20; among the human activity factors, NTL was the driver with the most substantial explanatory power; and among ecosystem status factors, SHDI, SHEI, and vegetation type were the main drivers, with an average q-value of more than 0.28. Throughout the study period, ecosystem status factors had the most significant influence on the ecological security of Tianjin, surpassing the natural environment and human activity factors.

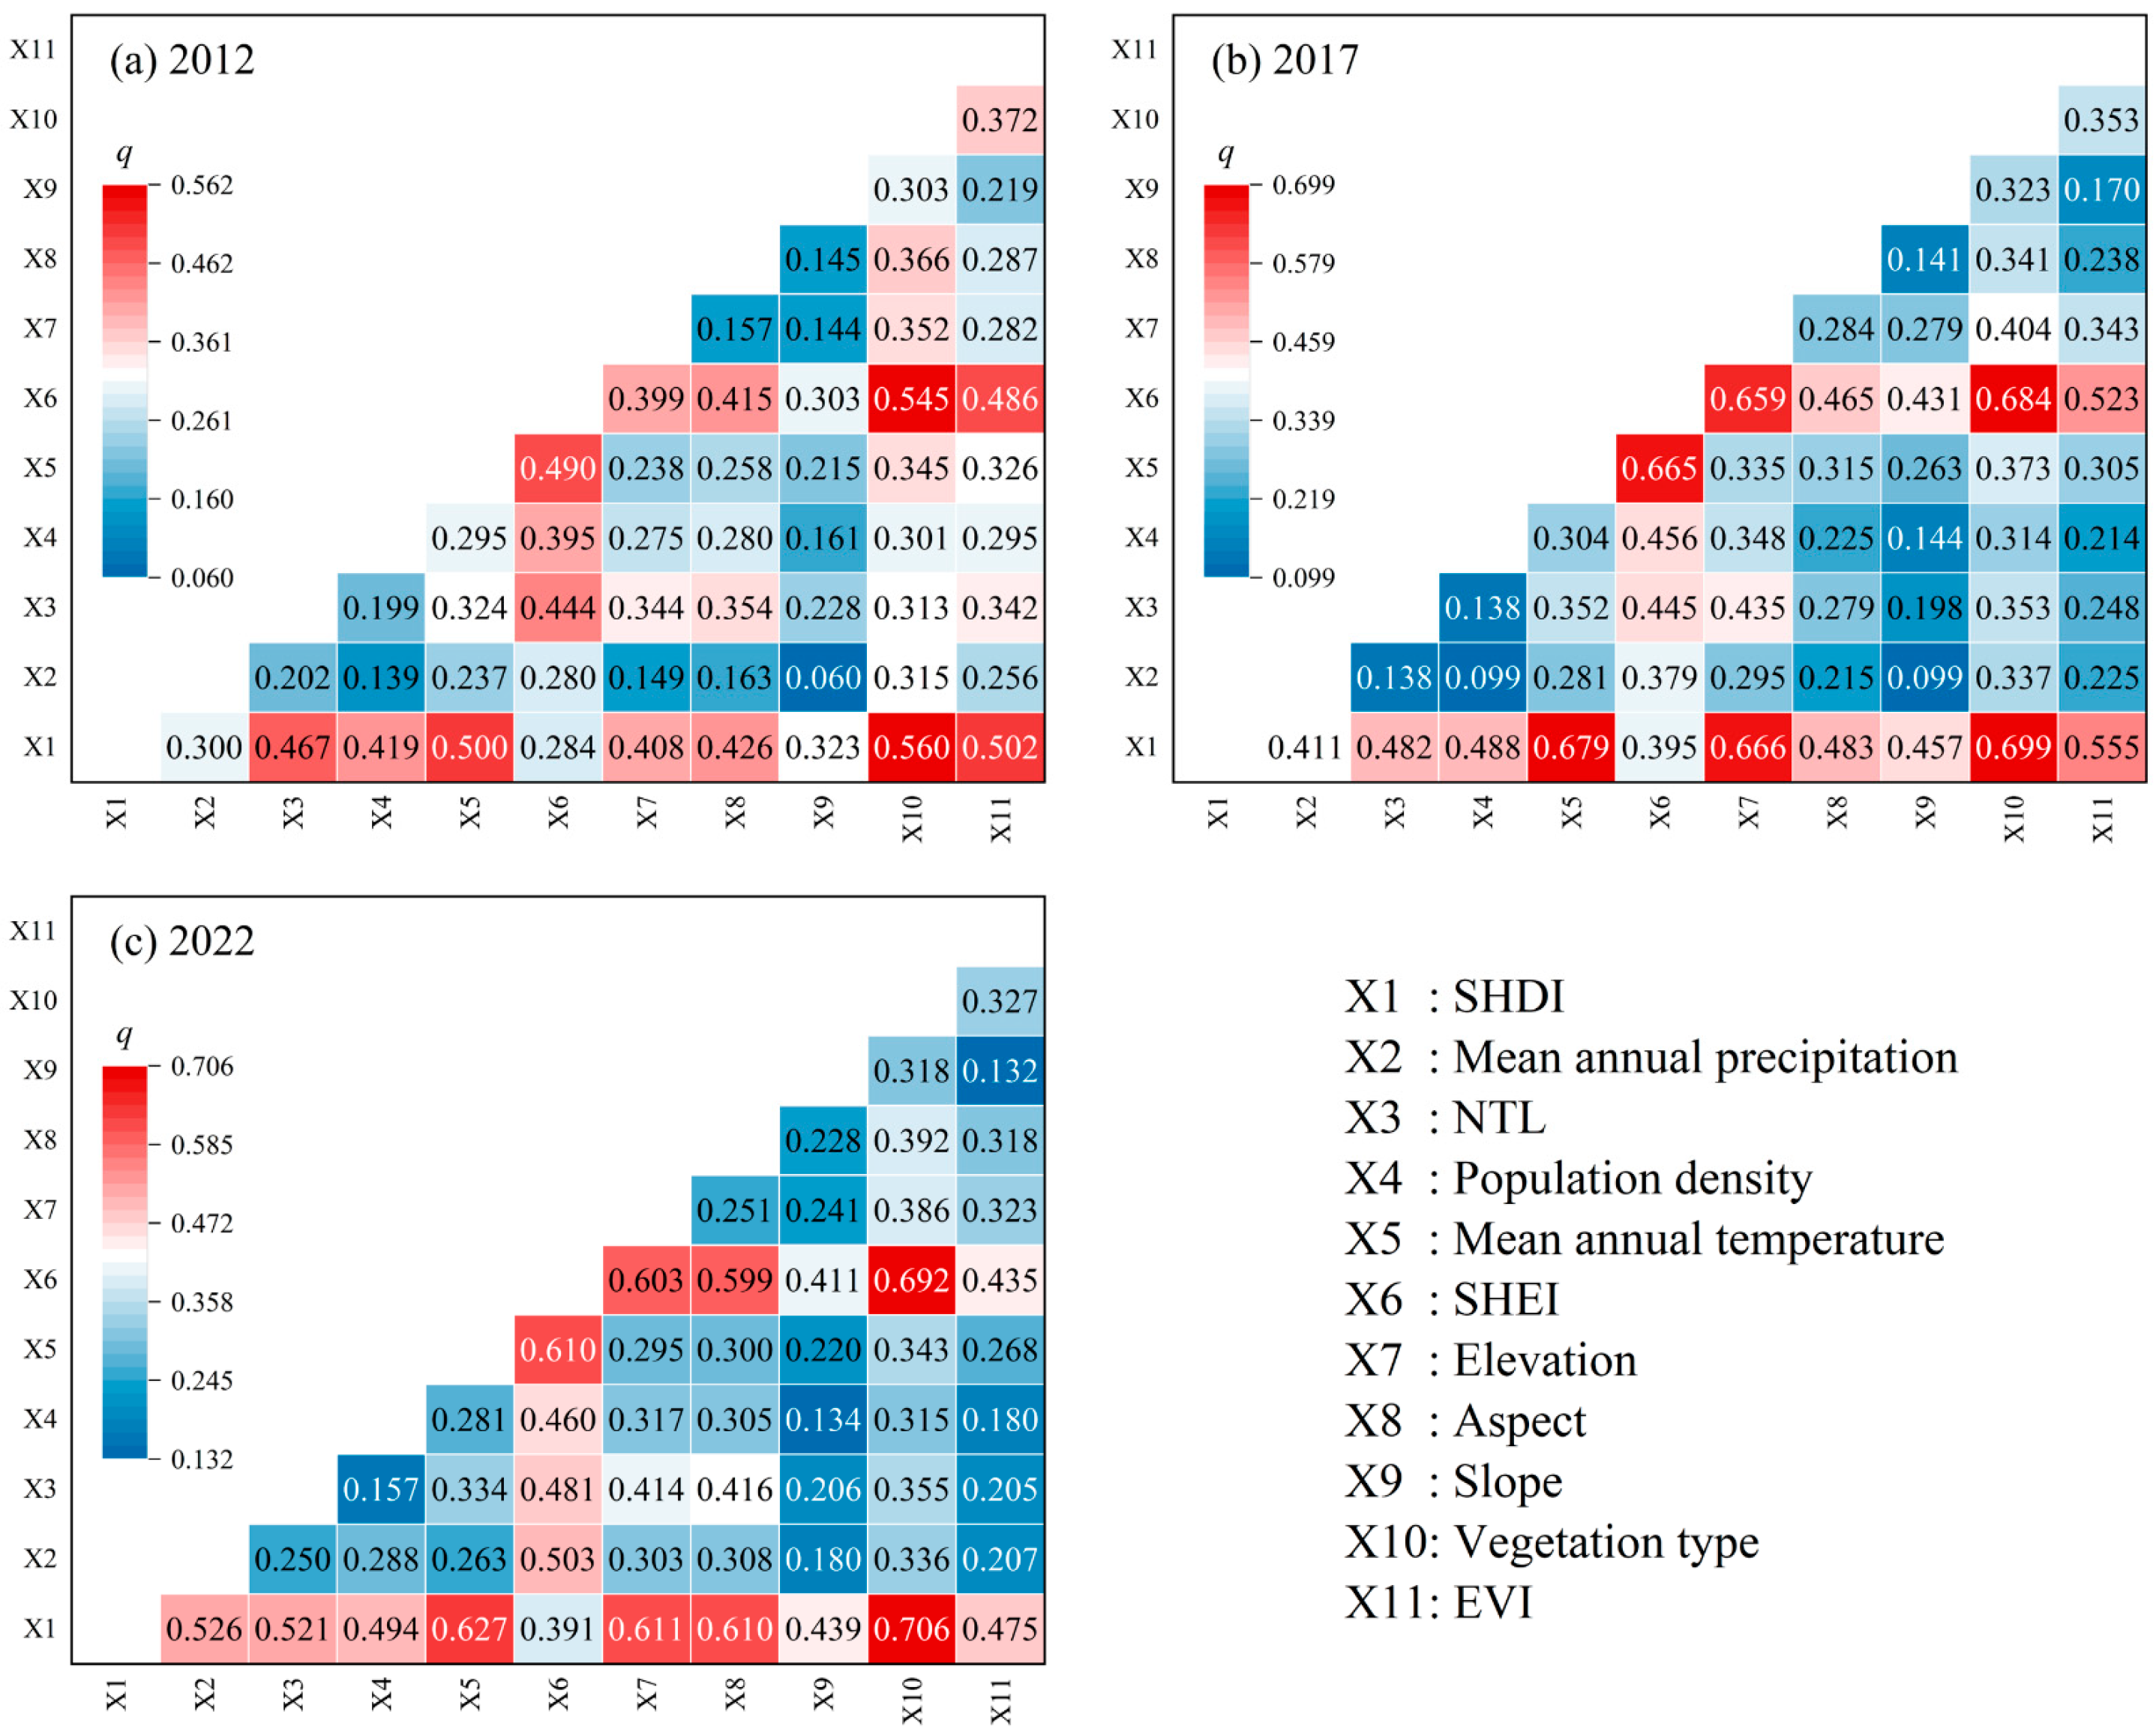
3.4.2. Detection of Factor Interactions

An interaction detector was used to identify interactions for the 11 metrics listed above. Figure 9 shows the results of 165 pairwise interactions over three years. In general, the interaction results of all factors were enhanced, and most of the interactions were nonlinearly enhanced, indicating that the effects of any two drivers on the ecological security of Tianjin were greater than those of a single driver. This suggests that multiple drivers determine the ecological security status of Tianjin. In 2012, the interaction q-value of SHDI and vegetation type was 0.5602, which was the interaction result of the maximum values. Among all the interactions, there were seven groups with interaction q-values greater than 0.45, namely, NTL and SHDI, mean annual temperature and SHDI, vegetation type and SHDI, EVI and SHDI, mean annual temperature and SHEI, vegetation type and SHEI, and EVI and SHEI, which were mainly focused on the interactions between ecosystem statistical factors, and the interactions between these drivers had the most significant impact on changes in ecological security in Tianjin. Generally, the interactions among factors in 2017 and 2022 show a continuous upward trend compared with 2012. The interaction q-value of the SHDI and vegetation type was the largest among all the factor interaction results, which indicated that the interaction of the two drivers, SHDI and vegetation type, had the most significant effect on the ecological security of Tianjin. Overall, the spatial heterogeneity of ecological security in Tianjin results from the joint interactions of multiple factors.

4. Discussion

4.1. Comparison of Ecological Security Assessment Results in Tianjin

The results of this study suggest that Tianjin’s ecological security status remained relatively stable from 2012 to 2022, which is consistent with the findings of Peng et al. [68]. This stability is linked to the intensified land use and industrial restructuring in Tianjin. For example, the shift towards eco-friendly industries and stricter environmental regulations under the “12th Five-Year Plan on Environmental Protection” (2011–2015) was pivotal in reducing ecological pressure. Additionally, distinct differences in ecological security are evident between the northern and southern regions. The northern mountainous areas, less impacted by urban sprawl, retain higher ecological security. In contrast, the southern coastal areas face greater challenges due to the pressure from urban expansion, industrial development, and higher population density. This pattern is consistent with Peng et al. [68]. The land use change in Tianjin from 2012 to 2022 was primarily driven by industrial structure adjustments and ecological protection policies. Zeng et al. agreed that a series of land regulation policies have curbed the conversion of cropland into construction land [69].

4.2. Driving Forces of Ecological Security

Evaluation systems must be tailored to specific regions, as the factors influencing ecological security vary across different regions. This study identified SHDI, SHEI, vegetation type, and elevation as the principal factors impacting the ecological security of Tianjin. Specifically, SHDI reflects species richness; higher biodiversity enhances ecosystem stability and resilience. SHDI affects the ecosystem health, ultimately influencing ecological security [70]. SHEI supports ecosystem stability, as communities with more evenly distributed species exhibit greater resilience to disturbances [71]. Vegetation type affects habitat structure and ecosystem functions, such as carbon sequestration and water regulation, and thereby influences ecological security [72]. Elevation shapes species distribution and environmental conditions [73]. Vegetation structure determines the spatial distribution of ecological resources, while SHDI improves resource-use efficiency through functional redundancy. Therefore, the interaction between SHDI and vegetation type significantly influences ecological security, once again demonstrating that SHDI and vegetation type are important factors. In conclusion, efforts to enhance ecological security should consider interrelated factors such as natural environments, human activity, and ecosystem status, as these elements are inseparable.

4.3. Limitations and Future Research Direction

Due to the highly complex factors influencing ecological security, the nonlinear interaction mechanisms among different factors have not yet been systematically analyzed. Future research can integrate explainable machine learning with Bayesian networks, incorporating high-resolution remote sensing data to simulate multi-scale feedback mechanisms under dynamic environmental scenarios.

5. Conclusions

This study evaluated the Tianjin ecosystem in multiple dimensions based on land use data. This study explores the ecological security status of Tianjin from 2012 to 2022, clarifying its spatial distribution characteristics and influencing factors. We reached the following conclusions:
(1)
Construction land was the primary land use type that increased, with cropland, water body, and unutilized land showing decreasing trends during the study period, while woodland and grassland exhibited minimal net change.
(2)
Tianjin’s ecosystem health level was dominated by the general level and above, accounting for more than 53.57% of the total area. The sum of the areas with better- and high-quality ecosystem service levels in Tianjin showed a decreasing and then an increasing trend. The proportions of relatively lower- and low-risk areas were more significant, and the proportion of these areas showed a gradual upward trend.
(3)
The Tianjin ecological security index showed a slight upward trend from 2012 to 2022. Ecological security levels were dominated by medium, medium-high, and high security, with the area of medium and high security levels increasing. In contrast, the area of medium-high ecological security levels decreased, gradually transforming into medium- and medium-high security levels. Changes in ecological security were more stable and dominated by areas with unchanged levels, accounting for 63.72% of the total area.
(4)
The SHDI, SHEI, vegetation type, elevation, and mean annual temperature were the main factors affecting Tianjin’s ecological security change. Among them, the interaction of SHDI and vegetation type had the most significant effect on the ecological security of Tianjin.
The results of this study provide a reference for the optimal allocation and sustainable use of ecological resources in Tianjin, China.

Supplementary Materials

The following supporting information can be downloaded from https://www.mdpi.com/article/10.3390/su17146287/s1: Table S1: Data sources; Table S2: Calculation of specific indices of ecosystem organization.

Author Contributions

Conceptualization, T.C.; investigation, T.C.; validation, L.Z.; writing—original draft preparation, T.C.; supervision, Z.Q. and L.Z.; writing—review and editing, Z.Q. and Y.Y. All authors have read and agreed to the published version of the manuscript.

Funding

This study was financially supported by the Natural Science Foundation of Tianjin, China (18ZXSZSF00240), and the S&T Program of Hebei, China (22374203D).

Institutional Review Board Statement

Not applicable.

Informed Consent Statement

Not applicable.

Data Availability Statement

The data presented in this study are available upon request from the corresponding author.

Conflicts of Interest

The authors declare that they have no known competing financial interests or personal relationships that could have appeared to influence the work reported in this paper.

References

  1. Pecl, G.T.; Araújo, M.B.; Bell, J.D.; Blanchard, J.; Bonebrake, T.C.; Chen, I.-C.; Clark, T.D.; Colwell, R.K.; Danielsen, F.; Evengård, B.; et al. Biodiversity Redistribution under Climate Change: Impacts on Ecosystems and Human Well-Being. Science 2017, 355, eaai9214. [Google Scholar] [CrossRef] [PubMed]
  2. Santos de Lima, L.; Magalhães de Oliveira, H.F.; Fleischmann, A.S.; Macedo, M.N. Extreme Drought Is Again Isolating People in Amazonia. Nature 2023, 622, 697. [Google Scholar] [PubMed]
  3. Manca, F.; Benedetti-Cecchi, L.; Bradshaw, C.J.A.; Cabeza, M.; Gustafsson, C.; Norkko, A.M.; Roslin, T.V.; Thomas, D.N.; White, L.; Strona, G. Projected Loss of Brown Macroalgae and Seagrasses with Global Environmental Change. Nat. Commun. 2024, 15, 5344. [Google Scholar] [CrossRef] [PubMed]
  4. Bi, M.; Xie, G.; Yao, C. Ecological Security Assessment Based on the Renewable Ecological Footprint in the Guangdong-Hong Kong-Macao Greater Bay Area, China. Ecol. Indic. 2020, 116, 106432. [Google Scholar] [CrossRef]
  5. Wu, X.; Liu, S.; Sun, Y.; An, Y.; Dong, S.; Liu, G. Ecological Security Evaluation Based on Entropy Matter-Element Model: A Case Study of Kunming City, Southwest China. Ecol. Indic. 2019, 102, 469–478. [Google Scholar] [CrossRef]
  6. Xue, Q.; Zhang, Y.; Zhang, Q.; Wu, Q.; Zhang, X.; Lu, L.; Qin, C. Towards Ecological Security: Two-Thirds of China’s Ecoregions Experienced a Decline in Habitat Quality from 1992 to 2020. Ecol. Indic. 2025, 172, 113275. [Google Scholar] [CrossRef]
  7. Liu, C.; Li, W.; Xu, J.; Zhou, H.; Li, C.; Wang, W. Global Trends and Characteristics of Ecological Security Research in the Early 21st Century: A Literature Review and Bibliometric Analysis. Ecol. Indic. 2022, 137, 108734. [Google Scholar] [CrossRef]
  8. Hodson, M.; Marvin, S. ‘Urban Ecological Security’: A New Urban Paradigm? Int. J. Urban Reg. Res. 2009, 33, 193–215. [Google Scholar] [CrossRef]
  9. Su, Y.; Chen, X.; Liao, J.; Zhang, H.; Wang, C.; Ye, Y.; Wang, Y. Modeling the Optimal Ecological Security Pattern for Guiding the Urban Constructed Land Expansions. Urban For. Urban Green. 2016, 19, 35–46. [Google Scholar] [CrossRef]
  10. Zhu, B.; Hashimoto, S.; Cushman, S.A. Navigating Ecological Security Research over the Last 30 Years: A Scoping Review. Sustain. Sci. 2023, 18, 2485–2498. [Google Scholar] [CrossRef]
  11. Jing, P.; Sheng, J.; Wang, Y.; Hu, T.; Guo, L.; Zhu, R.; Dong, K.; Mahmoud, A.; Liu, Y.; Li, X. Assessing the Ecological Security of the Three Gorges Reservoir Complex Ecosystem Based on the Improved Three-Dimensional Emergy Ecological Footprint Model. Sci. Total Environ. 2024, 933, 173086. [Google Scholar] [CrossRef]
  12. Wang, X.; Tang, X.; Shi, J.; Du, P. Construction and Optimization of Urban and Rural Ecological Security Patterns Based on Ecological Service Importance in a Semi-Arid Region: A Case Study of Lanzhou City. Sustainability 2024, 16, 6177. [Google Scholar] [CrossRef]
  13. Lu, T.; Li, C.; Zhou, W.; Liu, Y. Fuzzy Assessment of Ecological Security on the Qinghai–Tibet Plateau Based on Pressure–State–Response Framework. Remote Sens. 2023, 15, 1293. [Google Scholar] [CrossRef]
  14. Zhang, J.; Qiao, X.; Yang, Y.; Liu, L.; Li, Y.; Zhao, S. Ecological Security Driving Mechanisms and Optimization of Zoning in Chinese Urban Agglomerations: A Case Study of the Central Plains Urban Agglomeration. Ecol. Indic. 2025, 171, 113190. [Google Scholar] [CrossRef]
  15. Xiao, D.; Chen, W. On the Basic Concepts and Contents of Ecological Security. Chin. J. Appl. Ecol. 2002, 13, 354–358. [Google Scholar]
  16. Sun, M.; Zhang, L.; Yang, R.; Li, X.; Zhang, Y.; Lu, Y. Construction of an Integrated Framework for Assessing Ecological Security and Its Application in Southwest China. Ecol. Indic. 2023, 148, 110074. [Google Scholar] [CrossRef]
  17. Ma, X.; Wang, W.; Kang, Y.; Chen, J. Series of Two Transistors Forward ZVZCS Converter with Phase-Shifted Control for High Input Voltage. In Proceedings of the 30th Annual Conference of IEEE Industrial Electronics Society, IECON 2004, Busan, Republic of Korea, 2–6 November 2004; Volume 1, pp. 761–766. [Google Scholar]
  18. Xie, H.; He, Y.; Choi, Y.; Chen, Q.; Cheng, H. Warning of Negative Effects of Land-Use Changes on Ecological Security Based on GIS. Sci. Total Environ. 2020, 704, 135427. [Google Scholar] [CrossRef]
  19. Xie, B.; Jones, P.; Dwivedi, R.; Bao, L.; Liang, R. Evaluation, Comparison, and Unique Features of Ecological Security in Southwest China: A Case Study of Yunnan Province. Ecol. Indic. 2023, 153, 110453. [Google Scholar] [CrossRef]
  20. Zhao, L.; Ma, R.; Yang, Z.; Ning, K.; Chen, P.; Wu, J. Ecosystem Health Risk Assessment of Lakes in the Inner Mongolian Plateau Based on the Coupled AHP-SOM-CGT Model. Ecol. Indic. 2023, 156, 111168. [Google Scholar] [CrossRef]
  21. Yang, Y.; Cai, Z. Ecological Security Assessment of the Guanzhong Plain Urban Agglomeration Based on an Adapted Ecological Footprint Model. J. Clean Prod. 2020, 260, 120973. [Google Scholar] [CrossRef]
  22. Sun, M.; Li, X.; Yang, R.; Zhang, Y.; Zhang, L.; Song, Z.; Liu, Q.; Zhao, D. Comprehensive Partitions and Different Strategies Based on Ecological Security and Economic Development in Guizhou Province, China. J. Clean. Prod. 2020, 274, 122794. [Google Scholar] [CrossRef]
  23. Cheng, H.; Zhu, L.; Meng, J. Fuzzy Evaluation of the Ecological Security of Land Resources in Mainland China Based on the Pressure-State-Response Framework. Sci. Total Environ. 2022, 804, 150053. [Google Scholar] [CrossRef]
  24. Liu, Y.; Zhao, C.; Liu, X.; Chang, Y.; Wang, H.; Yang, J.; Yang, X.; Wei, Y. The Multi-Dimensional Perspective of Ecological Security Evaluation and Drive Mechanism for Baishuijiang National Nature Reserve, China. Ecol. Indic. 2021, 132, 108295. [Google Scholar] [CrossRef]
  25. Zhang, R.; Li, P.; Xu, L. Evaluation and Analysis of Ecological Security Based on the Improved Three-Dimensional Ecological Footprint in Shaanxi Province, China. Ecol. Indic. 2022, 144, 109483. [Google Scholar] [CrossRef]
  26. Li, Y.; Geng, H. Evolution of Land Use Landscape Patterns in Karst Watersheds of Guizhou Plateau and Its Ecological Security Evaluation. Land 2022, 11, 2225. [Google Scholar] [CrossRef]
  27. Wu, M.; Wei, Y.; Lam, P.T.I.; Liu, F.; Li, Y. Is Urban Development Ecologically Sustainable? Ecological Footprint Analysis and Prediction Based on a Modified Artificial Neural Network Model: A Case Study of Tianjin in China. J. Clean. Prod. 2019, 237, 117795. [Google Scholar] [CrossRef]
  28. Zhao, S.; Ma, Y.; Wang, J.; You, X. Landscape Pattern Analysis and Ecological Network Planning of Tianjin City. Urban For. Urban Green. 2019, 46, 126479. [Google Scholar] [CrossRef]
  29. Xue, M.; Luo, Y. Dynamic Variations in Ecosystem Service Value and Sustainability of Urban System: A Case Study for Tianjin City, China. Cities 2015, 46, 85–93. [Google Scholar] [CrossRef]
  30. Chen, X.; Kang, B.; Li, M.; Du, Z.; Zhang, L.; Li, H. Identification of Priority Areas for Territorial Ecological Conservation and Restoration Based on Ecological Networks: A Case Study of Tianjin City, China. Ecol. Indic. 2023, 146, 109809. [Google Scholar] [CrossRef]
  31. Guan, Q.; Chen, J.; Guan, C.; Li, H.; Zhou, X.; Meng, T. The Responses of Ecosystem Services in Coastal Cities to Urbanization in 30 Years: A Case Study of Qingdao City, China. Ocean Coast. Manag. 2024, 258, 107415. [Google Scholar] [CrossRef]
  32. Lv, W.; Xie, Y.; Zeng, P. Assessing and Predicting Spatiotemporal Alterations in Land-Use Carbon Emission and Its Implications to Carbon-Neutrality Target: A Case Study of Beijing-Tianjin-Hebei Region. Land 2024, 13, 2066. [Google Scholar] [CrossRef]
  33. Li, Q.; Li, D.; Wang, J.; Wang, S.; Wang, R.; Fu, G.; Yuan, Y.; Zheng, Z. Spatial Heterogeneity of Ecosystem Service Bundles and the Driving Factors in the Beijing-Tianjin-Hebei Region. J. Clean Prod. 2024, 479, 144006. [Google Scholar] [CrossRef]
  34. Gao, X.; Xie, Y.; Zou, Y.; Li, F.; Deng, Z.; Geng, M.; Zhang, P. Spatiotemporal Evolution and Driving Mechanisms of Land Use in Regions with Frequent Human–Land Interactions: A Case Study in the Dongting Lake Area. Sustainability 2025, 17, 1894. [Google Scholar] [CrossRef]
  35. Zhu, Q.; Cai, Y. Integrating Ecological Risk, Ecosystem Health, and Ecosystem Services for Assessing Regional Ecological Security and Its Driving Factors: Insights from a Large River Basin in China. Ecol. Indic. 2023, 155, 110954. [Google Scholar] [CrossRef]
  36. Wang, Y.; Yang, Z.; Yu, M.; Lin, R.; Zhu, L.; Bai, F. Integrating Ecosystem Health and Services for Assessing Ecological Risk and Its Response to Typical Land-Use Patterns in the Eco-Fragile Region, North China. Environ. Manag. 2023, 71, 867–884. [Google Scholar] [CrossRef]
  37. Jin, W.; Bian, Z.; Dong, Z.; Chen, D. Diagnosis of Ecological Security and the Spatial Heterogeneity of Its Driving Factors in the Mining-Impacted Watershed, Based on Ecosystem Health-Risk-Services Framework. Ecol. Indic. 2024, 167, 112683. [Google Scholar] [CrossRef]
  38. Liu, C.; Li, W.; Xu, J.; Zhou, H.; Wang, W.; Wang, H. Temporal and Spatial Variations of Ecological Security on the Northeastern Tibetan Plateau Integrating Ecosystem Health-Risk-Services Framework. Ecol. Indic. 2024, 158, 111365. [Google Scholar] [CrossRef]
  39. Fu, S.; Zhao, L.; Qiao, Z.; Sun, T.; Sun, M.; Hao, Y.; Hu, S.; Zhang, Y. Development of Ecosystem Health Assessment (EHA) and Application Method: A Review. Sustainability 2021, 13, 11838. [Google Scholar] [CrossRef]
  40. Yang, J.; Xin, Z.; Li, X.; Liang, X. Vigor–Organization–Resilience Framework for Assessing Ecosystem Health in the Qinghai–Xizang Plateau. Ecosyst. Health Sustain. 2024, 10, 0260. [Google Scholar] [CrossRef]
  41. Peng, J.; Liu, Y.; Wu, J.; Lv, H.; Hu, X. Linking Ecosystem Services and Landscape Patterns to Assess Urban Ecosystem Health: A Case Study in Shenzhen City, China. Landsc. Urban Plan. 2015, 143, 56–68. [Google Scholar] [CrossRef]
  42. Lei, D.; Zhang, Y.; Ran, Y.; Gao, L.; Li, J.; Li, Z.; Mo, J.; Liu, X. Assessment of Ecosystem Health Based on Landscape Pattern in Ecologically Fragile Regions at Different Spatial Scales: A Case Study of Dianchi Lake Basin, China. Front. Environ. Sci. 2023, 11, 1076344. [Google Scholar] [CrossRef]
  43. Lei, J.; Li, C.; Yang, W. Ecosystem Health Assessment and Approaches to Improve Sichuan Province Based on an Improved Vigor Organization Resilience Model. Ecol. Indic. 2023, 155, 110925. [Google Scholar] [CrossRef]
  44. Zhou, Y.; Yue, D.; Li, S.; Liang, G.; Chao, Z.; Zhao, Y.; Meng, X. Ecosystem Health Assessment in Debris Flow-Prone Areas: A Case Study of Bailong River Basin in China. J. Clean Prod. 2022, 357, 131887. [Google Scholar] [CrossRef]
  45. Xiao, R.; Liu, Y.; Fei, X.; Yu, W.; Zhang, Z.; Meng, Q. Ecosystem Health Assessment: A Comprehensive and Detailed Analysis of the Case Study in Coastal Metropolitan Region, Eastern China. Ecol. Indic. 2019, 98, 363–376. [Google Scholar] [CrossRef]
  46. Ashour, M.; Mahdiyar, A. A Comprehensive State-of-the-Art Survey on the Recent Modified and Hybrid Analytic Hierarchy Process Approaches. Appl. Soft. Comput. 2024, 150, 111014. [Google Scholar] [CrossRef]
  47. Liu, B.; Huang, J.J.; McBean, E.; Li, Y. Risk Assessment of Hybrid Rain Harvesting System and Other Small Drinking Water Supply Systems by Game Theory and Fuzzy Logic Modeling. Sci. Total Environ. 2020, 708, 134436. [Google Scholar] [CrossRef]
  48. Peng, J.; Zhang, J. Urban Flooding Risk Assessment Based on GIS- Game Theory Combination Weight: A Case Study of Zhengzhou City. Int. J. Disaster Risk Reduct. 2022, 77, 103080. [Google Scholar] [CrossRef]
  49. Lv, T.; Zeng, C.; Lin, C.; Liu, W.; Cheng, Y.; Li, Y. Towards an Integrated Approach for Land Spatial Ecological Restoration Zoning Based on Ecosystem Health Assessment. Ecol. Indic. 2023, 147, 110016. [Google Scholar] [CrossRef]
  50. Shen, W.; Li, Y.; Qin, Y. Research on the Influencing Factors and Multi-Scale Regulatory Pathway of Ecosystem Health: A Case Study in the Middle Reaches of the Yellow River, China. J. Clean Prod. 2023, 406, 137038. [Google Scholar] [CrossRef]
  51. Pan, Z.; He, J.; Liu, D.; Wang, J. Predicting the Joint Effects of Future Climate and Land Use Change on Ecosystem Health in the Middle Reaches of the Yangtze River Economic Belt, China. Appl. Geogr. 2020, 124, 102293. [Google Scholar] [CrossRef]
  52. Pan, Z.; He, J.; Liu, D.; Wang, J.; Guo, X. Ecosystem Health Assessment Based on Ecological Integrity and Ecosystem Services Demand in the Middle Reaches of the Yangtze River Economic Belt, China. Sci. Total Environ. 2021, 774, 144837. [Google Scholar] [CrossRef]
  53. Li, W.; Wang, Y.; Xie, S.; Cheng, X. Spatiotemporal Evolution Scenarios and the Coupling Analysis of Ecosystem Health with Land Use Change in Southwest China. Ecol. Eng. 2022, 179, 106607. [Google Scholar] [CrossRef]
  54. Zhang, H.; Liu, Y.; Li, J.; Tian, P.; Zhong, J.; Gong, H. Evaluation and Analysis of Coastal Complex Ecological Resilience Based on Multidimensional Data: A Case Study of East China Sea. Ecol. Indic. 2023, 155, 110981. [Google Scholar] [CrossRef]
  55. Costanza, R.; De Groot, R.; Braat, L.; Kubiszewski, I.; Fioramonti, L.; Sutton, P.; Farber, S.; Grasso, M. Twenty Years of Ecosystem Services: How Far Have We Come and How Far Do We Still Need to Go? Ecosyst. Serv. 2017, 28, 1–16. [Google Scholar] [CrossRef]
  56. Yang, L.; Liu, Y.; Liu, Y.; Liu, R. Spatial-Temporal Dynamics and Drivers of Ecosystem Service Interactions along the Yellow River Area in Shaanxi Province. J. Clean. Prod. 2025, 496, 145095. [Google Scholar] [CrossRef]
  57. Angarita, H.; Sharp, R.; Chaumont, N.; Tallis, H.; Ricketts, T.; Guerry, A.; Wood, S.; Chaplin-Kramer, R.; Nelson, E.; Ennaanay, D. InVEST 3.16.0 User’s Guide; Natural Capital Project; Stanford University: Stanford, CA, USA; University of Minnesota: Minneapolis, MN, USA; Chinese Academy of Sciences: Beijing, China; The Nature Conservancy: Arlington County, VA, USA; World Wildlife Fund: Gland, Switzerland; Stockholm Resilience Centre: Stockholm, Sweden; Royal Swedish Academy of Sciences: Stockholm, Sweden, 2025. [Google Scholar]
  58. Lang, Y.; Song, W. Quantifying and Mapping the Responses of Selected Ecosystem Services to Projected Land Use Changes. Ecol. Indic. 2019, 102, 186–198. [Google Scholar] [CrossRef]
  59. Xu, M.; Matsushima, H. Multi-Dimensional Landscape Ecological Risk Assessment and Its Drivers in Coastal Areas. Sci. Total Environ. 2024, 908, 168183. [Google Scholar] [CrossRef]
  60. Lin, X.; Wang, Z. Landscape Ecological Risk Assessment and Its Driving Factors of Multi-Mountainous City. Ecol. Indic. 2023, 146, 109823. [Google Scholar] [CrossRef]
  61. Zeng, J.; Wu, J.; Chen, W. Coupling Analysis of Land Use Change with Landscape Ecological Risk in China: A Multi-Scenario Simulation Perspective. J. Clean Prod. 2024, 435, 140518. [Google Scholar] [CrossRef]
  62. Na, L.; Zhao, Y.; Feng, C.-C.; Guo, L. Regional Ecological Risk Assessment Based on Multi-Scenario Simulation of Land Use Changes and Ecosystem Service Values in Inner Mongolia, China. Ecol. Indic. 2023, 155, 111013. [Google Scholar] [CrossRef]
  63. Wang, Q.; Zhang, P.; Chang, Y.; Li, G.; Chen, Z.; Zhang, X.; Xing, G.; Lu, R.; Li, M.; Zhou, Z. Landscape Pattern Evolution and Ecological Risk Assessment of the Yellow River Basin Based on Optimal Scale. Ecol. Indic. 2024, 158, 111381. [Google Scholar] [CrossRef]
  64. Gao, W.; Huang, Z.; Li, X.; Ji, B.; Li, N.; Li, S.; Liu, X.; Zeng, Q.; Sun, G.; Zhao, D. The Spatial–Temporal Changes and Driving Factors of Desertification in the Wuliangsuhai Watershed Based on Remote Sensing. Ecol. Indic. 2024, 169, 112851. [Google Scholar] [CrossRef]
  65. Gao, R.; Cai, H.; Xu, X. Analysis of Driving Factors of Cropland Productivity in Northeast China Using OPGD-SHAP Framework. Land 2025, 14, 1010. [Google Scholar] [CrossRef]
  66. Zhao, X.; Tan, S.; Li, Y.; Wu, H.; Wu, R. Quantitative Analysis of Fractional Vegetation Cover in Southern Sichuan Urban Agglomeration Using Optimal Parameter Geographic Detector Model, China. Ecol. Indic. 2024, 158, 111529. [Google Scholar] [CrossRef]
  67. Xu, X.; Wang, S.; Yan, G.; He, X. Ecological Security Assessment Based on the “Importance–Sensitivity–Connectivity” Index and Pattern Construction: A Case Study of Xiliu Ditch in the Yellow River Basin, China. Land 2023, 12, 1296. [Google Scholar] [CrossRef]
  68. Peng, W.; Sun, Y.; Liu, C.; Liu, D. Study on Urban Land Ecological Security Pattern and Obstacle Factors in the Beijing–Tianjin–Hebei Region. Sustainability 2023, 15, 43. [Google Scholar] [CrossRef]
  69. Zeng, L.; Yang, L.; Su, L.; Hu, H.; Feng, C. The Impact of Policies on Land Use and Land Cover Changes in the Beijing–Tianjin–Hebei Region in China. Environ. Impact Assess. Rev. 2025, 110, 107676. [Google Scholar] [CrossRef]
  70. Keller, N.; Niklaus, P.A.; Ghazoul, J.; Marfil, T.; Godoong, E.; Philipson, C.D. Biodiversity Consequences of Long-Term Active Forest Restoration in Selectively-Logged Tropical Rainforests. For. Ecol. Manag. 2023, 549, 121414. [Google Scholar] [CrossRef]
  71. Yip, K.H.A.; Liu, R.; Wu, J.; Hau, B.C.H.; Lin, Y.; Zhang, H. Community-Based Plant Diversity Monitoring of a Dense-Canopy and Species-Rich Tropical Forest Using Airborne LiDAR Data. Ecol. Indic. 2024, 158, 111346. [Google Scholar] [CrossRef]
  72. Fang, Z.; Bai, Y.; Jiang, B.; Alatalo, J.M.; Liu, G.; Wang, H. Quantifying Variations in Ecosystem Services in Altitude-Associated Vegetation Types in a Tropical Region of China. Sci. Total Environ. 2020, 726, 138565. [Google Scholar] [CrossRef]
  73. Ma, S.; Wang, L.-J.; Ye, L.; Jiang, J. Vegetation Restoration Thresholds under Different Vegetation Types and Altitude Gradients in the Sichuan-Yunnan Ecological Shelter, China. J. Environ. Manag. 2023, 340, 117910. [Google Scholar] [CrossRef]
Figure 1. The research framework.
Sustainability 17 06287 g001
Figure 2. The location of the study area.
Sustainability 17 06287 g002
Figure 3. Spatial variations among different land use types in different periods (1: cropland; 2: construction land; 3: unutilized land; 4: woodland; 5: water body; 6: grassland).
Sustainability 17 06287 g003
Figure 4. Spatial patterns and changing trends in ecological ‘health, services, and risk’ in Tianjin: (a) ecosystem health level, (b) ecosystem services level, and (c) ecological risk level.
Sustainability 17 06287 g004
Figure 5. Spatial pattern and changing trend in Tianjin from 2012 to 2022: (a) IESI and (b) ecological security level.
Sustainability 17 06287 g005
Figure 6. Spatial distribution of ecological security level transfer matrix in Tianjin during 2012–2022.
Sustainability 17 06287 g006
Figure 7. Sankey diagram of ecological security level transfer matrix in Tianjin during 2012–2022.
Sustainability 17 06287 g007
Figure 8. Spatiotemporal changes in ecological security level in Tianjin from 2012 to 2022.
Sustainability 17 06287 g008
Figure 9. Interaction of different driving factors by OPGD in Tianjin during 2012–2022.
Sustainability 17 06287 g009
Table 1. Resistance coefficient and resilience coefficient for different land use types.
CroplandWoodlandGrasslandWater BodyUnutilized LandConstruction LandWeights
Resilience coefficient0.30.80.80.70.10.20.6
Resistance coefficient0.51.00.70.80.20.30.4
Table 2. Transformed areas of each land cover type in Tianjin from 2012 to 2017 (unit: km2).
2017
CroplandWoodlandGrasslandWater BodyUnutilized LandConstruction LandTotal
2
0
1
2
Cropland6145.17.92.361.50.0334.76551.4
Woodland9.0344.10.10.00.00.6353.9
Grassland3.63.521.70.20.31.230.5
Water Body115.80.00.0878.07.796.51098.1
Unutilized Land0.80.00.23.58.05.718.2
Construction Land0.70.00.042.40.23453.33496.5
Total6275.0355.524.2985.616.23892.011,548.6
Table 3. Transformed areas of each land cover type in Tianjin from 2017 to 2022 (unit: km2).
2022
CroplandWoodlandGrasslandWater BodyUnutilized LandConstruction LandTotal
2
0
1
7
Cropland6036.912.23.864.10.0158.06275.0
Woodland14.8340.00.40.00.00.3355.5
Grassland3.91.518.60.10.00.224.2
Water Body107.70.20.0828.50.348.9985.6
Unutilized Land0.30.00.47.43.84.316.2
Construction Land0.60.00.027.50.03863.93892.0
Total6164.2353.923.2927.64.14075.611,548.6
Table 4. Transformed areas of each land cover type in Tianjin from 2012 to 2022 (unit: km2).
2022
CroplandWoodlandGrasslandWater BodyUnutilized LandConstruction LandTotal
2
0
1
2
Cropland5962.515.84.486.10482.56551.4
Woodland19.1332.90.90.100.9353.9
Grassland6.15.017.40.40.11.430.5
Water Body172.20.10782.41.9141.51098.1
Unutilized Land0.600.46.31.98.918.2
Construction Land3.79052.30.13440.43496.5
Total6164.2353.923.2927.64.14075.611,548.6
Table 5. q-values of each driving factor by OPGD in Tianjin.
TypeDriving Factorq in 2012q in 2017q in 2022
Natural
environments
Mean annual temperature0.1941 *0.2374 *0.1958 *
Mean annual precipitation0.0174 *0.0189 *0.1303 *
Elevation0.1270 *0.2735 *0.2359 *
Aspect0.1362 *0.0870 *0.2230 *
Slope0.0372 *0.0706 *0.0587 *
Human activityPopulation density0.1095 *0.0619 *0.0633 *
NTL0.1777 *0.0926 *0.1103 *
Ecosystem statusVegetation type0.2691 *0.2901 *0.2915 *
SHDI0.2812 *0.3913 *0.3867 *
SHEI0.2605 *0.3576 *0.3510 *
EVI0.1932 *0.0997 *0.0498 *
* significant at the 0.01 level.
Disclaimer/Publisher’s Note: The statements, opinions and data contained in all publications are solely those of the individual author(s) and contributor(s) and not of MDPI and/or the editor(s). MDPI and/or the editor(s) disclaim responsibility for any injury to people or property resulting from any ideas, methods, instructions or products referred to in the content.

