Article

A Sustainable Solution for High-Standard Farmland Construction—NGO–BP Model for Cost Indicator Prediction in Fertility Enhancement Projects

College of Water Conservancy, Shenyang Agricultural University, Shenyang 110866, China
*
Author to whom correspondence should be addressed.
Sustainability 2025, 17(14), 6250; https://doi.org/10.3390/su17146250
Submission received: 18 June 2025 / Revised: 4 July 2025 / Accepted: 7 July 2025 / Published: 8 July 2025

Abstract

High-standard farmland fertility enhancement projects can lead to the sustainable utilization of arable land resources. However, due to difficulties in project implementation and uncertainties in costs, resource allocation efficiency is constrained. To address these challenges, this study first analyzes the impact of geography and engineering characteristics on cost indicators and applies principal component analysis (PCA) to extract key influencing factors. A hybrid prediction model is then constructed by integrating the Northern Goshawk Optimization (NGO) algorithm with a Backpropagation Neural Network (BP). The NGO–BP model is compared with the RF, XGBoost, standard BP, and GA–BP models. Using data from China’s 2025 high-standard farmland fertility enhancement projects, empirical validation shows that the NGO–BP model achieves a maximum RMSE of only CNY 98.472 across soil conditioning, deep plowing, subsoiling, and fertilization projects—approximately 30.74% lower than those of other models. The maximum MAE is just CNY 88.487, a reduction of about 32.97%, and all R2 values exceed 0.914, representing an improvement of roughly 5.83%. These results demonstrate that the NGO–BP model offers superior predictive accuracy and generalization ability compared to other approaches. The findings provide a robust theoretical foundation and technical support for agricultural resource management, the construction of projects, and project investment planning.

1. Introduction

Food security represents a critical national strategy, with farmland serving as the foundation of agricultural production and a vital resource. Soil fertility plays a decisive role in determining both crop yield and quality and functions as the core carrier for implementing the strategies of “storing grain in the land, storing grain in technology” [1,2]. At present, traditional farmland production relies heavily on inputs such as labor, fertilizers, pesticides, and plastic mulch. The complex pattern of high input and output has intensified the conflict between production efficiency and quality demands [3,4,5,6]. High-quality farmland fertility enhancement projects, such as those centered on soil conditioning, deep plowing and loosening, optimized fertilization, and straw return, have emerged as key approaches to improving soil structure and nutrient use efficiency. The systematic implementation of such projects can protect arable land, reduce environmental risks, and provide long-term support for sustainable agricultural development [7,8,9].
Significant gaps remain in current research regarding the economic evaluation and technological dissemination of farmland fertility enhancement projects. In particular, the lack of scientifically supported cost estimation models poses substantial challenges, including high investment risks and difficulties in controlling fertilization costs [10,11,12,13]. The present study focuses on developing a predictive model for cost indicators in fertility enhancement projects, aiming to establish quantitative relationships between influencing factors and cost metrics. This model is intended to serve as a decision-making tool for optimizing resource allocation and formulating targeted investment strategies, thereby promoting the transformation of fertility enhancement efforts from technical implementation to system-level efficiency optimization in support of national food security goals.
Cost indicator prediction methods have been widely applied across various engineering domains, with numerous scholars proposing effective modeling approaches that have yielded notable results. These methods can generally be categorized into statistical prediction techniques and machine learning-based approaches.
Statistical prediction methods include the autoregressive (AR) model [14], multiple linear regression (MLR) analysis [15], and grey system prediction [16]. Lin et al. [17] proposed an MLR model to estimate product manufacturing costs, demonstrating through empirical analysis that the model achieves high fitting accuracy and predictive performance. Ottaviani et al. [18] applied MLR to develop an engineering management optimization model and introduced a novel EAC prediction formula with improved accuracy and reduced error. However, both AR and linear regression models are limited to capturing linear relationships in raw data. Grey system prediction, while theoretically flexible, exhibits low tolerance to data uncertainty and requires a large volume of samples. These limitations hinder its effectiveness in modeling nonlinear patterns, making it unsuitable for predicting cost indicators in fertility enhancement projects, where nonlinearity is a prominent feature.
With the rapid development of artificial intelligence, machine learning models have been increasingly adopted by researchers and engineers to address a range of predictive challenges in the engineering domain. Models such as support vector regression (SVR) [19,20], backpropagation (BP) neural networks, random forests (RFs) [21,22], and convolutional neural networks (CNNs) [23] have been widely applied in construction management, cost estimation, and soil fertility assessment [24,25,26,27]. For example, Khanal et al. [28] integrated remote sensing imagery to build six predictive models, including linear regression, RF, and XGBoost, and demonstrated that the RF model outperformed the others in predicting maize yield and soil characteristics with higher accuracy and robustness. Hu et al. [29] considered both natural and anthropogenic drivers of soil nutrient variation and developed an RF model to estimate nutrient levels. The model outperformed XGBoost in mapping nitrogen, phosphorus, and potassium concentrations, confirming its superior predictive capability. Zhang et al. [
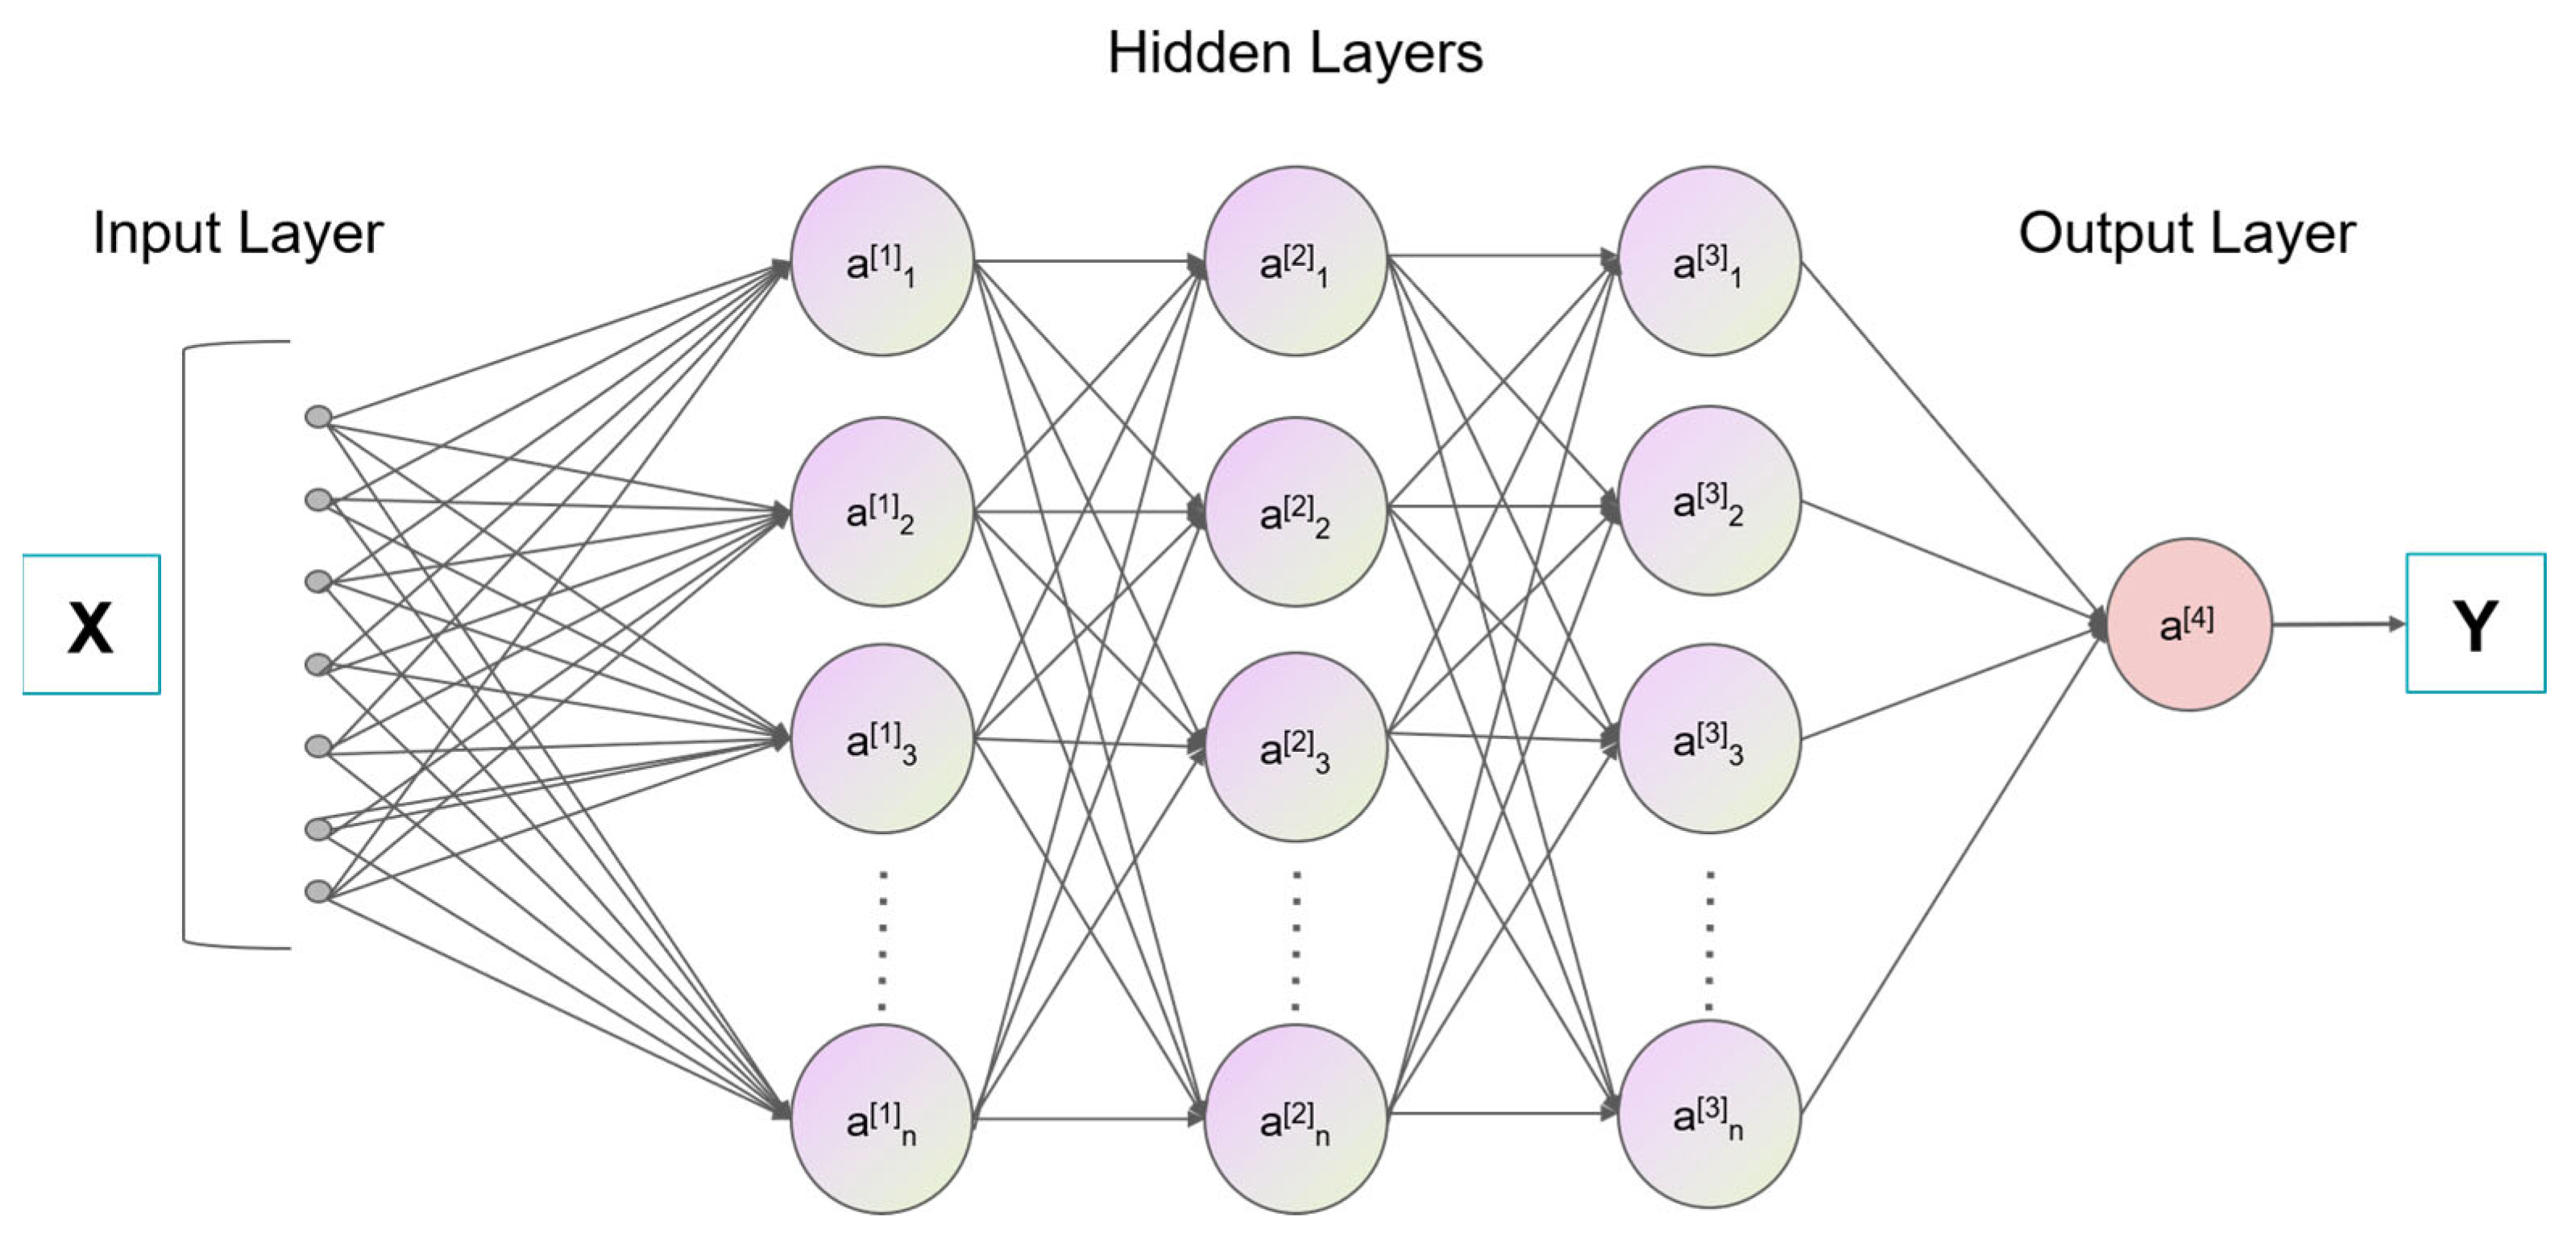
30] employed principal component analysis (PCA) and Pearson correlation to identify key logging parameters for coalbed methane prediction. A BP neural network model constructed using these variables achieved approximately 61% higher prediction accuracy compared to RF, XGBoost, and k-nearest neighbor (KNN) models. This model demonstrated high efficiency and precision in estimating gas content, offering strong applicability in coal seam exploration and resource evaluation. Among existing machine learning approaches, BP neural networks are particularly effective in modeling nonlinear relationships between variables, making them well-suited for predicting cost indicators in farmland fertility enhancement projects [31].
Redundant information increases the computational burden and compromises both the robustness and generalization capability of predictive models. The accuracy of model predictions is highly dependent on the quality of input data, underscoring the importance of feature selection to reduce the dimensionality of raw datasets. Wyke et al. [32] utilized PCA to eliminate redundancy in high-dimensional data and to ensure variable independence, thereby enhancing compatibility with predictive modeling [33]. In addition to data preprocessing, model performance is critically influenced by hyperparameter selection. Recent studies have increasingly adopted optimization algorithms to improve prediction accuracy through automated hyperparameter tuning [34,35]. Li et al. [36] employed a genetic algorithm (GA) to optimize the weights and thresholds of a BP neural network, developing a GA–BP model for construction cost prediction in Guangdong Province that achieved a coefficient of determination of 0.94, validating its effectiveness. Chang et al. [37] constructed a BP neural network model. To improve predictive performance, they applied the Northern Goshawk Optimization (NGO) algorithm for parameter optimization and demonstrated that the NGO–BP model outperformed the DBO–BP model in accuracy. Among various optimization methods, NGO has demonstrated a strong global search capacity and rapid convergence toward near-optimal solutions [38,39], making it well-suited for hyperparameter tuning in BP neural networks. Given the non-temporal and nonlinear nature of the engineering cost data in this study, four widely used models (RF, XGBoost, BP, and GA–BP) were selected for comparative analysis against the proposed NGO–BP model.
The construction of farmland fertility enhancement projects serves as a fundamental strategy for improving soil structure and increasing nutrient use efficiency, underscoring the necessity of accurate cost prediction models. A review of the literature on cost indicator modeling shows that most existing models are applied in sectors such as building construction, water conservancy, and power transmission [40,41,
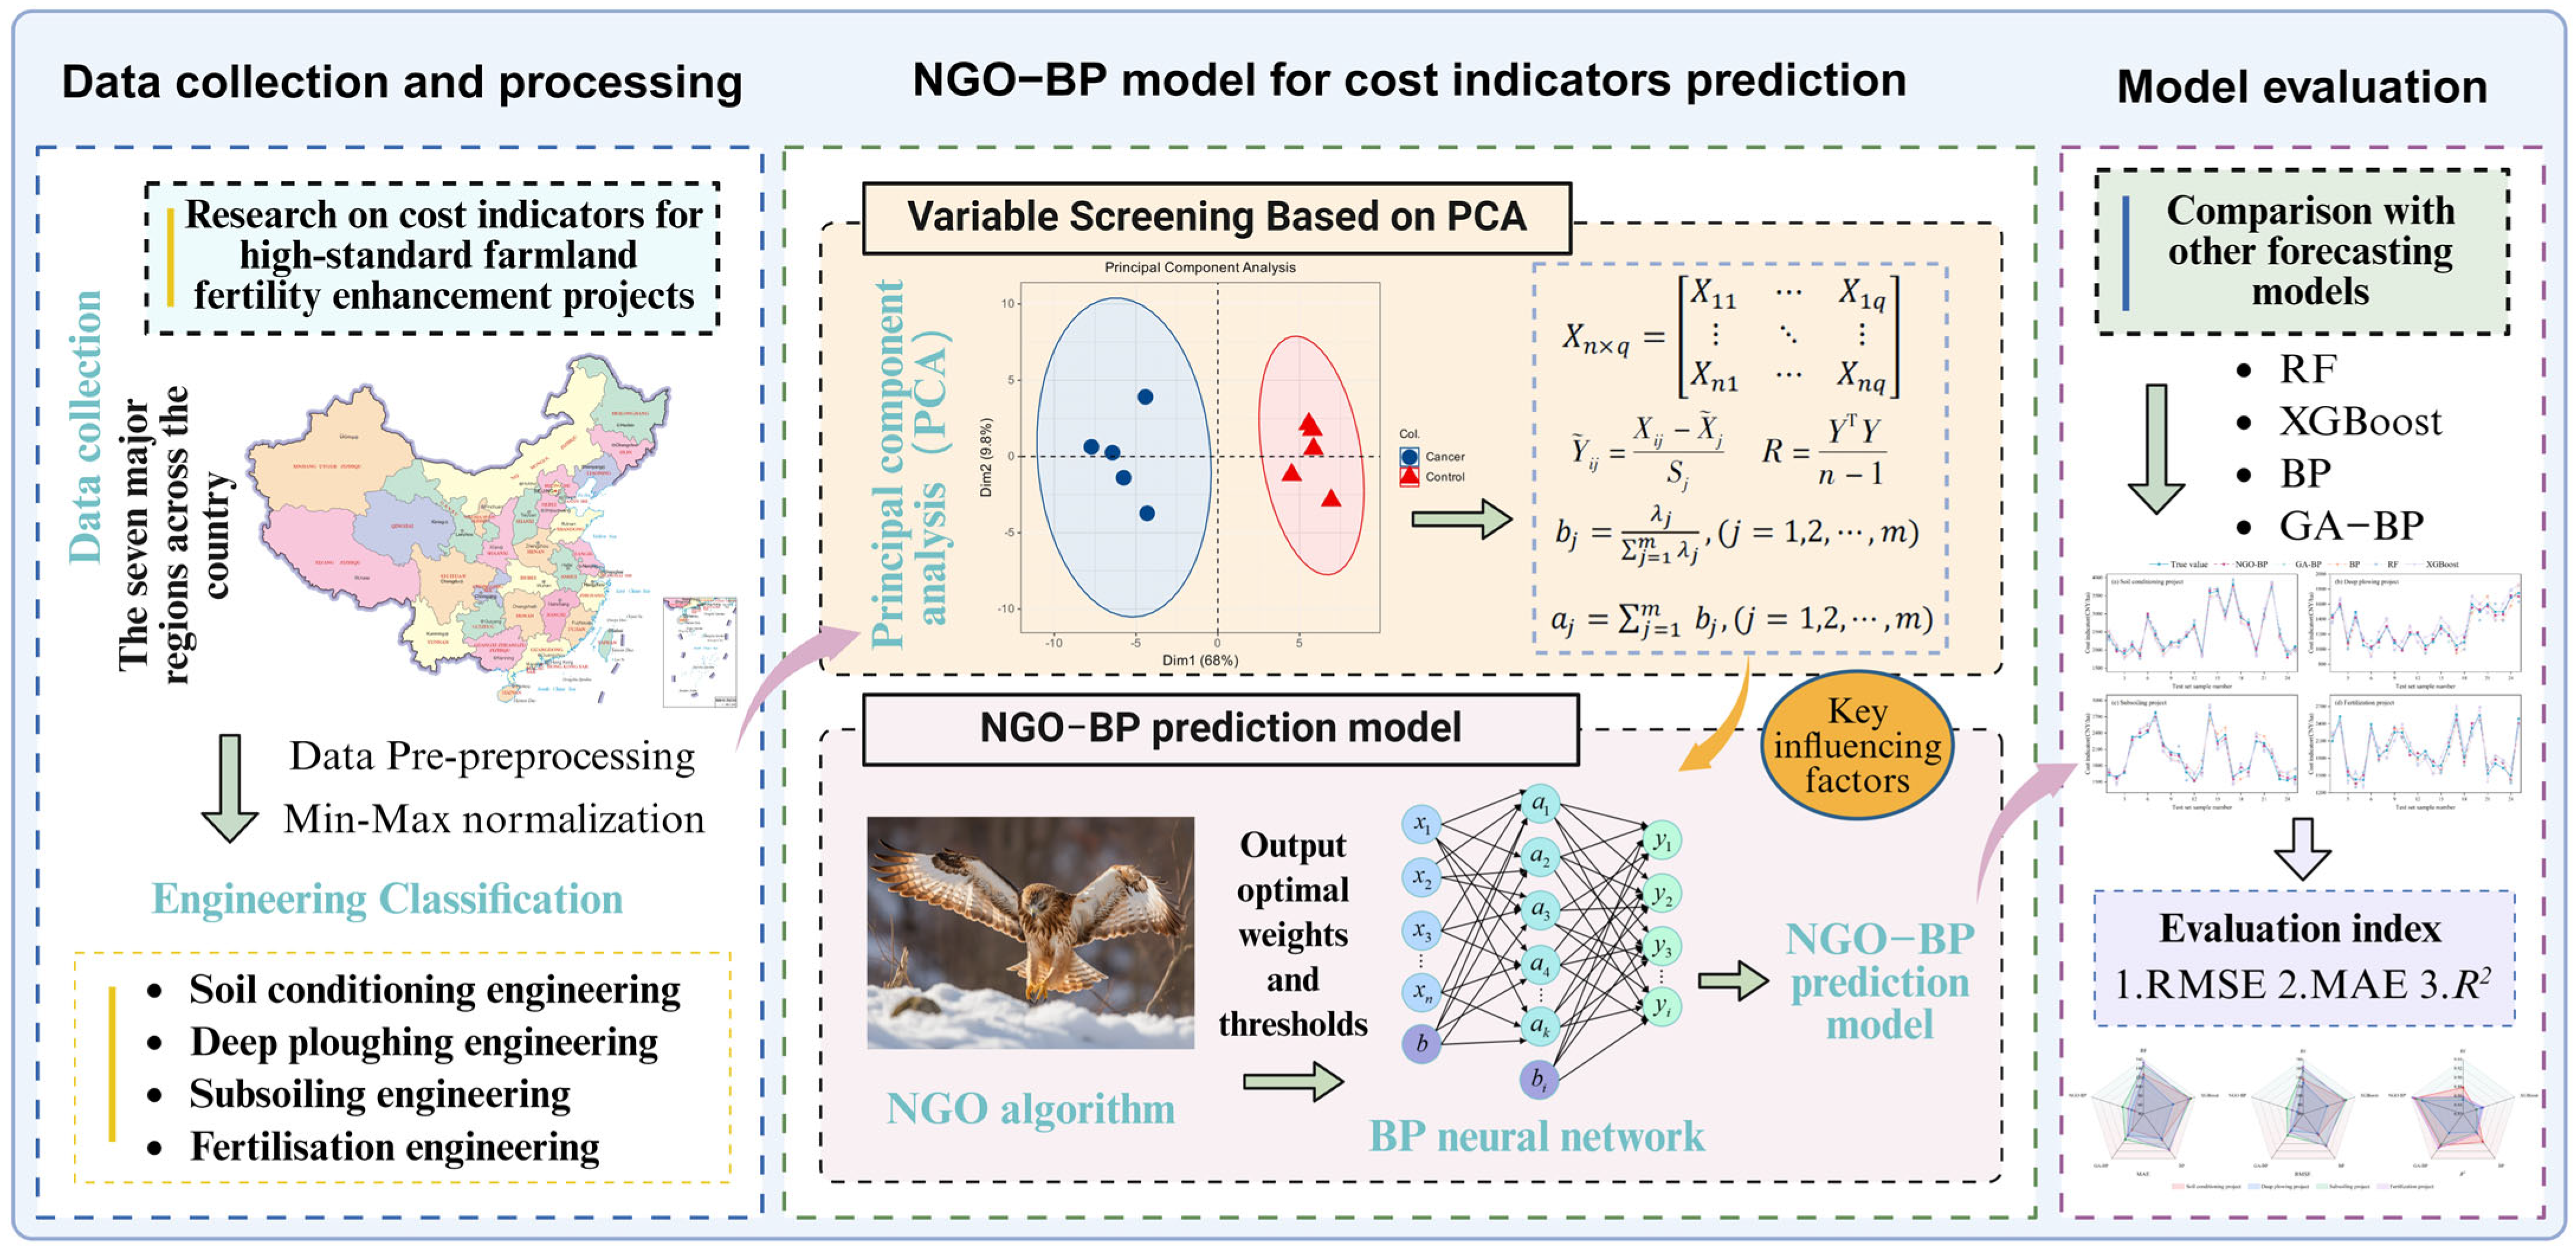
42], while research specifically addressing cost prediction in fertility enhancement projects remains limited. In this study, PCA was applied to identify and reduce the dimensionality of relevant influencing factors, isolating the key variables associated with project costs. Qualitative variables were subsequently quantified, and a BP neural network optimized by the NGO algorithm was developed. The proposed NGO–BP model enables cost indicator prediction across diverse engineering types and environmental conditions. This modeling approach provides a practical reference for regional investment planning, promotes more refined cost management throughout the entire lifecycle of high-standard farmland construction, and supports optimal resource allocation and evidence-based investment decisions. Accordingly, this study offers not only a theoretical framework for cost prediction in fertility enhancement projects but also a technical foundation to advance the sustainable development of agricultural production.
The innovation of this study lies in constructing a cost indicator prediction model for fertility enhancement projects. Based on PCA screening, an indicator system of influencing factors for fertility enhancement project costs is established. The NGO algorithm optimizes the BP model to establish a combined NGO–BP prediction model. This algorithm outperforms others in parameter optimization. Simultaneously, the prediction model precisely captures nonlinear variations among different soil fertility improvement project data. The overall model performance surpasses other prediction models. Through variable screening and algorithm optimization, it aims to enhance prediction accuracy and generalization capability.
The remainder of this paper is organized as follows: Section 2 introduces the study area and data sources, along with the principal component analysis, BP neural network model, and NGO algorithm. Specific steps for predicting fertility enhancement project cost indicators are also presented. 
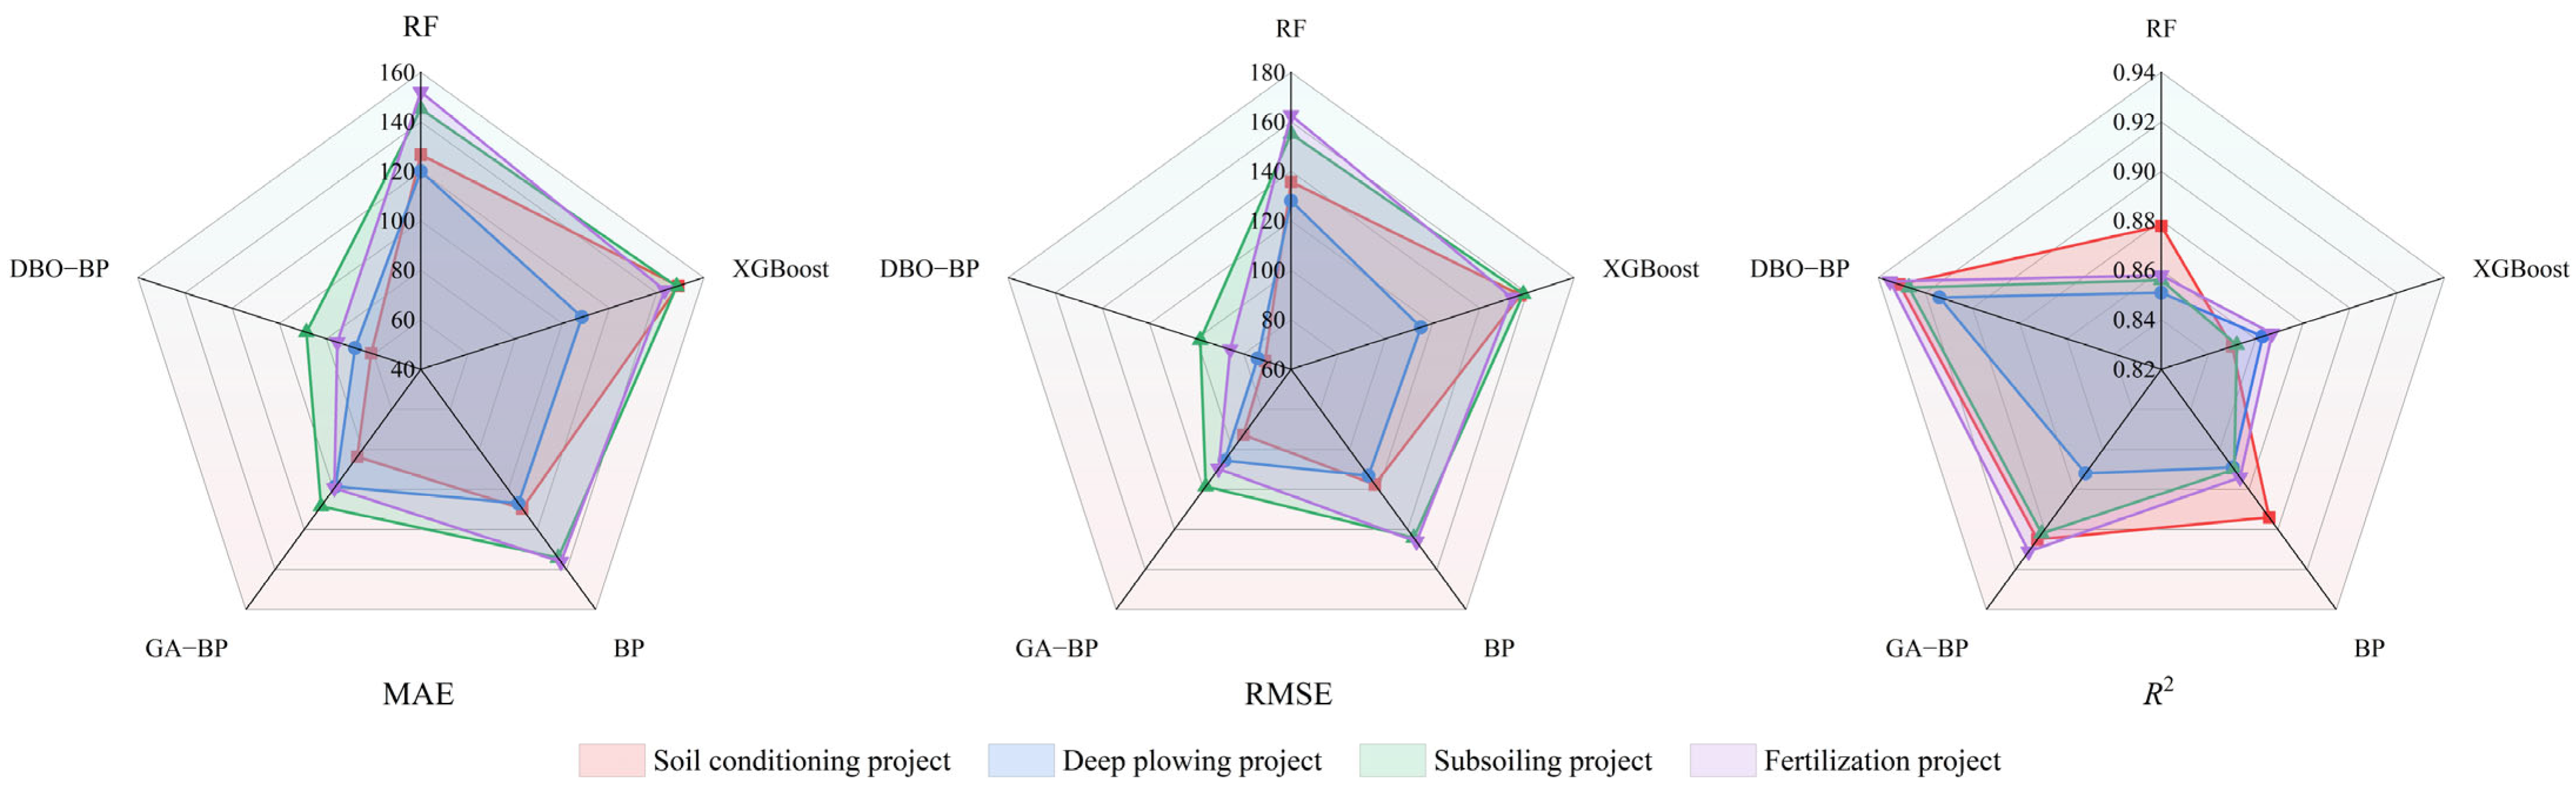
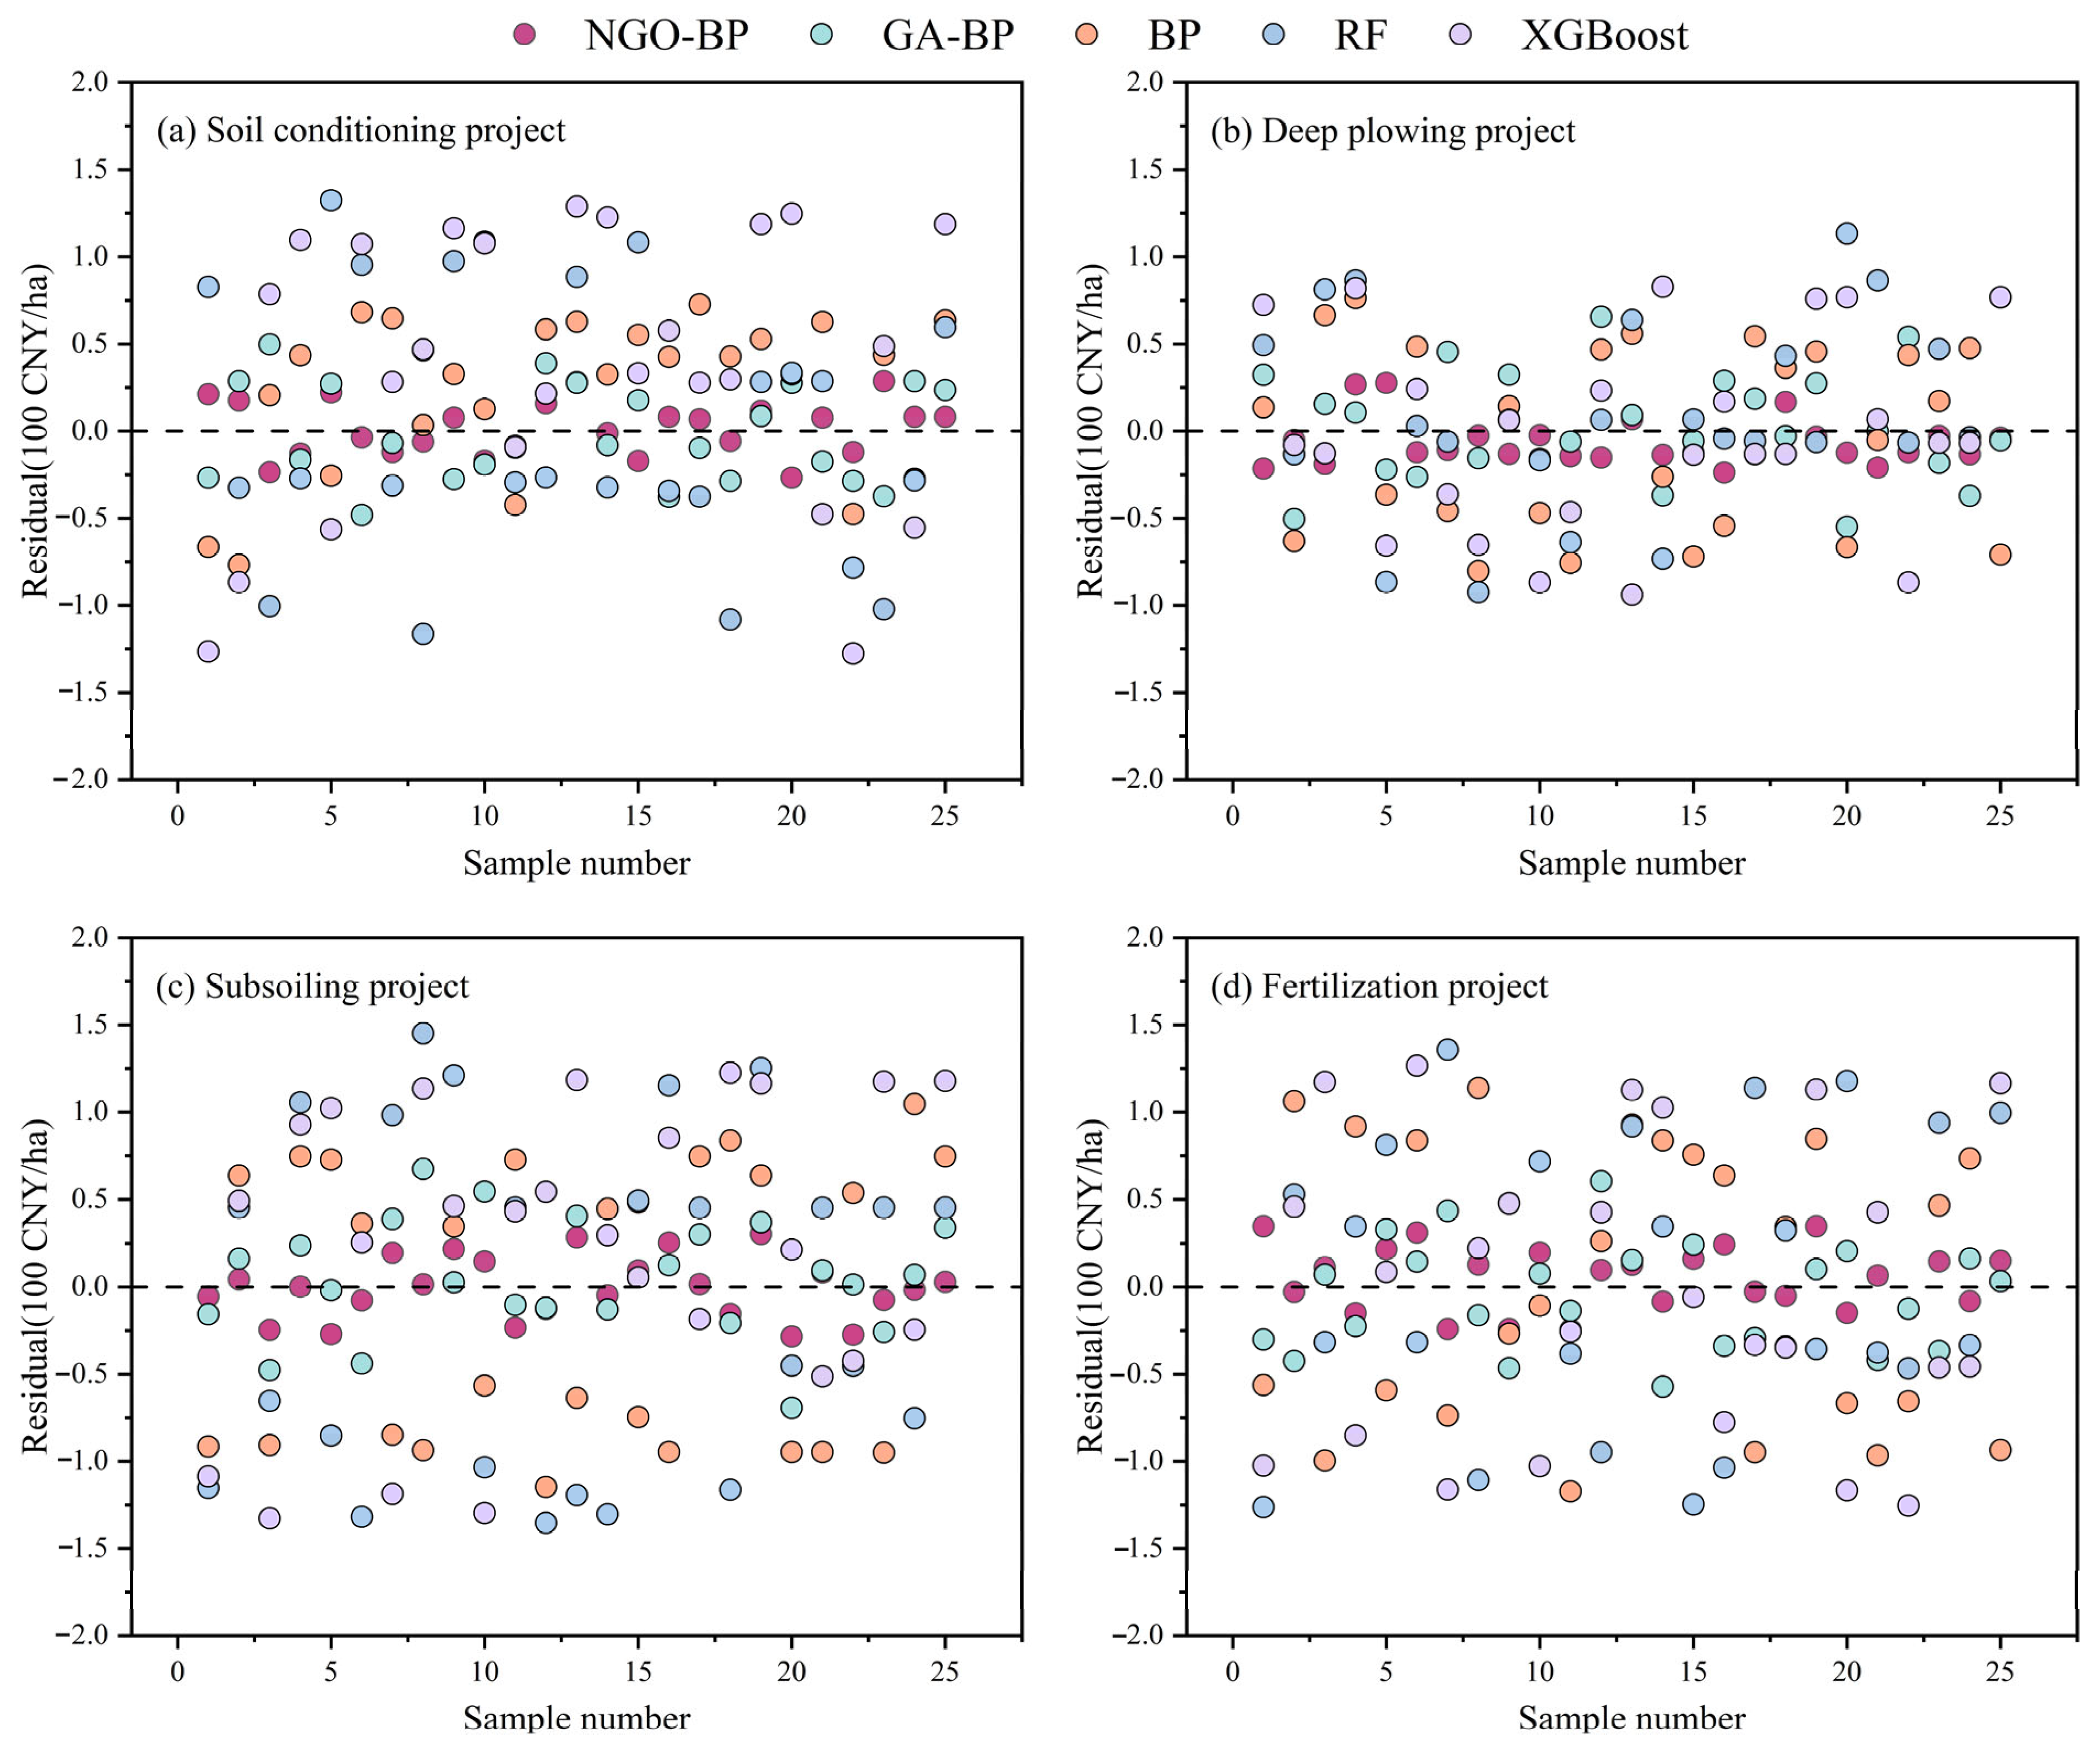
Section 3 screens and reduces the dimensions of influencing factors using the PCA method, constructs five different prediction models to compare their accuracy and stability, and ultimately demonstrates the optimal performance of the NGO–BP model in predicting fertility enhancement project cost indicators. Section 4 discusses the results. Section 5 contains conclusions and future work.

2. Data and Methods

2.1. Data Sources and Preprocessing

The dataset used in this study was obtained from cost indicators of high-standard farmland fertility enhancement projects implemented across provinces and municipalities in China’s seven major geographic regions in 2025. These projects are designed to improve the ecological condition of farmland, reduce the impact of flood-related disasters on crop production, and enhance local agricultural productivity. Sample data were collected through a combination of field investigations and official project acceptance documents. The seven geographic regions include Northeast China, North China, Central China, South China, East China, Northwest China, and Southwest China. Specifically, surveyed provinces and cities include Northeast China (Heilongjiang, Jilin, Liaoning); North China (Hebei, Shanxi, Tianjin); Central China (Henan, Hubei, Hunan); South China (Guangdong, Guangxi Zhuang Autonomous Region); East China (Anhui, Jiangsu); Northwest China (Gansu, Shaanxi); and Southwest China (Yunnan, Sichuan). Data preprocessing involved handling missing values, removing outliers, and normalizing the data. Missing values were imputed using the average and proportional values of similar projects. Outliers were removed based on constraints related to the cost structure and rationality of project quantities. Normalization was applied to eliminate the effects of differing data scales by transforming all values into the [0, 1] range, as calculated by Equation (1). The dataset includes 500 records, comprising 125 samples each from four project types: soil conditioning, deep plowing, subsoiling, and fertilization. Each category was randomly divided into a training set and a testing set in an 80:20 ratio.
x i = x i x m i n x m a x x m i n ,
where x m a x and x m i n represent the maximum and minimum values in the sample data, respectively; x i denotes the original value; and x i denotes the normalized value.

2.2. Analysis of Influencing Factors for Cost Indicators in Farmland Fertility Enhancement Projects

2.2.1. Selection of Influencing Factors

The cost indicators of farmland fertility enhancement projects are influenced by a wide range of variables, often characterized by complex interdependencies [43,44]. The selection of comprehensive and rational influencing factors forms the foundation for constructing accurate cost prediction models. Based on an extensive review of the relevant literature and practical considerations in engineering implementation, a set of key variables affecting cost indicators was identified. Farmland fertility enhancement projects generally include four major components: soil conditioning, deep plowing, subsoiling, and fertilization. Influencing factors were classified into three main categories—geographical and environmental factors, engineering-related factors, and cost-related factors [45,46]—and further divided into qualitative and quantitative types. To enable model integration, qualitative variables were numerically encoded based on standardized criteria: topography was assigned values of 1 for plains, 2 for hills, 3 for mountains, and 4 for plateaus; the application method of fertilizers or conditioners was coded as 1 for manual, 2 for mechanical, and 3 for drone-based operations; plot shape was encoded as 1 for rectangular, 2 for triangular, and 3 for polygonal; soil classification was assigned values of 1 for Class I–II soils, 2 for Class III, and 3 for Class IV; and fertilizer type was coded as 1 for conventional chemical fertilizers, 2 for organic fertilizers, and 3 for bio-organic fertilizers. The complete set of influencing factors for each project type is summarized in Table 1.

2.2.2. Principal Component Analysis

To eliminate the influence of redundant variables and ensure the feasibility of model construction, it is necessary to screen and reduce the dimensionality of the selected influencing factors. Common dimensionality reduction techniques include grey relational analysis and PCA. Given the non-temporal nature of the dataset used in this study, PCA was selected to identify the key influencing factors for predicting cost indicators in farmland fertility enhancement projects [47]. PCA is a statistical method that extracts and transforms multiple correlated variables into a smaller set of uncorrelated composite indicators through dimensionality reduction. The goal is to retain as much information from the original dataset as possible while reducing the number of input variables [48]. The specific steps are as follows:
  • Suppose the dataset contains n samples, each with m variables, forming an n × m sample matrix X, expressed as
X n × m = X 11 X 1 m X n 1 X n m ,
2.
Calculate the correlation coefficient matrix R, and obtain its eigenvalues λ 1 λ 2 ≥ … λ m ≥0 along with the corresponding eigenvectors u 1 , u 2 ,…, u m , where u j = ( u 1 j , u 2 j ,…, u m j )T. These eigenvectors form the new uncorrelated principal component variables.
3.
Determine the principal components. After data standardization, calculate the variance contribution rate b j and the cumulative contribution rate a j for each influencing factor, as shown in Equations (3) and (4). Only components with eigenvalues greater than or equal to 1 and a cumulative contribution rate exceeding 80% are retained as principal components.
b j = λ j j = 1 m   λ j , ( j = 1,2 , , m ) ,
a j = j = 1 m   b j , ( j = 1,2 , , m ) ,
4.
Compute the composite score. Based on the factor loading matrix, obtain the score coefficients of each influencing factor on the principal components. A composite score is calculated for each sample, followed by normalization and ranking.

2.3. NGO–BP Neural Network Model

The BP neural network is one of the most widely used multilayer feedforward models in machine learning. Its core mechanism involves training sample data through an error backpropagation algorithm, which iteratively optimizes the network’s parameters. Owing to its distinctive computational architecture, the BP neural network demonstrates strong fault tolerance and memory capacity, making it particularly effective in addressing nonlinear problems and small-sample learning scenarios [49]. As illustrated in Figure 1, the BP network typically consists of three parts: an input layer, one or more hidden layers, and an output layer. During training, weights and thresholds are randomly initialized. The learning process comprises two stages: forward propagation and backward propagation. In the forward stage, normalized input data, filtered via PCA, are fed into the input layer. These data are processed by the hidden layer and propagated forward to generate predicted values of cost indicators for farmland fertility enhancement projects. In the backward phase, the error between the predicted and actual values is computed and propagated backward through the network to update the weights and thresholds. This iterative adjustment process, guided by the error backpropagation algorithm, aims to minimize prediction errors and improve the model’s accuracy and robustness. The weight update formula is given in Equation (5).
ω = ω η E ω
where ω is the weight between neurons at iteration; ω is the updated weight; E denotes the prediction error; and η is the learning rate.
In conventional BP neural networks, the random assignment of initial weights and thresholds often results in parameter sensitivity, which can lead the network into local optima. Such limitations cause slow convergence and low computational efficiency and hinder the achievement of global optimization. To improve the global search ability and predictive performance of BP neural networks, the NGO algorithm is introduced for parameter optimization. Incorporating NGO enables the model to escape local minima and enhances prediction accuracy. The NGO algorithm, proposed by Mohammad Dehghani in 2021, is a population-based optimization algorithm. It simulates the hunting process of the Northern Goshawk, which involves two phases, prey search and identification, followed by pursuit and evasion, to find high-performance hyperparameter combinations [50]. The NGO algorithm offers faster convergence and higher search precision than other optimization algorithms, such as the GA. It effectively addresses the limitations of manually assigned hyperparameters in BP neural networks, often leading to suboptimal accuracy and weak generalization. The step-by-step procedure of the NGO algorithm is outlined as follows:
  • First phase: Prey search and identification (exploration phase).
X i , j n e w , P 1 = x i , j + q   p i , j E x i , j , F P i < F i x i , j + q   x i , j p i , j , F P i F i ,
where P1 represents the first measurement stage, Fpi is the target function value of the position of the i-th Northern Goshawk in the first hunting stage, and X i , j n e w , P 1 represents the updated position of the i-th Northern Goshawk in the j-th dimension during the first measurement stage. The variable q is a random number within the range [0, 1], and E is an integer, either 1 or 2, representing the type of random number.
2.
Second phase: Pursuit and evasion (exploitation phase).
x i , j n e w , P 2 = x i , j + R   2 q 1   x i , j ,
R = 0.02 1 t T ,
3.
Assume that the attack range of this hunting activity has a radius of R.
In the formula, X i , j n e w , P 2 represents the new position of the i-th Northern Goshawk in the j-th dimension during the second exploitation phase; t is the current iteration number, and T is the maximum iteration number; and R is the attack radius.
The process of optimizing the BP neural network using the NGO is illustrated in Figure 2.

2.4. Cost Indicator Prediction for Farmland Fertility Enhancement Projects

The overall process of predicting cost indicators for farmland fertility enhancement projects is illustrated in Figure 3. The procedure consists of the following steps: First, engineering data were collected through field investigations from high-standard farmland fertility enhancement projects across China’s seven major regions, including soil conditioning, deep plowing, subsoiling, and fertilization. The collected data underwent preprocessing, including data cleaning and normalization. Principal component analysis (PCA) was then applied to perform dimensionality reduction and select key influencing factors, which were used as the input variables of the prediction model. The unit cost of each sample project was defined as the model output. Based on the scale of the dataset and to ensure a balance between sufficient model training and reliable evaluation, the data were randomly divided into training and testing sets in a ratio of 8:2. A NGO–BP prediction model was constructed by optimizing the weights and thresholds of the BP neural network using the NGO algorithm. Finally, the predictive performance and feasibility of the proposed model were validated through comparisons with other machine learning models and optimization algorithms.

3. Results

3.1. Key Influencing Factor Selection Based on PCA

PCA was applied to the collected dataset, which consists of 125 samples for each of the four project types (soil conditioning, deep plowing, subsoiling, and fertilization). PCA was used to identify the key influencing factors affecting cost indicators in farmland fertility enhancement projects. Eigenvalues and variance contribution rates for the principal components were calculated according to Equations (3) and (4), and the results are presented in Table 2.
Principal components with eigenvalues greater than 1 and cumulative variance contribution rates exceeding 80% were selected for subsequent analysis. As shown in Table 2, the first five principal components of the soil conditioning project account for a cumulative contribution rate of 82.948%, with the fifth eigenvalue reaching 1.058. These results suggest that the first five components sufficiently capture most of the information in the original dataset and are retained as the principal components. Similarly, in the deep plowing project, the first five components yield a cumulative contribution rate of 82.900%, with the fifth eigenvalue reaching 1.330, thus satisfying the selection criteria. For the subsoiling and fertilization projects, the first four and five principal components were retained following the same rule. Using the selected principal components and the corresponding component matrix, comprehensive scores for the influencing factors on cost indicators were calculated for each type of farmland fertility enhancement project.
As shown in Table 3, influencing factors with normalized composite scores exceeding 0.7 were selected as key variables for subsequent modeling. For the soil conditioning project, eight critical factors were identified: soil conditioning area (S1), conditioner application amount (S2), soil layer thickness (S3), surface leveling degree (S5), labor cost (S9), machinery cost (S10), material cost (S11), and construction period (S14). For the deep plowing project, the selected factors included deep plowing area (E1), plowing depth (E2), surface leveling degree (E4), labor cost (E7), machinery cost (E8), material cost (E9), indirect cost (E11), and construction period (E12). In the subsoiling project, seven key variables were retained: subsoiling area (L1), depth (L2), surface leveling degree (L4), labor cost (L7), machinery cost (L8), material cost (L9), and construction period (L12). For the fertilization project, nine key factors were identified: fertilization area (F1), fertilization amount (F3), surface leveling degree (F4), labor cost (F7), machinery cost (F8), material cost (F9), contingency cost (F10), construction period (F12), and fertilizer type (F14). These variables were subsequently used as inputs in the cost prediction model for farmland fertility enhancement projects.

3.2. Cost Prediction Based on the NGO–BP Model

3.2.1. Parameter Configuration and Model Evaluation

The influencing factors selected via PCA for each project type were used as input variables in the prediction model, with the cost indicator serving as the output variable. Eighty percent of the dataset was allocated to the training set, and the remaining 20% to the test set. Since the data are non-temporal, the entire dataset was shuffled prior to splitting. Accordingly, the datasets for the soil conditioning, deep plowing, subsoiling, and fertilization projects were each divided into 100 training samples and 25 test samples.
To evaluate the predictive performance of the NGO–BP model, four benchmark models (RF, XGBoost, BP, and GA–BP) were constructed using the same dataset for comparison. The BP network requires the specification of the number of hidden layer nodes. Based on an empirical formula and trial-and-error approach, the optimal range was between 6 and 16. The best performance was obtained with 13 hidden nodes.
Both population size and the number of iterations influence the performance of the NGO. Although larger values enhance the global search capability, they may also lead to overfitting or convergence to local optima. The optimal settings were determined using the mean squared error (MSE) from the training set as the fitness function. As shown in Table 4, the minimum error occurred when the population size was set to 30 and the number of iterations to 100, indicating that the NGO algorithm had converged. The upper and lower bounds for the optimization problem were 3 and −3.
In addition, RF and XGBoost were selected as baseline machine learning models for comparison. RF constructs an ensemble of decision trees and averages their outputs, effectively reducing overfitting and improving prediction stability. XGBoost, a gradient-boosting framework, integrates multiple weak learners to achieve high prediction accuracy and is particularly suited for large-scale datasets. These characteristics justify their selection for benchmarking purposes. The specific parameter settings for all models and algorithms are summarized in Table 5.
Three evaluation metrics were employed to assess the predictive accuracy of the cost indicator model for farmland fertility enhancement projects: root mean square error (RMSE), mean absolute error (MAE), and the coefficient of determination (R2). Smaller RMSE and MAE values, along with R2 values closer to 1, indicate better model performance, lower prediction error, and higher reliability of the results. The corresponding calculation formulas are defined as follows:
R M S E = 1 n i = 1 n   Y i Y i 2 ,
M A E = 1 n i = 1 n   Y i Y i ,
R 2 = 1 i = 1 n     Y i Y i ¯ 2 i = 1   n   Y i Y i ¯ 2 ,
where Y i denotes the actual cost indicator value for the i-th sample; Y i represents the predicted value, and Y i ¯ is the mean of the actual values across n prediction samples.

3.2.2. Comparative Analysis of Different Prediction Models

None of the five predictive models exhibited signs of overfitting during the training and testing phases. For the cost indicator predictions in the soil conditioning, deep plowing, subsoiling, and fertilization projects, predicted values from each model were compared against actual values. The results are presented in Figure 4, and the performance evaluation metrics of each model are summarized in Table 6 and Figure 5.
As illustrated in Figure 4, a comparison of the prediction outcomes across the four cost indicator models for farmland fertility enhancement projects shows that the deviations between predicted and actual values are significantly larger in the RF and XGBoost models than in the BP model. These results indicate that the BP neural network better fits the characteristics and sample size of the current dataset, offering improved predictive accuracy. Despite larger deviations, the predicted trends from the RF and XGBoost models generally align with the actual trends, indicating that PCA effectively extracted key influencing factors, reduced dimensionality, and eliminated redundant information, thereby enhancing model performance to a certain extent. Further evaluation of the NGO algorithm’s role in parameter optimization reveals that the NGO–BP model produces the prediction curve most closely aligned with the actual values, with minimal deviation across samples. In addition, the residual plot in Figure 6 shows that the NGO–BP model is closest to the zero-level line in terms of residuals compared to the other models, which suggests that the predicted values of the model are the closest to the actual values and have the highest prediction accuracy. Consequently, the NGO–BP hybrid model demonstrates superior performance compared to the standalone BP neural network, RF, and XGBoost models regarding simulation accuracy.
As shown in Table 6, the NGO–BP prediction model achieved the lowest RMSE and MAE and the highest R2 across all project types, consistently outperforming the other models. Under the same conditions, the BP neural network exhibited superior predictive accuracy compared to traditional machine learning models such as RF and XGBoost, particularly in handling nonlinear feature relationships in cost prediction. In the soil conditioning project, the BP model reduced the RMSE and MAE by 13.42% and 13.54%, respectively, compared to RF, with a 2% increase in R2. Relative to XGBoost, the reductions in RMSE and MAE were 25.23% and 26.51%, with a 5% gain in R2. In the deep plowing project, BP achieved RMSE and MAE reductions of 11.68% and 10.93% over RF and 1.69% and 1.23% over XGBoost, with corresponding R2 improvements of 2% and 1%, respectively. These results confirm that the BP neural network effectively captures the nonlinear relationships among input features while mitigating the influence of data randomness, thereby achieving higher prediction accuracy and computational efficiency. Furthermore, the integration of PCA for dimensionality reduction helped eliminate redundant input variables, improved the effectiveness of training samples, and enhanced overall model precision.
The BP neural network model demonstrates considerable improvement when enhanced with optimization algorithms to address hyperparameter tuning challenges. Compared with the standard BP model, the GA–BP model showed significant gains in the subsoiling project, reducing the RMSE and MAE by 17.82% and 19.19%, respectively, and increasing R2 by 4%. In the fertilization project, the RMSE and MAE decreased by 24.90% and 27.05%, with an R2 improvement of 4%. These results highlight that optimizing hyperparameters can substantially improve both prediction accuracy and computational efficiency. In contrast, random initialization in conventional BP networks often leads to instability, weak generalization, and suboptimal performance. Further comparison shows that the NGO–BP model outperforms GA–BP. In the subsoiling project, NGO–BP reduced RMSE and MAE by 16.87% and 18.38%, respectively, and improved R2 by 3%. In the fertilization project, the reductions in RMSE and MAE were 21.78% and 24.09%, with a 3% increase in R2. These findings suggest that the NGO algorithm offers more effective optimization of weights and thresholds in BP networks compared to GA. The superior performance is attributed to the NGO’s behavioral simulation of dung beetles, which improves coverage of the hyperparameter search space and reduces convergence iterations. This behavior enhances robustness and optimization capacity, particularly in high-dimensional parameter spaces.
Based on the overall results, the proposed NGO–BP prediction model exhibited markedly better performance in terms of MAE, RMSE, and R2 compared to conventional machine learning models, demonstrating strong applicability and high predictive accuracy. The incorporation of PCA and the NGO algorithm into the BP neural network substantially enhanced both prediction efficiency and effectiveness while reducing the subjectivity involved in the manual selection of weights and thresholds. Consequently, the NGO–BP model surpasses the standalone BP neural network in both precision and generalization ability. In the absence of standardized construction guidelines for high-standard farmland development, the NGO–BP model yields more stable and accurate predictions of cost indicators for fertility enhancement projects. The model supports project evaluation with both theoretical grounding and empirical evidence. It also functions as an effective tool for dynamically refining investment benchmarks and improving capital allocation strategies in future project planning and implementation.

4. Discussion

High-standard farmland fertility enhancement projects play a vital role in improving soil structure and ensuring stable, high crop yields. By enhancing soil physicochemical properties and promoting nutrient cycling, these projects support the sustainable use of arable land, reduce dependence on chemical fertilizers and pesticides, and contribute to both food security and ecological balance. However, the absence of accurate and scientific cost prediction during project implementation constrains resource allocation efficiency, increases investment risk, and impedes the translation of technology into practical benefits. Establishing a dynamic and robust cost prediction model is essential to guide decision-making throughout project planning and execution.
The NGO–BP prediction model developed in this study demonstrated significantly better performance in terms of MAE, RMSE, and R2 compared to conventional machine learning models, indicating strong applicability and predictive accuracy. Elmousalami et al. [45] selected factors such as project characteristics, construction location, and duration when designing a cost-influencing factor system. Drawing from similar methodological principles, the present study established a quantifiable framework of cost indicators based on geographic, engineering, and financial dimensions. Due to the initially large number of influencing factors, dimensionality reduction was required to minimize redundancy, reduce computational time, and maintain model accuracy. Zhang et al. [30] developed a BP neural network model to predict coalbed methane content by analyzing the correlation between logging parameters using principal component analysis and Pearson correlation and constructing composite input variables. Their findings confirmed that targeted parameter transformation enhances model efficiency and precision. The application of PCA in the present study similarly improved prediction performance by identifying the most relevant variables. Experimental outcomes confirmed that PCA-based preprocessing substantially increased the accuracy of the NGO–BP model.
Zhang et al. [30] evaluated several prediction models, including KNN, Ridge regression, RF, XGBoost, and BP neural networks, for estimating coalbed methane content. The models were assessed using the coefficient of determination, root mean square error, and relative error. Among these, the BP neural network exhibited the highest prediction accuracy, achieving a relative error of 4.5% and improving prediction precision by approximately 61%. These results demonstrate the BP model’s strong capability to capture variations in coalbed methane content and deliver rapid, accurate predictions. Based on this evidence, the present study adopted BP neural networks [30,36,37], RF [21,22,28], XGBoost [28,30], GA–BP [36], and NGO–BP models for comparative analysis. The results confirm that the NGO–BP model is more suitable for predicting cost indicators in farmland fertility enhancement projects.
In terms of optimization strategies, Li et al. [36] applied a GA to optimize the weights and thresholds of a BP neural network for predicting construction costs in Guangdong Province. The optimized model exhibited a significant performance gain, with an approximate 8% increase in the coefficient of determination, validating the use of GA in enhancing BP models. To further improve predictive accuracy, Chang et al. [37] employed Northern Goshawk Optimization (NGO) to optimize BP neural network parameters and compared its results with those of the GA–BP model. The findings indicated the superior performance of the NGO–BP model, with a 1.6% increase in R2 and reductions of 11.6% and 6.34% in RMSE and MAE, respectively. These comparisons validate the advantage of using NGO for optimizing BP neural networks, justifying the selection of GA–BP and NGO–BP models in the present study.
The proposed NGO–BP model enables accurate prediction of differentiated cost indicators for high-standard farmland fertility enhancement projects by incorporating regional and project-specific characteristics. This approach supports evidence-based project management, improves resource allocation, and enhances overall efficiency. By providing reliable cost estimates, the model contributes to national food security goals while promoting ecological sustainability and agricultural modernization. During feasibility assessments, key influencing factors can be entered into the model to generate real-time cost predictions, supporting design optimization and strategic financial planning throughout the construction process.

5. Conclusions and Future Work

5.1. Conclusions

To address the absence of unified standards and the low predictive accuracy of cost indicators in high-standard farmland development projects across regions, this study focused on fertility enhancement projects as a representative case. PCA was applied to identify key influencing factors, forming the basis for constructing a cost prediction model using a NGO–BP neural network. Through systematic factor selection, model comparison, and algorithmic optimization, the NGO–BP model demonstrated high prediction accuracy and strong generalization capabilities. The main conclusions are as follows:
(1)
Based on the engineering characteristics of high-standard farmland construction, influencing factors were selected from the dimensions of project features, geography conditions, and management variables. PCA was employed to extract the most relevant factors, thereby establishing a cost indicator system tailored to fertility enhancement projects. This process significantly contributed to improving the precision of the subsequent predictive modeling.
(2)
Empirical validation indicated that, among the five models tested, including RF, XGBoost, BP, GA–BP, and NGO–BP, the NGO–BP model achieved the lowest error metrics and the highest prediction accuracy. In soil conditioning, deep plowing, subsoiling, and fertilization projects, the NGO–BP model yielded a maximum RMSE of only 98.472 CNY and a maximum MAE of 88.487 CNY, with all R2 values exceeding 0.914. The model integrated PCA-based feature selection with NGO-based parameter optimization, resulting in superior predictive performance.
(3)
The NGO–BP prediction model provides a robust tool for estimating the cost of high-standard farmland fertility enhancement projects. It enhances cost control, reduces investment risks, and supports data-driven decision-making. The model offers theoretical and practical value for project evaluation and resource planning, contributing to the realization of agricultural modernization and sustainable rural development.

5.2. Future Work

However, this work has several limitations. Currently focusing on cost indicator prediction for high-standard farmland fertility enhancement projects nationwide, it was validated in soil conditioning, deep plowing, deep loosening, and fertilization projects but has not covered other projects such as residual film removal, straw returning, and green manure rotation. The model emphasizes static engineering parameters, though its architecture supports dynamic expansion. In future research, we will increase project type diversity, integrate time-related variables into the prediction model to further improve model rationality and universality, while enhancing the collection and organization of project-related data, and establish multi-year sample databases to develop cross-year generalization capability, thereby providing theoretical support for the dynamic adjustment of national investment standards.

Author Contributions

Conceptualization, X.L.; data curation, X.L. and J.L.; formal analysis, J.L.; funding acquisition, C.L.; investigation, K.H. and J.L.; methodology, X.L.; project administration, C.L.; resources, C.L.; software, X.L.; supervision, K.H. and C.L.; validation, K.H.; visualization, X.L.; writing—original draft, X.L.; writing—review and editing, X.L., K.H., J.L., and C.L. All authors have read and agreed to the published version of the manuscript.

Funding

This work was supported by the Liaoning Provincial Local Standards Development Plan Project (2024223, 2024224, 2024225).

Institutional Review Board Statement

Not applicable.

Informed Consent Statement

Not applicable.

Data Availability Statement

Some or all of the data, models, or codes that support the findings of this study are available from the first author X.L. (email: 15241045234@163.com) upon reasonable request.

Acknowledgments

This work has received support from Shenyang Agricultural University and the Liaoning Provincial Local Standard Project. We sincerely appreciate their support. The author expresses gratitude to the editor and reviewers for their suggestions for improvement.

Conflicts of Interest

The authors declare no conflicts of interest.

Abbreviations

The following abbreviations are used in this manuscript:
BPBack propagation
CNNConvolutional neural network
NGONorthern goshawk optimization
GAGenetic algorithm
KNNK-nearest neighbors
MLRMultivariate linear regression
PCAPrincipal component analysis
RFRandom forest algorithm
SVRSupport vector regression
XGBoostExtreme gradient boosting

References

  1. Maeder, P.; Fliessbach, A.; Dubois, D.; Gunst, L.; Fried, P.; Niggli, U. Soil Fertility and Biodiversity in Organic Farming. Science 2002, 296, 1694–1697. [Google Scholar] [CrossRef] [PubMed]
  2. Deng, X.; Xu, X.; Wang, S. The tempo-spatial changes of soil fertility in farmland of China from the 1980s to the 2010s. Ecol. Indic. 2023, 146, 109913. [Google Scholar] [CrossRef]
  3. Zhou, C.; Zhang, M.; Chuai, X. Exploring provincial farmland use and demand through coupling production efficiency under domestic trade across China. J. Environ. Manag. 2024, 372, 123390. [Google Scholar] [CrossRef]
  4. Duro, J.A.; Lauk, C.; Kastner, T.; Erb, K.-H.; Haberl, H. Global inequalities in food consumption, cropland demand and land-use efficiency: A decomposition analysis. Glob. Environ. Change 2020, 64, 102124. [Google Scholar] [CrossRef]
  5. Liu, D.; Zhu, X.; Wang, Y. China’s agricultural green total factor productivity based on carbon emission: An analysis of evolution trend and influencing factors. J. Clean. Prod. 2021, 278, 123692. [Google Scholar] [CrossRef]
  6. Ma, L.; Long, H.; Tang, L.; Tu, S.; Zhang, Y.; Qu, Y. Analysis of the spatial variations of determinants of agricultural production efficiency in China. Comput. Electron. Agric. 2021, 180, 105890. [Google Scholar] [CrossRef]
  7. Lv, W.; Yang, L.; Xu, Z.; Zhang, Q. Spatiotemporal evolution of farmland ecosystem stability in the Fenhe River Basin China based on perturbation-resistance-response framework. Ecol. Inform. 2025, 86, 102977. [Google Scholar] [CrossRef]
  8. Hao, W.; Hu, X.; Wang, J.; Zhang, Z.; Shi, Z.; Zhou, H. The impact of farmland fragmentation in China on agricultural productivity. J. Clean. Prod. 2023, 425, 138962. [Google Scholar] [CrossRef]
  9. Yu, Y.; Zhang, J.; Zhang, K.; Xu, D.; Qi, Y.; Deng, X. The impacts of farmer ageing on farmland ecological restoration technology adoption: Empirical evidence from rural China. J. Clean. Prod. 2023, 430, 139648. [Google Scholar] [CrossRef]
  10. Yageta, Y.; Osbahr, H.; Morimoto, Y.; Clark, J. Comparing farmers’ qualitative evaluation of soil fertility with quantitative soil fertility indicators in Kitui County, Kenya. Geoderma 2019, 344, 153–163. [Google Scholar] [CrossRef]
  11. Devkota, M.; Devkota, K.P.; Kumar, S. Conservation agriculture improves agronomic, economic, and soil fertility indicators for a clay soil in a rainfed Mediterranean climate in Morocco. Agric. Syst. 2022, 201, 103470. [Google Scholar] [CrossRef]
  12. Li, H.; Zhang, Y.; Sun, Y.; Liu, P.; Zhang, Q.; Wang, X.; Wang, R.; Li, J. Long-term effects of optimized fertilization, tillage and crop rotation on soil fertility, crop yield and economic profit on the Loess Plateau. Eur. J. Agron. 2023, 143, 126731. [Google Scholar] [CrossRef]
  13. Zhang, K.; Wei, H.; Wang, Y.; Xu, Y.; Wang, Y.; Guo, S.; Sun, J. Integrated soil improvement and economic benefits evaluation of vegetable—Rice production systems for paddy fields in subtropical China. Plant Soil 2025, 507, 159–179. [Google Scholar] [CrossRef]
  14. Liu, L.; Zhao, Y.; Chang, D.; Xie, J.; Ma, Z.; Sun, Q.; Wennersten, R. Prediction of short-term PV power output and uncertainty analysis. Appl. Energy 2018, 228, 70011. [Google Scholar] [CrossRef]
  15. Han, K.; Wang, T.; Liu, W.; Li, C.; Xian, X.; Yang, Y. Construction cost prediction model for agricultural water conservancy engineering based on BIM and neural network. Sci. Rep. 2025, 15, 24271. [Google Scholar] [CrossRef]
  16. Zeng, B.; Ma, X.; Zhou, M. A new-structure grey Verhulst model for China’s tight gas production forecasting. Appl. Soft Comput. 2020, 96, 106600. [Google Scholar] [CrossRef]
  17. Lin, L.; Jiang, W.; Chen, B.; Yu, J.; Zheng, C. Construction and Application of Cost Prediction Model Based on Multiple Linear Regression Analysis. Procedia Comput. Sci. 2024, 247, 617–623. [Google Scholar] [CrossRef]
  18. Ottaviani, F.M.; Marco, A.D. Multiple Linear Regression Model for Improved Project Cost Forecasting. Procedia Comput. Sci. 2022, 196, 808–815. [Google Scholar] [CrossRef]
  19. Zhao, X.; Miao, X.; Zhang, Z.; Zheng, H. Research on Prediction Method of Reasonable Cost Level of Transmission Line Project Based on PCA-LSSVM-KDE. Math. Probl. Eng. 2019, 2019, 1649086. [Google Scholar] [CrossRef]
  20. Li, X.; Han, K.; Liu, W.; Wang, T.; Li, C.; Yan, B.; Hao, C.; Xian, X.; Yang, Y. Prediction Model of Farmland Water Conservancy Project Cost Index Based on PCA–DBO–SVR. Sustainability 2025, 17, 2702. [Google Scholar] [CrossRef]
  21. Niu, D.; Wang, K.; Sun, L.; Wu, J.; Xu, X. Short-term photovoltaic power generation forecasting based on random forest feature selection and CEEMD: A case study. Appl. Soft Comput. 2020, 93, 106389. [Google Scholar] [CrossRef]
  22. Liu, H.; Chen, C.; Guo, Z.; Xia, Y.; Yu, X.; Li, S. Overall grouting compactness detection of bridge prestressed bellows based on RF feature selection and the GA-SVM model. Constr. Build. Mater. 2021, 301, 124323. [Google Scholar] [CrossRef]
  23. Han, K.; Wang, W.; Huang, X.; Li, P.; Li, C.; Zheng, J. Predicting the construction cost of high standard farmland irrigation projects using NGO-CNN-SVM. Trans. Chin. Soc. Agric. Eng. 2024, 40, 62–72. [Google Scholar] [CrossRef]
  24. Fernandes, M.M.H.; Coelho, A.P.; Fernandes, C.; Silva, M.F.d.; Dela Marta, C.C. Estimation of soil organic matter content by modeling with artificial neural networks. Geoderma 2019, 350, 46–51. [Google Scholar] [CrossRef]
  25. Sujatha, M.; Jaidhar, C.D. Machine learning-based approaches to enhance the soil fertility—A review. Expert Syst. Appl. 2024, 240, 122557. [Google Scholar] [CrossRef]
  26. Mahmoudzadeh, H.; Matinfar, H.R.; Taghizadeh-Mehrjardi, R.; Kerry, R. Spatial prediction of soil organic carbon using machine learning techniques in western Iran. Geoderma Reg. 2020, 21, e00260. [Google Scholar] [CrossRef]
  27. Xian, W.; Liu, H.; Yang, X.; Huang, X.; Huang, H.; Li, Y.; Zeng, Q.; Tang, X. An ensemble framework for farmland quality evaluation based on machine learning and physical models. Sci. Total Environ. 2024, 912, 168914. [Google Scholar] [CrossRef] [PubMed]
  28. Khanal, S.; Fulton, J.; Klopfenstein, A.; Douridas, N.; Shearer, S. Integration of high resolution remotely sensed data and machine learning techniques for spatial prediction of soil properties and corn yield. Comput. Electron. Agric. 2018, 153, 213–225. [Google Scholar] [CrossRef]
  29. Hu, B.; Geng, Y.; Shi, K.; Xie, M.; Ni, H.; Zhu, Q.; Qiu, Y.; Zhang, Y.; Bourennane, H. Fine-resolution baseline maps of soil nutrients in farmland of Jiangxi Province using digital soil mapping and interpretable machine learning. Catena 2025, 249, 108635. [Google Scholar] [CrossRef]
  30. Zhang, H.; Cai, X.; Ni, P.; Qin, B.; Ni, Y.; Huang, Z.; Xin, F. Prediction of coalbed methane content based on composite logging parameters and PCA-BP neural network. J. Appl. Geophys. 2025, 236, 105681. [Google Scholar] [CrossRef]
  31. Liu, D.; Liu, H.; Zhang, X.; Zhang, L.; Qi, X. Analysis on the measurement of security characteristics of the water-energy-food coupling system based on the BP neural network optimized by the sailfish algorithm. Trans. Chin. Soc. Agric. Eng. 2025, 41, 1–14. [Google Scholar] [CrossRef]
  32. Wyke, S.; Lindhard, S.M.; Larsen, J.K. Using principal component analysis to identify latent factors affecting cost and time overrun in public construction projects. Eng. Constr. Archit. Manag. 2024, 31, 2415–2436. [Google Scholar] [CrossRef]
  33. Yata, K.; Aoshima, M. Effective PCA for high-dimension, low-sample-size data with noise reduction via geometric representations. J. Multivar. Anal. 2012, 105, 193–215. [Google Scholar] [CrossRef]
  34. Yang, G.; Xu, Y.; Huo, L.; Guo, D.; Wang, J.; Xia, S.; Liu, Y.; Liu, Q. Genetic algorithm optimized back propagation artificial neural network for a study on a wastewater treatment facility cost model. Desalination Water Treat. 2023, 282, 96–106. [Google Scholar] [CrossRef]
  35. Qian, J.; Wang, P.; Pu, C.; Peng, X.; Chen, G. Application of modified beetle antennae search algorithm and BP power flow prediction model on multi-objective optimal active power dispatch. Appl. Soft Comput. 2021, 113, 108027. [Google Scholar] [CrossRef]
  36. Li, C.; Xiao, Y.; Xu, X.; Chen, Z.; Zheng, H.; Zhang, H. Intelligent Forecast Model for Project Cost in Guangdong Province Based on GA-BP Neural Network. Buildings 2024, 14, 3668. [Google Scholar] [CrossRef]
  37. Chang, L.; Shi, R.; Dai, F.; Zhao, W.; Wang, H.; Zhao, Y. Header parameters optimization for quinoa mechanical harvesting using neural network and approximation modeling. Comput. Electron. Agric. 2025, 237, 110472. [Google Scholar] [CrossRef]
  38. Liu, Y.; Jiang, K.; Qin, Y.; Brennan, M.; Brennan, C.; Cao, J.; Wang, Z.; Soteyome, T. Prediction of the postharvest quality of Boletus wild mushrooms stored with mesoporous silica nanoparticles antibacterial film using Long Short-Term Memory model combined with the Northern Goshawk Optimization (NGO-LSTM). Food Chem. 2025, 463, 141490. [Google Scholar] [CrossRef] [PubMed]
  39. Wang, C.; Wang, Y.; Dong, L.; Yao, F. SOC estimation of lithium battery based on the combination of electrical parameters and FBG non-electrical parameters and using NGO-BP model. Opt. Fiber Technol. 2023, 81, 103581. [Google Scholar] [CrossRef]
  40. Cheng, M.-Y.; Vu, Q.-T.; Gosal, F.E. Hybrid deep learning model for accurate cost and schedule estimation in construction projects using sequential and non-sequential data. Autom. Constr. 2025, 170, 105904. [Google Scholar] [CrossRef]
  41. Mahmoodzadeh, A.; Nejati, H.R.; Mohammadi, M.; Hashim Ibrahim, H.; Khishe, M.; Rashidi, S.; Hussein Mohammed, A. Developing six hybrid machine learning models based on gaussian process regression and meta-heuristic optimization algorithms for prediction of duration and cost of road tunnels construction. Tunn. Undergr. Space Technol. 2022, 130, 104759. [Google Scholar] [CrossRef]
  42. Butchers, J.; Williamson, S.; Booker, J.; Maitland, T.; Karki, P.B.; Pradhan, B.R.; Pradhan, S.R.; Gautam, B. Cost estimation of micro-hydropower equipment in Nepal. Dev. Eng. 2022, 7, 100097. [Google Scholar] [CrossRef]
  43. Du, L. Analysis on Safeguard Measures of High-standard Farmland Water Conservancy Project Construction in the Era of Big Data. Comput. Informatiz. Mech. Syst. 2023, 6, 10–15. [Google Scholar]
  44. Pu, L.; Zhang, S.; Yang, J.; Yan, F.; Chang, L. Assessment of High-standard Farmland Construction Effectiveness in Liaoning Province During 2011–2015. Chin. Geogr. Sci. 2019, 29, 667–678. [Google Scholar] [CrossRef]
  45. Elmousalami, H.H.; Elshaboury, N.; Ibrahim, A.H.; Elyamany, A.H. Bayesian Optimized Ensemble Learning System for Predicting Conceptual Cost and Construction Duration of Irrigation Improvement Systems. KSCE J. Civ. Eng. 2024, 29, 100014. [Google Scholar] [CrossRef]
  46. Kannazarova, Z.; Juliev, M.; Abuduwaili, J.; Muratov, A.; Bekchanov, F. Drainage in irrigated agriculture: Bibliometric analysis for the period of 2017–2021. Agric. Water Manag. 2024, 305, 109118. [Google Scholar] [CrossRef]
  47. Fariz, T.K.N.; Basha, S.S. Enhancing solar radiation predictions through COA optimized neural networks and PCA dimensionality reduction. Energy Rep. 2024, 12, 341–359. [Google Scholar] [CrossRef]
  48. Li, H.; Tan, Y.; Zeng, D.; Su, D.; Qiao, S. Attitude-Predictive Control of Large-Diameter Shield Tunneling: PCA-SVR Machine Learning Algorithm Application in a Case Study of the Zhuhai Xingye Express Tunnel. Appl. Sci. 2025, 15, 1880. [Google Scholar] [CrossRef]
  49. Yan, J.; Xu, Z.; Yu, Y.; Xu, H.; Gao, K. Application of a Hybrid Optimized BP Network Model to Estimate Water Quality Parameters of Beihai Lake in Beijing. Appl. Sci. 2019, 9, 1863. [Google Scholar] [CrossRef]
  50. Dehghani, M.; Hubálovský, Š.; Trojovský, P. Northern Goshawk Optimization: A New Swarm-Based Algorithm for Solving Optimization Problems. IEEE Access 2021, 9, 162059–162080. [Google Scholar] [CrossRef]
Figure 1. Structural diagram of the BP neural network.
Sustainability 17 06250 g001
Figure 2. Flowchart of BP neural network optimization using Northern Goshawk Optimization (NGO).
Sustainability 17 06250 g002
Figure 3. Prediction framework for cost indicators of high-standard farmland fertility enhancement projects based on the NGO–BP model.
Sustainability 17 06250 g003
Figure 4. Comparison of predictive modeling results from different models for farmland fertility enhancement projects.
Sustainability 17 06250 g004
Figure 5. Comparison of evaluation metrics across different prediction models.
Sustainability 17 06250 g005
Figure 6. Plot of residuals between predicted and actual values in the test set.
Sustainability 17 06250 g006
Table 1. Summary of factors influencing the cost indicators for farmland fertility enhancement projects.
No.Influencing Factors
Soil Conditioning ProjectDeep Plowing ProjectSubsoiling ProjectFertilization Project
1Plot area/ha (S1)Plot area/ha (E1)Plot area/ha (L1)Plot area/ha (F1)
2Application amount/kg (S2)Plowing depth/cm (E2)Subsoiling depth/cm (L2)Slope gradient/(F2)
3Soil layer thickness/m (S3)Slope gradient/(E3)Slope gradient/(L3)Fertilizer amount/kg (F3)
4Slope gradient/(S4)Land leveling accuracy/cm (E4)Land leveling accuracy/cm (L4)Land leveling accuracy/cm (F4)
5Land leveling accuracy/cm (S5)Plot length/m (E5)Plot length/m (L5)Plot length/m (F5)
6Plot length/m (S6)Plot width/m (E6)Plot width/m (L6)Plot width/m (F6)
7Plot width/m (S7)Labor cost/CNY (E7)Labor cost/CNY (L7)Labor cost/CNY (F7)
8Plot elevation/m (S8)Machinery cost/CNY (E8)Machinery cost/CNY (L8)Machinery cost/CNY (F8)
9Labor cost/CNY (S9)Material cost/CNY (E9)Material cost/CNY (L9)Material cost/CNY (F9)
10Machinery cost/CNY (S10)Contingency cost/CNY (E10)Contingency cost/CNY (L10)Contingency cost/CNY (F10)
11Material cost/CNY (S11)Indirect cost/CNY (E11)Indirect cost/CNY (L11)Indirect cost/CNY (F11)
12Contingency cost/CNY (S12)Construction duration/day (E12)Construction duration/day (L12)Construction duration/day (F12)
13Indirect cost/CNY (S13)Topography (E13)Topography (L13)Topography (F13)
14Construction duration/day (S14)Soil type (E14)Soil type (L14)Fertilizer type (F14)
15Topography (S15)Plot shape (E15)Plot shape (L15)Soil type (F15)
16Conditioner application method (S16) Fertilizer application method (F16)
17Plot shape (S17) Plot shape (F17)
Table 2. Principal component eigenvalues and variance contributions.
Engineering CategoryPrincipal ComponentEigenvalueVariance Contribution (%)Cumulative Contribution (%)
Soil conditioning project16.80740.04340.043
22.74716.15856.201
31.86510.97167.172
41.6249.55476.726
51.0586.22282.948
Deep plowing project14.00435.69435.694
22.74718.31454.008
31.53510.23364.241
41.4699.79374.034
51.3308.86682.900
Subsoiling project14.89532.63332.633
23.89725.97758.610
32.44116.27174.881
41.55010.33685.217
Fertilization project15.00939.46439.464
22.96717.45156.915
32.25313.25170.166
41.3768.09778.262
51.1846.96585.227
Table 3. Composite scores of influencing factors.
Influencing Factor No.Soil Conditioning ProjectDeep Plowing ProjectSubsoiling ProjectFertilization Project
Composite ScoreNormalizeComposite ScoreNormalizeComposite ScoreNormalizeComposite ScoreNormalize
10.2030.9930.1860.8960.2120.9300.1830.957
20.2010.9870.1830.8870.2311.0000.0780.560
30.2020.9890.0390.2840.1420.6780.1210.720
40.0010.2800.1470.7350.1920.8600.1620.875
50.1700.8770.0520.3390.1080.5540.1140.696
60.0470.4430.1070.5670.0980.5180.0660.514
70.0840.5740.2020.9640.2020.8930.1460.817
80.0630.4990.2090.9940.1560.7290.1380.787
90.2030.9930.2111.0000.1570.7300.1740.921
100.2051.000−0.0300.000−0.0460.0000.1900.981
110.2030.9920.1830.8860.1430.6810.1070.669
12−0.0790.0000.1460.7330.1530.7180.1951.000
130.0030.2900.0920.5060.0220.2430.0470.440
140.1640.8570.0620.3830.0570.3710.1230.728
150.0180.3430.0550.3510.0770.4440.0850.585
160.0910.599 −0.0700.000
17−0.0020.270 0.0750.547
Table 4. Comparison of algorithm errors under different population sizes and iteration numbers.
No.PopulationIteration
Population SizeAlgorithm ErrorNumber of IterationsAlgorithm Error
1100.01936800.00426
2200.01753900.00216
3300.013091000.00914
4400.014221100.00176
5500.018481200.00104
6600.017041300.00114
7700.019261400.00136
8800.023521500.00175
Table 5. Parameter settings for each model.
ModelHyperparameterizationValue
BPNumber of iterations1000
Learning rate0.01
Number of hidden layer nodes13
Minimum training error target0.00001
Training functiontrainlm
RFNumber of decision trees100
Maximum depth5
XGBoostNumber of decision trees500
Maximum depth3
Learning rate0.01
NGOInitial learning rate0.01
Population size30
Maximum number of iterations100
Upper bound for weights/thresholds3
Lower bound for weights/thresholds−3
Table 6. Comparison of evaluation metrics for different models.
Engineering CategoryModelMAE (CNY/ha)RMSE (CNY/ha)R2
Soil conditioning projectRF126.752135.7610.878
XGBoost149.124157.1930.850
BP109.595117.5390.894
GA–BP83.61692.6610.905
NGO–BP61.05471.0540.931
Deep plowing projectRF120.070128.0970.851
XGBoost108.283115.0790.863
BP106.947113.1320.869
GA–BP98.502105.5420.872
NGO–BP67.87374.1670.914
Subsoiling projectRF145.268155.2250.856
XGBoost148.429158.4140.852
BP134.158144.1430.870
GA–BP108.409118.4540.902
NGO–BP88.48798.4720.927
Fertilization projectRF152.143162.6850.858
XGBoost143.429153.7120.867
BP136.109146.0340.874
GA–BP99.286109.6750.911
NGO–BP75.36985.7910.935
Disclaimer/Publisher’s Note: The statements, opinions and data contained in all publications are solely those of the individual author(s) and contributor(s) and not of MDPI and/or the editor(s). MDPI and/or the editor(s) disclaim responsibility for any injury to people or property resulting from any ideas, methods, instructions or products referred to in the content.

