
Optimising Thermal Comfort in Algerian Reference Hotel Across Eight Climate Zones: A Comparative Study of Simulation and Psychrometric Chart Results

 ,
,  ,
,  ,
,  ,
,
Abstract
1. Introduction
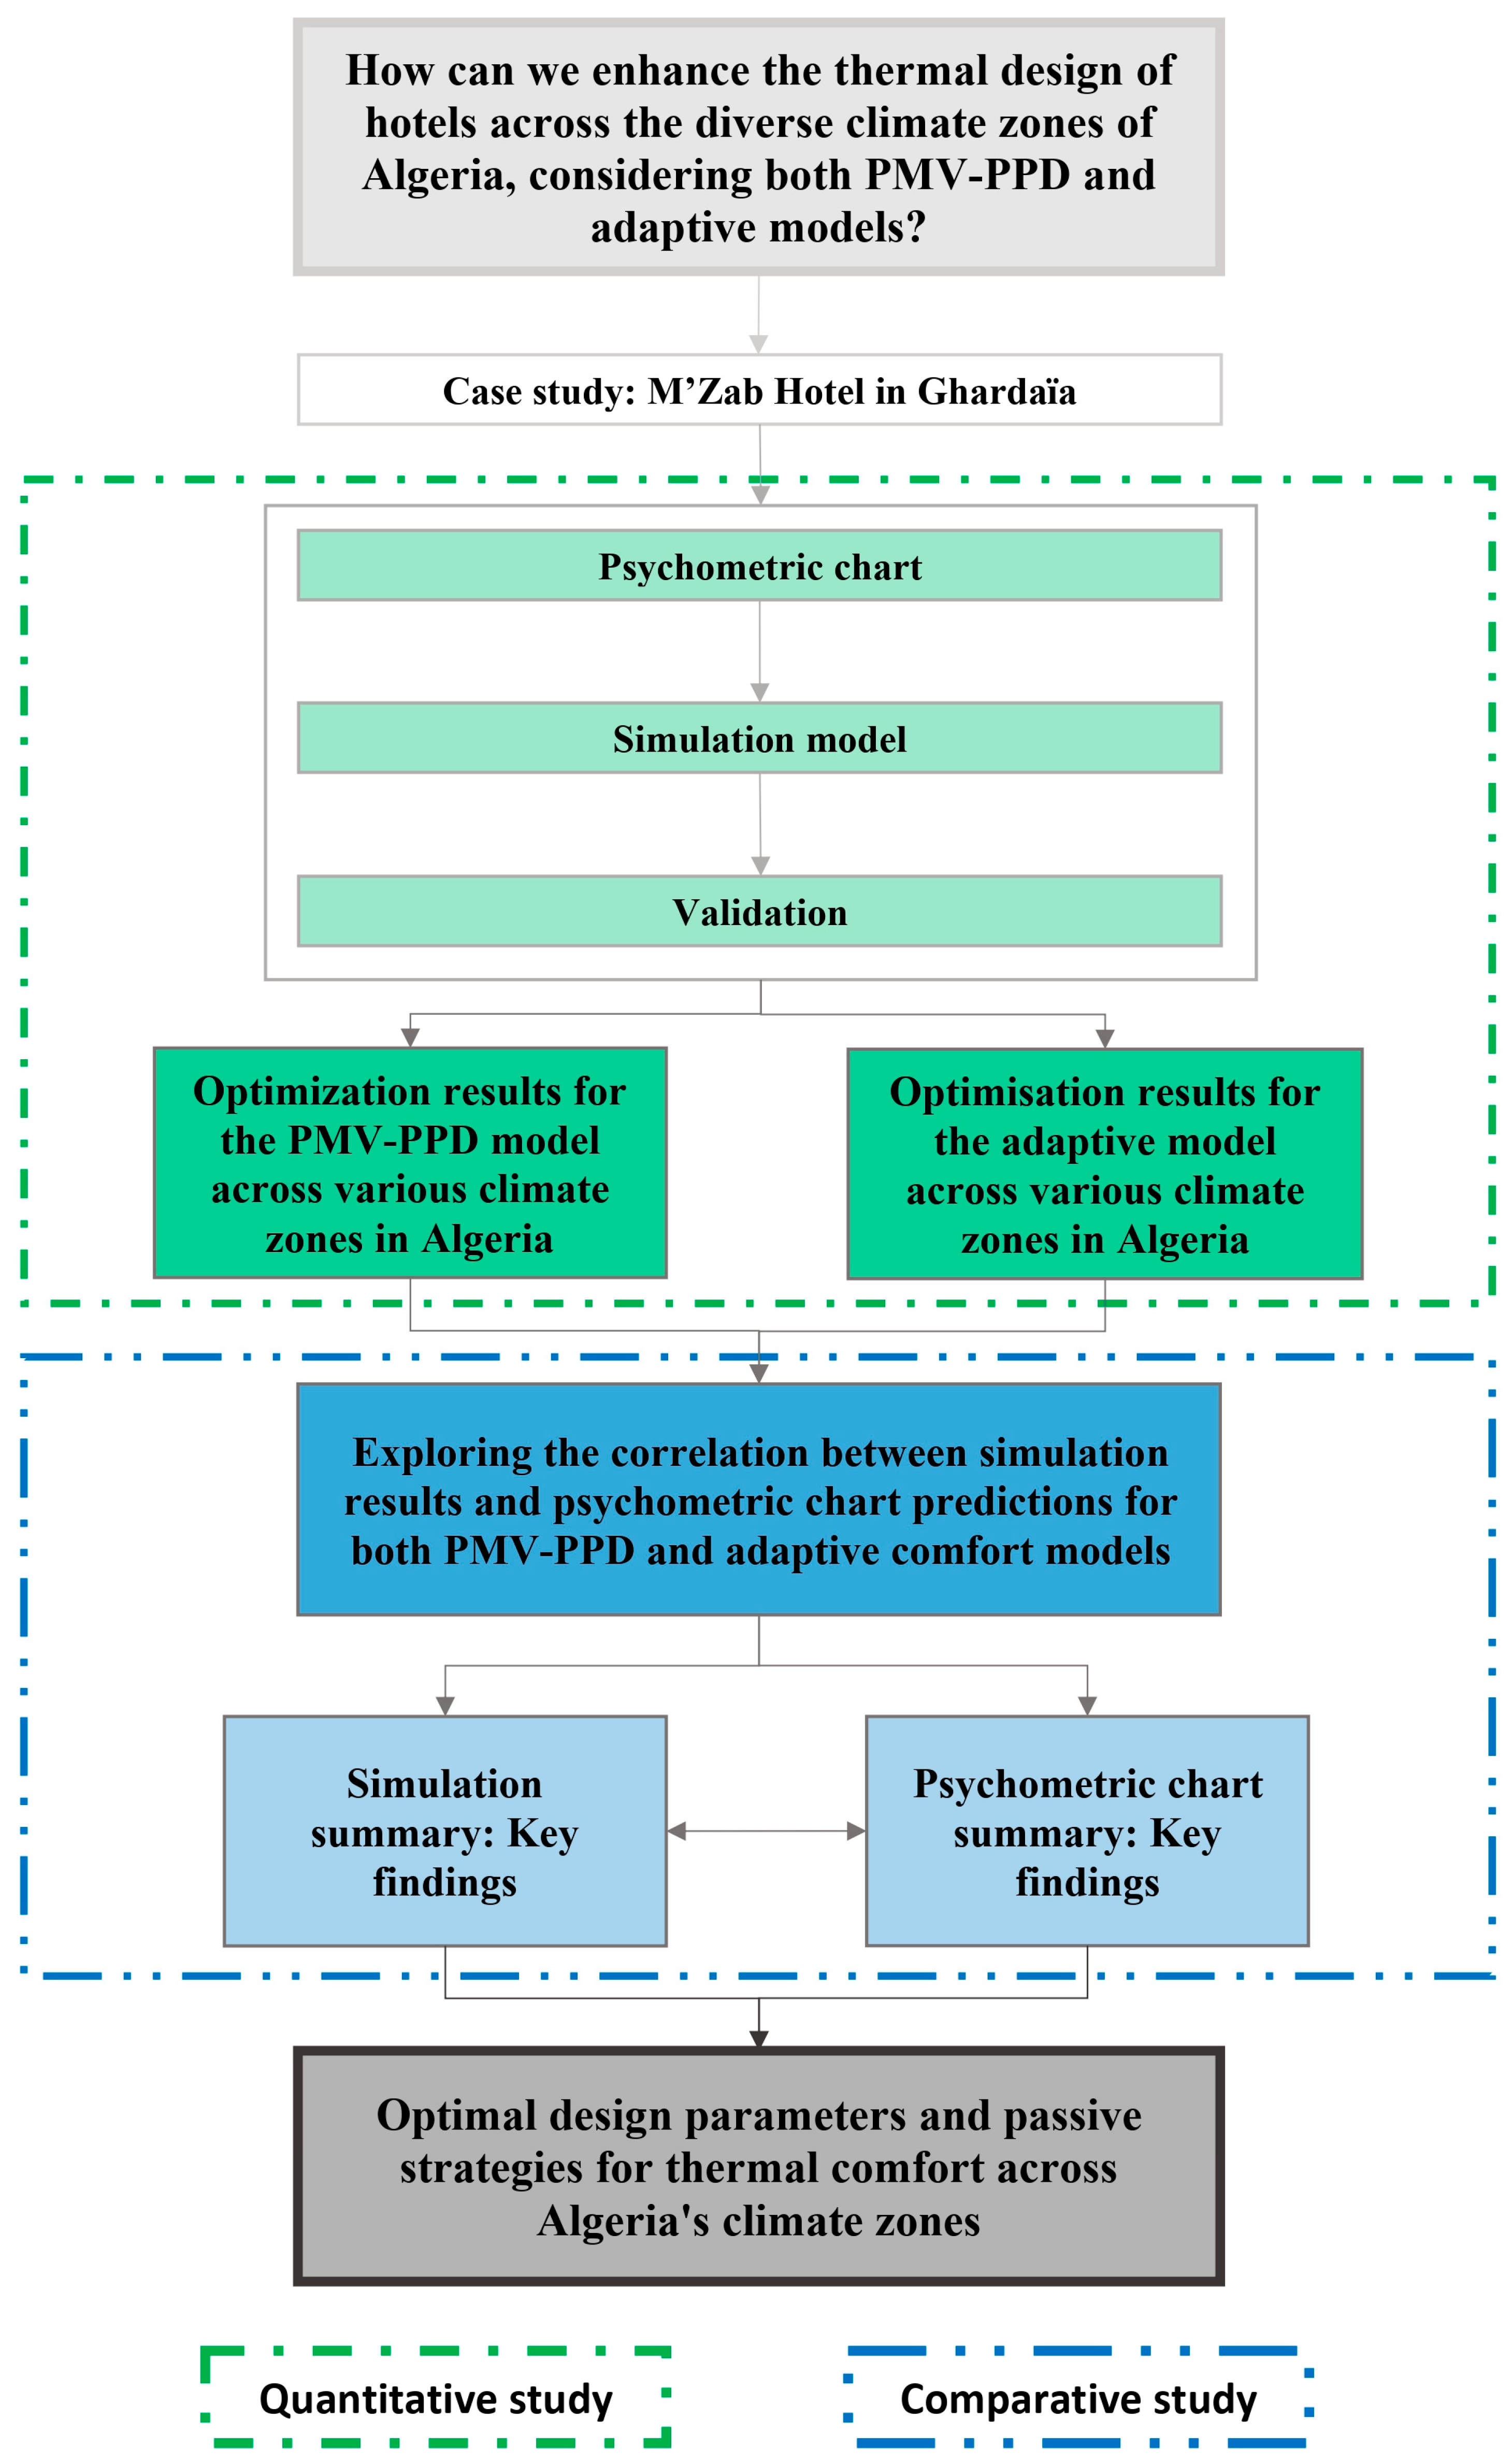
- Investigate the thermal behaviour of the M’Zab Hotel reference case across Algeria’s eight climate zones using psychrometric charts and dynamic simulations;
- Optimise the reference case by applying SA-derived parameters to both PMV-PPD comfort models in the eight climate zones of Algeria and compare the results with psychrometric chart predictions through linear regression;
- Identify best practice design parameters obtained through simulation and strategies derived from psychrometric charts in various Algerian climate zones.
2. Methods
3. Theoretical Foundations for Research
3.1. ‘Simulation-Based Optimisation’: A Literature Review
3.2. Thermal Comfort and Energy Performance in Hotel Buildings
4. The Case Study
4.1. Ghardaïa: M’Zab Hotel, by Fernand Pouillon
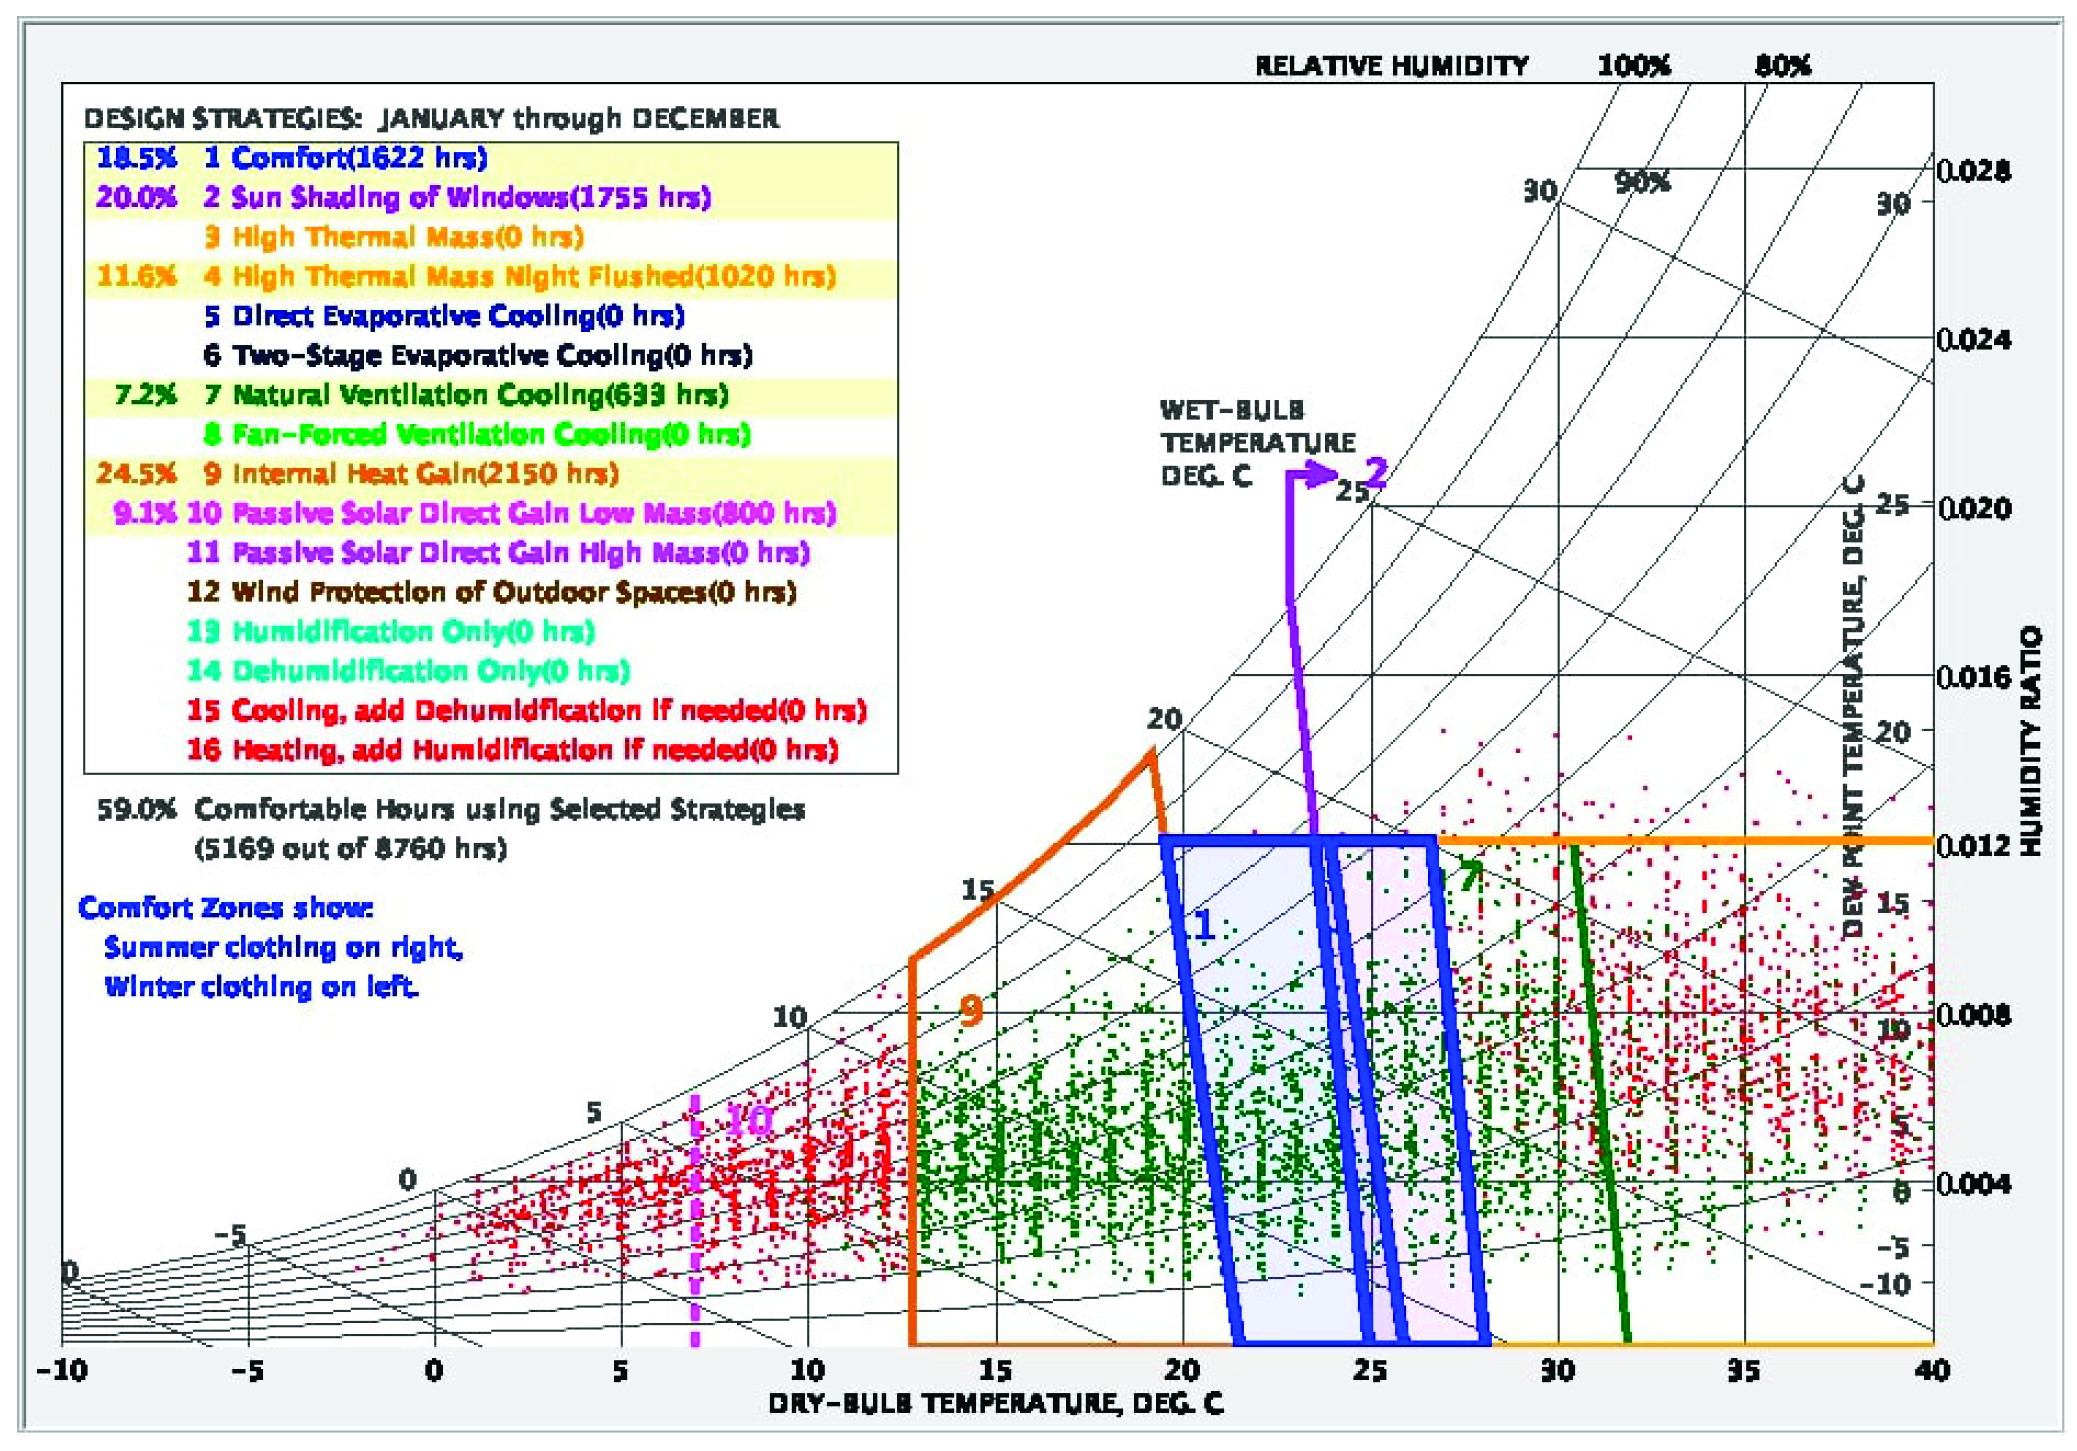
4.2. Psychrometric Chart
4.3. Simulation Model
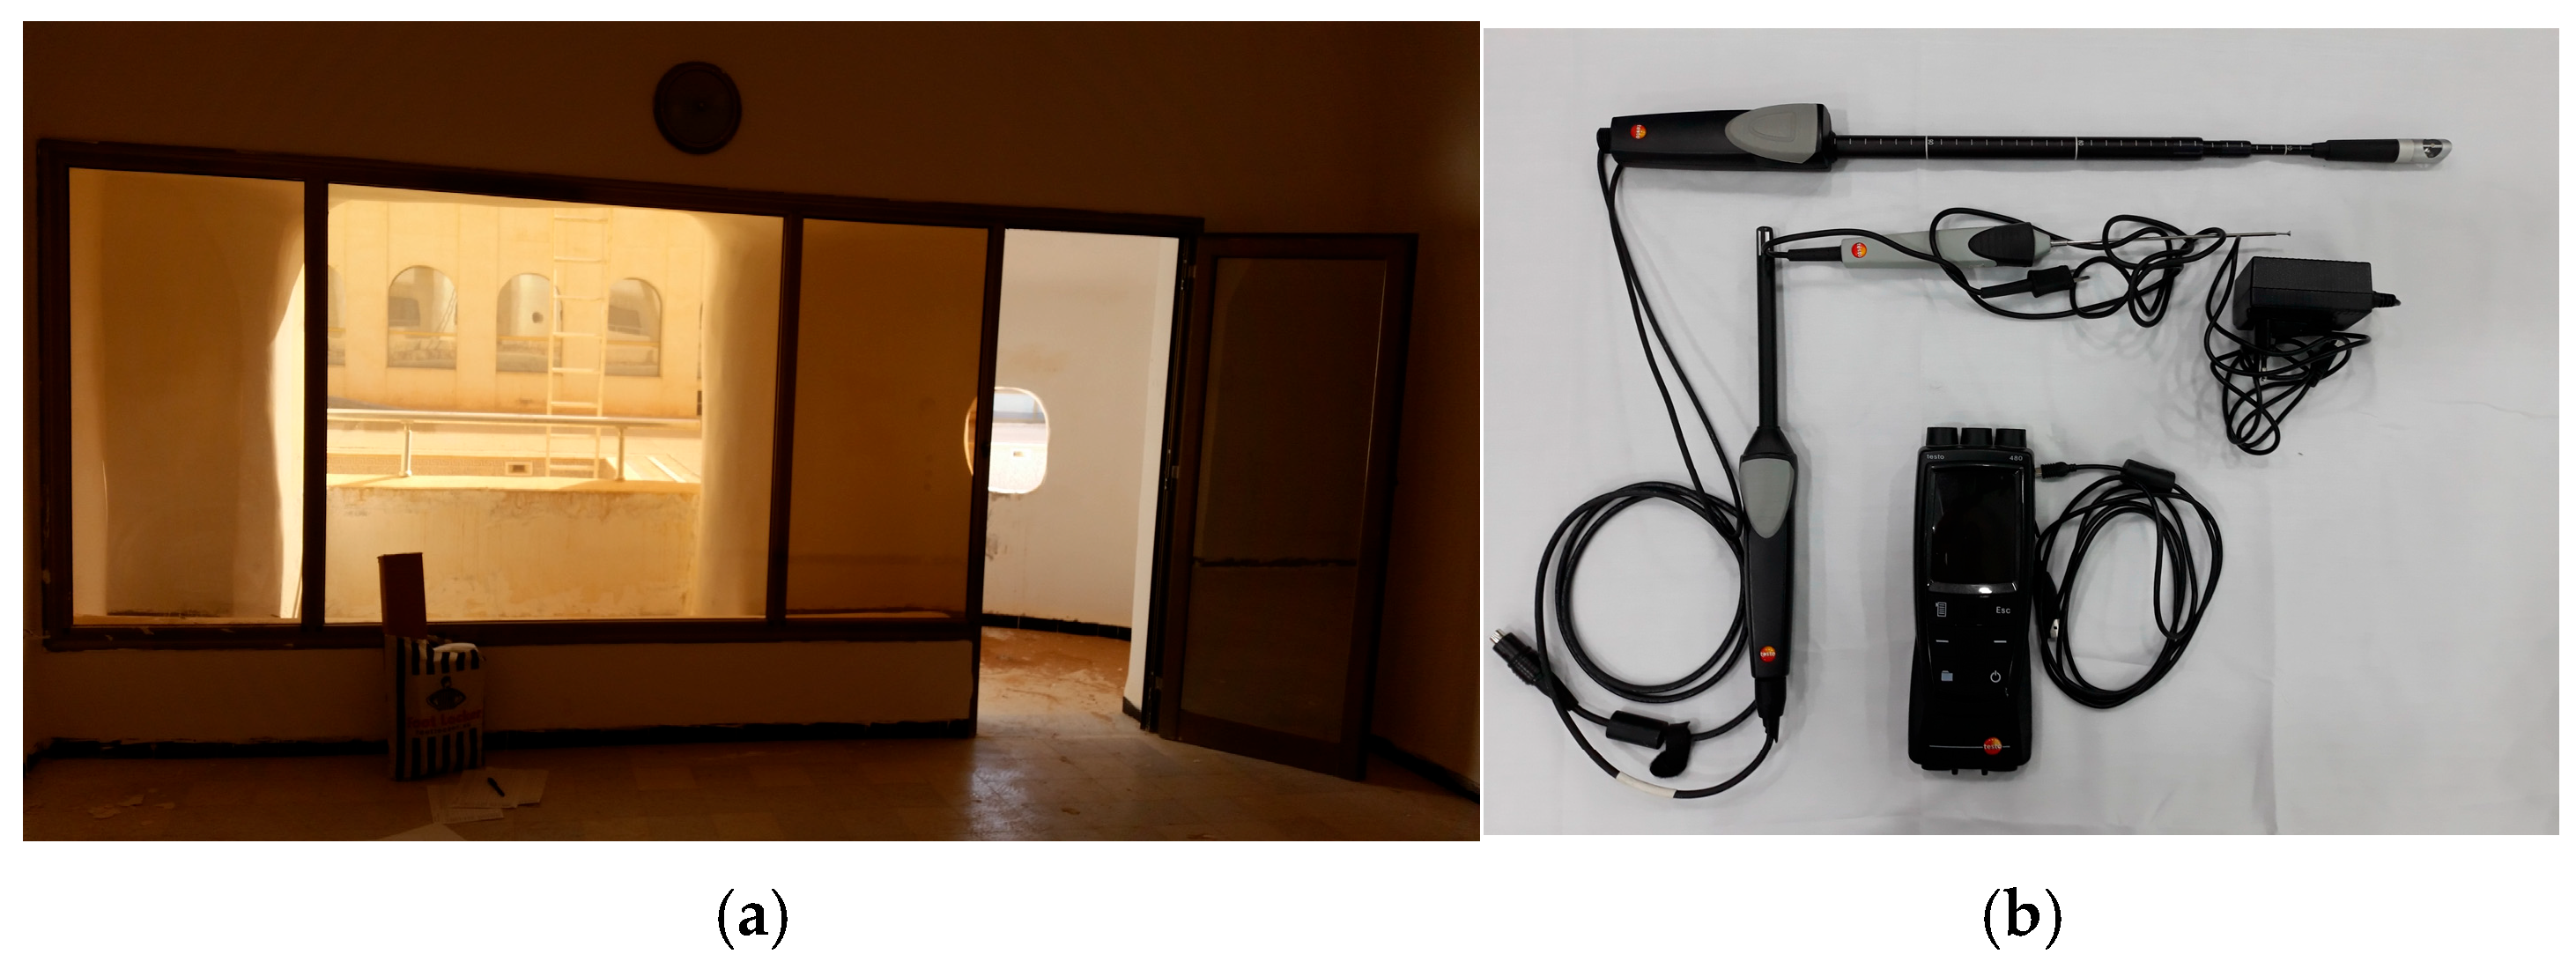
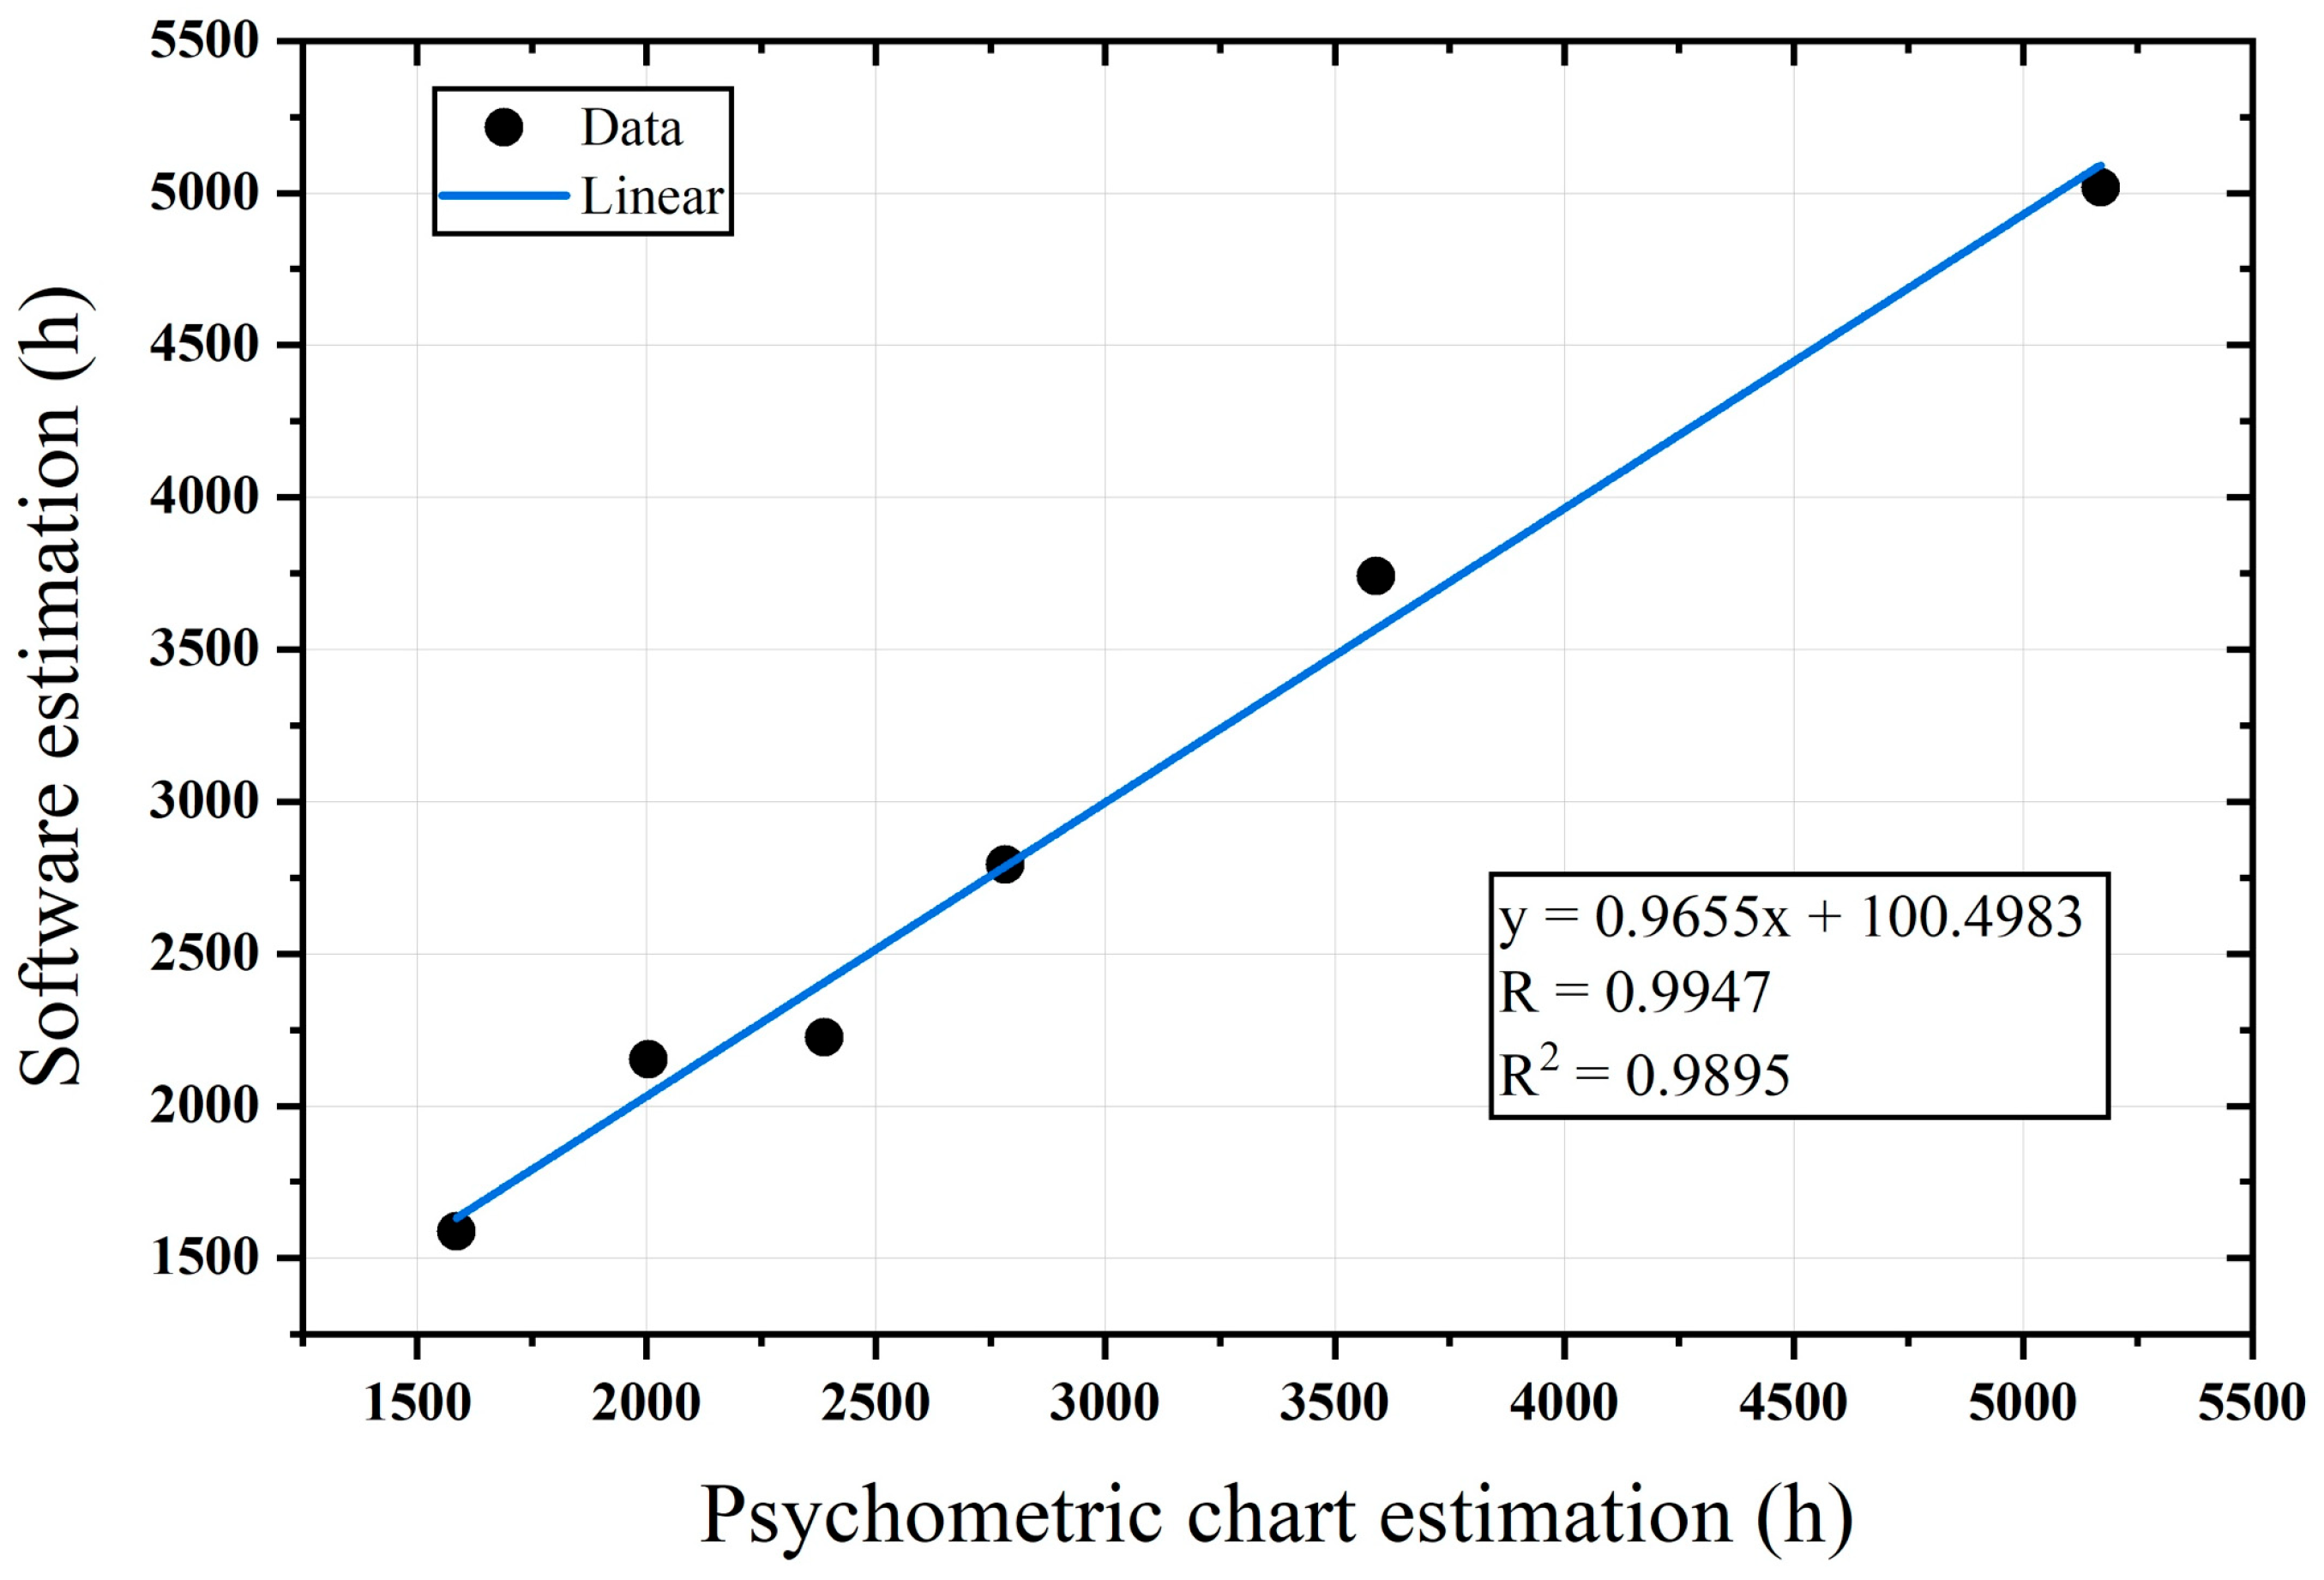
4.4. Model’s Validation
5. The Optimisation Process
- -
- The original materials and envelope construction (see Table 2), including double-layered hollow concrete block walls with air gaps, traditional plaster, and granite-tiled floors and roofs;
- -
- The geometry and zoning of the hotel’s eastern wing, which was selected due to the hotel’s large size. This includes multi-story rows of rooms surrounding a patio and detailed zoning based on floor plans;
- -
- The climatic data used for Ghardaïa over a reference year (2004–2018), with an 8760-h simulation in EnergyPlus/DesignBuilder (Version 4.8.0.068);
- -
- The internal conditions, such as the standard internal gains, ventilation assumptions (based on DTR C3-T regulations), and night ventilation control, based on indoor temperature thresholds (e.g., 22 °C);
- -
- The absence of mechanical HVAC operation, due to the building being unoccupied during the renovation period, ensures that the baseline represents purely passive performance conditions.
6. Results
- -
- Zone A—Algiers (Coastal Mediterranean, mild climate);
- -
- Zone B—Saïda (continental semi-arid);
- -
- Zone B1 and B2—Guelma (semi-arid with more seasonal variation);
- -
- Zone C—Tiaret (high plateau, dry);
- -
- Zone D—Béchar (arid steppe, near desert);
- -
- Zone E—Ghardaïa (El-Goléa) (hot–dry, Saharan fringe);
- -
- Zone E1—Illizi (Djanet) (hot–dry, deep Sahara);
- -
- Zone F—Ouargla (Hassi Messaoud) (extreme hot–dry desert);
6.1. Results of the PMV-PPD Model
6.2. Results of the Adaptive Model
7. Discussion and Implications
8. Conclusions
Author Contributions
Funding
Institutional Review Board Statement
Informed Consent Statement
Data Availability Statement
Conflicts of Interest
Nomenclature
| Symbols | |
| n | Number of measured periods |
| p | Number of parameters or terms in the baseline model, as developed by a mathematical analysis of the baseline data |
| ȳ | Measurements’ average |
| yi | Actual measurement during the period (i) |
| ŷi | Simulated value during the period (i) |
| Abbreviations | |
| ACH | Air changes per hour |
| ASHRAE | American Society of Heating, Refrigerating, and Air Conditioning Engineers |
| CFD | Computational fluid dynamics |
| CVRMSE | Coefficient of Variation of the Root Mean Square Error |
| DE | Differential evolution |
| GA | Genetic algorithm |
| IPMVP | International Performance Measurement and Verification Protocol |
| ISO | International Organisation for Standardisation |
| LCCA | Life cycle cost analysis |
| LSA | Local sensitivity analysis |
| MC | Mechanically conditioned |
| NMBE | Normalised mean bias error |
| NV | Naturally ventilated |
| OAT | One variable at a time |
| PMV | Predicted mean vote |
| PPD | Predicted percentage of dissatisfaction |
| PSO | Bare-bones particle optimisation |
| R | Pearson correlation coefficient |
| R2 | Regression coefficient |
| RH | Relative humidity |
| SA | Sensitivity analysis |
| TMY | Typical meteorological year |
| WWR | Window to wall ratio |
References
- NASA U.S. National Aeronautics and Space Administration Earth Science Communications Team. Global Climate Change: Vital Signs of the Planet. Available online: https://climate.nasa.gov/vital-signs/global-temperature/ (accessed on 30 September 2022).
- Mata, É.; Kalagasidis, A.S.; Johnsson, F. Building-stock aggregation through archetype buildings: France, Germany, Spain and the UK. Build. Environ. 2014, 81, 270–282. [Google Scholar] [CrossRef]
- ASHRAE. ASHRAE Standard 55-2017: Thermal Environmental Conditions for Human Occupancy; ASHRAE, Inc.: Atlanta, GA, USA, 2017. [Google Scholar]
- Kaihoul, A.; Pitzalis, E.; Sriti, L.; Di Turi, S.; Amraoui, K. Enhancing thermal comfort assessment: A sensitivity study of PMV-PPD and adaptive models in an Algerian reference hotel across different climate zones. Indoor Built Environ. 2024, 33, 1680–1704. [Google Scholar] [CrossRef]
- Kaihoul, A.; Sriti, L.; Amraoui, K.; Di Turi, S.; Ruggiero, F. The effect of climate-responsive design on thermal and energy performance: A simulation based study in the hot-dry Algerian South region. J. Build. Eng. 2021, 43, 103023. [Google Scholar] [CrossRef]
- Koh, C.H.; Schollbach, K.; Gauvin, F.; Brouwers, H.J.H. Aerogel composite for cavity wall rehabilitation in the Netherlands: Material characterization and thermal comfort assessment. Build. Environ. 2022, 209, 109535. [Google Scholar] [CrossRef]
- Calama-González, C.M.; Suárez, R.; León-Rodríguez, Á.L. Thermal comfort prediction of the existing housing stock in southern Spain through calibrated and validated parameterized simulation models. Energy Build. 2022, 254, 111562. [Google Scholar] [CrossRef]
- Jeong, B.; Kim, J.; Chen, D.; de Dear, R. Comparison of residential thermal comfort in two different climates in Australia. Build. Environ. 2022, 211, 108706. [Google Scholar] [CrossRef]
- Amraoui, K.; Sriti, L.; Di Turi, S.; Ruggiero, F.; Kaihoul, A. Exploring building’s envelope thermal behavior of the neo-vernacular residential architecture in a hot and dry climate region of Algeria. Build. Simul. 2021, 14, 1567–1584. [Google Scholar] [CrossRef]
- Kaihoul, A.; Pitzalis, E.; Sriti, L. An Exploration of Climate-Responsive Design Strategies Employed by El-Miniawy Brothers in Southern Algeria. J. Sustain. Archit. Civ. Eng. 2024, 36, 32–54. [Google Scholar]
- Calama-González, C.M.; Symonds, P.; León-Rodríguez, Á.L.; Suárez, R. Optimal retrofit solutions considering thermal comfort and intervention costs for the Mediterranean social housing stock. Energy Build. 2022, 259, 111915. [Google Scholar] [CrossRef]
- Yao, R.; Zhang, S.; Du, C.; Schweiker, M.; Hodder, S.; Olesen, B.W.; Li, B. Evolution and performance analysis of adaptive thermal comfort models–A comprehensive literature review. Build. Environ. 2022, 217, 109020. [Google Scholar] [CrossRef]
- Ter Mors, S.; Hensen, J.L.; Loomans, M.G.; Boerstra, A.C. Adaptive thermal comfort in primary school classrooms: Creating and validating PMV-based comfort charts. Build. Environ. 2011, 46, 2454–2461. [Google Scholar] [CrossRef]
- Orosa, J.A.; Oliveira, A.C. A new thermal comfort approach comparing adaptive and PMV models. Renew. Energy 2011, 36, 951–956. [Google Scholar] [CrossRef]
- Custódio, D.A.; Ghisi, E.; Rupp, R.F. Thermal comfort in university classrooms in humid subtropical climate: Field study during all seasons. Build. Environ. 2024, 258, 111644. [Google Scholar] [CrossRef]
- Ali-Toudert, F.; Weidhaus, J. Numerical assessment and optimization of a low-energy residential building for Mediterranean and Saharan climates using a pilot project in Algeria. Renew. Energy 2017, 101, 327–346. [Google Scholar] [CrossRef]
- Nguyen, A.T.; Rockwood, D.; Doan, M.K.; Le, T.K.D. Performance assessment of contemporary energy-optimized office buildings under the impact of climate change. J. Build. Eng. 2021, 35, 102089. [Google Scholar] [CrossRef]
- Nguyen, A.T.; Reiter, S. Passive designs and strategies for low-cost housing using simulation-based optimization and different thermal comfort criteria. J. Build. Perform. Simul. 2014, 7, 68–81. [Google Scholar] [CrossRef]
- Zeferina, V. Sensitivity analysis of cooling demand applied to a large office building. Energy Build. 2021, 235, 110703. [Google Scholar] [CrossRef]
- Hamdy, M.; Nguyen, A.T.; Hensen, J.L. A performance comparison of multi-objective optimization algorithms for solving nearly-zero-energy-building design problems. Energy Build. 2016, 121, 57–71. [Google Scholar] [CrossRef]
- Yong, Z.; Li-Juan, Y.; Qian, Z.; Xiao-Yan, S. Multi-objective optimization of building energy performance using a particle swarm optimizer with less control parameters. J. Build. Eng. 2020, 32, 101505. [Google Scholar] [CrossRef]
- Nguyen, A.T.; Rockwood, D. Developing an energy benchmarking system for hotel buildings using the statistical method and the simulation-based approach. J. Green Build. 2019, 14, 1–22. [Google Scholar] [CrossRef]
- Rawal, R.; Shukla, Y.; Vardhan, V.; Asrani, S.; Schweiker, M.; de Dear, R.; Garg, V.; Mathur, J.; Prakash, S.; Diddi, S.; et al. Adaptive thermal comfort model based on field studies in five climate zones across India. Build. Environ. 2022, 208, 109187. [Google Scholar] [CrossRef]
- Du, H.; Lian, Z.; Lai, D.; Duanmu, L.; Zhai, Y.; Cao, B.; Zhang, Y.; Zhou, X.; Wang, Z.; Zhang, X.; et al. Evaluation of the accuracy of PMV and its several revised models using the Chinese thermal comfort Database. Energy Build. 2022, 271, 112334. [Google Scholar] [CrossRef]
- Centre National d’Études et de Recherches Intégrées du Bâtiment (CNERIB). Document Technique Réglementaire DTR C3-T: Réglementation Thermique du Bâtiment; CNERIB: Algiers, Algeria, 2011. [Google Scholar]
- Climate Consultant. Energy and Climate Analysis Tool. Available online: https://energy-design-tools.aud.ucla.edu/climate-consultant/request-climate-consultant.php (accessed on 11 October 2020).
- ISO. ISO 7726; Ergonomics of the Thermal Environment—Instruments for Measuring Physical Quantities. International Organization for Standardization: Geneva, Switzerland, 2002.
- Testo. Testo 480: Portable and Stationary Measurement Solutions. 1957. Available online: https://www.testo.com/en-TH/testo-480/p/0563-4800 (accessed on 22 September 2022).
- Boudabia, I. General and specific information about M’Zab and El-Djanoub hotels in Ghardaïa. Interview by the author Ahmed Kaihoul in person. 7 August 2019. [Google Scholar]
- ASHRAE. ASHRAE Guideline 14-2002: Measurement of Energy and Demand Savings; ASHRAE, Inc.: Atlanta, GA, USA, 2002. [Google Scholar]
- Hou, F.; Ma, J.; Kwok, H.H.; Cheng, J.C. Prediction and optimization of thermal comfort, IAQ and energy consumption of typical air-conditioned rooms based on a hybrid prediction model. Build. Environ. 2022, 208, 109576. [Google Scholar] [CrossRef]
- Lin, C.J.; Wang, K.J.; Dagne, T.B.; Woldegiorgis, B.H. Balancing thermal comfort and energy conservation—A multi-objective optimization model for controlling air-condition and mechanical ventilation systems. Build. Environ. 2022, 208, 109237. [Google Scholar] [CrossRef]
- Zahid, H.; Elmansoury, O.; Yaagoubi, R. Dynamic Predicted Mean Vote: An IoT-BIM integrated approach for indoor thermal comfort optimization. Autom. Constr. 2021, 129, 103805. [Google Scholar] [CrossRef]


| Description | Parameter Measured | Range | Accuracy |
|---|---|---|---|
| Digital temperature and humidity recorder (Ø 12 mm) | Air temperature | −20 to +70 °C | ±0.2 °C (+15 to +30 °C) ±0.5 °C (Remaining Range) |
| Relative humidity | 0 to 100%RH | ±(1.0%RH + 0.7% of mv) (0 to 90%RH) ±(1.4%RH + 0.7% of mv) (90 to 100%RH) | |
| Surface probe (Ø 4 mm) | Surface temperature of wall and roof | −60 to +1000 °C | ±1.5 °C (−40 to +375 °C) ±0.4% of reading (+375 to +1000 °C) |
| Vane/temperature probe (Ø 16 mm) | Air velocity | +0.6 to +50 m/s | ±(0.2 m/s + 1% of mv) (0.6 to +40 m/s) ±(0.2 m/s + 2% of mv) (40.1 to +50 m/s) |
| Space Type | Time Period | Occupancy Ratio (Fraction) | Notes |
|---|---|---|---|
| Guest Rooms | 00:00–07:00 | 1.0 | Full occupancy during night |
| 07:00–09:00 | 0.5 | Morning activity (pre-checkout, grooming, breakfast) | |
| 09:00–17:00 | 0.2 | Most guests out, minimal presence | |
| 17:00–23:00 | 0.8 | Evening use, dinner, rest | |
| Circulation Spaces | 08:00–12:00 | 0.3 | Regular guest movement |
| 12:00–14:00 | 0.5 | Peak check-in/check-out and lunch movement | |
| 14:00–18:00 | 0.3 | Afternoon circulation | |
| 18:00–23:00 | 0.4 | Evening movement | |
| Patio and Common Areas | 08:00–23:00 | 0.3 | Intermittent and informal use by guests and staff |
| Criteria | Tool | Value | ||
|---|---|---|---|---|
| In situ measurements | Testo 480 (Forbach, France) | Aligns with ISO 7726-2002 and ASHRAE 55 | ||
| Weather data | (.epw) | 8769 h for the reference year | ||
| Simulation model | EnergyPlus/DesignBuilder (Version 4.8.0.068) | Surface area of 3333 m2 +3481 m2 for the patio 27 zones in total | ||
| Night flushing | EnergyPlus/DesignBuilder (Version 4.8.0.068) | Opening windows at night (T > 22 °C) | ||
| Lighting | EnergyPlus/DesignBuilder (Version 4.8.0.068) | Minimum software requirements | ||
| Envelope materials | Algerian Technical Regulation Document (DTR C3-T). | Material | Transmittance (W/m2K) | |
| First balcony wall composition | 2.426 | |||
| Second load-bearing wall composition | 1.341 | |||
| Roof composition | 1.964 | |||
| Floor composition | 1.611 | |||
| Single clear glazing | 5.871 | |||
| Internal gains from occupant | EnergyPlus/DesignBuilder (Version 4.8.0.068) | Standard internal gains of each space according to the occupancy (excluding appliances) | ||
| Air changes per hour (ACH) | Algerian Technical Regulation Document (DTR C3-T). | Summer | Winter | |
| Infiltration | 0.1177 | 0.055 | ||
| Air renewal | 0.1 | 0.6 | ||
| Occupancy schedule | EnergyPlus/DesignBuilder (Version 4.8.0.068) | Walkthrough visits and interviews | ||
| Estimation Tool (Through a Single Year—8760 h) | Comfort (h) | Discomfort (h) | ||||
|---|---|---|---|---|---|---|
| Summer | Winter | Total | Summer | Winter | Total | |
| Psychrometric chart * | 2387 (27.2%) | 2782 (31.8%) | 5169 (59%) | 2005 (22.9%) | 1586 (18.1%) | 3591 (41%) |
| Simulation ** | 2226 (25.4%) | 2793 (31.9%) | 5019 (57.3%) | 2154 (24.6%) | 1587 (18.1%) | 3741 (42.7%) |
| Estimation Tool (Through a Single Year—8760 h) | Comfort (h) | Discomfort (h) | ||||
|---|---|---|---|---|---|---|
| Summer | Winter | Total | Summer | Winter | Total | |
| Psychrometric chart * | 2295 (26.2%) | 2783 (31.8%) | 5078 (58%) | 2097 (24%) | 1585 (18%) | 3682 (42%) |
| Simulation ** | - | - | 6492 (74.1%) | - | - | 2268 (25.9%) |
| N° | Climate Zone | Optimised Design Choices | ||
|---|---|---|---|---|
| PMV-PPD Model | Adaptive Model | |||
| x1 (Azimuth) | Algiers/A | 135° (northern west–southern east) | 135° (northern west–southern east) | |
| Saïda/B | ||||
| Guelma/B1 and B2 | ||||
| Tiaret/C | 315° (northern west–southern east) | |||
| Béchar/D | 135° (northern west–southern east) | |||
| Ghardaïa (El-Goléa)/E | ||||
| Illizi (Djanet)/E1 | ||||
| Ouargla (Hassi Messaoud)/F | ||||
| x2 (Equipment power) | Algiers/A | 20 W/m2 | 20 W/m2 | |
| Saïda/B | 0 W/m2 | |||
| Guelma/B1 and B2 | ||||
| Tiaret/C | ||||
| Béchar/D | 16 W/m2 | |||
| Ghardaïa (El-Goléa)/E | 12 W/m2 | |||
| Illizi (Djanet)/E1 | 0 W/m2 | 0 W/m2 | ||
| Ouargla (Hassi Messaoud)/F | 20 W/m2 | 16 W/m2 | ||
| x3 (Ext. walls) | Algiers/A | (P+I+W+P), W [0.4 m], I [0.1 m] (W) Adobe brick wall | (P+W+P), W [0.5 m] (W) Lime–sandstone wall | |
| Saïda/B | (P+W+I+P), W [0.4 m], I [0.1 m] (W) Hollow brick wall | (P+W+P), W [0.5 m] (W) Hollow concrete block wall | ||
| Guelma/B1 and B2 | (P+I+W+P), W [0.2 m], I [0.05 m] (W) Lime–sandstone wall | (P+W+P), W [0.5 m] (W) Hollow concrete block wall | ||
| Tiaret/C | (P+W+I+P), W [0.2 m], I [0.05 m] (W) Adobe brick wall | P+W+P), W [0.5 m] (W) Lime–sandstone wall | ||
| Béchar/D | (P+W+I+P), W [0.4 m], I [0.1 m] (W) Hollow brick wall | P+W+P), W [0.5 m] (W) Lime–sandstone wall | ||
| Ghardaïa (El-Goléa)/E | (P+W+I+P), W [0.2 m], I [0.05 m] (W) Hollow brick wall | (P+W+P), W [0.3 m] (W) Hollow concrete block wall | ||
| Illizi (Djanet)/E1 | (P+I+W+P), W [0.4 m], I [0.1 m] (W) Adobe brick wall | (P+W+P), W [0.1 m] (W) Hollow concrete block wall | ||
| Ouargla (Hassi Messaoud)/F | (P+W+I+P), W [0.4 m], I [0.1 m] (W) Lime–sandstone wall | P+W+P), W [0.5 m] (W) Lime–sandstone wall | ||
| x4 (Glazing) | Algiers/A | Double glazing + Krypton gas (SageGlass Climaplus Blue No Tint) U = 1.267 | Double glazing + Krypton (SageGlass Climaplus Blue No Tint) U = 1.267 | |
| Saïda/B | ||||
| Guelma/B1 and B2 | ||||
| Tiaret/C | ||||
| Béchar/D | ||||
| Ghardaïa (El-Goléa)/E | ||||
| Illizi (Djanet)/E1 | ||||
| Ouargla (Hassi Messaoud)/F | ||||
| x5 (Infiltration) | Algiers/A | 1 ac/h | 0.3 ac/h | |
| Saïda/B | 1.4 ac/h | |||
| Guelma/B1 and B2 | 0.9 ac/h | 0.7 ac/h | ||
| Tiaret/C | 1.4 ac/h | 0.4 ac/h | ||
| Béchar/D | 0.7 ac/h | 0.7 ac/h | ||
| Ghardaïa (El-Goléa)/E | 1 ac/h | |||
| Illizi (Djanet)/E1 | 1.4 ac/h | 1.4 ac/h | ||
| Ouargla (Hassi Messaoud)/F | 1 ac/h | 0 ac/h | ||
| x6 (Int. walls) | Algiers/A | (P+W+P), W [0.1 m] (W) Hollow concrete block wall | (P+W+P), W [0.3 m] (W) Lime–sandstone wall | |
| Saïda/B | ||||
| Guelma/B1 and B2 | ||||
| Tiaret/C | P+W+P), W [0.3 m] (W) Hollow brick wall | |||
| Béchar/D | P+W+P), W [0.1 m] (W) Hollow brick wall | (P+W+P), W [0.3 m] (W) Hollow concrete block wall | ||
| Ghardaïa (El-Goléa)/E | (P+W+P), W [0.1 m] (W) Hollow concrete block wall | (P+W+P), W [0.1 m] (W) Hollow concrete block wall | ||
| Illizi (Djanet)/E1 | P+W+P), W [0.1 m] (W) Hollow brick wall | (P+W+P), W [0.3 m] (W) Hollow concrete block wall | ||
| Ouargla (Hassi Messaoud)/F | (P+W+P), W [0.1 m] (W) Hollow concrete block—case study wall | (P+W+P), W [0.1 m] (W) Hollow concrete block wall | ||
| x7 (Lighting) | Algiers/A | 15 W/m2 | 0 W/m2 | |
| Saïda/B | ||||
| Guelma/B1 and B2 | 12 W/m2 | |||
| Tiaret/C | ||||
| Béchar/D | ||||
| Ghardaïa (El-Goléa)/E | ||||
| Illizi (Djanet)/E1 | 6 W/m2 | |||
| Ouargla (Hassi Messaoud)/F | 12 W/m2 | |||
| x8 (Roofs) | Algiers/A | (G+C+I+R+P), R [0.3 cm], I [0.15 m] (R) Hollow polystyrene block slab | (G+C+I+R+P), R [0.1 cm], I [0.05 m] (R) Hollow concrete block slab—case study | |
| Saïda/B | ||||
| Guelma/B1 and B2 | (G+C+R+P), R [0.3 m] (R) Hollow polystyrene block slab | (G+C+I+R+P), R [0.1 cm], I [0.05 m] (R) Hollow brick block slab | ||
| Tiaret/C | (G+C+I+R+P), R [0.3 cm], I [0.15 m] (R) Hollow polystyrene block slab | (G+C+I+R+P), R [0.3 cm], I [0.15 m] (R) Hollow concrete block slab—case study | ||
| Béchar/D | (G+C+R+P), R [0.3 m] (R) Hollow brick block with earth material slab | |||
| Ghardaïa (El-Goléa)/E | (G+C+I+R+P), R [0.3 cm], I [0.15 m] (R) Hollow brick block with earth material slab | |||
| Illizi (Djanet)/E1 | (G+C+R+I+P), R [0.1 m], I [0.05 m] (R) Hollow concrete block slab—case study | (G+C+R+I+P), R [0.3 m], I [0.15 m] (R) Hollow polystyrene block slab | ||
| Ouargla (Hassi Messaoud)/F | (G+C+I+R+P), R [0.2 cm], I [0.1 m] (R) Hollow polystyrene block slab | (G+C+R+P), R [0.3 m] (R) Hollow brick block with earth material slab | ||
| x9 (Shading) | Algiers/A | No shading | Overhangs + sidefines [1 m] | |
| Saïda/B | Horizontal overhangs [0.5 m] | Overhangs + sidefines [1.5 m] | ||
| Guelma/B1 and B2 | No shading | |||
| Tiaret/C | Horizontal overhangs [1.5 m] | |||
| Béchar/D | No shading | Horizontal overhangs [1.5 m] | ||
| Ghardaïa (El-Goléa)/E | Horizontal overhangs [0.5 m] | Overhangs + sidefines [1.5 m] | ||
| Illizi (Djanet)/E1 | Overhangs + sidefines [1.5 m] | |||
| Ouargla (Hassi Messaoud)/F | No shading | |||
| x10 (Space density) | Algiers/A | 0 People/m2 | 0.4 People/m2 | |
| Saïda/B | 0.2 People/m2 | |||
| Guelma/B1 and B2 | 0.3 People/m2 | |||
| Tiaret/C | 0.4 People/m2 | |||
| Béchar/D | 0.2 People/m2 | |||
| Ghardaïa (El-Goléa)/E | ||||
| Illizi (Djanet)/E1 | 0.1 People/m2 | |||
| Ouargla (Hassi Messaoud)/F | 0.2 People/m2 | |||
| x11 (Ventilation scheme) | Algiers/A | On 7/24 | On 7/24 | |
| Saïda/B | ||||
| Guelma/B1 and B2 | ||||
| Tiaret/C | ||||
| Béchar/D | ||||
| Ghardaïa (El-Goléa)/E | ||||
| Illizi (Djanet)/E1 | ||||
| Ouargla (Hassi Messaoud)/F | ||||
| x12 (Ventilation rate) | Algiers/A | 12 ac/h | 12 ac/h | |
| Saïda/B | ||||
| Guelma/B1 and B2 | ||||
| Tiaret/C | ||||
| Béchar/D | ||||
| Ghardaïa (El-Goléa)/E | ||||
| Illizi (Djanet)/E1 | ||||
| Ouargla (Hassi Messaoud)/F | ||||
| x13 (WWR) | Algiers/A | 50% | 10% | |
| Saïda/B | 30% | |||
| Guelma/B1 and B2 | ||||
| Tiaret/C | 10% | |||
| Béchar/D | 30% | |||
| Ghardaïa (El-Goléa)/E | ||||
| Illizi (Djanet)/E1 | 10% | |||
| Ouargla (Hassi Messaoud)/F | 30% | |||
| ‘Shaded cells’ present design choices that are different between PMV-PPD model and adaptive model | ||||
| Wall: (P) Plaster * (W) Wall’s main materials: - Hollow brick wall - Adobe brick wall - Lime–sandstone wall - Hollow concrete block—case study wall - Hollow concrete block wall (I) Insulation (expanded polystyrene) (A) Air gap | Roof: (G) Granite tile ** (C) Cement layer *** (R) Roof’s main materials: - Hollow polystyrene block slab - Hollow brick block with earth material slab - Hollow brick block slab - Hollow concrete block slab—case study (P) Plaster * (I) Insulation (expanded polystyrene) | |||
| Model | Algiers/A | Saïda/B | Guelma/B1 and B2 | Tiaret/C | Béchar/D | Ghardaïa (El-Goléa)/E | Illzi (Djanet)/E1 | Ouargla (Hassi Messaoud)/F | |
|---|---|---|---|---|---|---|---|---|---|
| Climate | |||||||||
| Sim. | Base (h) | 3945 | 3836 | 3825 | 3895 | 3790 | 3741 | 3717 | 3784 |
| Optim. (h) | 1801 | 1734 | 1744 | 2445 | 2015 | 2277 | 2679 | 2390 | |
| Chart | Base (h) | 4257 | 3406 | 3833 | 3763 | 3560 | 3591 | 2763 | 3629 |
| Optim. (h) | 2330 | 2479 | 2575 | 3197 | 1769 | 1840 | 674 | 2006 |
| Model | Algiers/A | Saïda/B | Guelma/B1 and B2 | Tiaret/C | Béchar/D | Ghardaïa (El-Goléa)/E | Illzi (Djanet)/E1 | Ouargla (Hassi Messaoud)/F | |
|---|---|---|---|---|---|---|---|---|---|
| Climate | |||||||||
| Sim. | Base (h) | 2810 | 2345 | 2711 | 2050 | 2620 | 2268 | 3398 | 2312 |
| Optim. (h) | 528 | 1434 | 765 | 198 | 995 | 1333 | 2050 | 774 | |
| Chart | Base (h) | 3421 | 3376 | 3496 | 3767 | 3616 | 3682 | 2716 | 3657 |
| Optim. (h) | 2592 | 3171 | 3136 | 3836 | 2146 | 2234 | 963 | 2356 |
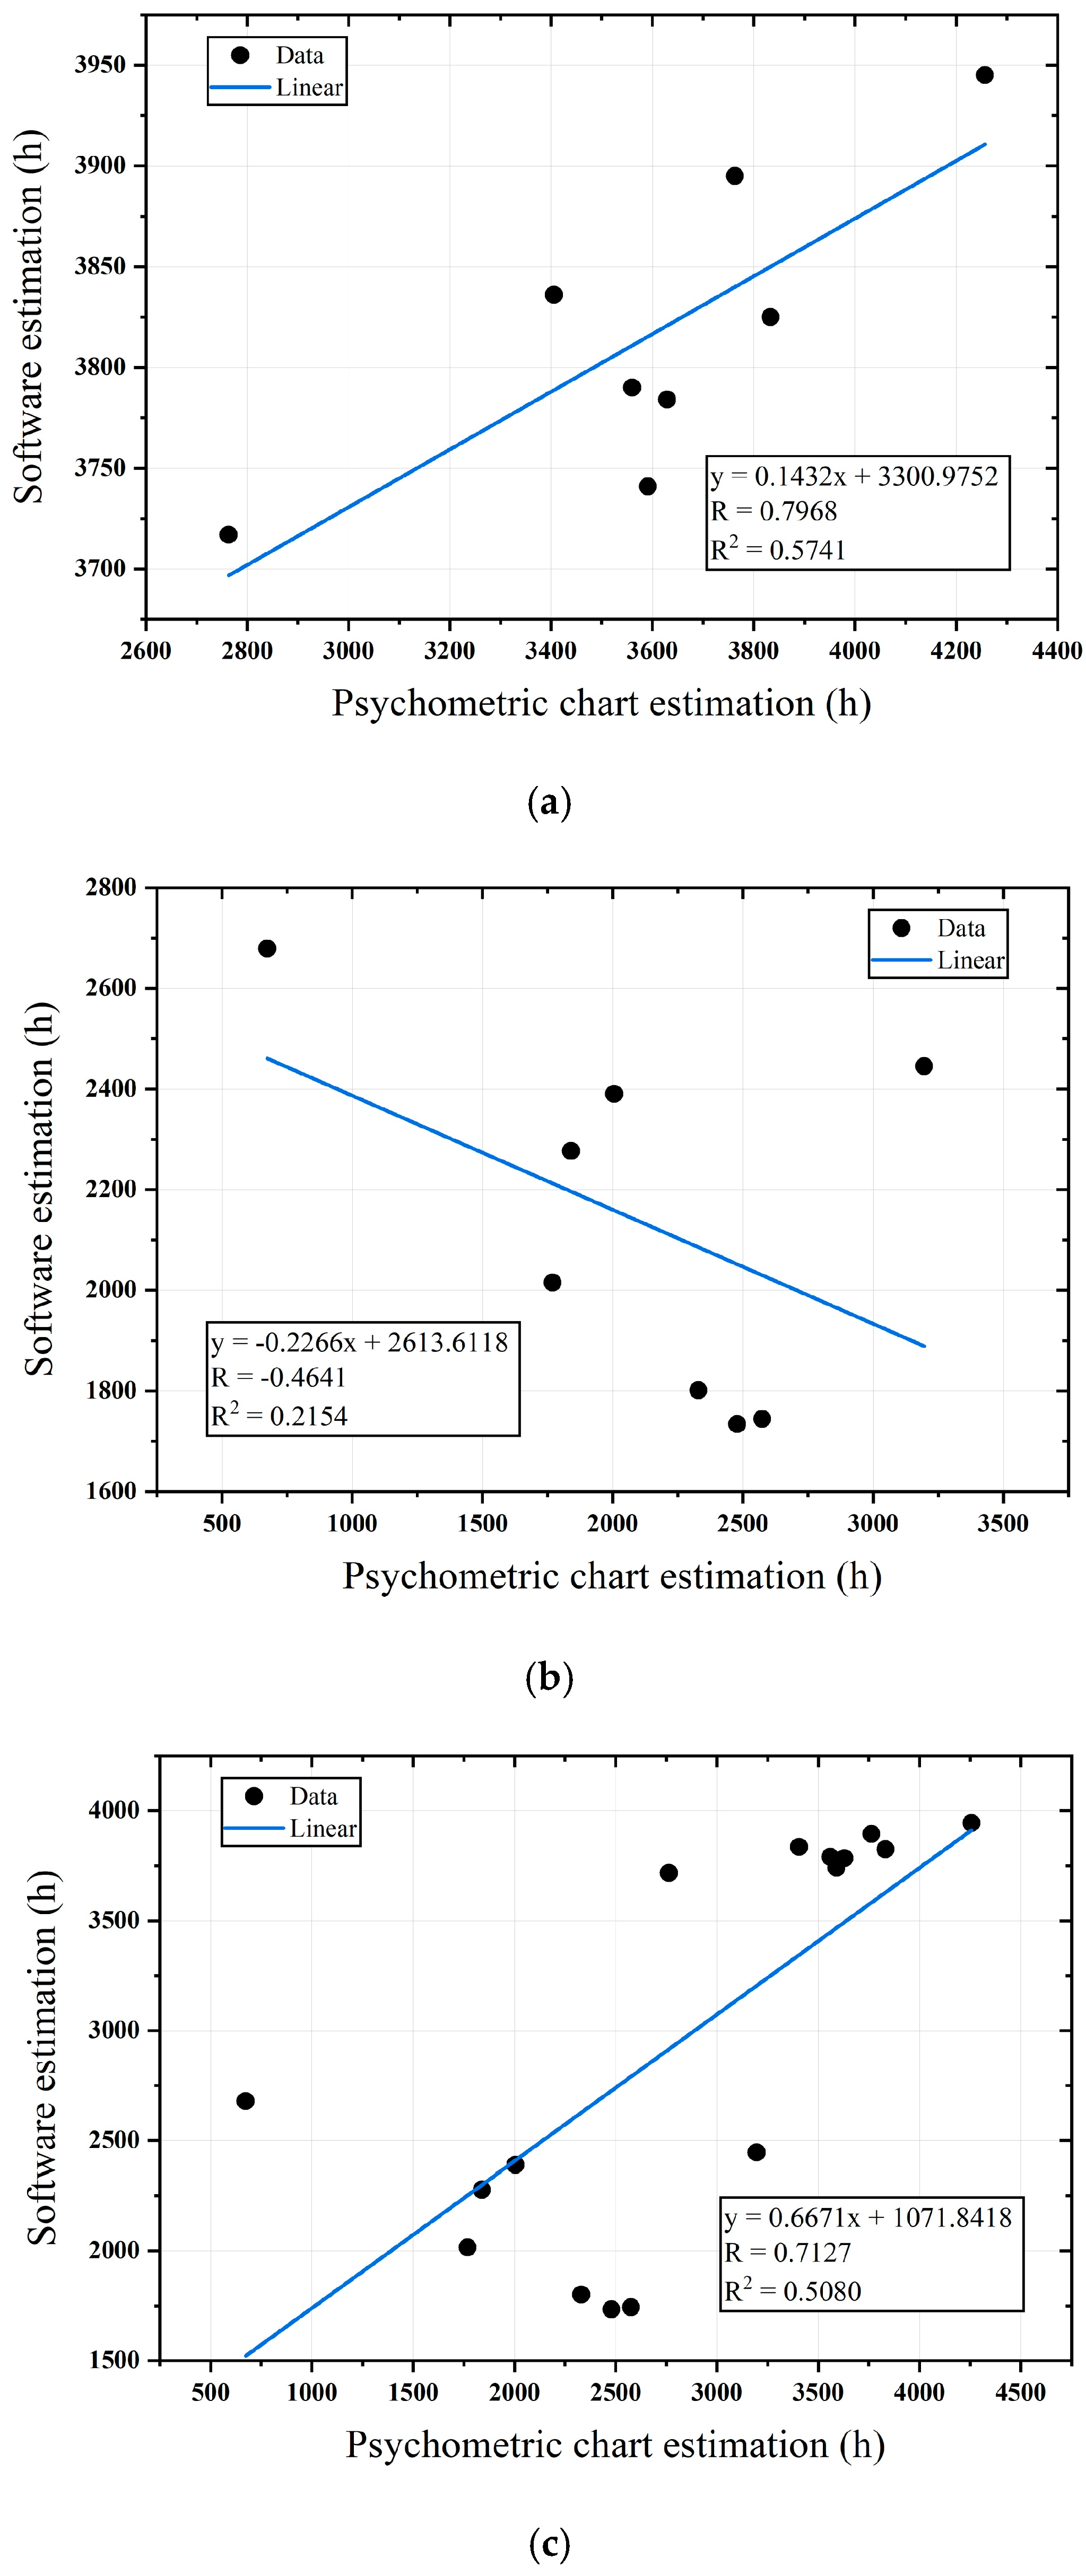
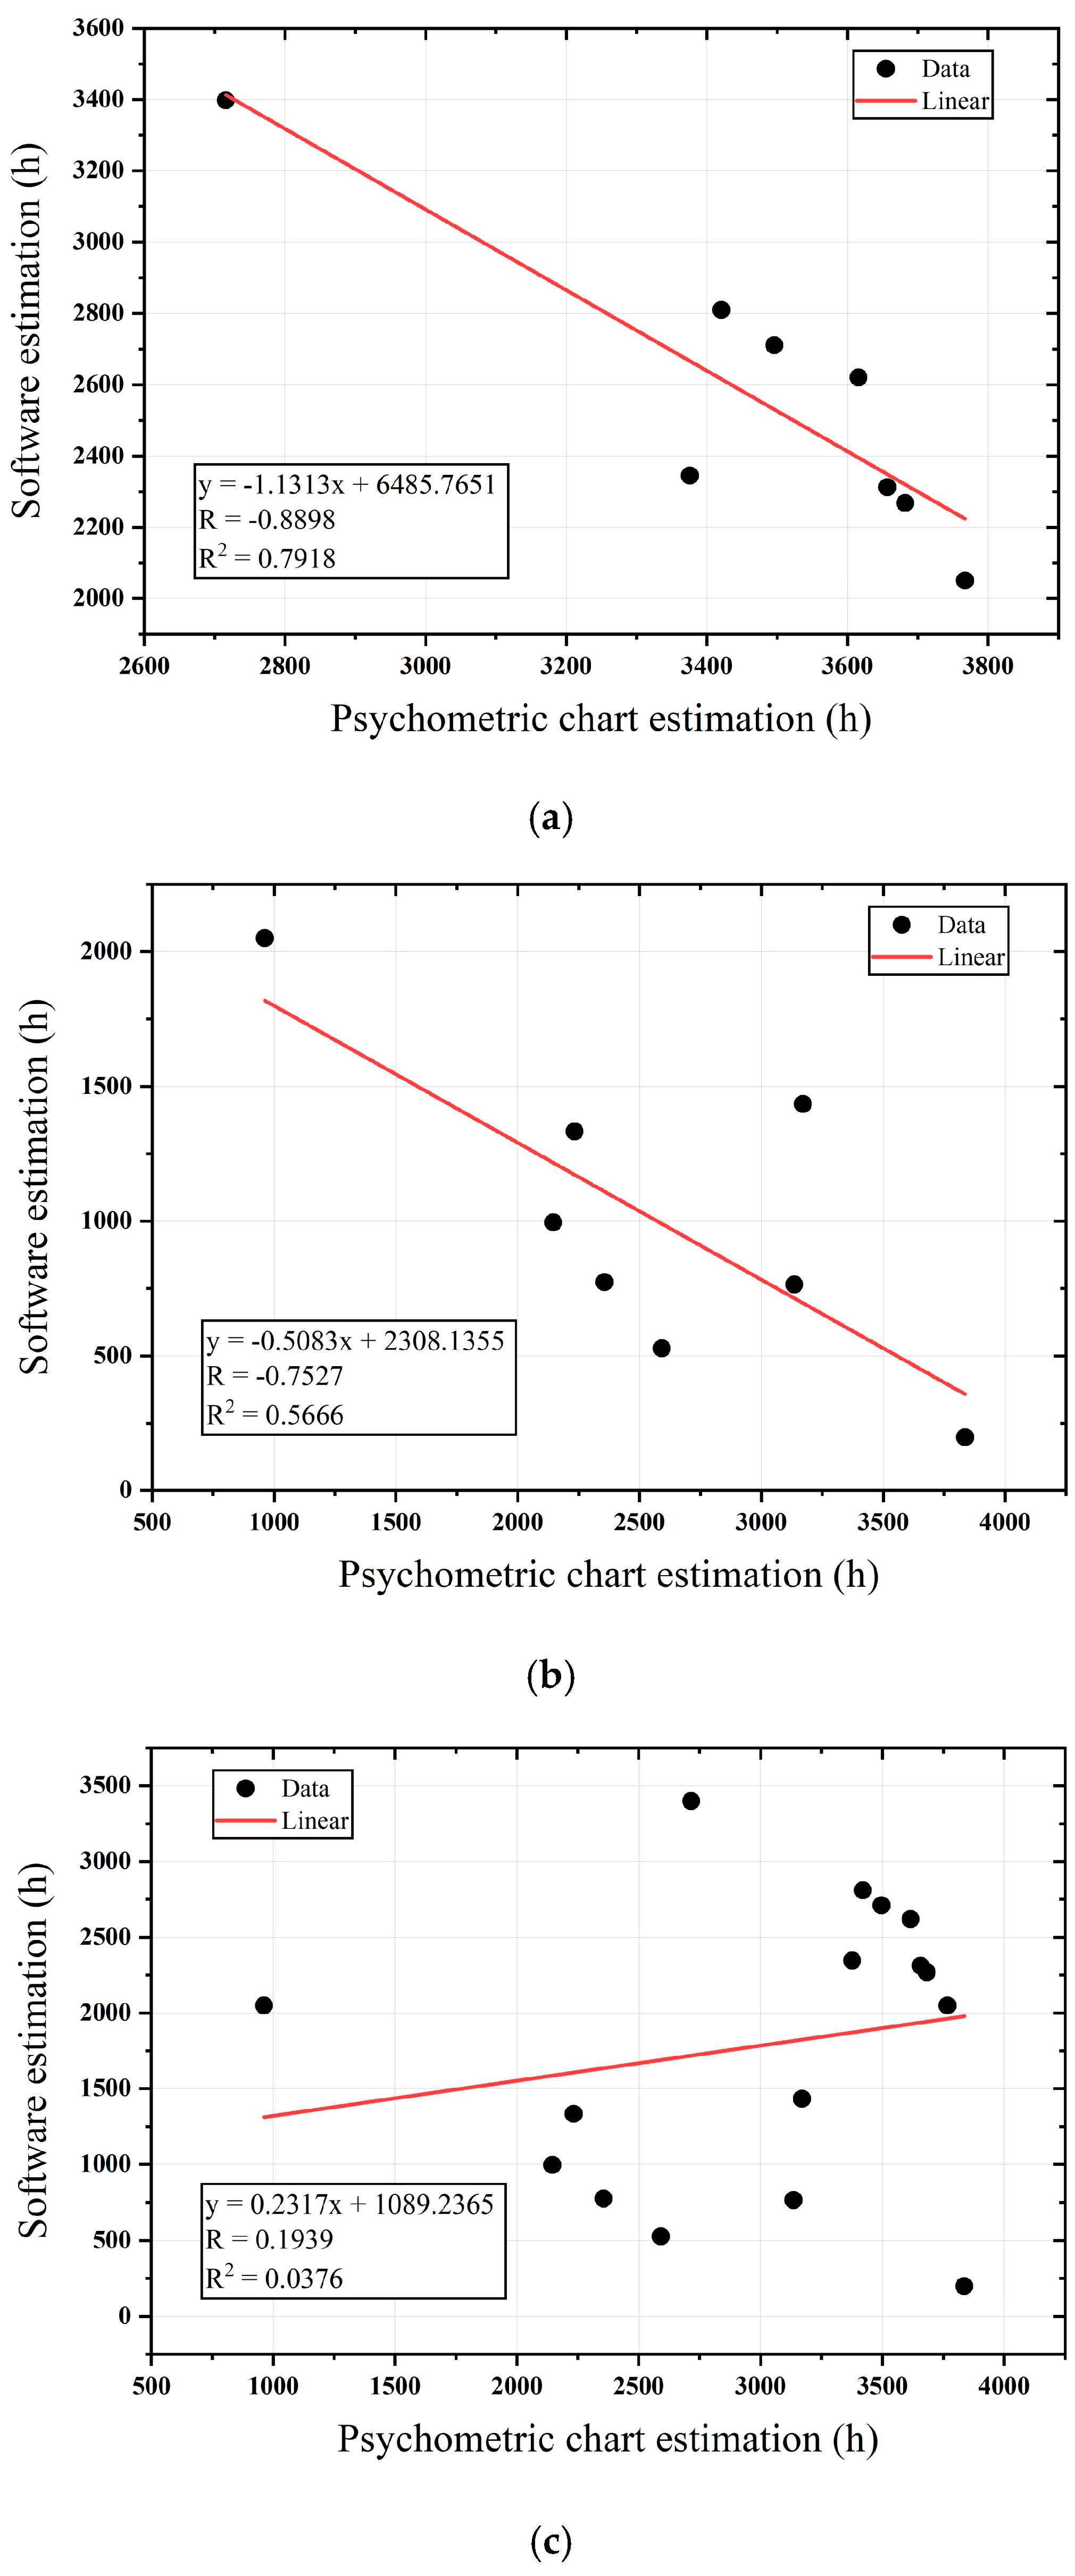
| Linear Regression Criteria | PMV-PPD | Adaptive | ||||
|---|---|---|---|---|---|---|
| Base | Optim. | Base and Optim. | Base | Optim. | Base and Optim. | |
| Pearson correlation coefficient (R) | 0.79 | −0.46 | 0.71 | −0.88 | −0.75 | 0.19 |
| Regression coefficient (R2) | 0.57 | 0.21 | 0.50 | 0.79 | 0.56 | 0.03 |
Disclaimer/Publisher’s Note: The statements, opinions and data contained in all publications are solely those of the individual author(s) and contributor(s) and not of MDPI and/or the editor(s). MDPI and/or the editor(s) disclaim responsibility for any injury to people or property resulting from any ideas, methods, instructions or products referred to in the content. |
© 2025 by the authors. Licensee MDPI, Basel, Switzerland. This article is an open access article distributed under the terms and conditions of the Creative Commons Attribution (CC BY) license (https://creativecommons.org/licenses/by/4.0/).
Share and Cite
Kaihoul, A.; El Youssef, M.; Pitzalis, E.; Sriti, L.; Dechouk, Y.; Amraoui, K.; Khelil, A.E. Optimising Thermal Comfort in Algerian Reference Hotel Across Eight Climate Zones: A Comparative Study of Simulation and Psychrometric Chart Results. Sustainability 2025, 17, 6249. https://doi.org/10.3390/su17146249
Kaihoul A, El Youssef M, Pitzalis E, Sriti L, Dechouk Y, Amraoui K, Khelil AE. Optimising Thermal Comfort in Algerian Reference Hotel Across Eight Climate Zones: A Comparative Study of Simulation and Psychrometric Chart Results. Sustainability. 2025; 17(14):6249. https://doi.org/10.3390/su17146249
Chicago/Turabian StyleKaihoul, Ahmed, Mohammad El Youssef, Efisio Pitzalis, Leila Sriti, Yasmine Dechouk, Khaoula Amraoui, and Alla Eddine Khelil. 2025. "Optimising Thermal Comfort in Algerian Reference Hotel Across Eight Climate Zones: A Comparative Study of Simulation and Psychrometric Chart Results" Sustainability 17, no. 14: 6249. https://doi.org/10.3390/su17146249
APA StyleKaihoul, A., El Youssef, M., Pitzalis, E., Sriti, L., Dechouk, Y., Amraoui, K., & Khelil, A. E. (2025). Optimising Thermal Comfort in Algerian Reference Hotel Across Eight Climate Zones: A Comparative Study of Simulation and Psychrometric Chart Results. Sustainability, 17(14), 6249. https://doi.org/10.3390/su17146249