Article

Deformation Analysis of 50 m-Deep Cylindrical Retaining Shaft in Composite Strata

1
China Railway Design Corporation South China Branch, Shenzhen 518052, China
2
School of Civil Engineering, Sun Yat-sen University, Zhuhai 519082, China
3
School of Aeronautics and Astronautics, Shenzhen Campus of Sun Yat-sen University, Shenzhen 518107, China
4
State Key Laboratory for Tunnel Engineering, Guangzhou 510275, China
5
Shenzhen Metro Group Co., Ltd., Shenzhen 518000, China
*
Author to whom correspondence should be addressed.
Sustainability 2025, 17(13), 6223; https://doi.org/10.3390/su17136223
Submission received: 12 May 2025 / Revised: 25 June 2025 / Accepted: 4 July 2025 / Published: 7 July 2025
(This article belongs to the Special Issue Sustainable Development and Analysis of Tunnels and Underground Works)

Abstract

Cylindrical retaining structures are widely adopted in intercity railway tunnel engineering due to their exceptional load-bearing performance, no need for internal support, and efficient utilization of concrete compressive strength. Measured deformation data not only comprehensively reflect the influence of construction and hydrogeological conditions but also directly and clearly indicate the safety and stability status of structure. Therefore, based on two geometrically similar cylindrical shield tunnel shafts in Shenzhen, the surface deformation, structure deformation, and changes in groundwater outside the shafts during excavation were analyzed, and the deformation characteristics under the soil–rock composite stratum were summarized. Results indicate that the uneven distribution of surface surcharge and groundwater level are key factors causing differential deformations. The maximum horizontal deformation of the shafts wall is less than 0.05% of the current excavation depth (H), occurring primarily in two zones: from H − 20 m to H + 20 m and in the shallow 0–10 m range. Vertical deformations at the wall top are mostly within ±0.2% H. Localized groundwater leakage in joints may lead to groundwater redistribution and seepage-induced fine particle migration, exacerbating uneven deformations. Timely grouting when leakage occurs and selecting joints with superior waterproof sealing performance are essential measures to ensure effective sealing. Compared with general polygonal foundation pits, cylindrical retaining structures can achieve low environmental disturbances while possessing high structural stability.

1. Introduction

In current foundation pit engineering, there exhibits a trend characterized by increasing excavation depth, expanding excavation area and dissimilated cross-sectional configurations of retaining structures [1,2,3]. Among these, cylindrical foundation pits, owing to their remarkable spatial arching effect, short construction process, elimination of internal support requirements and ability to fully utilize the compressive performance of concrete, demonstrate more advantages compared to general polygonal foundation pits [4,5,6,7]. Consequently, they are gradually applied in deep foundation pit projects such as municipal and hydraulic engineering, shield working shafts and subway stations.
In recent years, numerous scholars have investigated the mechanical and deformation characteristics of circular foundation pits, conducting extensive and valuable research. Kim and Cho et al. [4,8] utilized the horizontal layering method to derive a calculation approach for the ultimate active earth pressure of circular foundation pits considering the arch effect. Their findings indicated that the earth pressure acting on circular foundation pits was approximately 80% less than that predicted by Rankine earth pressure theory, with the arch effect being more pronounced in deep soil layers. Zhang, J. et al. [5] developed a solution methodology for analyzing the earth pressure distribution of underwater rock-socketed circular diaphragm walls under various displacement modes. The results demonstrated that the earth pressure exhibited nonlinear behavior and was substantially influenced by soil parameters and water levels. Berezantzev [9], Prater [10], and Cheng [11] conducted theoretical investigations on the earth pressure of circular shafts, employing the limit equilibrium method and slip line method. Their studies revealed that circular foundation pits can effectively harness the soil arching effect. Moreover, the soil surrounding circular foundation pits is subjected to a three-dimensional stress state, and the circumferential arching effect induced by circumferential stress can significantly reduce the earth pressure acting on the retaining structures [12,13]. Tanawat T. et al. [14] demonstrated that the two-dimensional (2D) modeling approach is insufficient to capture the circumferential stress distribution in circular structures, which results in notable discrepancies in predicting the actual displacement of circular foundation pits. In contrast, three-dimensional (3D) simulation methods enable a more accurate characterization of the spatial effects inherent in circular shaft structures. Tran et al. [15] performed experimental studies and discrete element numerical simulations to examine the earth pressure distribution of circular shafts in soft soil. They concluded that the earth pressure decreased markedly with increasing shaft wall displacement and increased as the shaft radius expanded. Wang, X. et al. [16] utilized a three-dimensional finite element model to investigate the influence mechanism of rainstorms on subway deep foundation pits and identified that the shedding of steel supports and water accumulation in the foundation pit were the primary causes of supporting structure deformation and surface settlement. Chehadeh, A. et al. [7,17] developed a three-dimensional finite element model to examine the effects of circular hole excavation, inclined bedrock, and overload distribution on the stress distribution of circular shafts. Their findings revealed that single-hole or multi-hole excavation could lead to stress concentration in the shafts; when the bedrock inclination exceeded a critical threshold, the shaft deviated from ideal pressure ring behavior, and the increase in the overload range would significantly elevate the circumferential pressure.
However, both numerical simulations and theoretical analyses inherently simplify real-world conditions, making it challenging to fully capture the impacts of various complex factors, such as on-site construction practices and geological heterogeneities. Additionally, due to the complex spatial mechanical characteristics of the cylindrical retaining shaft, current research still lags behind engineering practice. Analytical studies based on field measurement data from actual projects is crucial for providing a practical basis for the design and construction of cylindrical foundation pits. Previous studies [18,19] have systematically documented the spatial arching effect in circular foundation pits during construction, which induces significant discrepancies in displacement and mechanical behavior compared to traditional diaphragm walls. Notably, this spatial arching phenomenon has been experimentally validated in foundation pits with diameters up to 100 m [20], demonstrating its applicability in large-scale engineering projects. From the perspective of structural selection, Tan et al. [21] analyzed statistical data from over 100 foundation pits in Shanghai, demonstrating that unbraced cylindrical foundation pits exhibit superior deformation resistance compared to braced rectangular and long-narrow pits. Similarly, Njemile E. F et al. [22] examined surface settlement data from 27 cylindrical shaft in London and found that foundation pits with post-excavation support induced significantly greater surface settlements than those employing pre-excavation support. Qiao et al. [23] explored the deformation mechanism of ultra-deep cylindrical shafts through field data from 30 such shafts. They identified two distinct stages in the wall deflection: circumferential compression and flexural deformation, and base heave was the primary driving factor responsible for the uplift of shaft and ground. Gao et al. [24] combined field measurements with numerical simulations to investigate the response of diaphragm walls and ground surfaces during excavation of a cylindrical foundation pit. Ren, B. et al. [25,26] utilized BOFDA distributed optical fiber monitoring technology to perform high-frequency monitoring of the diaphragm wall in an 58.65 m-deep circular foundation pit over 14 months. The findings demonstrated that optical fiber monitoring had better real-time performance and continuity than traditional methods. Additionally, groundwater exerts a profound influence on the stability of retaining structures for circular vertical shafts. During the excavation, dewatering measures implemented within the pit can significantly amplify the hydraulic head difference across the retaining wall due to its barrier effect [27]. In confined aquifer conditions, water inrush may mobilize sand and gravel particles in the soil matrix, inducing shear failure at the interface between the retaining wall and surrounding strata [28]. Moreover, the presence of a confined aquifer increases the potential for substantial basal heave and vertical displacements [29].
While significant progress has been achieved by researchers, studies on ultra-deep and large-diameter cylindrical foundation pits—specifically those with diameters over 30 m or excavation depths exceeding 50 m—remain limited. In the field of in situ measurement studies on circular shafts, the current literature has predominantly focused on scenarios with minor water-level fluctuations. However, the response mechanisms of circular shafts under drastic water-level fluctuations remain underexplored, warranting discussions and investigations. This paper presents an in situ measurement analysis of two unsupported cylindrical retaining shafts with identical geometric and structural configurations, both experiencing groundwater drawdown exceeding 10 m during construction. The analysis focuses on three key aspects during earth excavation: surface settlement, deformation of the retaining structures, and fluctuations in groundwater levels outside the excavation zone. The deformation behavior of deep cylindrical foundation pits in soil–rock composite strata is systematically summarized. The findings aim to offer practical insights for the design and construction of similar underground engineering projects.

2. Project Overview

2.1. Project Introduction

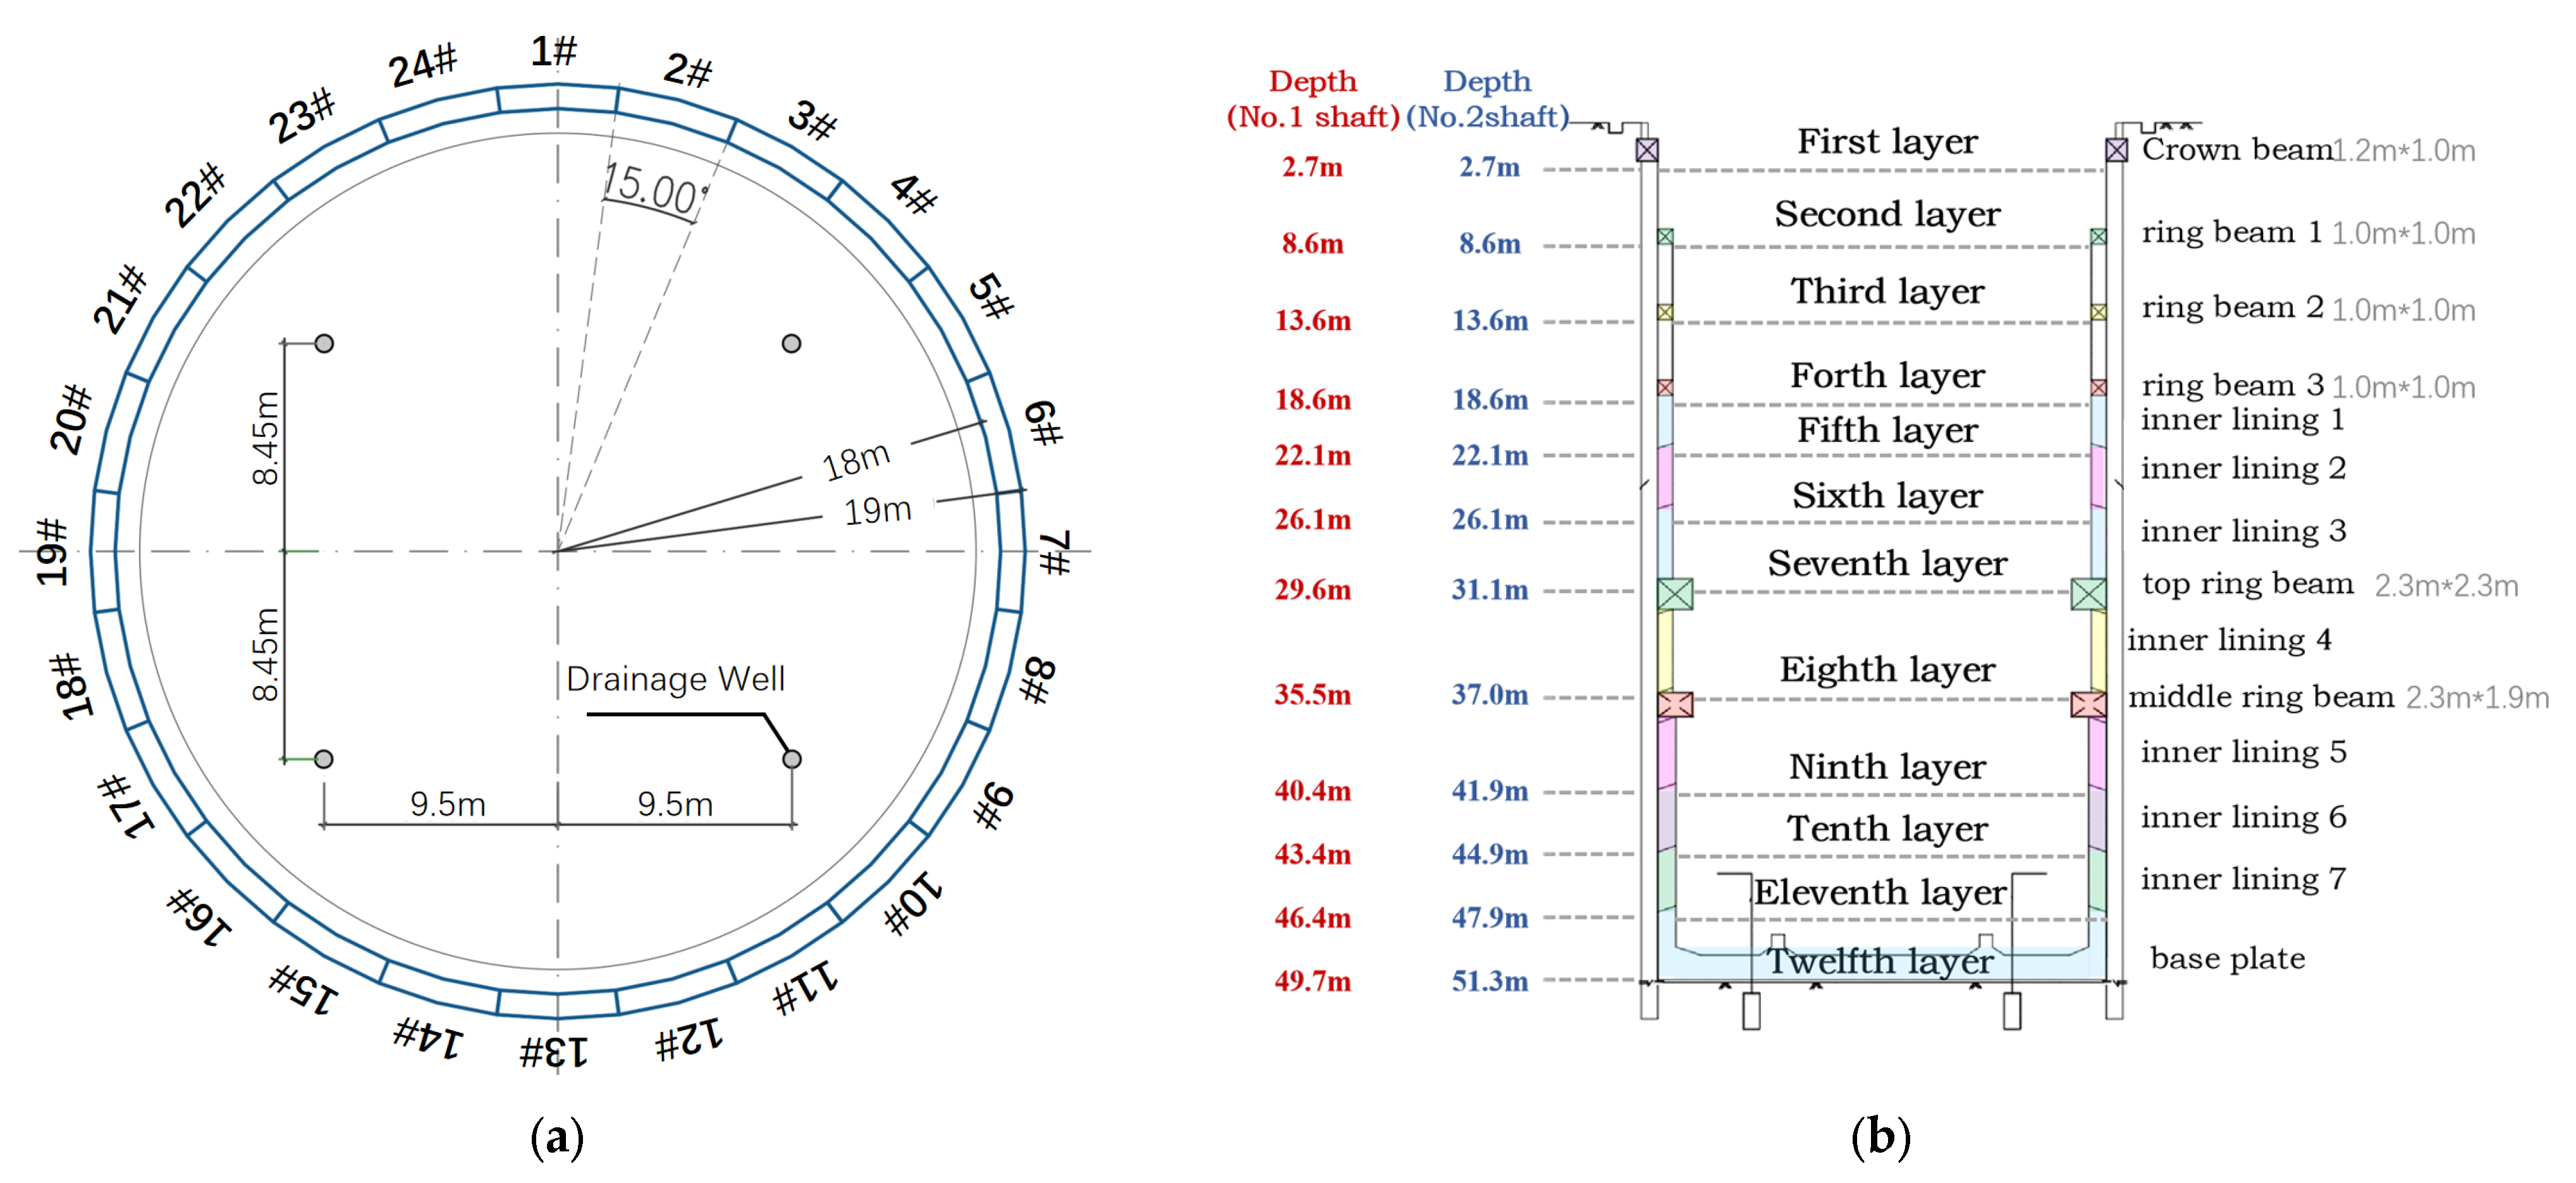
The Shenzhen Airport–Daya Bay Intercity Railway, spanning 69.19 km and featuring 11 underground stations, connects T4 Hub Station to Julong Station in its first phase. This study focuses on the Daping Shaft No. 1 and Daping Shaft No. 2 of this project, characterized by the following specifications: an inner diameter of 36 m and an excavation depth of 51.30 m. A retaining system comprising circular diaphragm walls, inner ring beams, and inner lining walls is employed in these projects. The wall thicknesses for Shaft No. 1 and Shaft No. 2 are 1200 mm and 800 mm, respectively, and divided into 24 trench segments connected by I-beam connectors. Portions of the diaphragm walls are embedded in moderately to slightly weathered rock, with embedment depths ranging from 4.5 to 7.0 m and total wall lengths between 54.2 m and 56.7 m. A top-down method combined with an in-pit dewatering scheme is adopted.
Geological investigations reveal that the soil strata within Shaft No. 1 and Shaft No. 2 primarily consist of plain fill, cohesive soil, crushed stone fill, completely weathered siltstone, earthy highly weathered siltstone, blocky highly weathered siltstone, moderately weathered siltstone, and slightly weathered siltstone. The segmentation of the diaphragm walls and the vertical section of the retaining structure are depicted in Figure 1.

2.2. Excavation Sequences of the Foundation Pit

The excavation depths of each soil stratum and the spatial distribution of retaining structures are graphically illustrated in Figure 2.
Detailed construction procedures and key steps are presented in Table 1, where “a” and “b” in the serial number column represent earth excavation and retaining structure installation, respectively. The foundation pit construction sequence is outlined as follows:
  • Construct diaphragm walls first, followed by in-pit dewatering to 0.5 m below the upcoming excavation surface.
  • Sequentially excavate the first to fourth soil layers, stopping each time 0.5 m below the elevation of the crown beam or ring beam, and then constructing the corresponding retaining structures.
  • After the inner ring beam reaches the specified design strength, excavate the fifth to seventh layers in segmented sections, stopping each time 0.5 m below the inner lining wall elevation, and construct the inner lining walls using the top-down method.
  • Once the inner lining walls above the main structure roof are completed, excavate the eighth soil layer and install the roof ring beam and inner lining in a top-down method.
  • Segmentally excavate the ninth to twelfth soil layers down to the bottom. Subsequently, construct the middle-plate ring beam, side-wall structures, and then install the bottom plate and waterproofing layer.

3. Monitoring Point Deployment Scheme

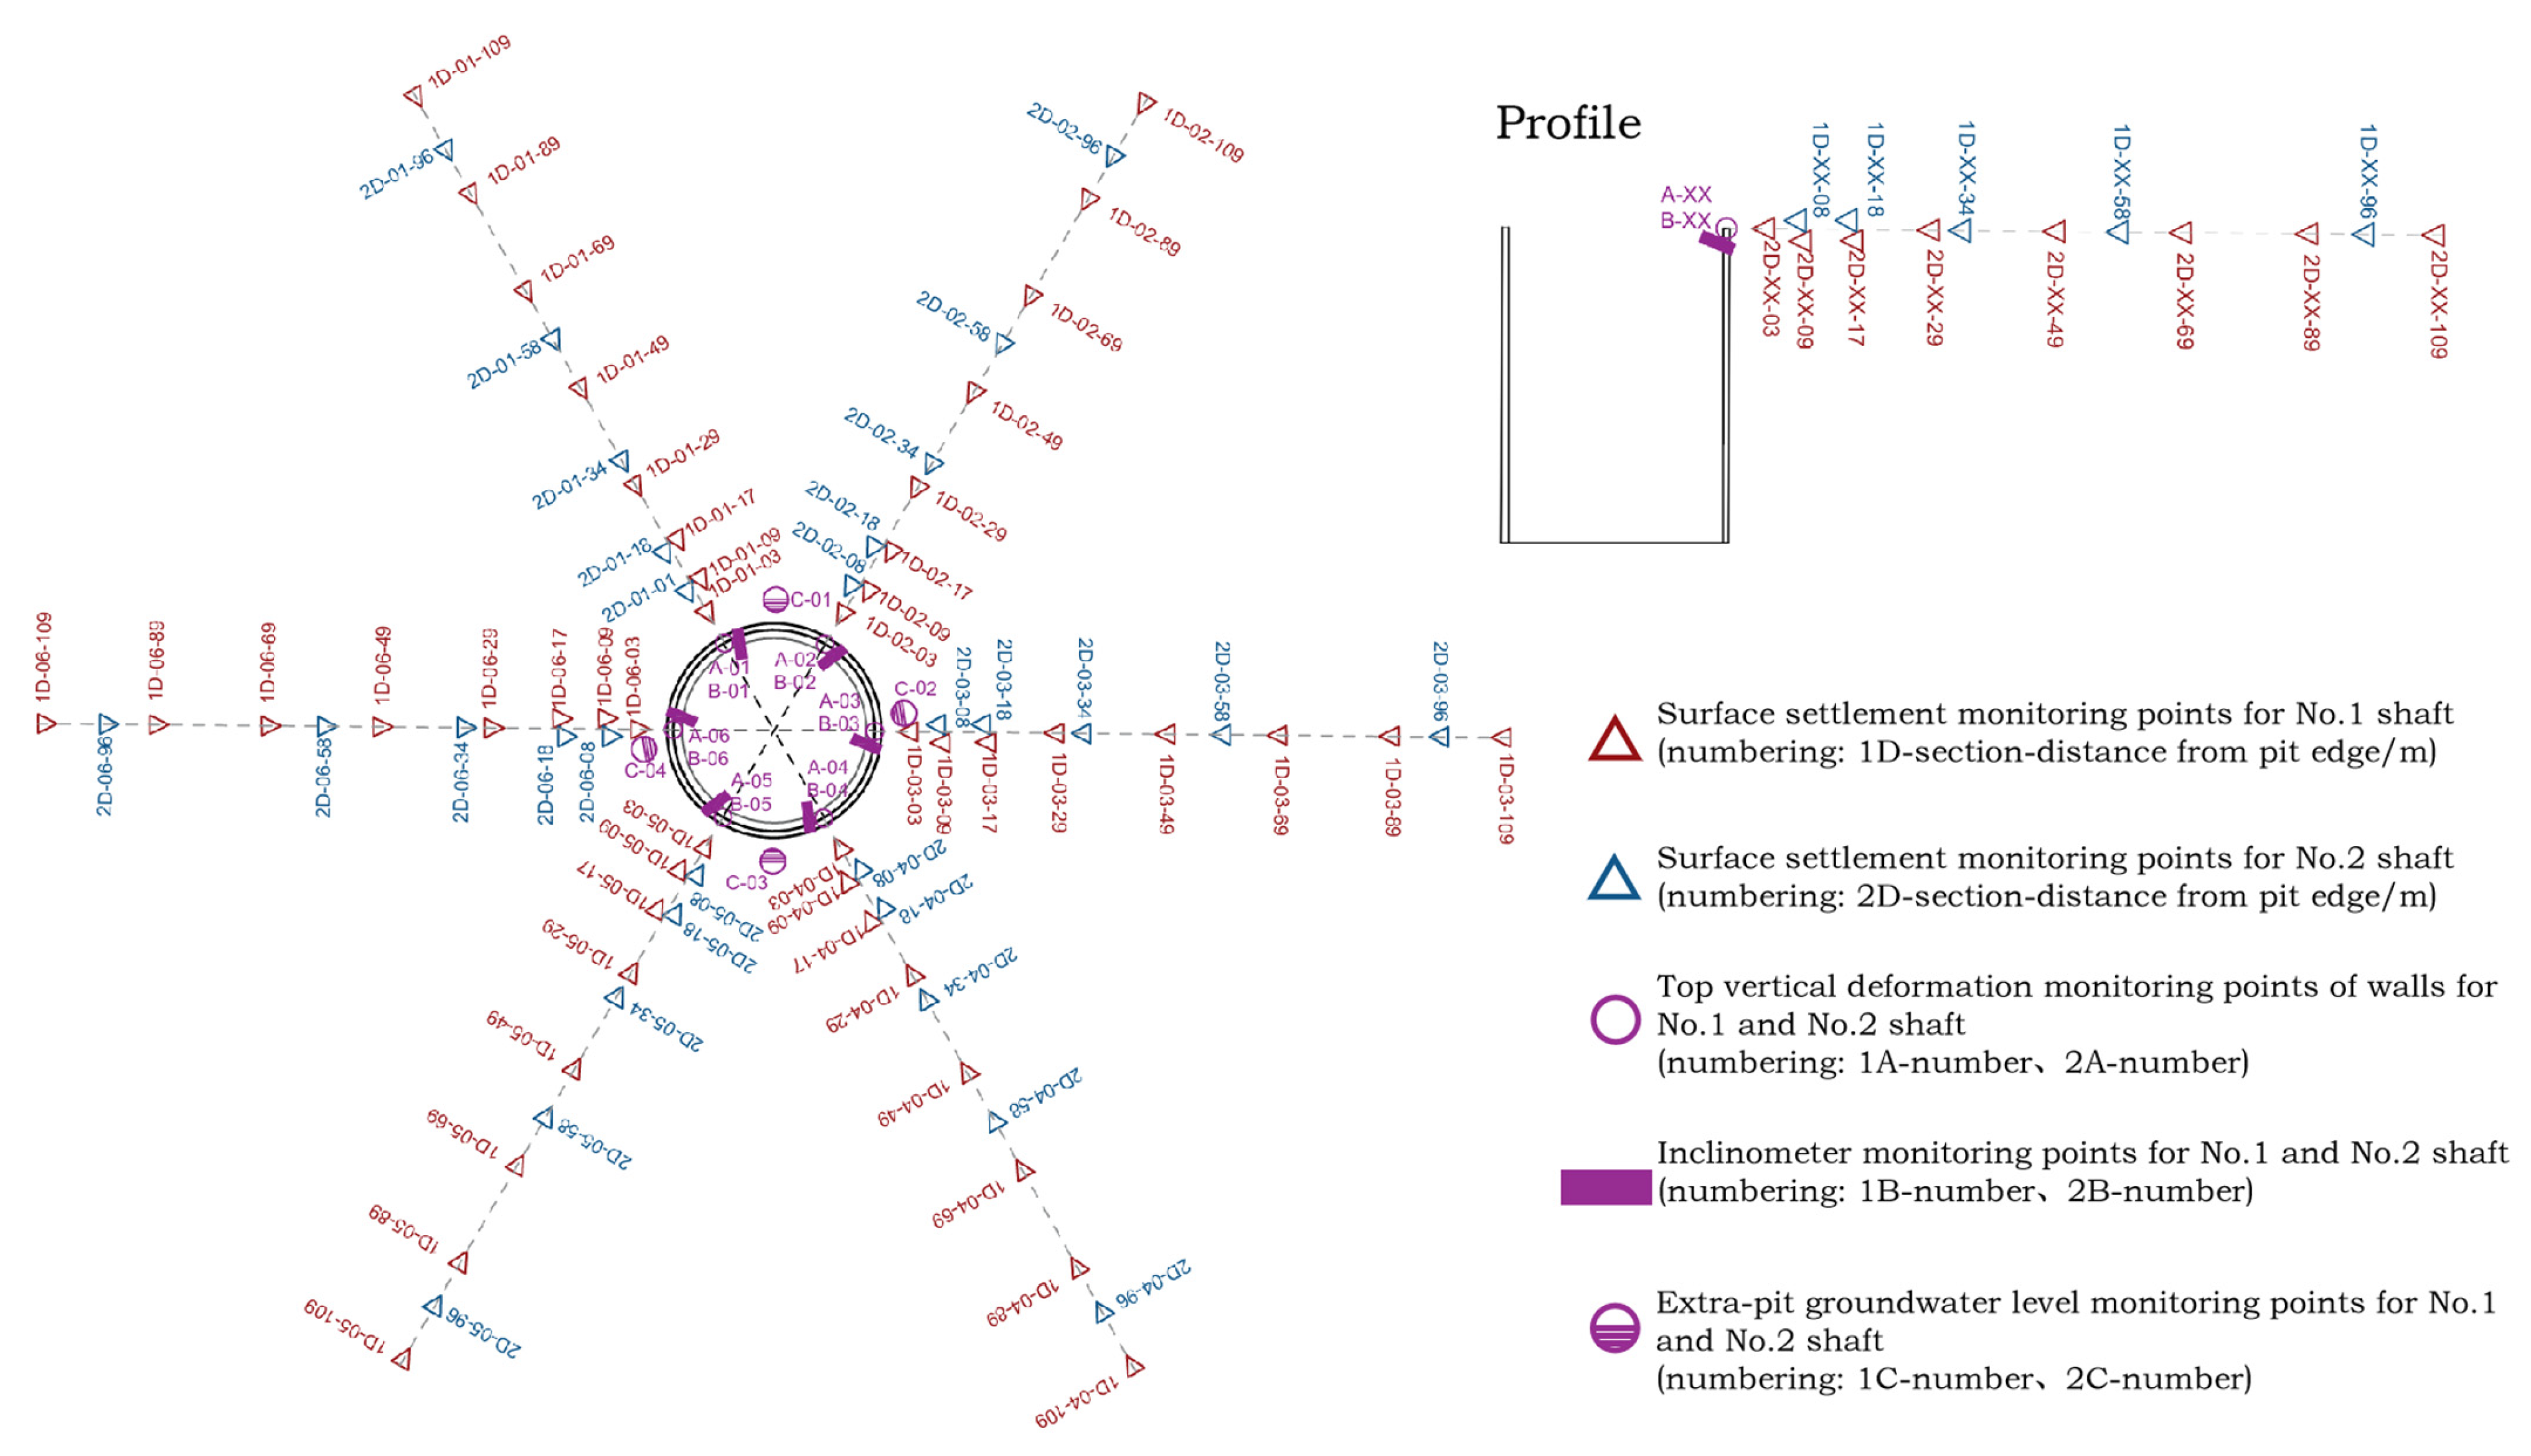
The monitoring parameters during the foundation pit excavation comprise four key items: inclinometry, groundwater levels, surface settlement and vertical deformation of the retaining structures. Specific details are systematically presented in Table 2 and illustrated in Figure 3. Considering that the strata exposed within the excavation range of Shaft No. 1 are relatively weaker compared to those of Shaft No. 2, and given that its construction is expected to cause more disturbance to the surrounding strata, the surface settlement measuring points for Shaft No. 1 are arranged with higher density.

4. Analysis of Monitoring Data

4.1. Horizontal Displacement of the Retaining Wall

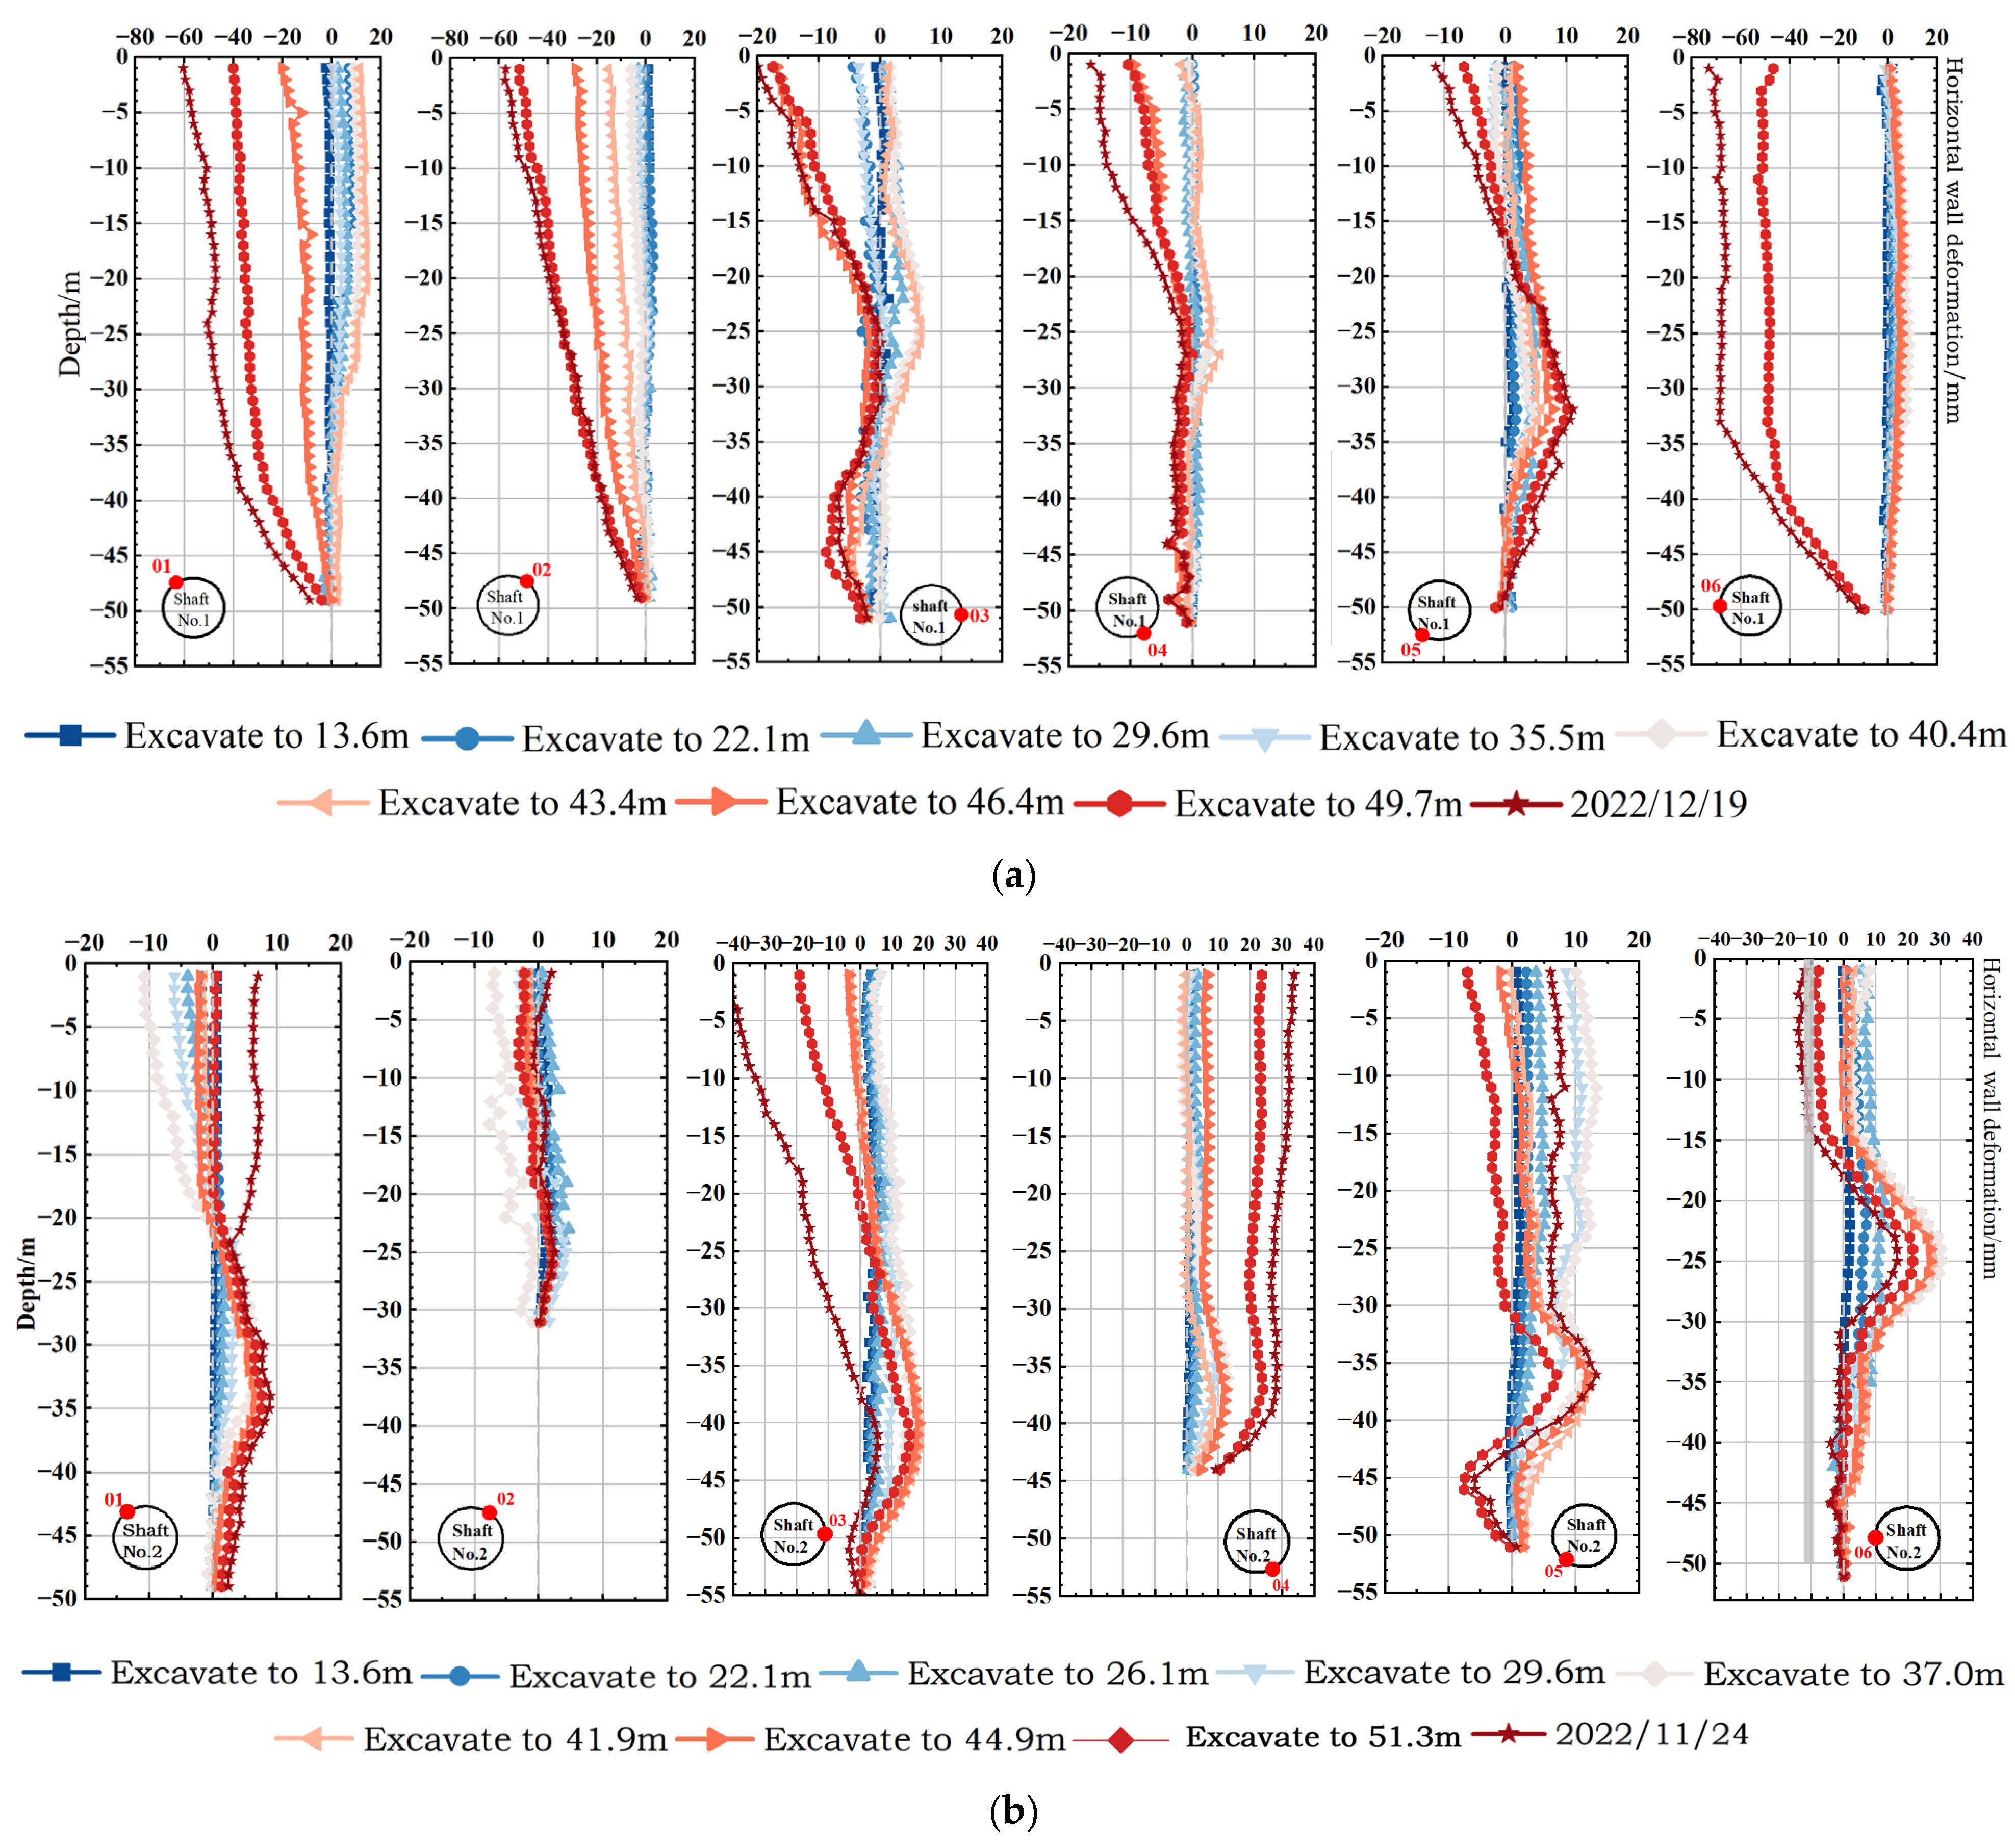
Figure 4 illustrates the horizontal deformation of the retaining walls at each inclinometer point, where positive values denote inward displacements toward the pit interior and negative values represent outward displacements away from the pit. The analysis reveals the following characteristics:
  • Depth-dependent deformation behavior: The horizontal deformation of retaining walls is strongly correlated with the excavation depth. During the 0–40 m excavation, wall displacements primarily occur inward, increasing progressively as excavation proceeds. Owing to the spatial arching effect of the cylindrical retaining structures, the deformation rate remains relatively moderate, within ±15 mm of horizontal movements. The deformation curves typically exhibit a ‘middle-larger, both-ends-smaller’ or ‘top-larger, bottom-smaller’ profile. This occurs because the foundation pit is subjected to inward-directed soil and water pressures. Additionally, the displacement at the bottom is relatively restrained due to the rock socketing effect of the base slab. Notably, certain measurement points in Shaft 2 displayed outward deformation toward the pit exterior.
  • Uneven soil–water pressures, construction loads on the wall and localized surface surcharge contribute to diverse deformation profiles. For instance, points 2B-01, 2B-03, 2B-05, and 2B-06 exhibit inward heave at the mid or lower-mid wall sections, with minimal displacements at the top and bottom. In addition, point 2B-04 shows rotational tilting deformation of the retaining wall, with the wall pivoting toward the pit around its base. Figure 5 and Figure 6 illustrate notable discrepancies in horizontal displacement of the retaining wall at varying depths. In Shaft 1, the northwestern wall segments exhibit pronounced deformations, contrasting with smaller displacements in the southeastern regions. The deformation profiles are irregular annular patterns, with a maximum circumferential displacement difference of 45.75 mm. For Shaft 2, the 0–10 m cross-section displays a concave deformation curve, while the 20–40 m cross-section shows inward displacements, forming irregular annular shapes with a peak circumferential difference of 45.63 mm.
  • Excavation significantly affects the deformation of wall within ±10 m of the excavation surface, where over 5 mm deformations are affected by excavation and recorded at numerous measurement points. Conversely, the portion exceeding 10 m below the excavation surface experiences negligible changes, with displacements consistently under 5 mm.
  • After excavation, internal loads from construction of subsequent bottom plate and retaining structure further influence horizontal displacements, primarily by intensifying pre-existing deformation trends. Owing to the weaker mechanical properties of upper soil layers, these loads exert a more pronounced effect on the wall’s upper segment than its mid and lower sections. Consequently, continuous deformation monitoring is essential after soil excavation.
  • Elevated horizontal displacements at wall-top points (1B-01–1B-06, 2B-03–2B-04) can be attributed to multiple factors. First, localized surface surcharge—such as that of a construction site located 6 m southeast of Shaft No. 2, where concentrated buildings and equipment induced additional stress at point 2B-04, caused significant inward extrusion, and then led to adjacent outward heave. Second, the soil–rock composite strata plays a key role: shallow soil layers, with lower strength and reduced lateral restraint, are highly sensitive to excavation disturbances, resulting in amplified upper-wall deformations. In contrast, the lower wall, embedded in strongly/moderately weathered rock and benefits from rigid constraints, limiting displacements. Finally, groundwater fluctuations in shallow strata further contribute to these deformation patterns.
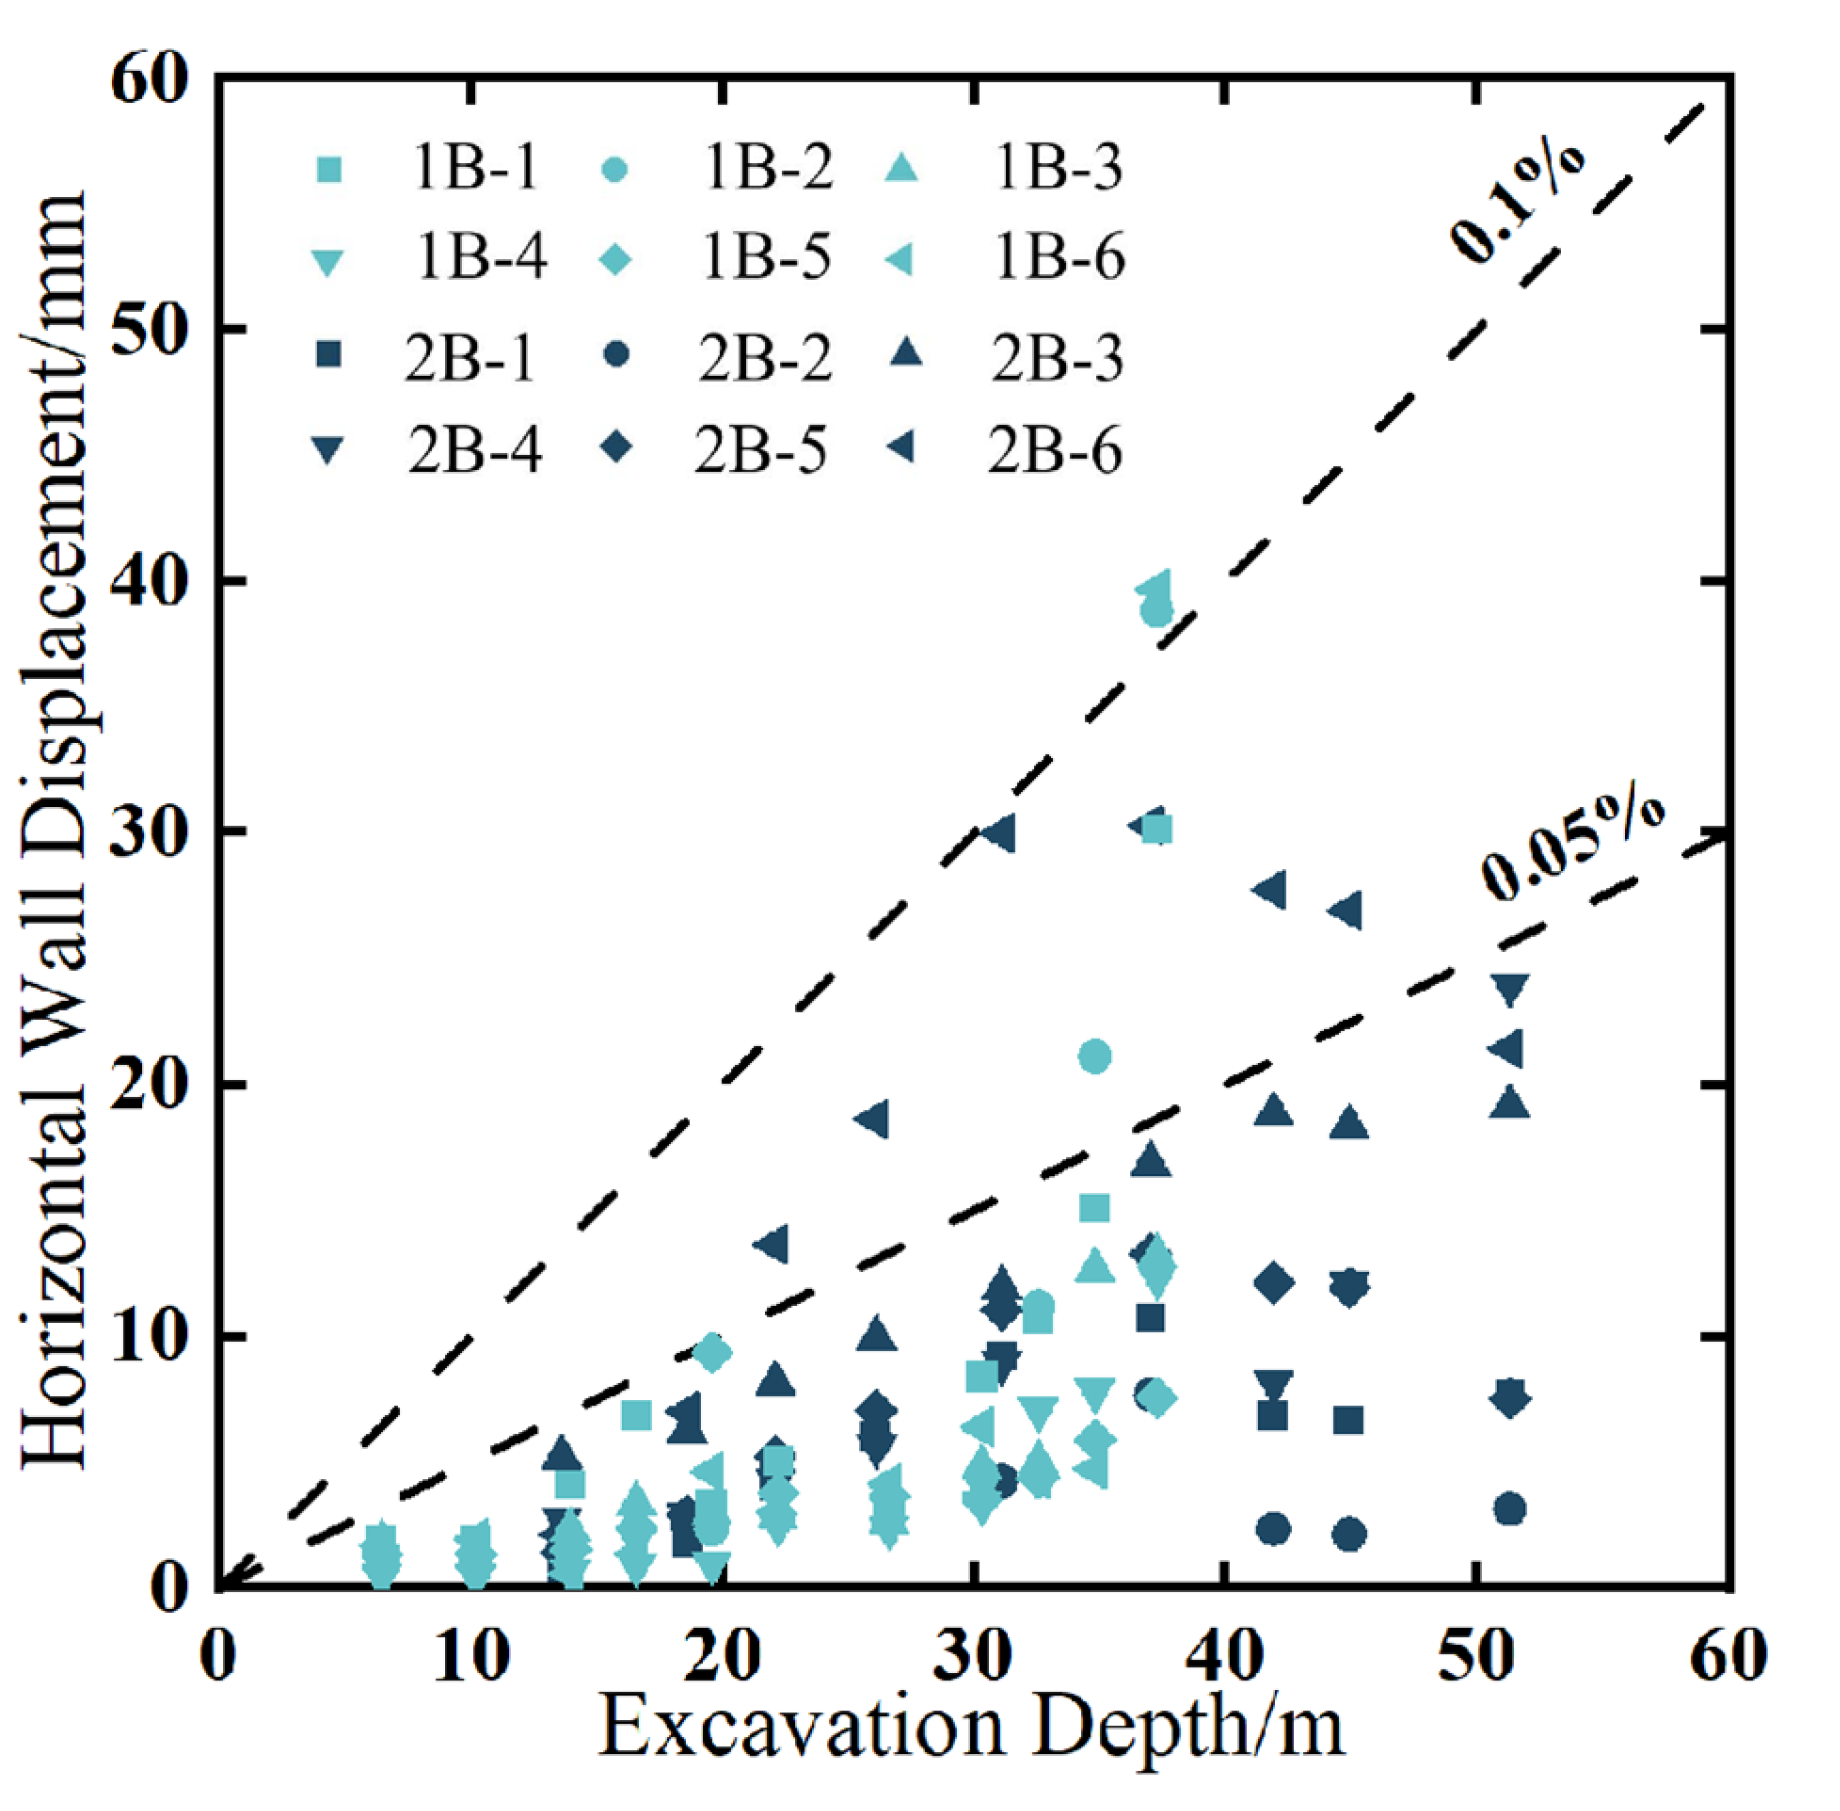
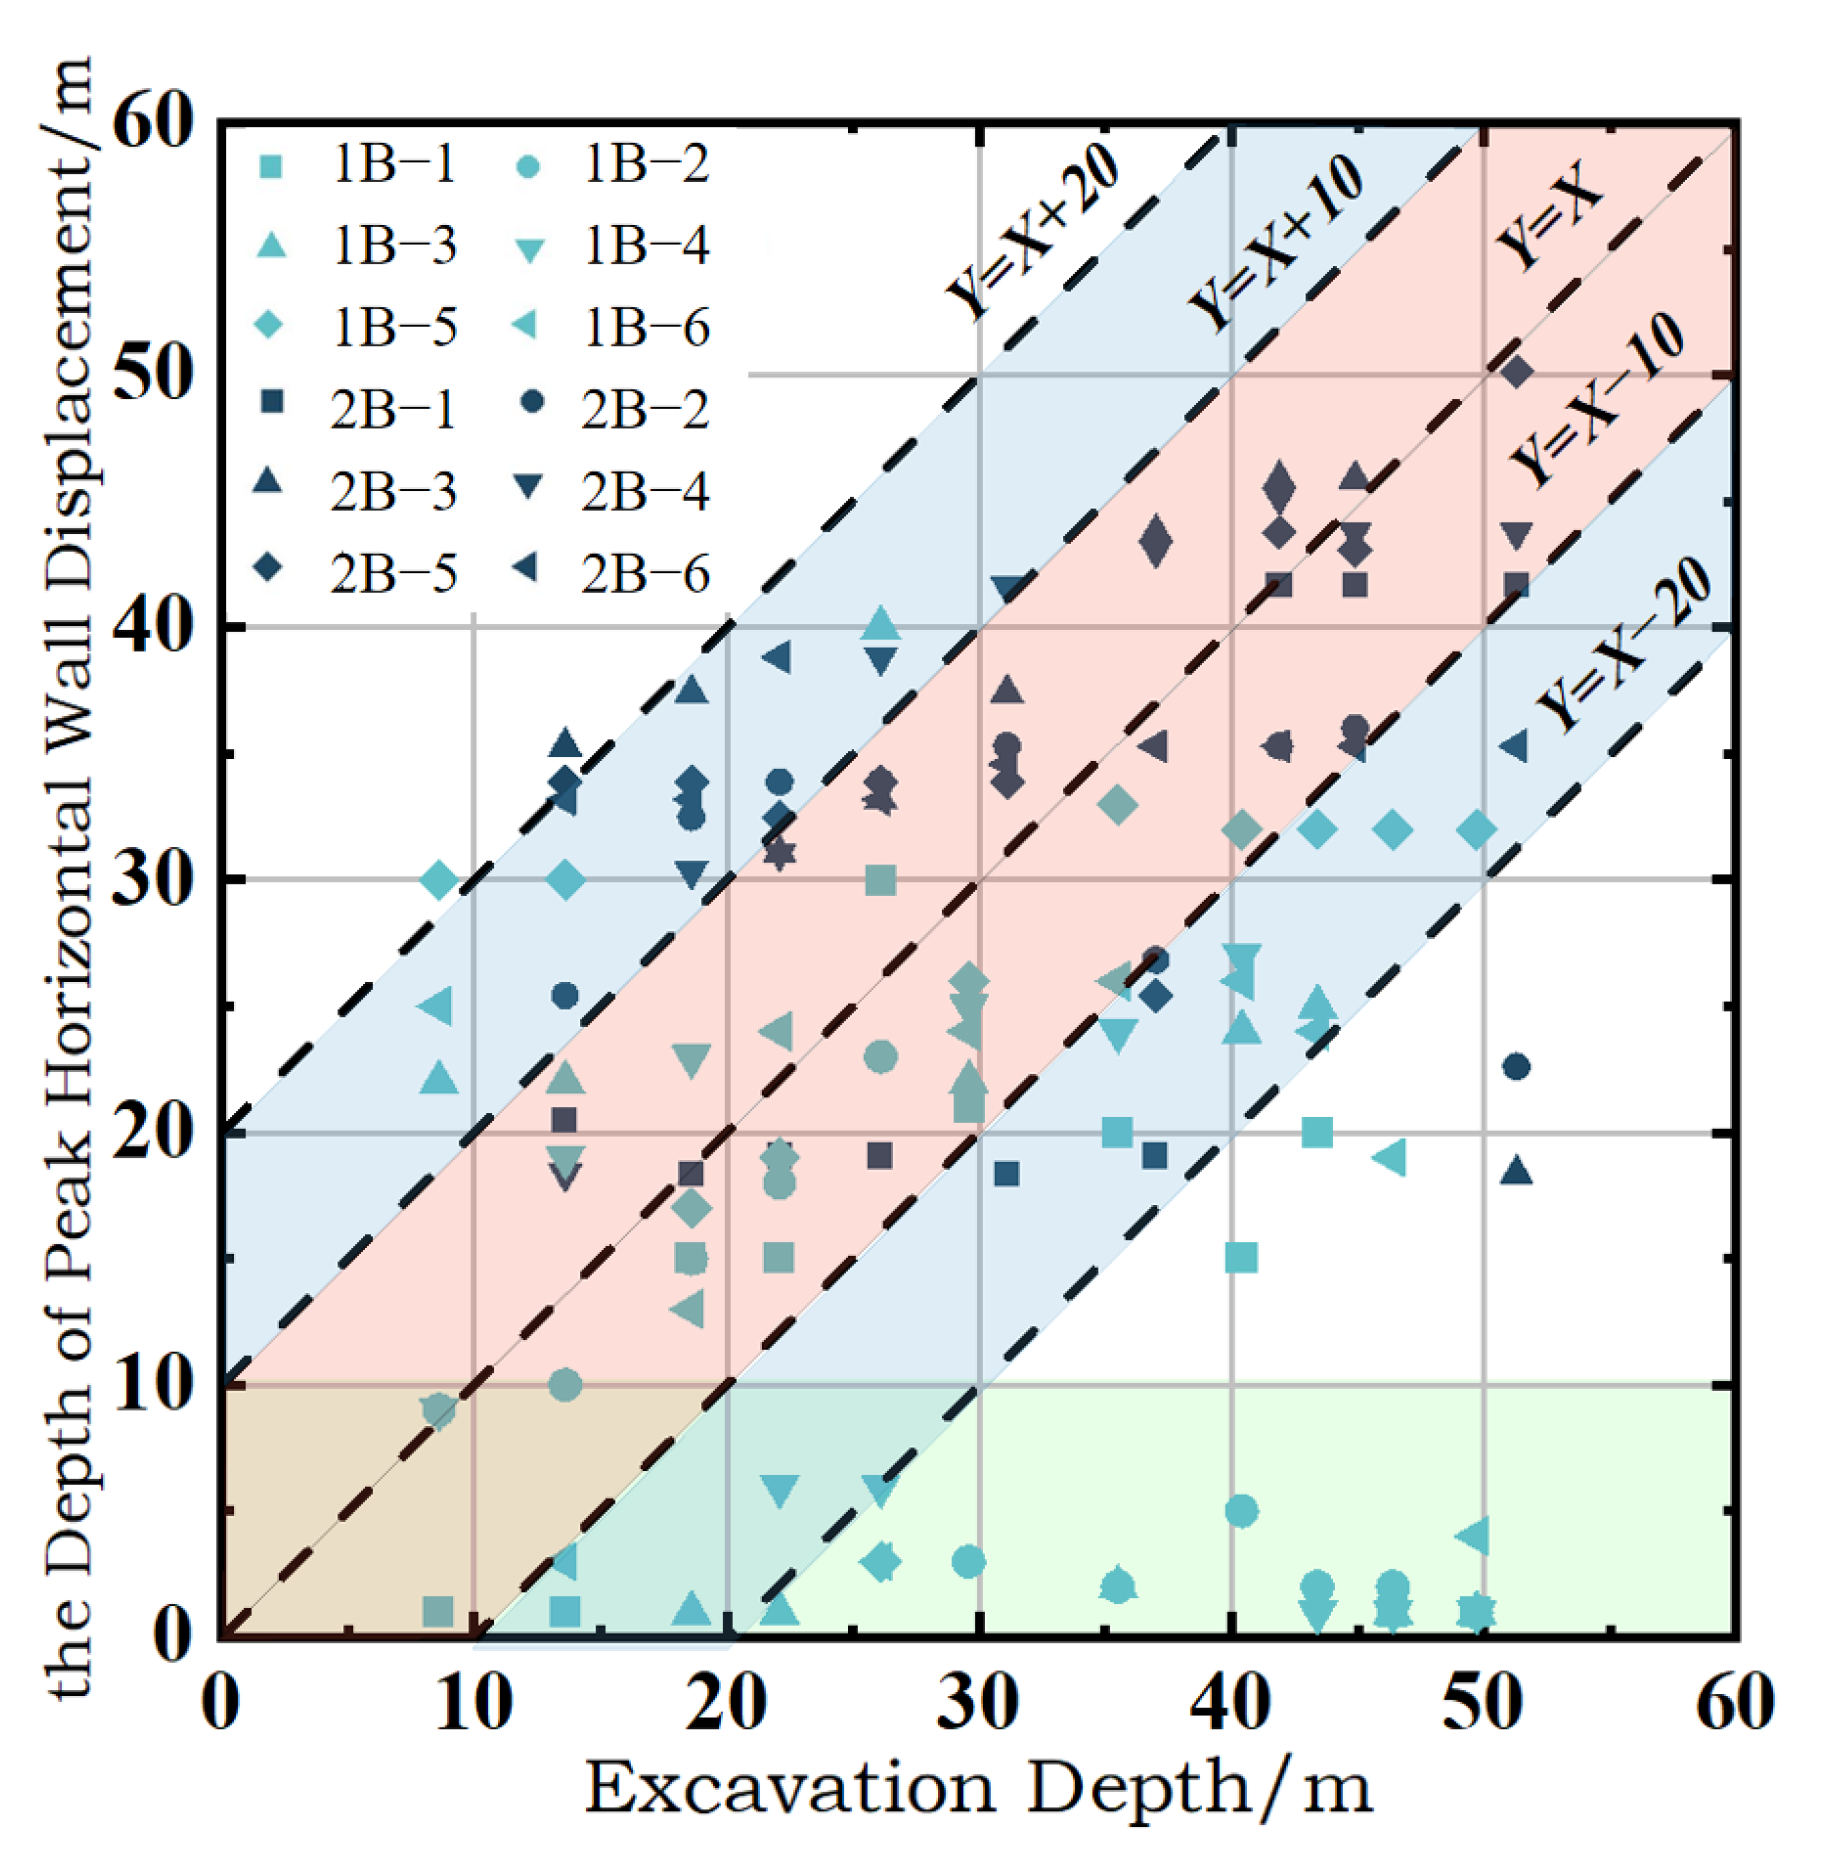
Taking excavation depth as the X-axis, the horizontal displacement at each inclinometer point (Figure 7)—or the depth corresponding to the wall’s peak horizontal displacement (Figure 8)—as the Y-axis, Figure 7 and Figure 8 are constructed, with red and blue markers denoting data from Shaft No. 1 and Shaft No. 2, respectively. Horizontal wall deformations generally remain below 0.05% H (where H represents the current excavation depth). However, when excavating below 40 m, partial measurement points exhibit deformations exceeding 0.1% H due to declines of groundwater levels. Comparative analysis with monitoring data from polygonal and elongated foundation pits in Shanghai, Fuzhou, and Suzhou [21,29] reveals that the horizontal deformations of Shaft No. 1 and Shaft No. 2 are notably smaller, proving the superior structural stability of cylindrical foundation pits. Additionally, the lower pit portion embedded in strongly/moderately weathered rock provides robust lateral constraints, resulting in reduced deformations compared to cylindrical pits in soft soil regions. Figure 8 indicates that most maximum displacements occur within the H − 20 m to H + 20 m depth range (Shaft No. 1 is primarily situated between H − 20 and H + 10, whereas Shaft No. 2 is predominantly located between H + 20 and H − 10). Soil–rock composite strata affect the horizontal displacement distribution, and the largest displacements occur in weaker shallow soils (0–10 m). Therefore, enhancing structural stiffness and monitoring frequency in this zone are critical during construction.

4.2. Groundwater Levels Around the Pit

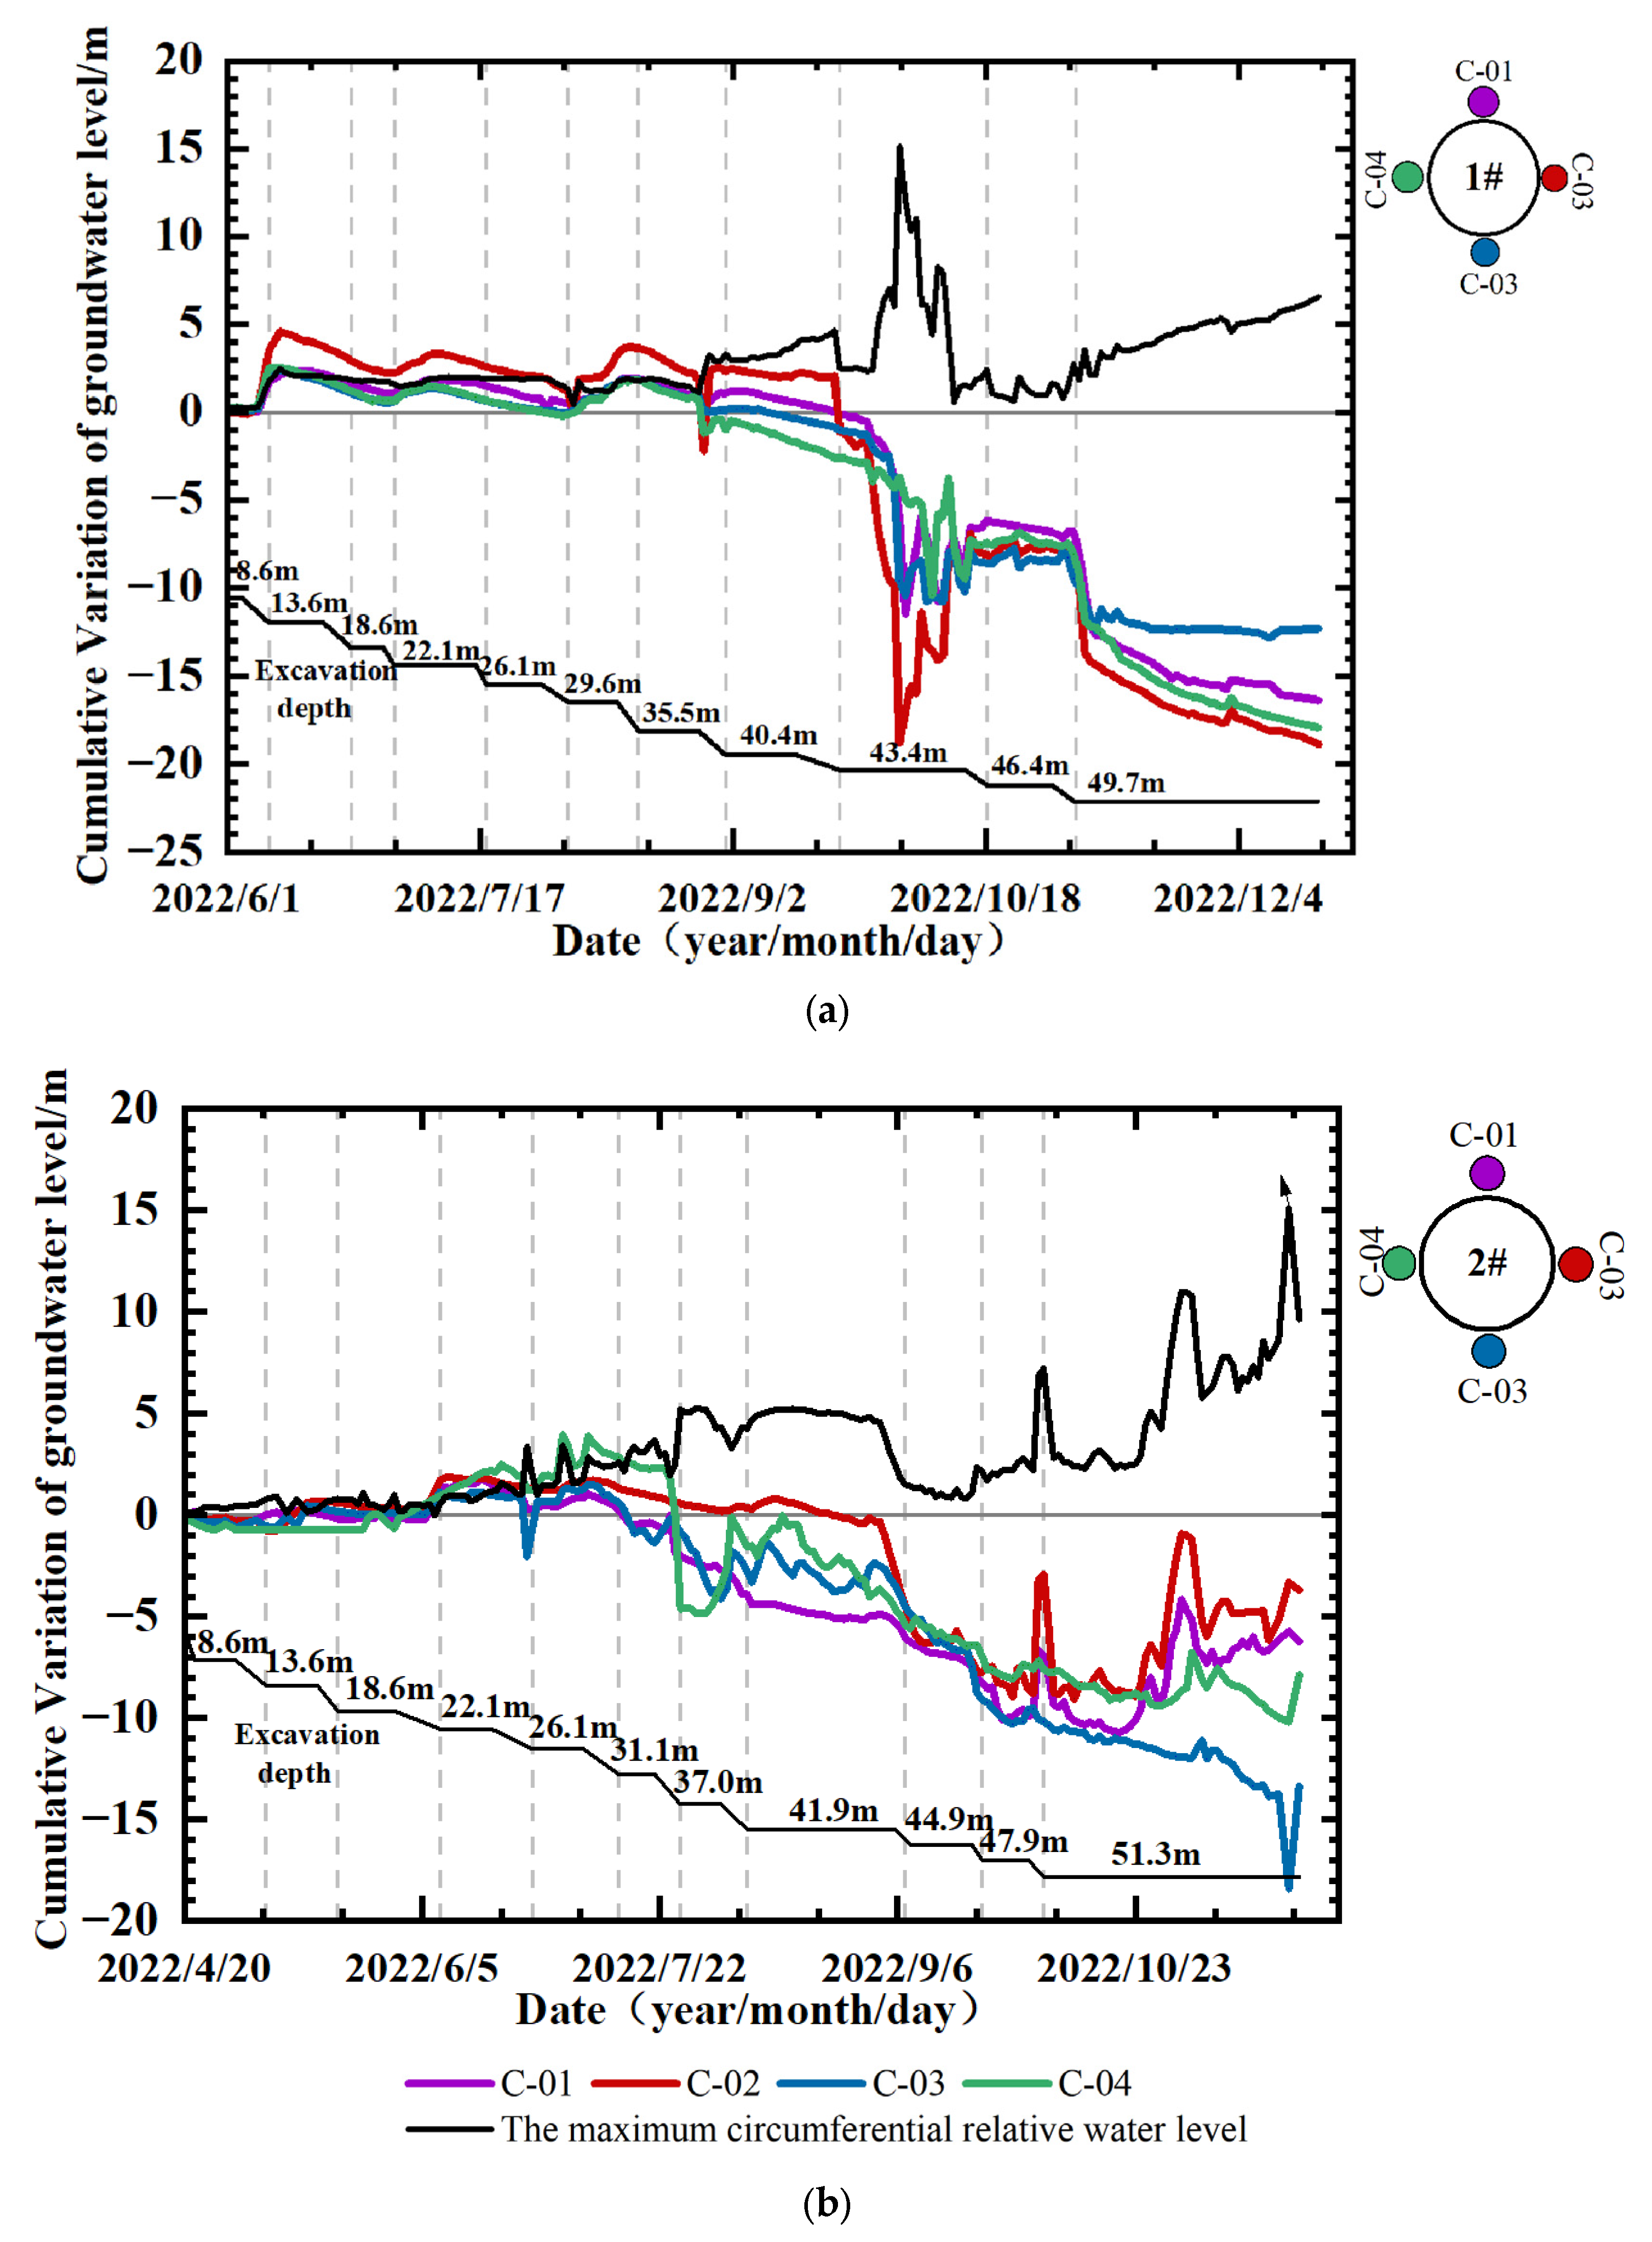
Figure 9 illustrates the cumulative variation in the groundwater level around the pit. The maximum circumferential relative water level difference depicted in the figure quantifies the disparity between the highest and lowest values of each water level measurement point at the corresponding excavation depth. During the 0–30 m excavation phase, groundwater levels outside Shaft No. 1 and Shaft No. 2 remained relatively stable, with minimal discrepancies among measurement points. However, in later construction stages, groundwater seepage at the joints of certain diaphragm walls induced water level decline rapidly, and circumferential water levels across measurement points no longer remained at a uniform horizontal plane.
The groundwater level changes in Shaft 1 exhibit distinct characteristics and can be categorized into the following four stages:
  • Stable phase. During the excavation construction of the soil layer from 0 m to 40 m, the change in each water level measuring point was small, and the fluctuation range was generally within 5 m.
  • Fluctuation phase. During the construction of inner lining, with concurrent rotary drilling and impact groove sinking for the 17th diaphragm wall segment, substantial misalignment occurred at the wall’s lower section, triggering groundwater leakage. Monitoring data revealed pronounced fluctuations across all measurement points. Notably, the 1C-02 point, closest to the 17th diaphragm wall segment, experienced the first drastic drop, from −0.52 m to −18.79 m over five days (a 20.84 m decline). This was then followed by rapid drops at 1C-01 and 1C-03, then at 1C-04, indicating that the 1C-02 decline was the primary factor of subsequent water-level reductions. The gradual stabilization of all points afterward implied groundwater redistribution around the shaft, with circumferential flow from higher-level zones (1C-01, 1C-03, 1C-04) to the lower-level 1C-02. The peak maximum circumferential relative water level difference during this phase was 15.11 m, highlighting significant circumferential disparities in water level distribution.
  • Steady phase. After the implementation of grouting plugging measures, the water level stabilized gradually, with cumulative changes confined between −6.16 m and −8.82 m.
  • Decline phase. During the excavation at 46.4–49.7 m, all measurement points witnessed a drop of approximately 5 m because of the seepage, after which the levels gradually returned to stability.
The fluctuations in water level, defined as the difference between the highest and lowest recorded levels, are as follows: 1C-01: 18.7 m; 1C-02: 23.46 m; 1C-03: 15.23 m; 1C-04: 20.44 m; 2C-01: 12.52 m; 2C-02: 10.93 m; 2C-03: 19.9 m; 2C-04: 14.14 m. These data indicate substantial fluctuations of groundwater levels for both Shaft 1 and Shaft 2. The effect between fluctuation and circumferential uneven distribution of water level aggravates the spatial and temporal variability of soil–water pressure response.

4.3. Surface Settlement

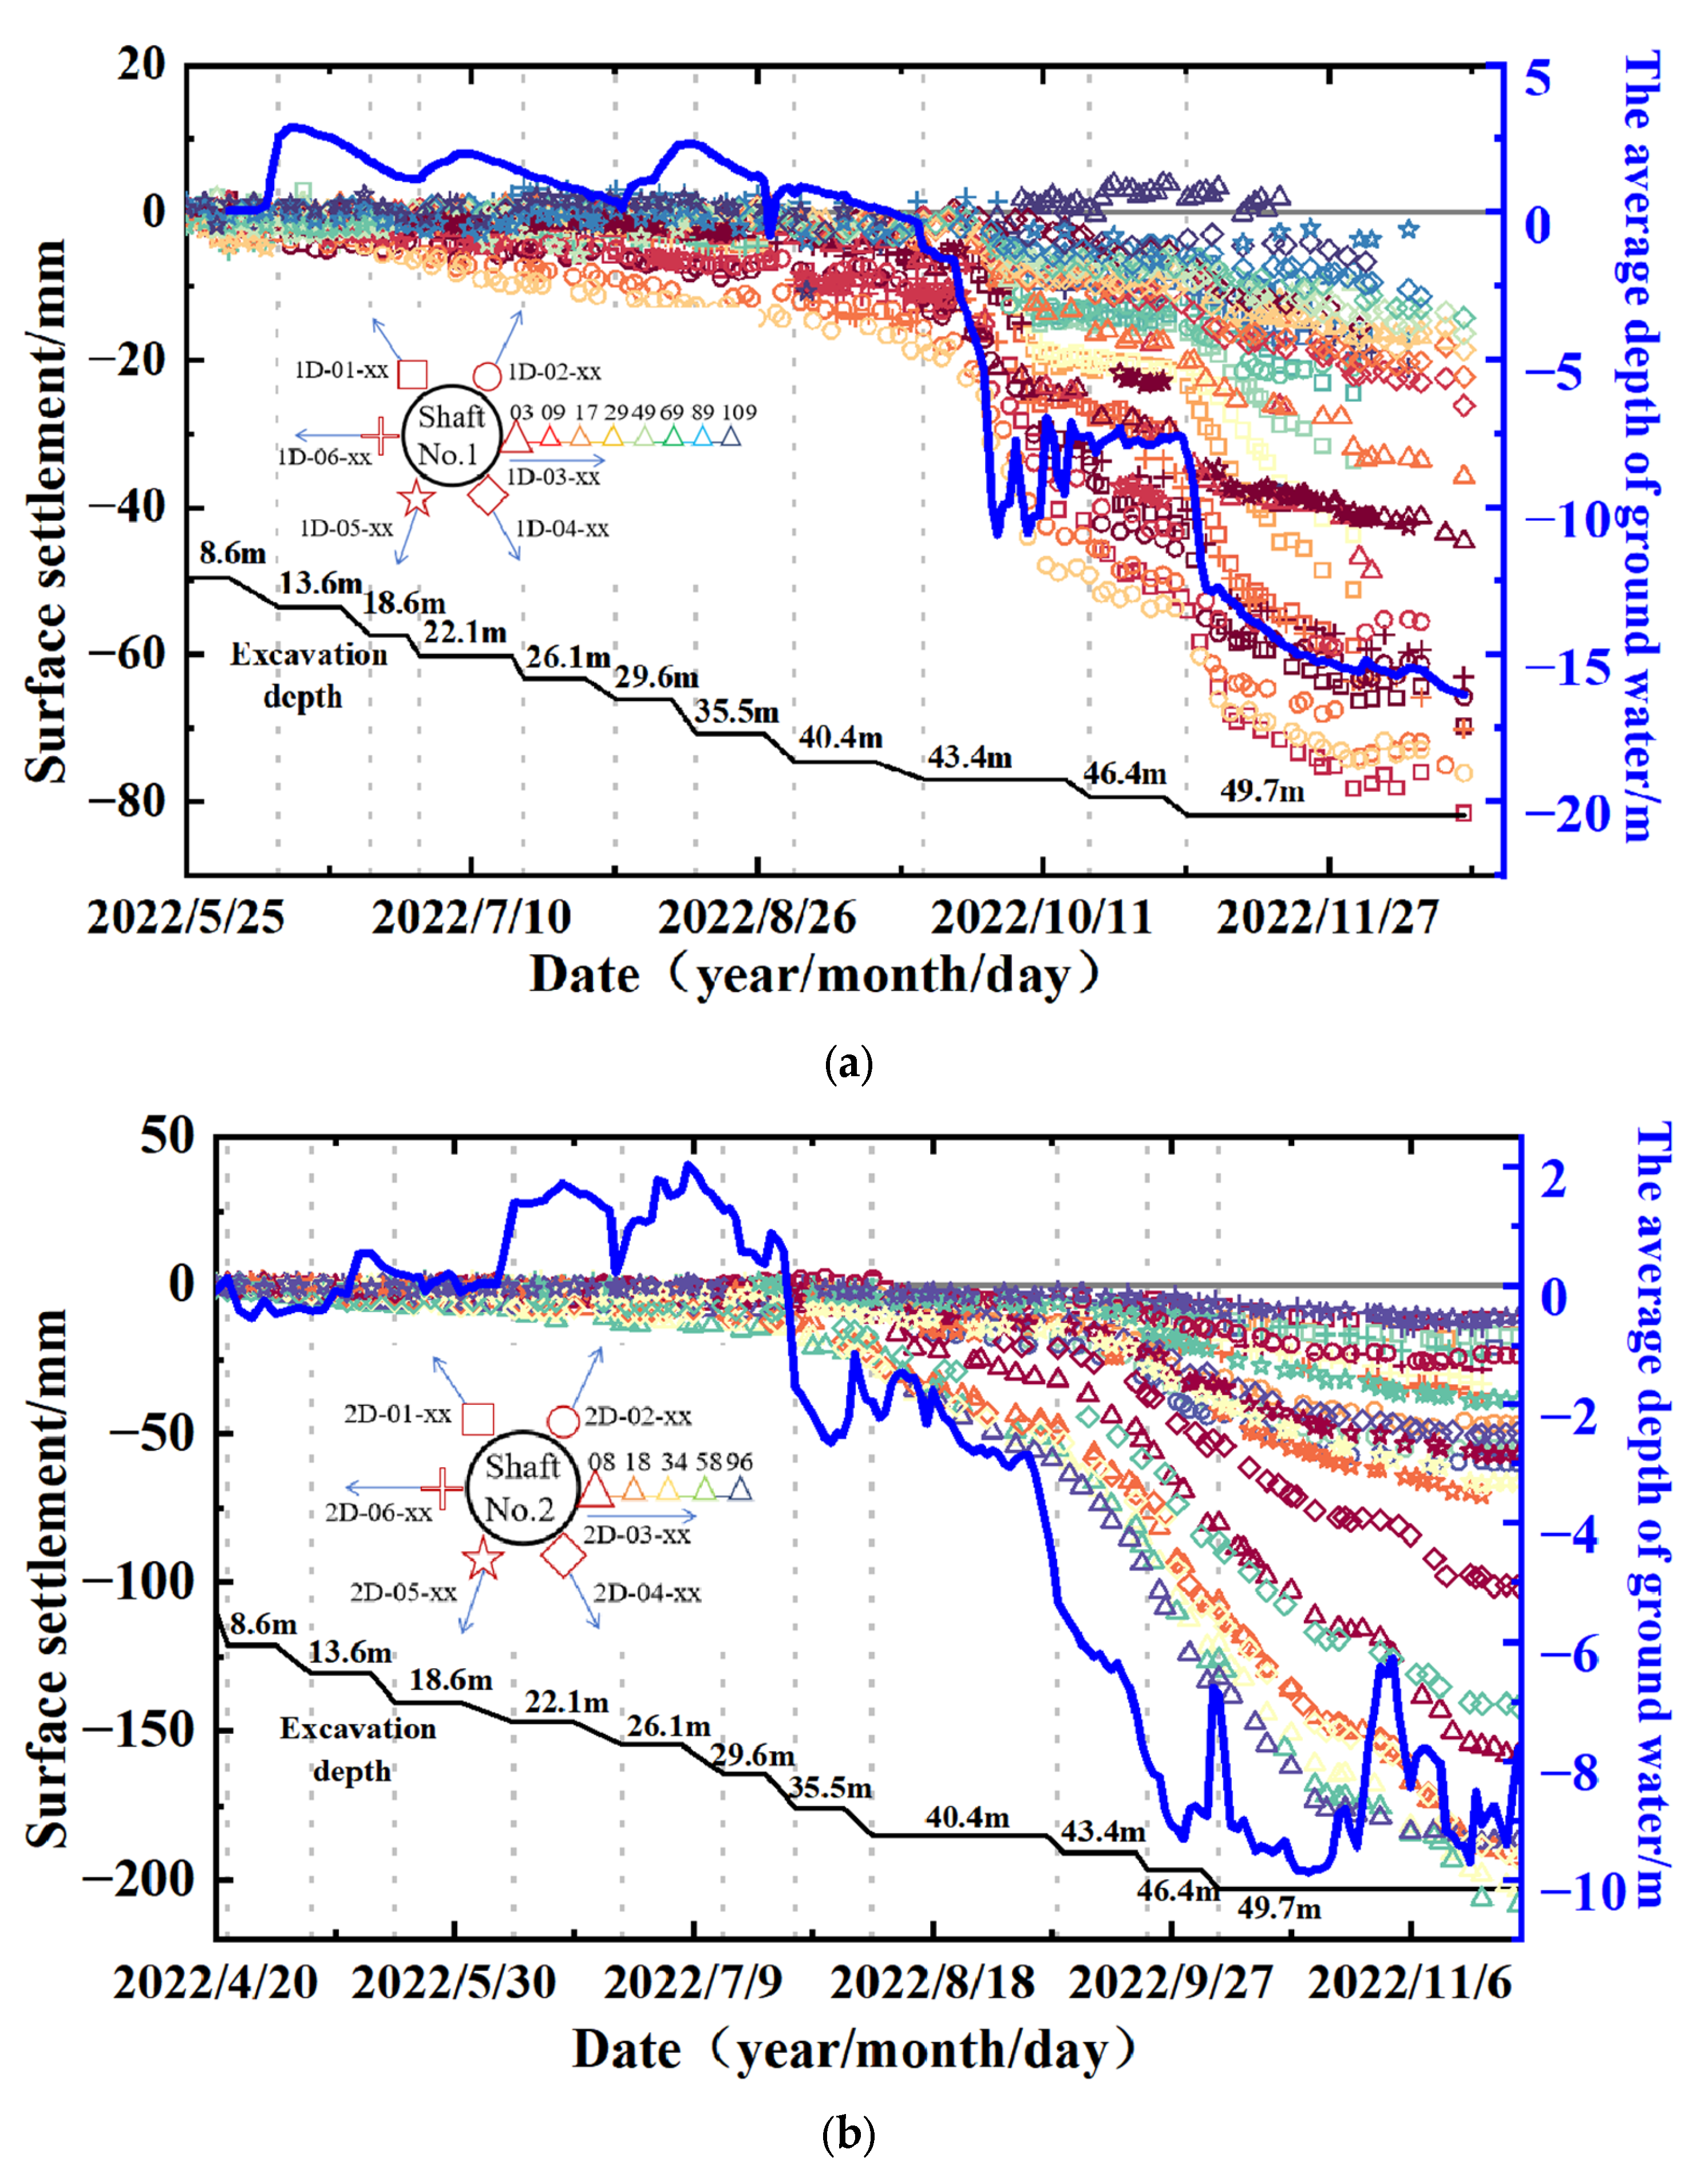
Figure 10 presents surface settlement for each measurement point, where positive/negative values denote heave/settlement deformations, and the blue line represents the average groundwater level around the pit. Data with the same monitoring section share identical markers, distinguished by colors (purple, red, orange, yellow, green, blue) corresponding to increasing distances from the pit. Key findings are shown below:
  • The decline in groundwater increases the soil effective stress and induces consolidation settlement. During stable-water-level periods (Shaft 1: a1–a10, b11–a12, c; Shaft 2: a1–a10, c), surface settlements develop gradually. Conversely, abrupt water level drops (Shaft 1: b10–a11, b12; Shaft 2: b8–a9, b10–a12) are accompanied by simultaneous acceleration in settlement rates.
  • Measurement points 2D-03-34, 2D-03-85, 2D-03-96, and 2D-04-34, 2D-04-85, 2D-04-96, exhibit disproportionately large settlements and rates, with a peak value reaching 200 mm, which substantially exceeds the control limit of 30 mm. This is attributed to poor geological conditions; soil–karst cavities have been found near the monitored section. The collapse of loose soil around cavity is caused by construction disturbances, undermining stratum stability and triggering significant surface settlement.
  • After excavation, surface settlements continue to increase slowly due to subsequent activities (e.g., shield component installation, side tunnel construction), with increments exceeding 20% of the maximum monitored settlement. Two primary factors contribute to the above phenomenon. Time-dependent stress release in soils, where gradual dissipation of stress induces sustained deformation. Additionally, the in-pit construction loads also contribute to soil deformation.
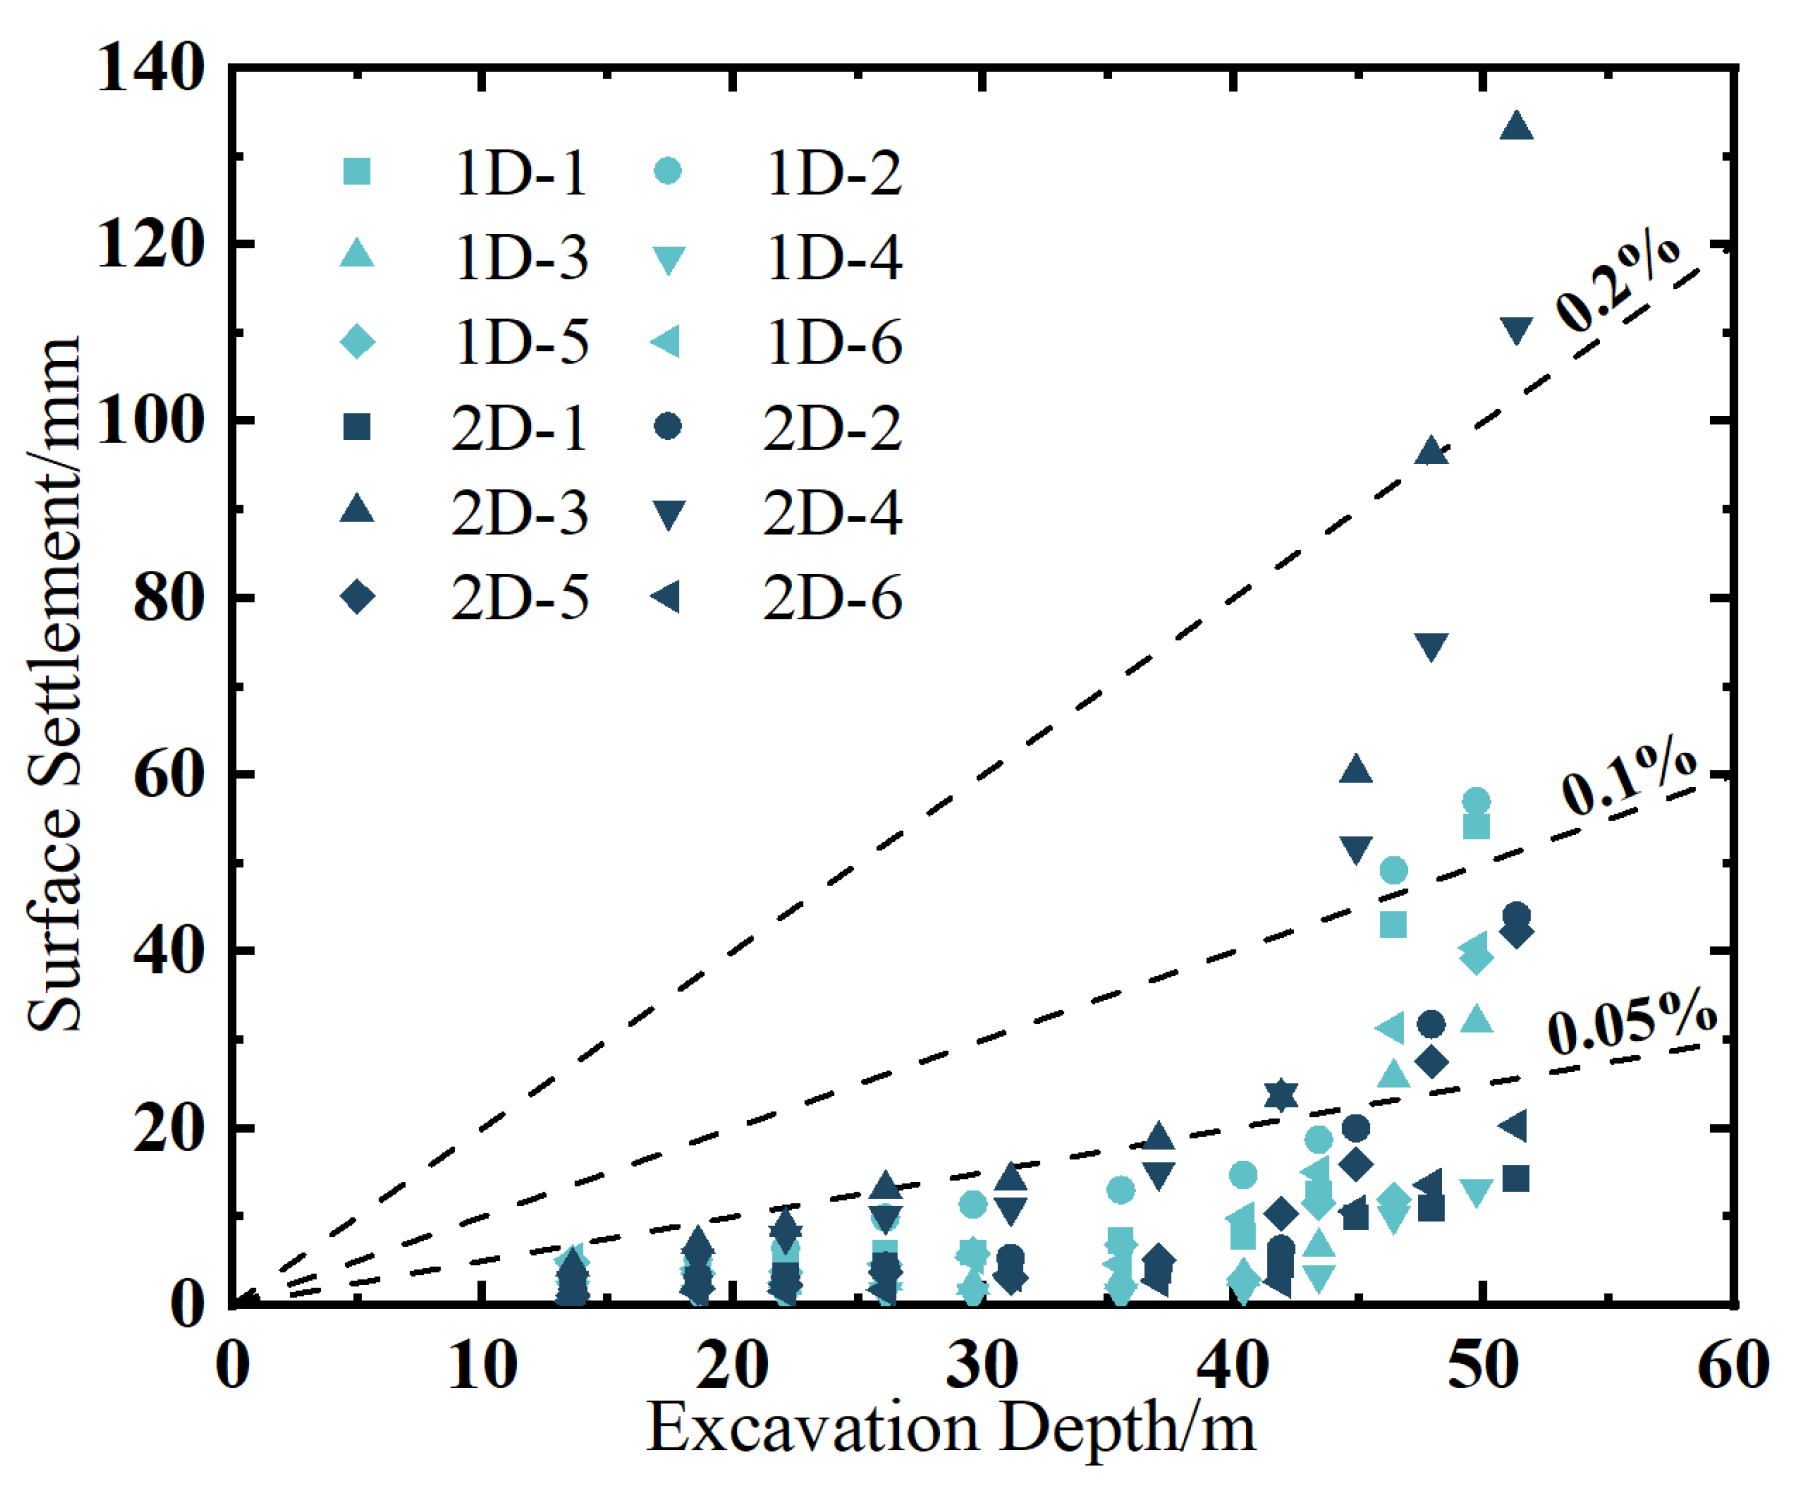
Figure 11 shows the maximum settlement of each monitoring section at the excavation depth (X-axis), with red/blue markers denoting data from Shafts No. 1/No. 2, respectively. The figure shows that surface settlements generally remain below 0.05% H. Compared with field data from polygonal and elongated foundation pits in Suzhou, Shanghai, and Fuzhou [1,21,29], the surface settlements of this project are significantly smaller, with minimal environmental disturbance. Furthermore, in contrast to soft soil environments, the soil–rock composite strata of this project result in even smaller surface settlement values. However, during the later excavation of the 40–50 m soil layer, partial measurement points exhibit settlements exceeding 0.1% H due to groundwater drawdown.
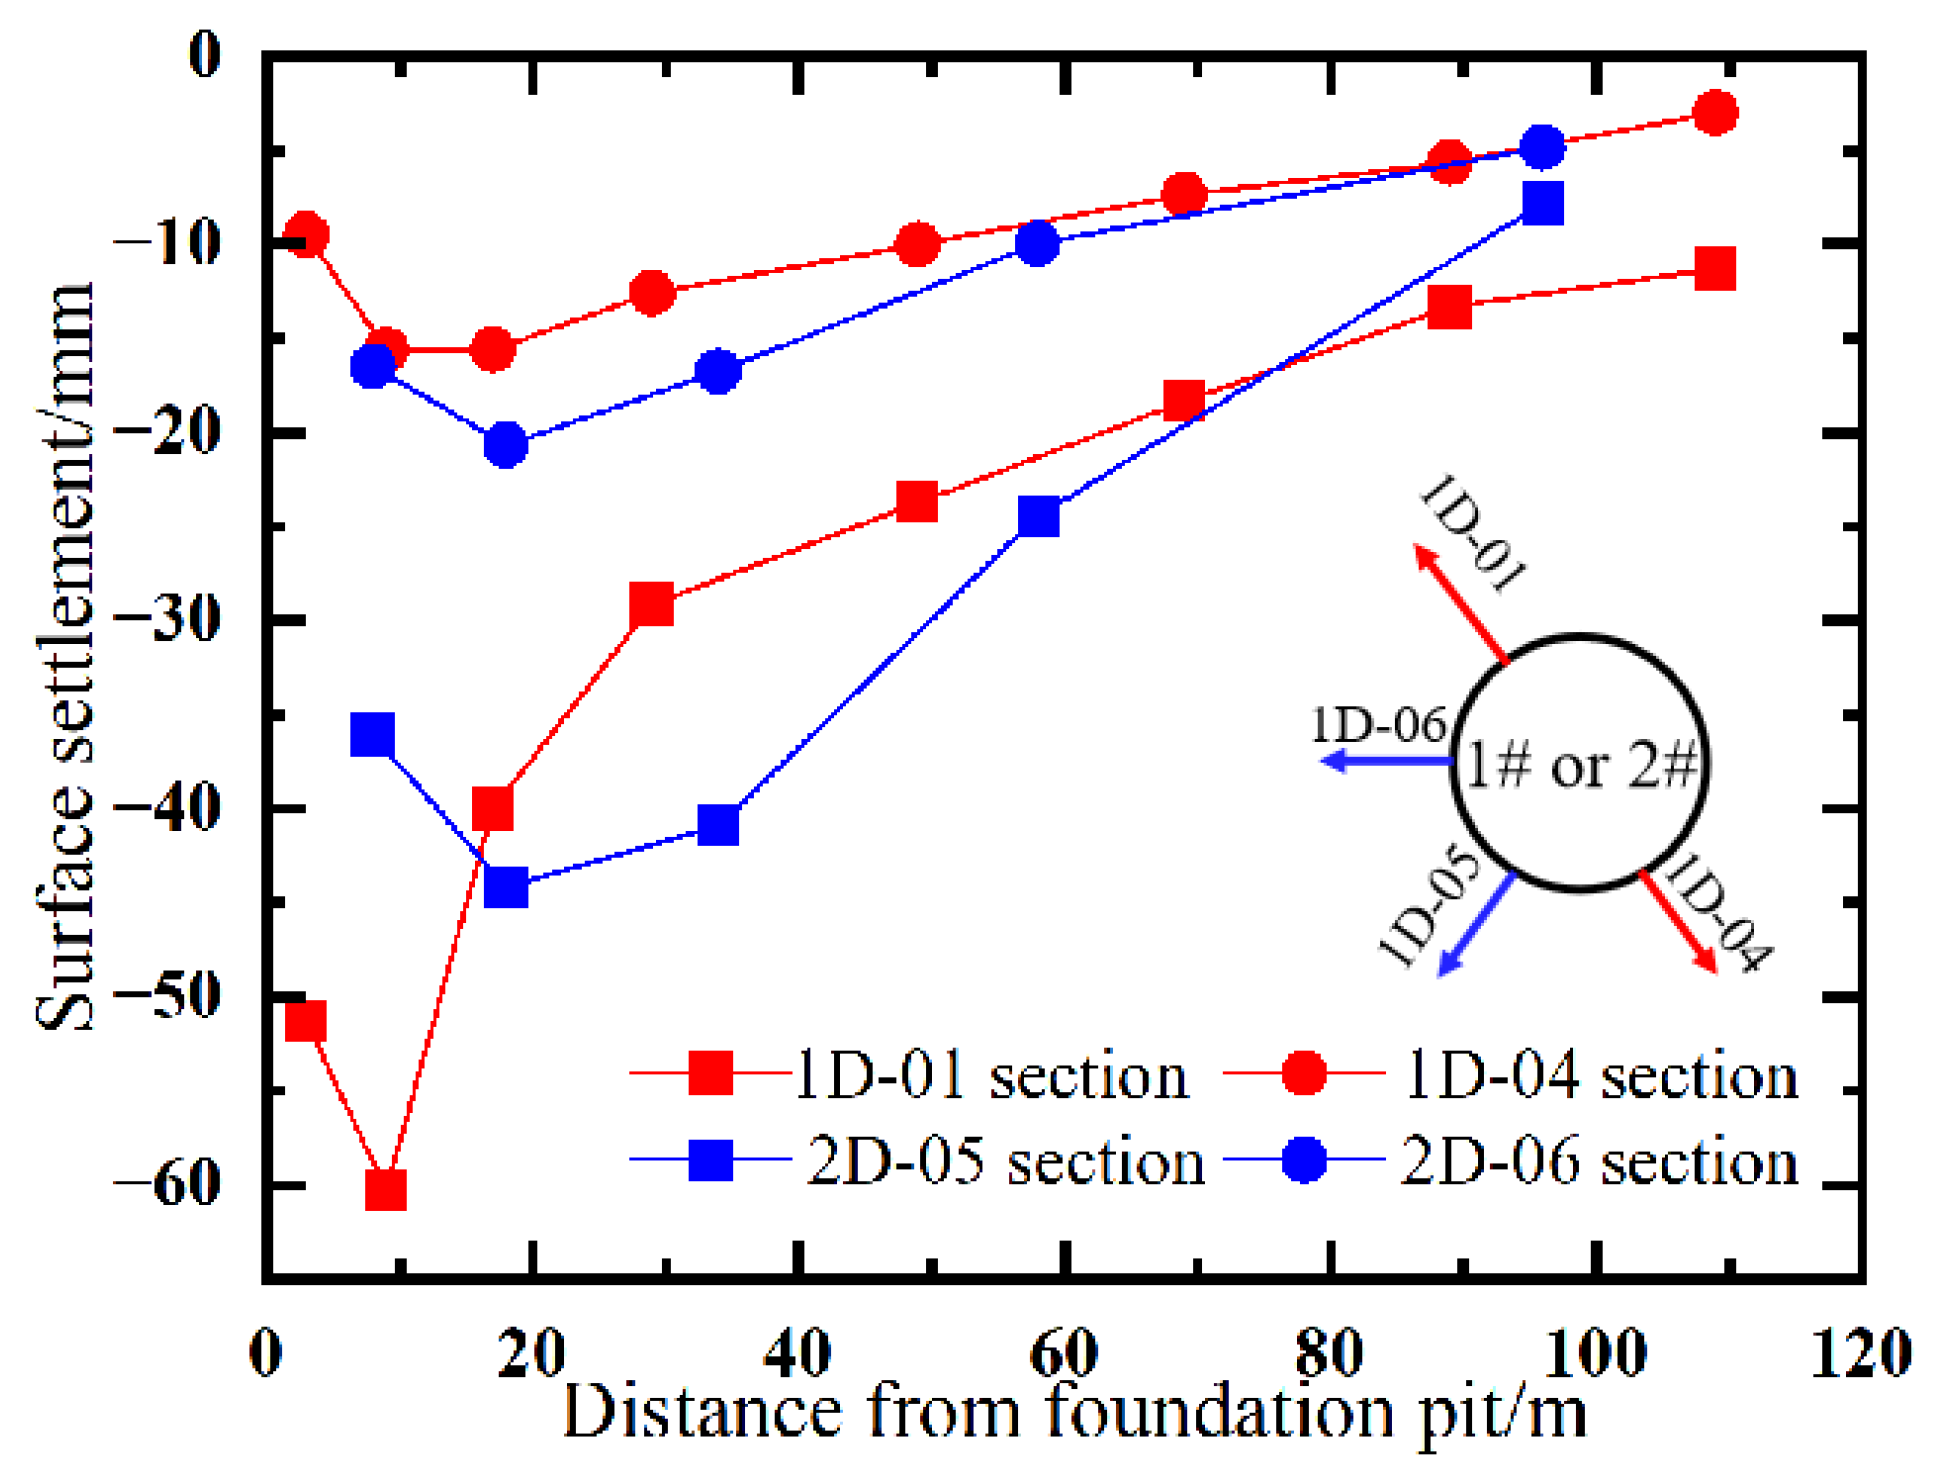
Figure 12 illustrates the post-excavation settlement curves for surface monitoring sections 1D-01, 1D-04, 2D-05, and 2D-06. Soil adjacent to the pit wall is subject to frictional resistance from the retaining structure. As the radial distance from the pit increases, the constraining effect diminishes. The surface settlements reach their peak at a specific distance from the foundation pit. Beyond this peak, settlement values decrease gradually with increasing distance, reflecting the progressive reduction in excavation-induced ground disturbance.

4.4. Vertical Displacement of the Retaining Wall

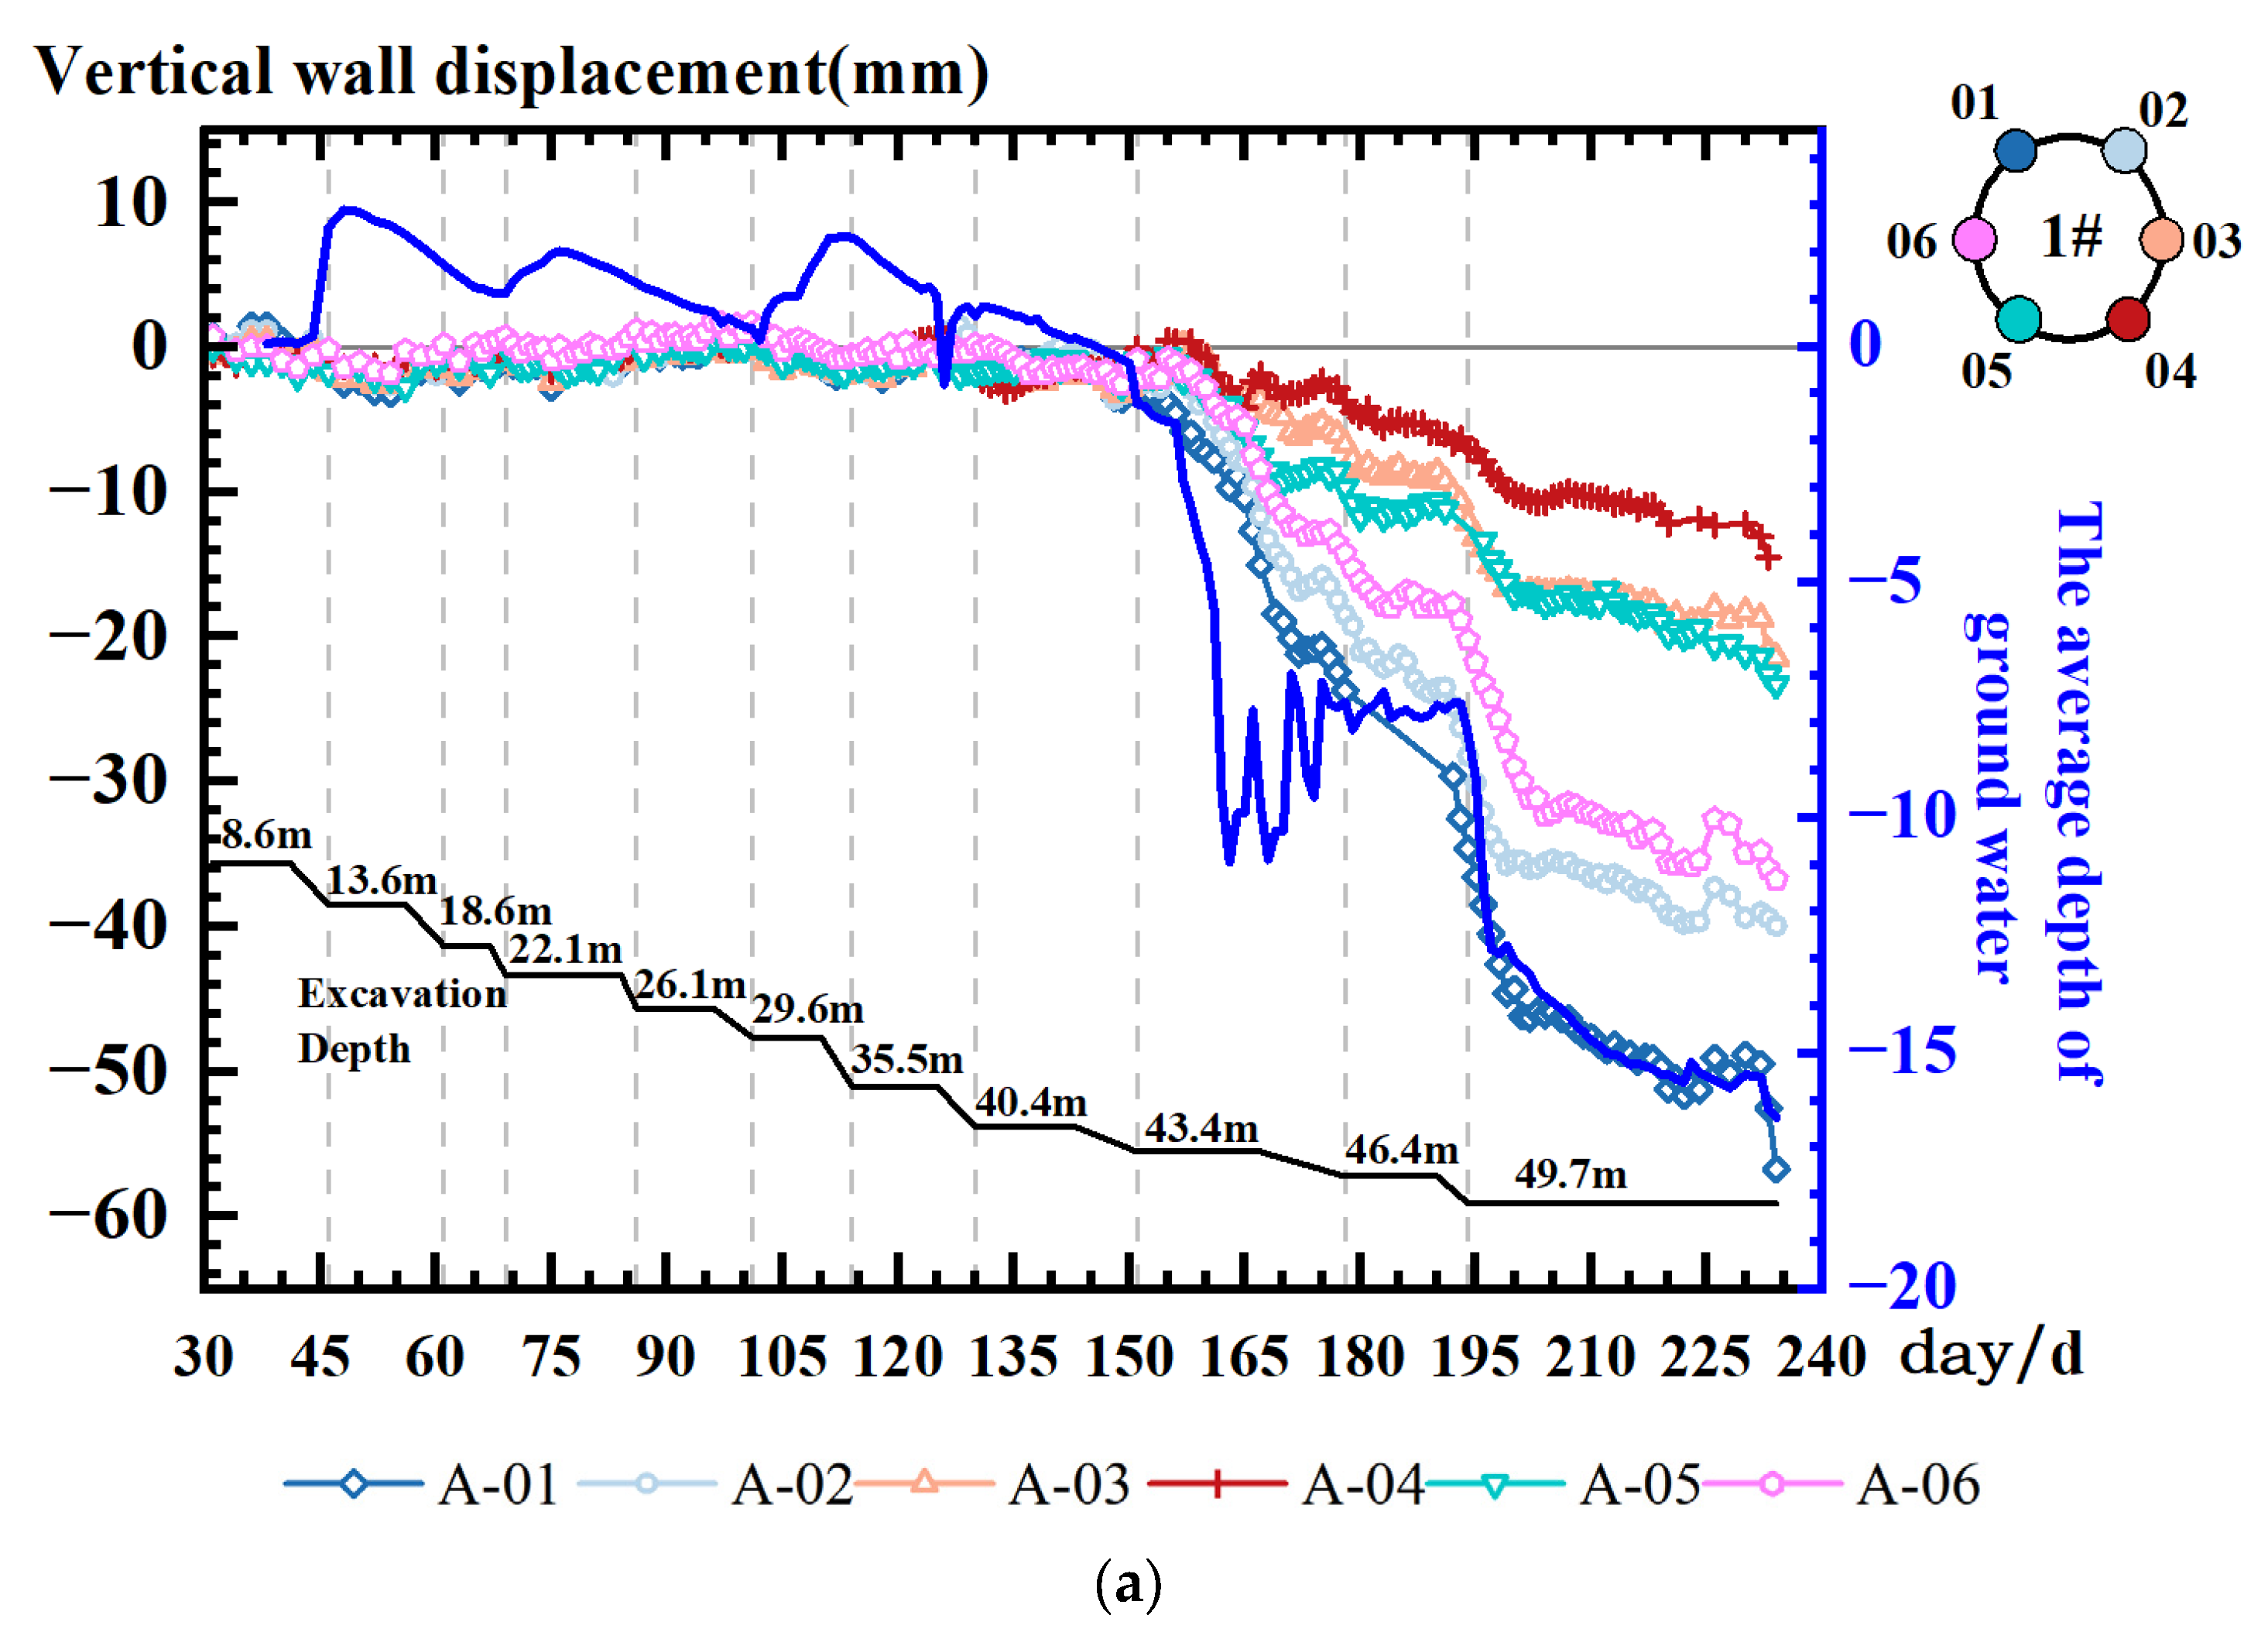
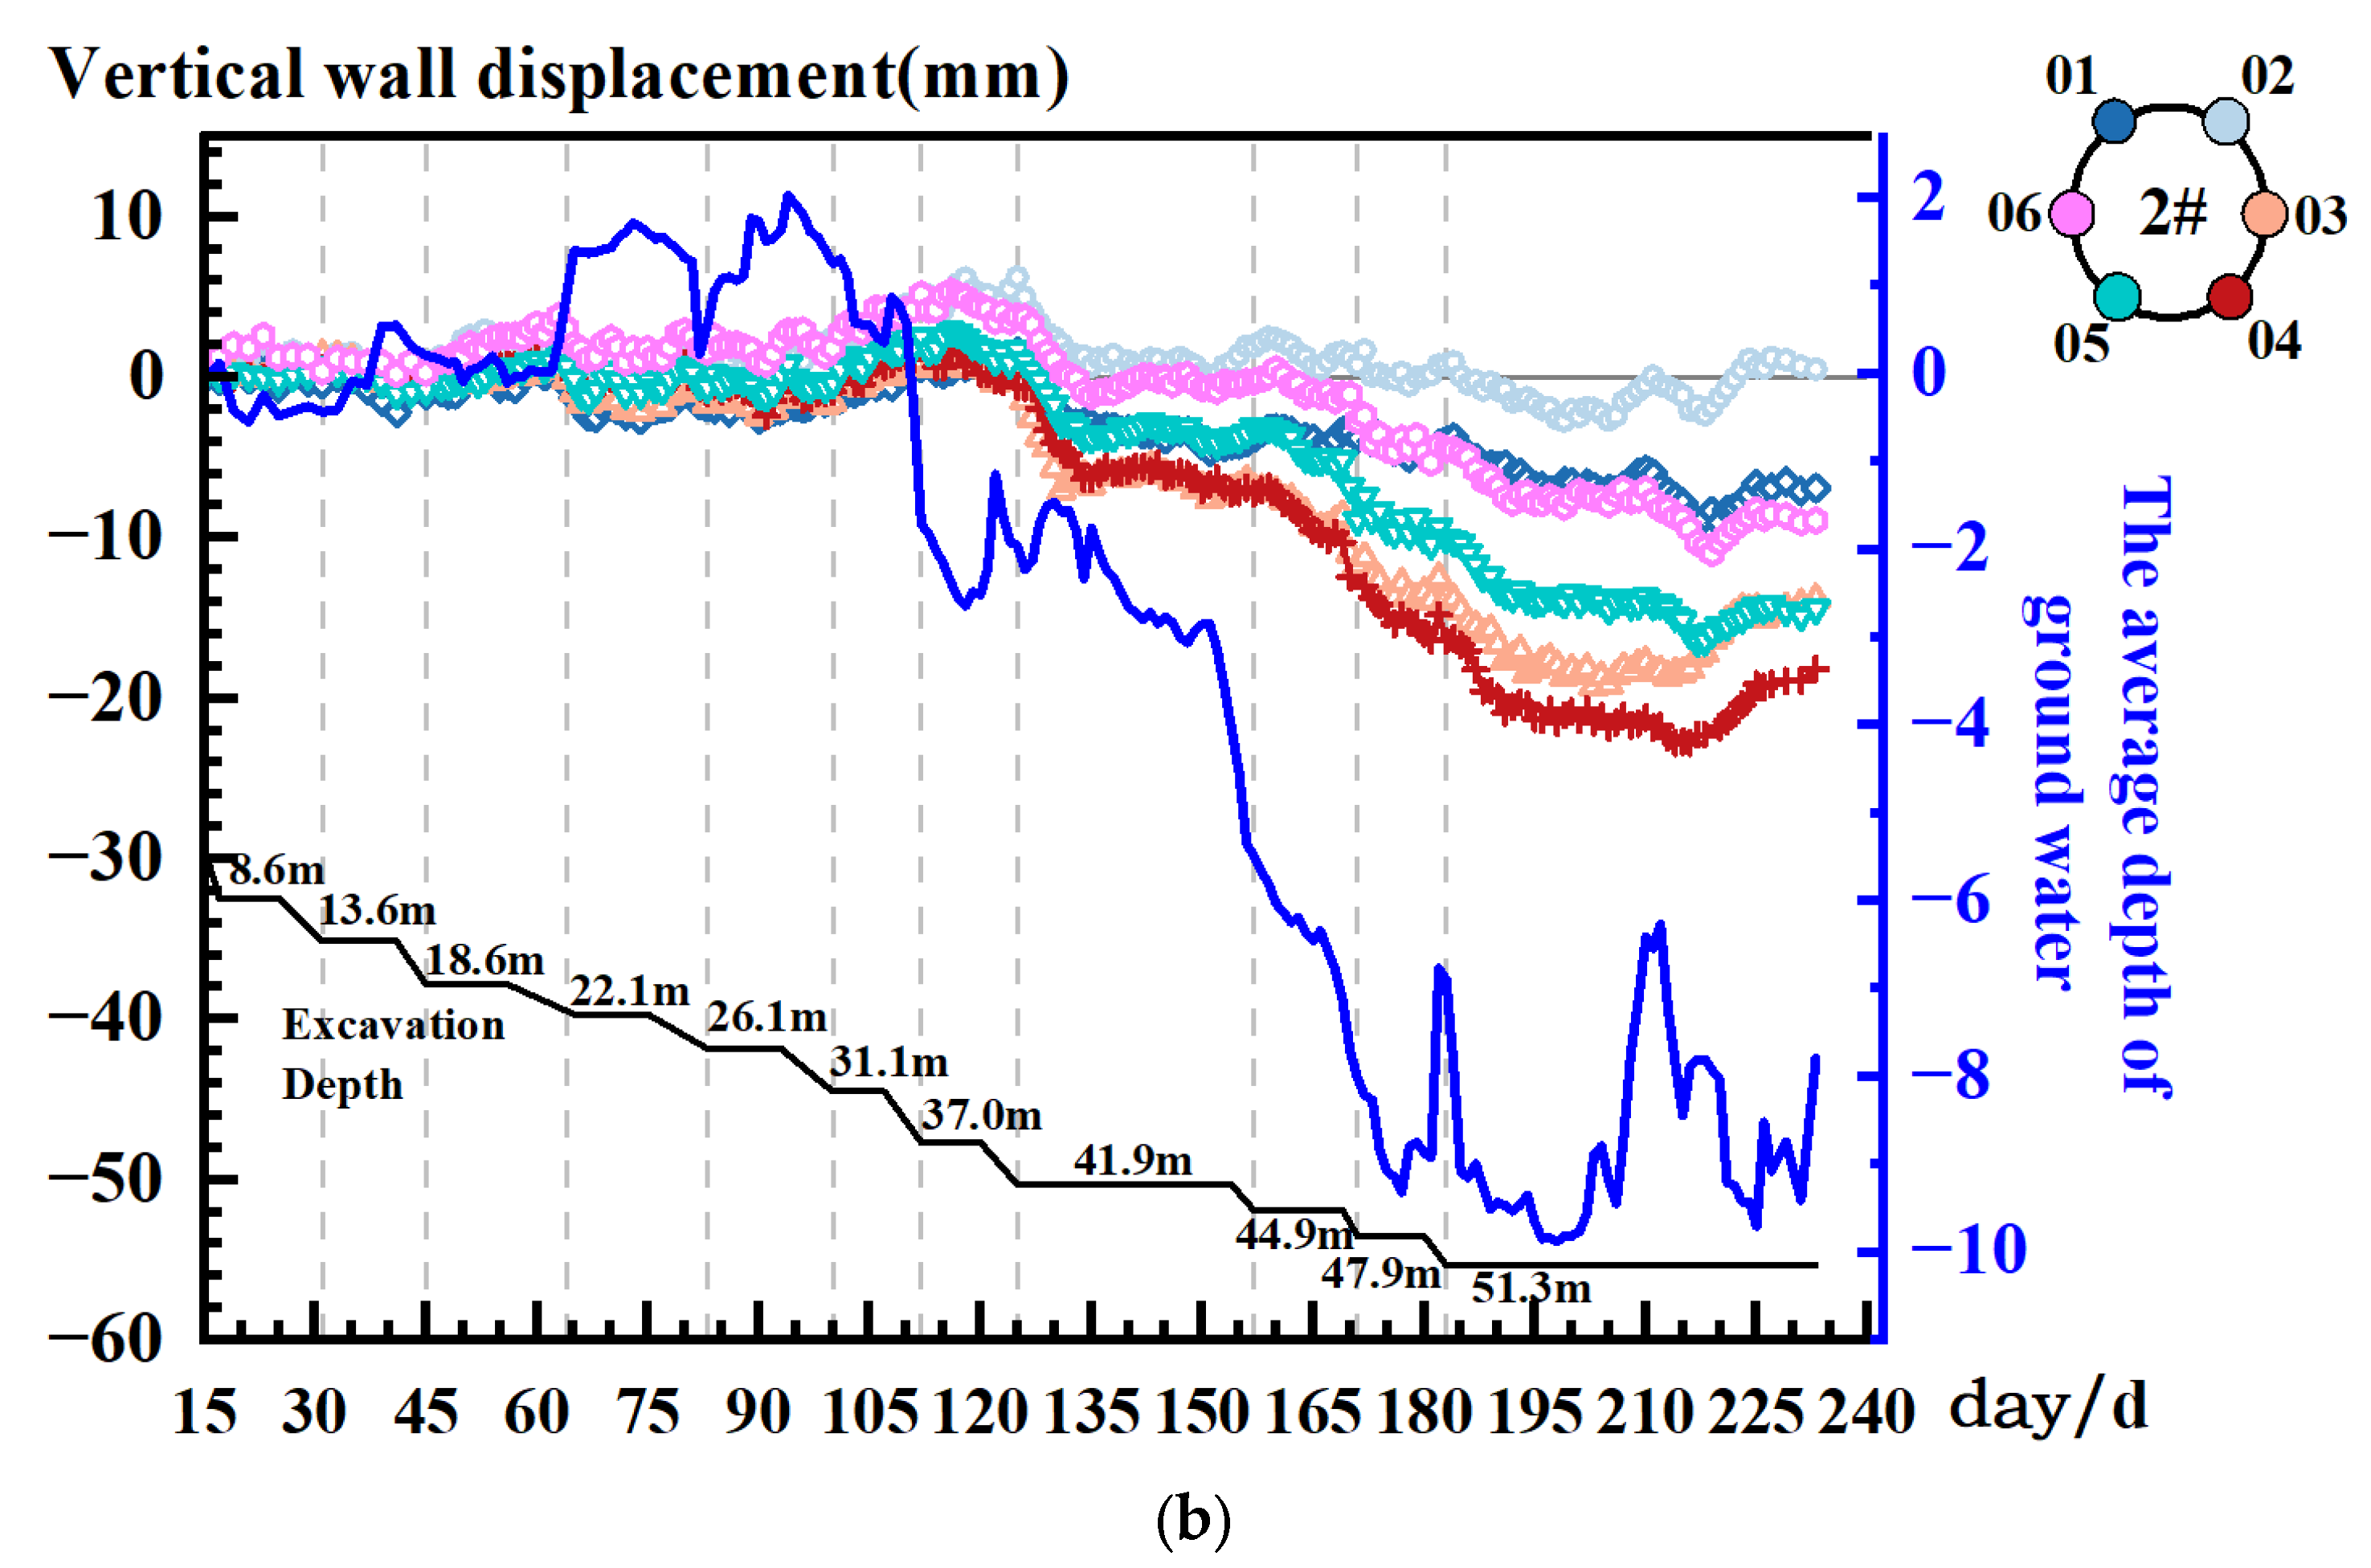
Figure 13 presents the vertical displacement of the retaining wall, where positive/negative values denote surface heave/settlement, and the blue solid line represents the average groundwater level around the pit. Overall, the wall deformation is dominated by settlement, with values increasing progressively as excavation advances. The process can be categorized into two distinct stages:
  • Shallow excavation stage (0–40 m). Vertical displacements at the top wall remain minor, some points experiencing heave and others with settlement, all within ±5 mm. This stability attributes to balanced soil–structure interactions in the upper strata.
  • Deep excavation stage (40–50 m). The deformation rates is accelerated, leading to notable wall settlement. Significant settlement occurred after abrupt declines in the average groundwater level (Shaft 1: b10–a11, b12; Shaft 2: b8–a9, b10–a12), indicating the pronounced influence of groundwater changes on vertical deformations. The decline in the water level exacerbates the settlement. The large circumferential water level differences (e.g., Shaft 1: b10–a11; Shaft 2: b8–a9, b10–a12) correlate with disparate deformation rates, which indicate that it amplifies non-uniform wall deformations.
The vertical deformation of the retaining wall is effected by the interplay of in-pit construction loads, soil frictional forces and hydro-mechanical stresses. Early-stage excavation-induced wall heave is primarily caused by in-pit soil heave, where the soil upward movements caused by unloading generate negative frictional resistance on the wall’s inner surface and lift the wall. In shallow layers, the large soil–wall contact area ensures these upward frictional forces dominate. However, as excavation deepens and the contact area reduces, the upward friction diminishes. Concurrently, significant drops of water level around the pit trigger soil consolidation, imposing downward frictional forces on the wall. These downward forces eventually prevail, leading to the observed late-stage settlement in both shafts.
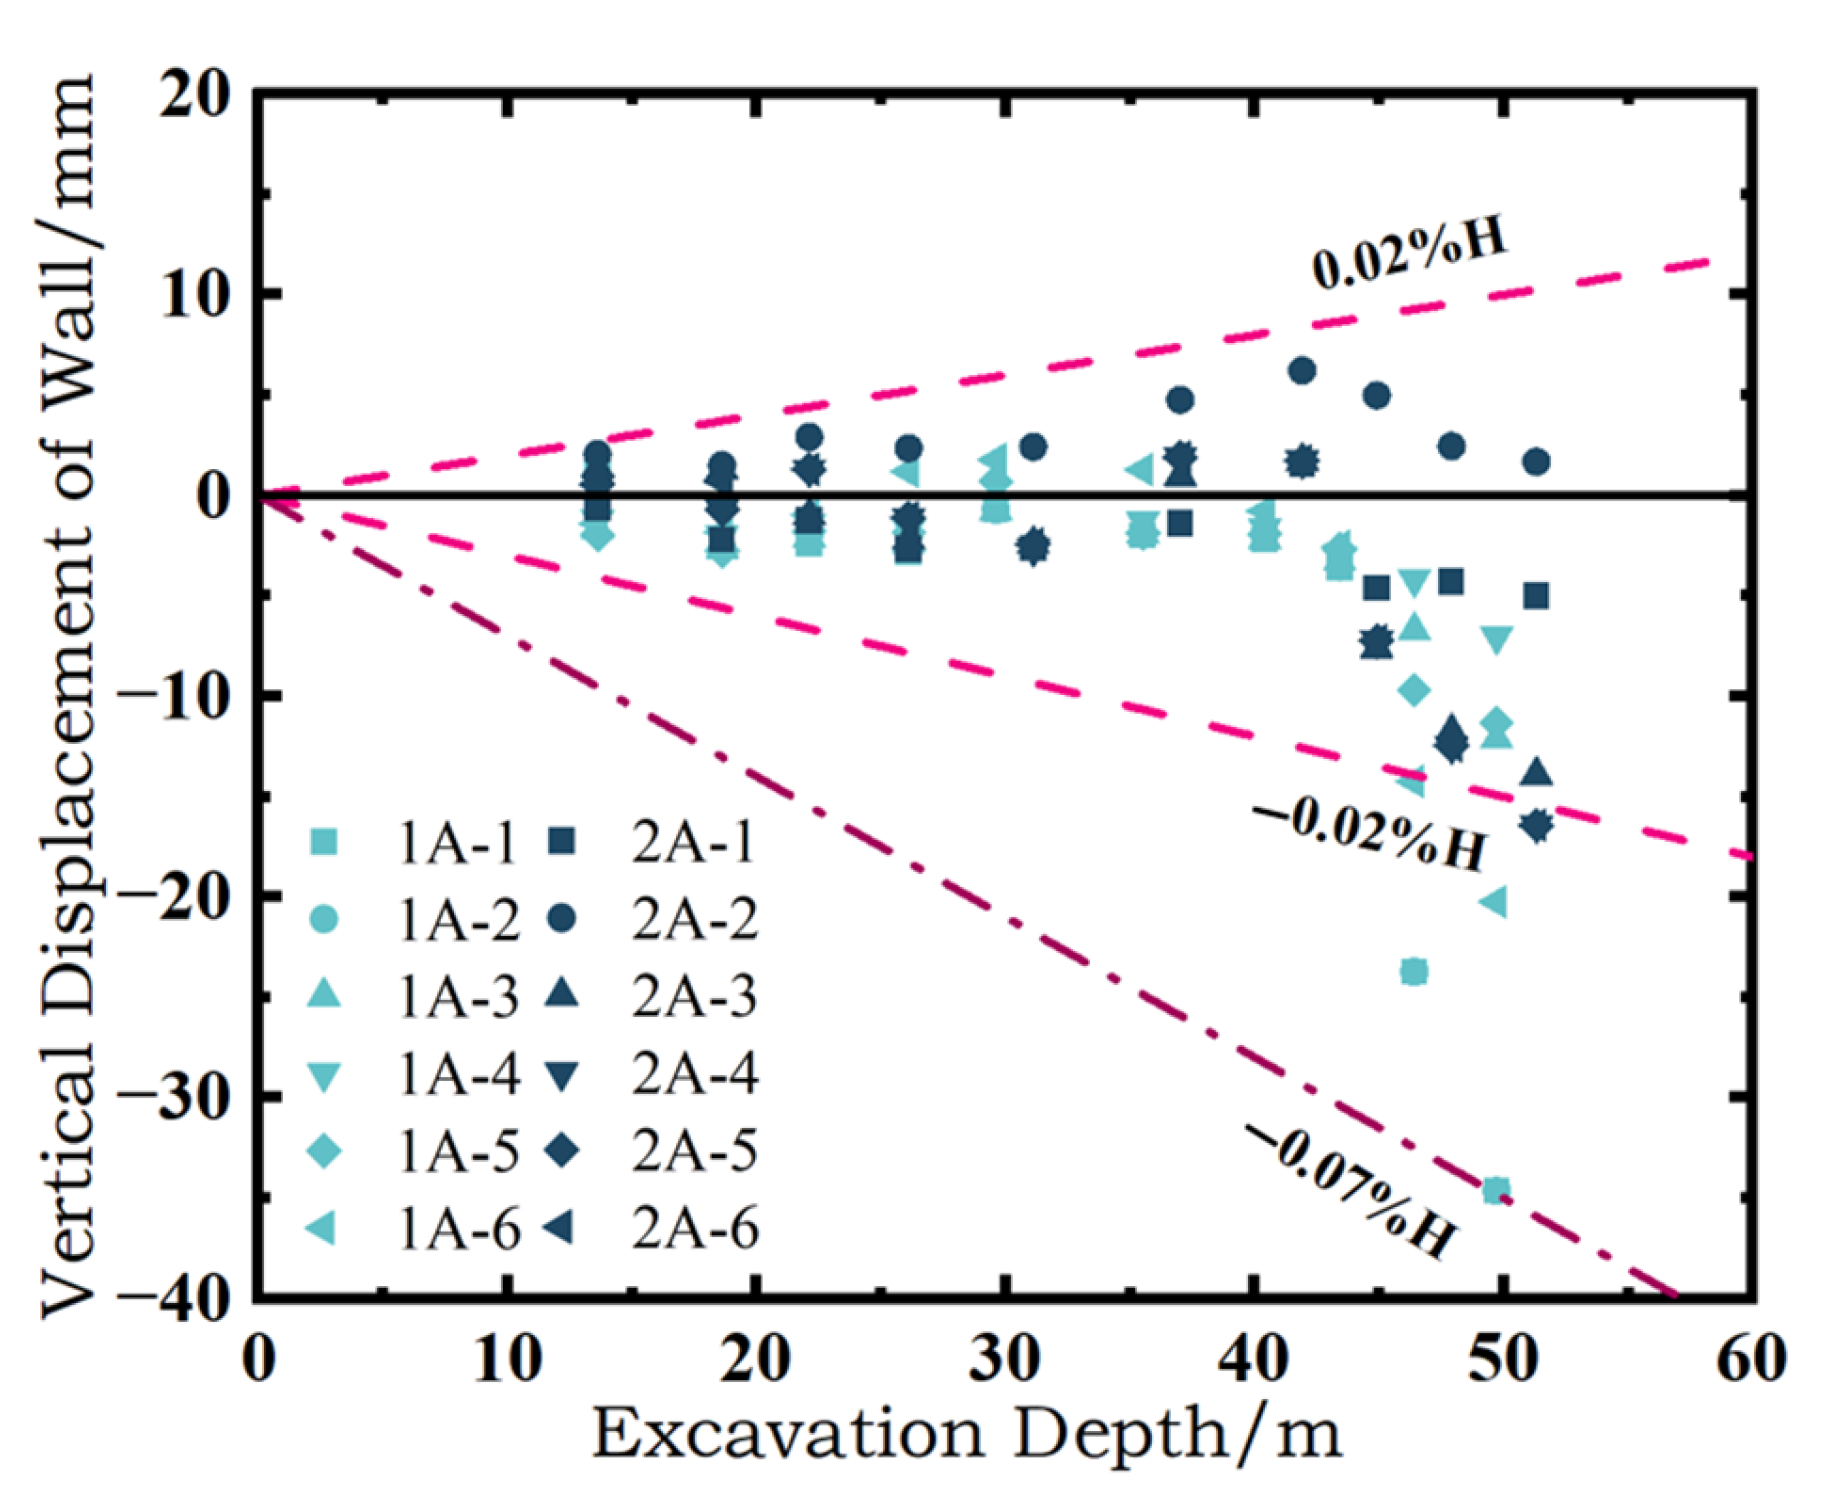
Figure 14 presents vertical displacement of the retaining wall with different excavation depths. During the shallow excavation phase (0–40 m), vertical displacements at the top wall are confined within ±0.2% H. However, in later stages, most points experience settlement influenced by frictional forces from soil consolidation outside the pit, with some settlements approaching 0.8% H. The most pronounced settlements occur in the late excavation phase, with a drastic decline in groundwater levels.
In conclusion, the decline in groundwater levels adversely impacts deformations of both retaining wall and ground surface. Maintaining groundwater stability and uniformity during construction is critical. Two key measures are necessary: use of high-sealing joints and advanced waterproofing technologies. Adoption of precise groove-sinking methods during retaining wall construction to ensure joint watertightness is important. Shaft 1 exhibits distinct deformation characteristics, summarized as follows:
Unconventional outward deformation: unlike typical foundation pits, where excavation-induced soil flow toward the pit causes inward wall deformations, half of Shaft No. 1’s measurement points (1B-01, 1B-02, 1B-06) recorded significant outward deformations during the excavation of soil layers below 40 m.
  • Asymmetric settlement response. Surface settlements were smaller at the side with pronounced groundwater fluctuations compared to the side with stable water levels.
  • Deformation mode transition. The deformation mode of walls at measurement points 1B-01, 1B-02, and 1B-06 shifted from flexural to global tilting deformation in late construction stages.
These phenomena may attributed to a combination of factors:
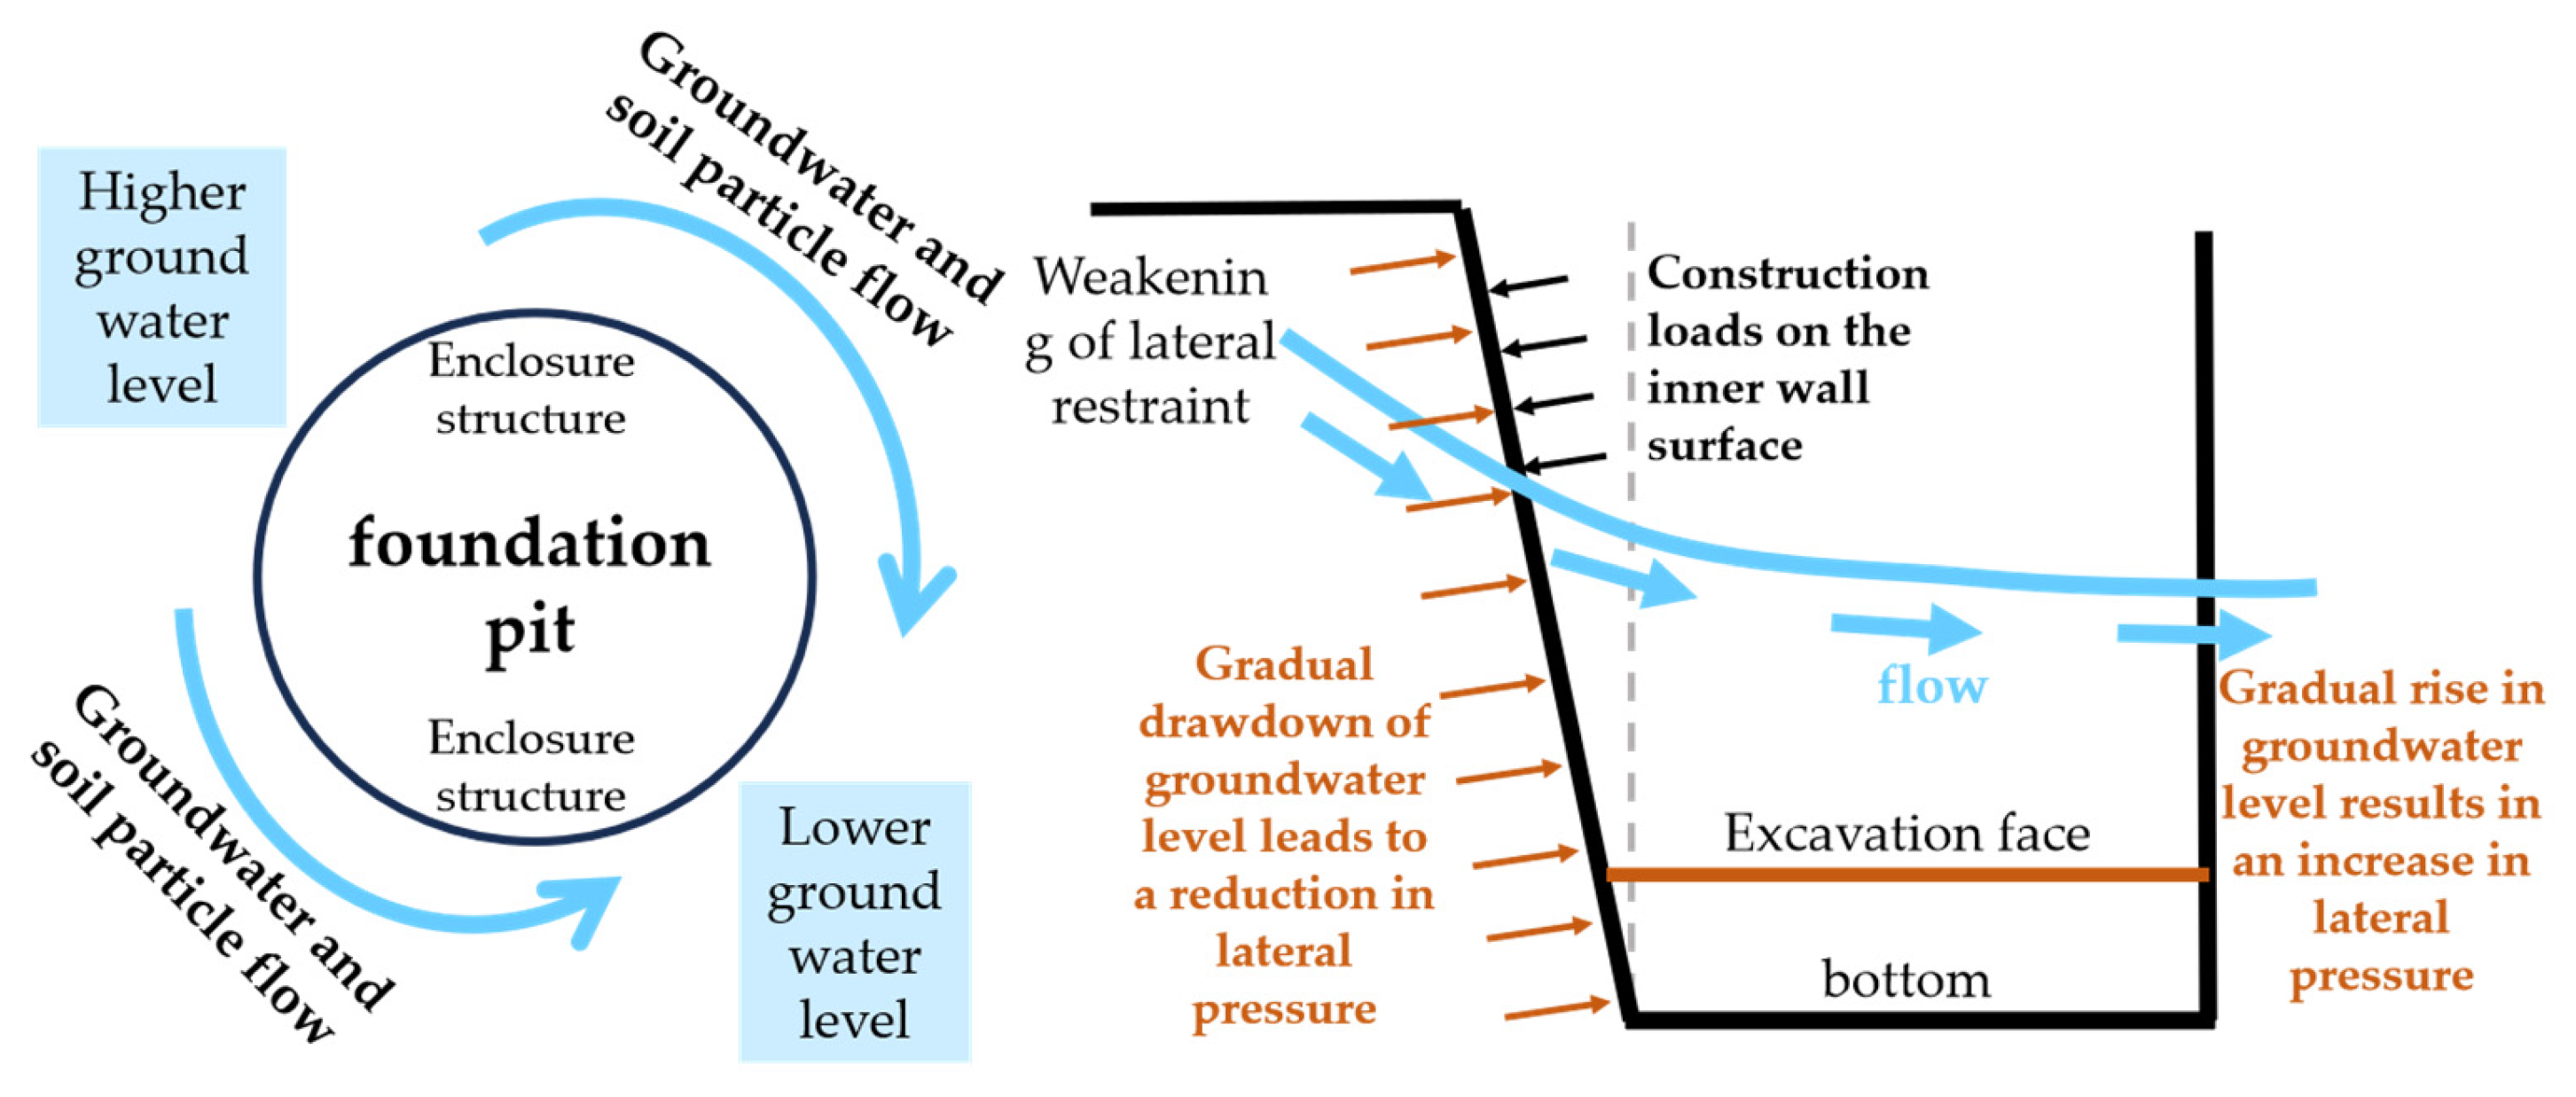
  • As analyzed in Section 4.2, groundwater around Shaft No. 1 exhibited both vertical and circumferential flow (Figure 15) during the b10-a11 stage. Seepage forces induced by water level changes mobilized fine soil particles, leading to soil softening and reduced strength at erosion sites.
  • In the upper loose strata (plain fill, completely weathered siltstone, etc.), the wall embedment depth was decreased and the foundation constraints were weakened, which created eccentric loading on the cylindrical retaining structure. This imbalanced pressure, combined with inner-wall construction loads, induced outward tilting of the retaining wall.
  • The increasing outward deformations widened circumferential wall joints, decreasing structural stiffness and waterproofing. And then it further accelerated deformations. Conversely, the opposite pit side benefited from soil–water supplement, enhancing lateral restraint and mitigating settlements in those areas.

5. Conclusions

This study presents a monitoring-based analysis of surface settlement, retaining structure deformations and groundwater variation during the excavation of two cylindrical shafts. By analyzing the monitored data, deformation behaviors of the pits in soil–rock composite strata are systematically summarized. Key conclusions are included:
  • Uneven soil–water pressures, construction loads and localized surface surcharge are the main factors of diverse horizontal deformation patterns in retaining walls, resulting in asymmetric and non-uniform deformations across both the walls and the ground surface.
  • Analysis of Shaft No. 1 and Shaft No. 2 reveals that maximum horizontal wall deformations generally remain below 0.05% H; peak values occurred in the H − 20 m to H + 20 m depth and the shallow 0–10 m depth. In soil–rock composite strata, the largest horizontal displacements may occur in weaker soil strata (0–10 m). Vertical displacements at the top wall are confined within ±0.2% H. Compared to polygonal counterparts, cylindrical foundation pits demonstrate superior structural stability and reduced environmental disturbance, with smaller horizontal deformations of wall and ground settlements in soil–rock composite strata.
  • Groundwater seepage through retaining structure joints triggers substantial declines in groundwater level and the redistribution of circumferential groundwater. Fine-grain migration in adjacent soils occurred with the process of groundwater seepage, leading to outward tilting of the wall at the erosion sites and exacerbating non-uniform deformations of both the structure and the surface. Maintaining groundwater stability and uniformity during construction is critical. The adoption of high-sealing joints and advanced waterproofing techniques is required.

Author Contributions

Conceptualization, X.F., P.T. and Y.L.; methodology, X.F. and Y.L.; software, X.F. and W.C.; validation, P.T., W.C. and Y.L.; formal analysis, X.F.; investigation, X.F. and W.C.; resources, P.T., W.C. and X.Y.; data curation, X.F.; writing—original draft preparation, P.T. and X.F.; writing—review and editing, Y.L. and P.T.; visualization, X.F.; supervision, P.T. and Y.L.; project administration, P.T. and X.Y.; funding acquisition, P.T. and Y.L. All authors have read and agreed to the published version of the manuscript.

Funding

This study was funded by the National Natural Science Foundation of China, grant number 52378427, Guangdong Basic and Applied Basic Research Foundation grant number 2024A1515012623, and the Sustainable Development Project of Shenzhen Natural Science Foundation, grant number KCXFZ20201221173207020. The authors are grateful to these institutions for their support.

Institutional Review Board Statement

Not applicable.

Informed Consent Statement

Not applicable.

Data Availability Statement

Data are contained within the article.

Conflicts of Interest

Author Xiaoming Yan was employed by the company Shenzhen Metro Group Co., Ltd. The remaining authors declare that the research was conducted in the absence of any commercial or financial relationships that could be construed as a potential conflict of interest.

References

  1. Yang, J.; Kong, D. Deformation of deep and large foundation pit in soft soil of Fuzhou Subway. Arab. J. Geosci. 2020, 13, 36. [Google Scholar] [CrossRef]
  2. Ren, D.; Kang, C.; Liu, H.; Li, Y.; Wang, J. Characteristics of a large-scale deep foundation pit excavated by the central-island technique in chengdu soft clay. KSCE J. Civ. Eng. 2022, 26, 2610–2623. [Google Scholar] [CrossRef]
  3. Tan, Y.; Lu, Y.; Wang, D. Deep excavation of the Gate of the Orient in Suzhou stiff clay: Composite earth-retaining systems and dewatering plans. J. Geotech. Geoenviron. Eng. 2018, 144, 05017009. [Google Scholar] [CrossRef]
  4. Cho, J.; Lim, H.; Jeong, S.; Kim, K. Analysis of lateral earth pressure on a vertical cylindrical shaft considering the 3D arching effect. Tunn. Undergr. Space Technol. 2015, 48, 11–19. [Google Scholar] [CrossRef]
  5. Zhang, J.; Li, M.; Yi, J.; Wu, D.; Chai, X. Analytical Solution for Radial Displacement–Dependent Earth Pressure Acting on Underwater Rock-Socketed cylindrical Diaphragm Walls. Int. J. Geotech. 2024, 24, 04024083. [Google Scholar]
  6. Borges, J.L.; Guerra, G.T. Cylindrical excavations in clayey soils retained by jet grout walls: Numerical analysis and parametric study considering the influence of consolidation. Comput. Geotech. 2014, 55, 42–56. [Google Scholar] [CrossRef]
  7. Chehadeh, A.; Turan, A.; Abed, F.; Yamin, M. Lateral earth pressures acting on cylindrical shafts considering soil-structure interaction. Int. J. Geotech. Eng. 2019, 13, 139–151. [Google Scholar] [CrossRef]
  8. Kim, K.Y.; Lee, D.S.; Cho, J.; Jeong, S.S.; Lee, S. The effect of arching pressure on a vertical circular shaft. Tunn. Undergr. Space Technol. 2013, 37, 10–21. [Google Scholar] [CrossRef]
  9. Beresantsev, V.G. Earth pressure on the cylindrical retaining wall. Conf. Earth Press. Probl. 1958, 21–27. [Google Scholar]
  10. Prater, E.G. An examination of some theories of earth pressure on shaft linings. Can. Geotech. J. 1977, 14, 91–106. [Google Scholar] [CrossRef]
  11. Cheng, Y.M.; Hu, Y.Y.; Wei, W.B. General axisymmetric active earth pressure by method of characteristics—Theory and numerical formulation. Int. J. Geomech. 2007, 7, 1–15. [Google Scholar] [CrossRef]
  12. Xiong, G.J.; Wang, J.H.; Chen, J.J. Theory and practical calculation method foraxisymmetric active earth pressure based on the characteristics methodconsidering the compatibility condition. Appl. Math. Model. 2019, 68, 563–582. [Google Scholar] [CrossRef]
  13. Guojun, X.; Jianhua, W. A rigorous characteristic line theory for axisymmetric problems and its application in circular excavations. Acta. Geotech. 2020, 15, 439–453. [Google Scholar] [CrossRef]
  14. Tangjarusritaratorn, T.; Miyazaki, Y.; Sawamura, Y.; Kishida, K.; Kimura, M. Numerical investigation on arching effect surrounding deep cylindrical shaft during excavation process. Undergr. Space. 2022, 7, 944–965. [Google Scholar] [CrossRef]
  15. Tran, V.D.H.; Meguid, M.A.; Chouinard, L.E. Discrete element and experimental investigations of the earth pressure distribution on cylindrical shafts. Int. J. Geomech. 2014, 14, 80–91. [Google Scholar] [CrossRef]
  16. Wang, X.; Xiao, J.; Zhang, T.; Lin, Y. Effect Analysis of supporting structure and surface settlement on deep foundation pit by rainstorm: A case study in Zhengzhou. Water 2022, 14, 3654. [Google Scholar] [CrossRef]
  17. Chehadeh, A.; Turan, A.; Abed, F. Numerical investigation of spatial aspects of soil structure interaction for secant pile wall circular shafts. Comput. Geotech. 2015, 69, 452–461. [Google Scholar] [CrossRef]
  18. Muramatsu, M.; Abe, Y. Considerations in Shaft Excavation and Peripheral Ground Deformation. In Geotechnical Aspects of Underground Construction in Soft Ground; ISSMGE: Rotterdam, The Netherlands, 1996. [Google Scholar]
  19. Aye, T.T.; Tong, M.S.Y.; Yi, K.H.; Arunasoruban, E. Design and Construction of Large Diameter Circular Shafts; Under Ground Singapore: Singapore, 2014. [Google Scholar]
  20. Tan, Y.; Lu, Y.; Xu, C.; Wang, D. Investigation on performance of a large circular pit-in-pit excavation in clay-gravel-cobble mixed strata. Tunn. Undergr. Space Techno l. 2018, 79, 356–374. [Google Scholar] [CrossRef]
  21. Tan, Y.; Wang, D. Characteristics of a large-scale deep foundation pit excavated by the central-island technique in shanghai soft clay. I: Bottom-up construction of the central cylindrical shaft. J. Geotech. Geoenviron. Eng. 2013, 139, 1875–1893. [Google Scholar] [CrossRef]
  22. Njemile, E.F.; Elshafie, M.Z.E.B.; Robert, J.M.; Gerard, Q. Discussion: Case studies of cylindrical shaft construction in London. Proc. Inst. Civ. Eng. Geotech. Eng. 2019, 173, 92. [Google Scholar]
  23. Qiao, Y.; Xie, F.; Bai, Z.; Lu, J.; Ding, W. Deformation characteristics of ultra-deep cylindrical shaft in soft soil: A case study. Undergr. Space 2024, 16, 239–260. [Google Scholar] [CrossRef]
  24. Gao, X.; Tian, W.; Zhang, Z. Analysis of deformation characteristics of foundation-pit excavation and cylindrical wall. Sustainability 2020, 12, 3164. [Google Scholar] [CrossRef]
  25. Ren, B.; Zhu, H.; Shen, Y.; Zhou, X.; Zhao, T. Deformation monitoring of ultra-deep foundation excavation using distributed fiber optic sensors. IOP Conf. Ser. Earth Environ. Sci. 2021, 861, 072057. [Google Scholar] [CrossRef]
  26. Ren, B.; Shen, Y.; Zhao, T.; Li, X. Deformation monitoring and remote analysis of ultra-deep underground space excavation. Undergr. Space 2023, 8, 30–44. [Google Scholar] [CrossRef]
  27. Wu, Y.-X.; Shen, S.-L.; Yuan, D.J. Characteristics of dewatering induced drawdown curve under blocking effect of retaining wall in aquifer. J. Hydrol. 2016, 539, 554–566. [Google Scholar] [CrossRef]
  28. Zhao, G.-Q.; Yang, Y.-Y.; Meng, S.-Y. Failure of circular shaft subjected to hydraulic uplift: Field and numerical investigation. J. Cent. South Univ. 2020, 27, 256–266. [Google Scholar] [CrossRef]
  29. Liao, S.; Wei, S.; Tan, Y.; Liu, J. Field performance of large-scale deep excavations in Suzhou. Chin. J. Geotech. Eng. 2015, 37, 458–469. (In Chinese) [Google Scholar]
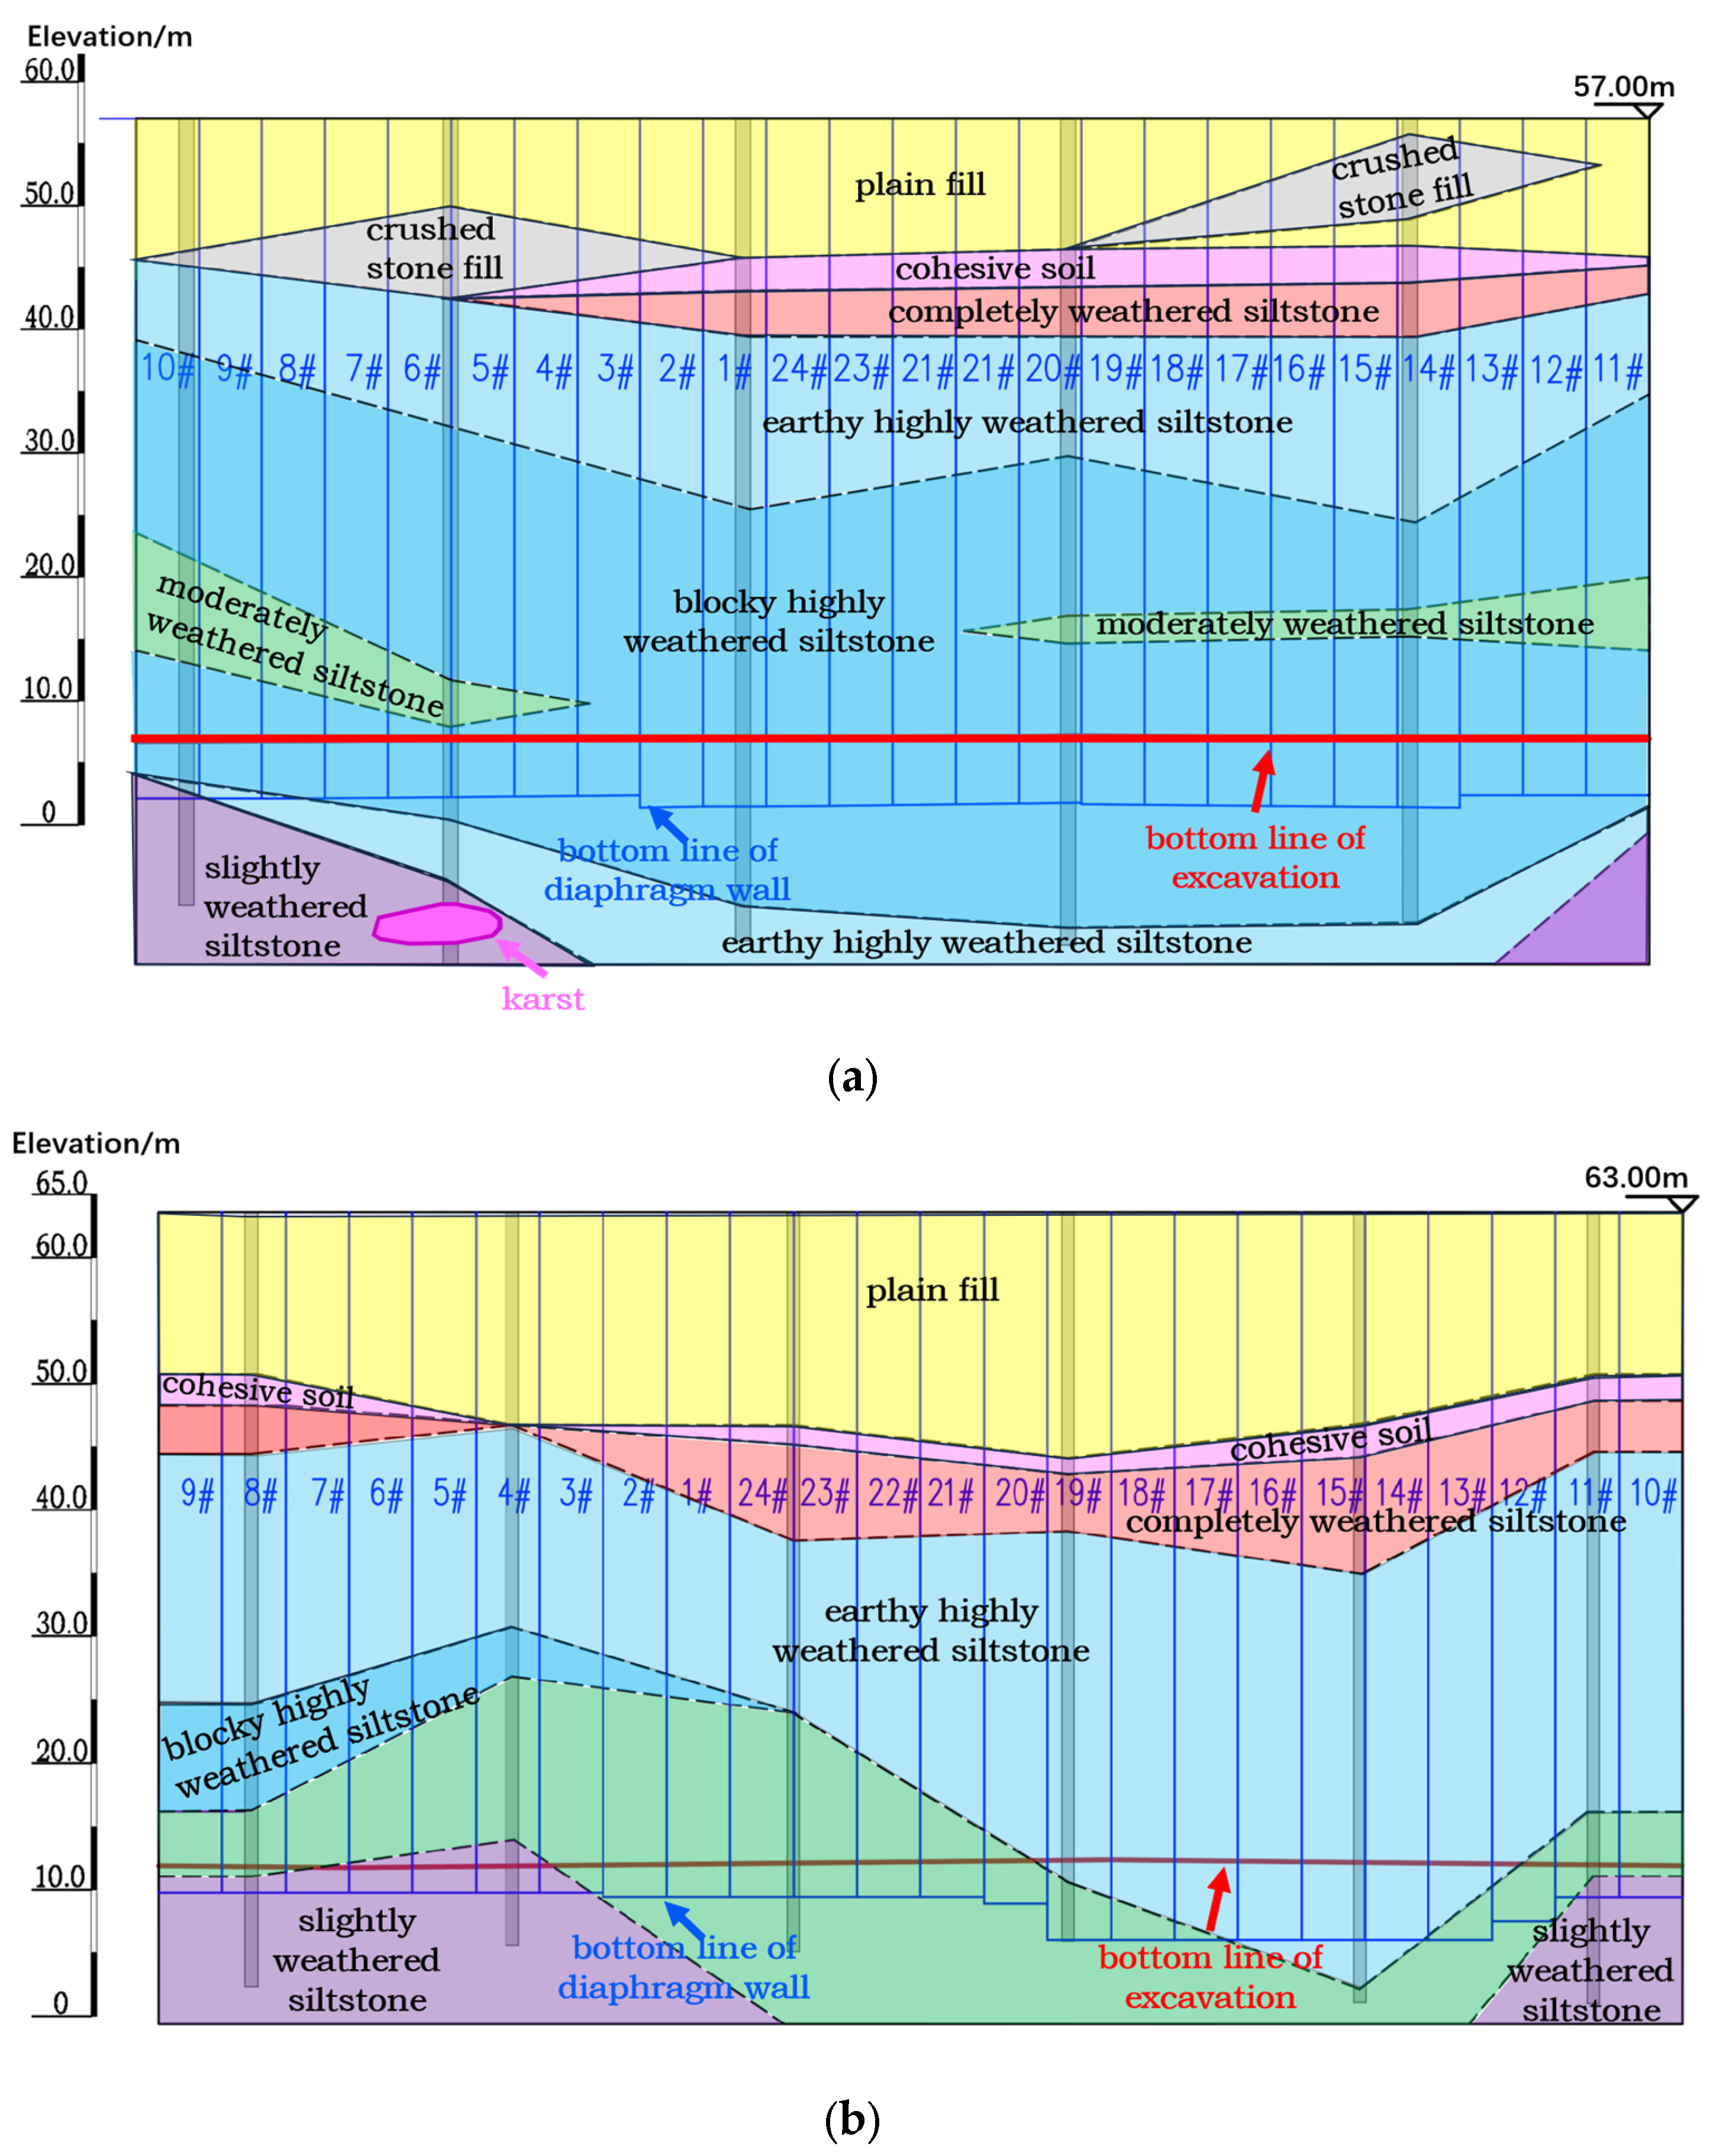
Figure 1. Vertical layout of retaining structures. (a) Shaft No.1; (b) Shaft No.2.
Sustainability 17 06223 g001
Figure 2. Plan view and cross-sectional schematic of foundation pit retaining structure. (a) Plan view of foundation pit retaining structure. (b) Cross-sectional schematic of foundation pit retaining structure.
Sustainability 17 06223 g002
Figure 3. Plan layout and sectional schematic of measurement points.
Sustainability 17 06223 g003
Figure 4. Horizontal displacement distribution of diaphragm walls. (a) Time-history curves of horizontal deformations at inclinometer points in Shaft No. 1 (1B-01-1B-06); (b) time-history curves of horizontal deformations at inclinometer points in Shaft No. 2 (2B-01-2B-06).
Sustainability 17 06223 g004
Figure 5. Sectional horizontal deformations of Shaft No. 1 retaining structures under various excavation stages (unit: mm).
Sustainability 17 06223 g005
Figure 6. Sectional horizontal deformations of Shaft No. 2 retaining structures under various excavation stages (unit: mm).
Sustainability 17 06223 g006
Figure 7. Correlation between horizontal displacement and excavation depth.
Sustainability 17 06223 g007
Figure 8. Correlation between the depth of peak horizontal wall displacement and excavation depth.
Sustainability 17 06223 g008
Figure 9. Cumulative variation curves of extra-pit groundwater Levels. (a) Shaft No. 1; (b) Shaft No. 2.
Sustainability 17 06223 g009
Figure 10. Time-history of surface settlement and cumulative water-level fluctuations. (a) Shaft No. 1; (b) Shaft No. 2.
Sustainability 17 06223 g010
Figure 11. Development of surface settlement with excavation depth.
Sustainability 17 06223 g011
Figure 12. Settlement profiles of typical surface monitoring sections.
Sustainability 17 06223 g012
Figure 13. Cumulative vertical deformation curves of retaining walls. (a) Shaft No. 1; (b) Shaft No. 2.
Sustainability 17 06223 g013aSustainability 17 06223 g013b
Figure 14. Development of vertical wall displacement with excavation depth.
Sustainability 17 06223 g014
Figure 15. Schematic illustration of groundwater and soil particle flow mechanism.
Sustainability 17 06223 g015
Table 1. Construction sequences and timeline.
CodeExcavation StageCompletion Date
(Shaft No.1)
Completion Date
(Shaft No.2)
CodeExcavation StageCompletion Date
(Shaft No.1)
Completion Date
(Shaft No.2)
b1Construct crown beam10 May 202213 Apr 2022b7Construct inner lining 312 Aug 202221 Jul 2022
a2Second-layer earth excavation10 May 202222 Apr 2022a8Eighth-layer earth excavation16 Aug 202226 Jul 2022
b2Construct ring beam 104 Jun 202230 Apr 2022b8Construct inner lining 427 Aug 202203 Aug 2022
a3Third-layer earth excavation09 Jun 202206 May 2022a9Ninth-layer earth excavation01 Sep 202208 Aug 2022
b3Construct ring beam 219 Jun 202216 May 2022b9Construct inner lining 514 Sep 202206 Sep 2022
a4Fourth-layer earth excavation24 Jun 202220 May 2022a10Tenth-layer earth excavation19 Sep 202208 Sep 2022
b4Construct ring beam 330 Jun 202231 May 2022b10Construct inner lining 623 Sep 202221 Sep 2022
a5Fifth-layer earth excavation02 Jul 202209 Jun 2022a11Eleventh-layer earth excavation 19 Oct 202223 Sep 2022
b5Construct inner lining 117 Jul 202219 Jun 2022b11Construct inner lining 731 Oct 202202 Oct 2022
a6Sixth-layer earth excavation19 Jul 202227 Jun 2022a12Twelfth-layer earth excavation04 Nov 202205 Oct 2022
b6Construct inner lining 217 Jul 202207 Jul 2022b12Construct base plate27 Nov 202221 Oct 2022
a7Seventh-layer earth excavation03 Aug 202214 Jul 2022cConstruct main structure15 Jan 202327 Nov 2022
Table 2. Deployment of monitoring items.
Monitoring ItemsQuantityLocation of Measurement PointsMonitoring InstrumentsMonitoring Frequency
Inclinometry6 for eachLocated in the groove sections 3#, 8#, 11#, 15#, 18#, and 23# of the diaphragm wall
(The positions of groove sections 3#, 8#, 11#, 15#, 18#, and 23# are shown in Figure 2a)
Inclinometer
(Leica TCA1201+)
Once a day
Extra-Pit Groundwater Level4 for eachRespectively located along the outer edges of the north, south, east, and west side walls of the foundation pitWater Level Meter
Surface SettlementShaft No.16 × 8A total of 6 sections, each containing 8 measurement points. The intervals between measurement points are 3 m, 6 m, 8 m, 12 m, 20 m, 20 m, 20 m, and 20 m successivelyLevel Meter
(Trimble DiNi03)
Shaft No.26 × 5A total of 6 sections, each containing 5 measurement points. The intervals between measurement points are 8 m, 10 m, 16 m, 24 m, and 38 m successively
Vertical Displacement of the Retaining Wall6 for eachLocated in the groove sections 3#, 8#, 11#, 15#, 18#, and 23# of the diaphragm wallTotal Station
(Trimble DiNi03)
Disclaimer/Publisher’s Note: The statements, opinions and data contained in all publications are solely those of the individual author(s) and contributor(s) and not of MDPI and/or the editor(s). MDPI and/or the editor(s) disclaim responsibility for any injury to people or property resulting from any ideas, methods, instructions or products referred to in the content.