Does Industrial Robot Adoption Reduce Pollution Emission? Evidence from China

Abstract
1. Introduction
2. Related Work
2.1. Robot Applications and Green Performance
2.2. Robot Applications and Pollution Emissions
3. Theoretical Hypothesis
3.1. Consumer and Producer Decision-Making
3.2. Equilibrium Analysis
3.3. Research Hypotheses
3.3.1. Productivity Boost Effect
3.3.2. Technological Progress Effect
3.3.3. Emission Reduction Effect
4. Research Methods and Data
4.1. Model Design
4.2. Variable Description
4.3. Data Description
5. Analysis of Empirical Results
5.1. Baseline Regression Results
5.2. Endogeneity Test
5.3. Robustness Test
5.3.1. Change the Measurement Method for Industrial Robots
5.3.2. Change the Measurement Method of Pollutant Emissions
5.3.3. Replace the Sample
6. Heterogeneity Analysis
6.1. Quality of Regional Environmental Regulation Intensity
6.2. Heterogeneity in Pollution Levels
6.3. Heterogeneity of Property Rights
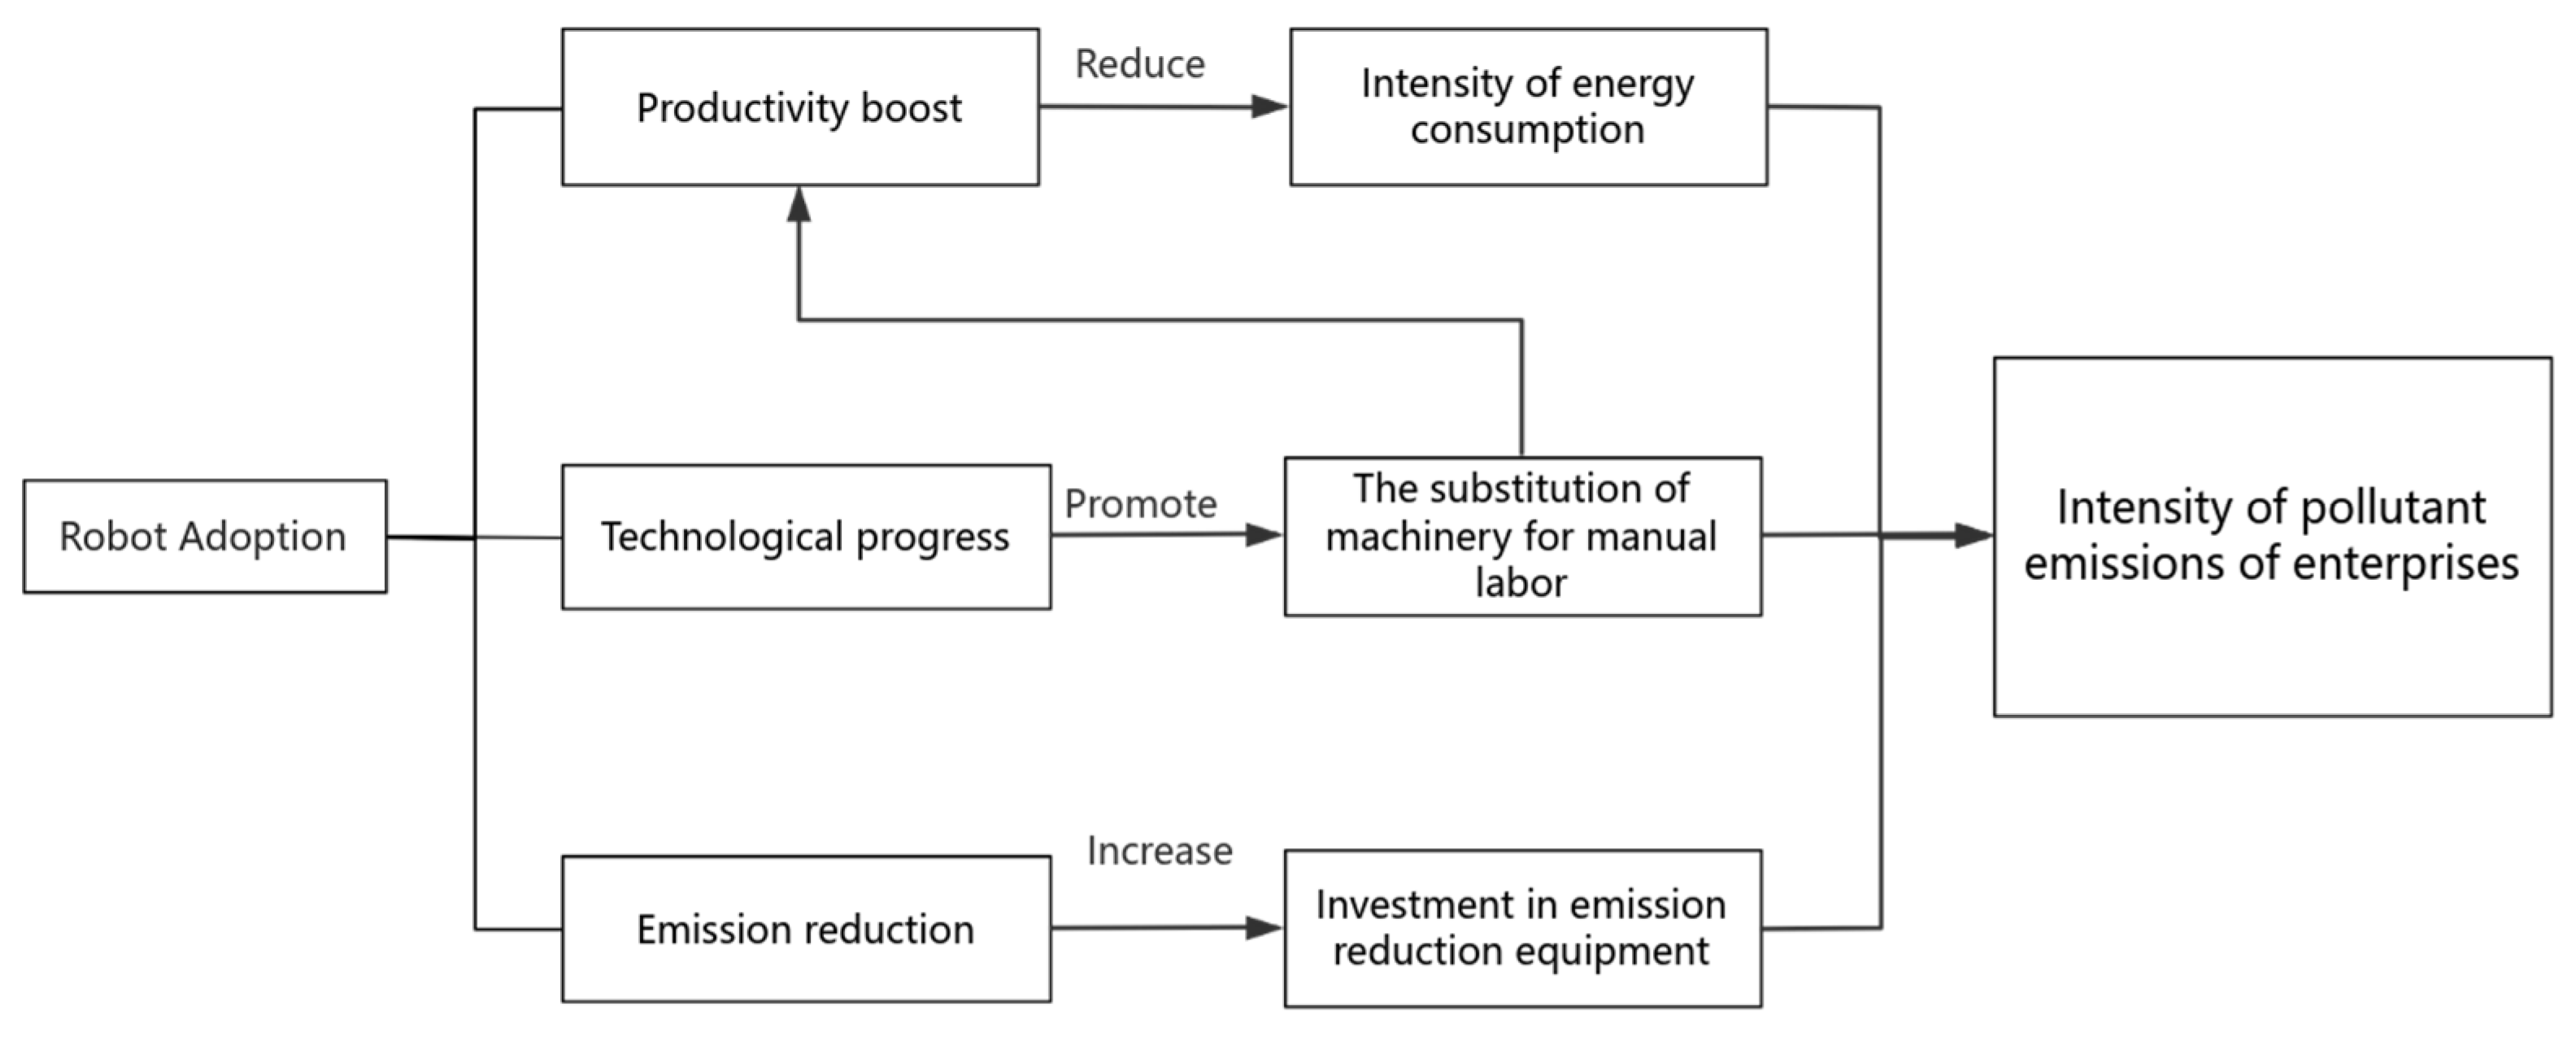
7. Impact Mechanism Testing
8. Result and Discussion
Author Contributions
Funding
Institutional Review Board Statement
Informed Consent Statement
Data Availability Statement
Conflicts of Interest
References
- Ali, K.; Jianguo, D.; Kirikkaleli, D. How do energy resources and financial development cause environmental sustainability? Energy Rep. 2023, 9, 4036–4048. [Google Scholar] [CrossRef]
- Guenat, S.; Purnell, P.; Davies, Z.G.; Nawrath, M.; Stringer, L.C.; Babu, G.R.; Balasubramanian, M.; Ballantyne, E.E.F.; Bylappa, B.K.; Chen, B.; et al. Meeting sustainable development goals via robotics and autonomous systems. Nat. Commun. 2022, 13, 3559. [Google Scholar] [CrossRef]
- Zhang, Y.; Lan, M.; Zhao, Y.; Su, Z.; Hao, Y.; Du, H. Regional carbon emission pressure and corporate green innovation. Appl. Energy 2024, 360, 122625. [Google Scholar] [CrossRef]
- Lockhart, A.; Marvin, S.; While, A. Towards new ecologies of automation: Robotics and the re-engineering of nature. Geoforum 2023, 145, 103825. [Google Scholar] [CrossRef]
- Dixon, J.; Hong, B.; Wu, L. The robot revolution: Managerial and employment consequences for firms. Manag. Sci. 2021, 67, 5586–5605. [Google Scholar] [CrossRef]
- Mai, V.; Vanderborght, B.; Haidegger, T.; Khamis, A.; Bhargava, N.; Boesl, D.B.O.; Gabriels, K.; Jacobs, A.; Moon, A.J.; Nakauchi, R.; et al. The role of robotics in achieving the United Nations sustainable development goals—The experts’ meeting at the 2021 IEEE/RSJ IROS workshop. IEEE Robot. Autom. Mag. 2022, 29, 92–107. [Google Scholar] [CrossRef]
- Lakshmi, V.; Bahli, B. Understanding the robotization landscape transformation: A centering resonance analysis. J. Innov. Knowl. 2020, 5, 59–67. [Google Scholar] [CrossRef]
- Song, J.; Chen, Y.; Luan, F. Air pollution, water pollution, and robots: Is technology the panacea. J. Environ. Manag. 2023, 330, 117170. [Google Scholar] [CrossRef]
- Zhang, Q.; Zhang, F.; Mai, Q. Robot adoption and green productivity: Curse or Boon. Sustain. Prod. Consum. 2022, 34, 1–11. [Google Scholar] [CrossRef]
- Yu, L.; Wang, Y.; Wei, X.; Zeng, C. Towards low-carbon development: The role of industrial robots in decarbonization in Chinese cities. J. Environ. Manag. 2023, 330, 117216. [Google Scholar] [CrossRef]
- Zhou, W.; Zhuang, Y.; Chen, Y. How does artificial intelligence affect pollutant emissions by improving energy efficiency and developing green technology. Energy Econ. 2024, 131, 107355. [Google Scholar] [CrossRef]
- Li, Y.; Zhang, Y.; Pan, A.; Han, M.; Veglianti, E. Carbon emission reduction effects of industrial robot applications: Heterogeneity characteristics and influencing mechanisms. Technol. Soc. 2022, 70, 102034. [Google Scholar] [CrossRef]
- Lee, C.C.; Qin, S.; Li, Y. Does industrial robot application promote green technology innovation in the manufacturing industry? Technol. Forecast. Soc. Change 2022, 183, 121893. [Google Scholar] [CrossRef]
- Cheng, K.; Jin, Z.; Wu, G. Unveiling the role of artificial intelligence in influencing enterprise environmental performance: Evidence from China. J. Clean. Prod. 2024, 440, 140934. [Google Scholar] [CrossRef]
- Luan, F.; Yang, X.; Chen, Y.; Regis, P.J. Industrial robots and air environment: A moderated mediation model of population density and energy consumption. Sustain. Prod. Consum. 2022, 30, 870–888. [Google Scholar] [CrossRef]
- Yang, X.; Luan, F.; Zhang, J.; Zhang, Z. Testing for quadratic impact of industrial robots on environmental performance and reaction to green technology and environmental cost. Environ. Sci. Pollut. Res. 2023, 30, 92782–92800. [Google Scholar] [CrossRef]
- Acemoglu, D.; Restrepo, P. Robots and jobs: Evidence from US labor markets. J. Political Econ. 2020, 128, 2188–2244. [Google Scholar] [CrossRef]
- Qian, Y.; Liu, J.; Shi, L.; Forrest, J.Y.L.; Yang, Z. Can artificial intelligence improve green economic growth? Evidence from China. Environ. Sci. Pollut. Res. 2023, 30, 16418–16437. [Google Scholar] [CrossRef]
- Rong, J.; Wang, W.; Zhang, H. Does artificial intelligence improve energy productivity in China’s industrial sector? Empirical evidence based on the spatial moderation model. Energy Environ. 2024, 35, 4026–4048. [Google Scholar] [CrossRef]
- Yin, Z.H.; Zeng, W.P. The effects of industrial intelligence on China’s energy intensity: The role of technology absorptive capacity. Technol. Forecast. Soc. Change 2023, 191, 122506. [Google Scholar] [CrossRef]
- Zhao, P.; Gao, Y.; Sun, X. How does artificial intelligence affect green economic growth?—Evidence from China. Sci. Total Environ. 2022, 834, 155306. [Google Scholar] [CrossRef]
- Gan, J.; Liu, L.; Qiao, G.; Zhang, Q. The role of robot adoption in green innovation: Evidence from China. Econ. Model. 2023, 119, 106128. [Google Scholar] [CrossRef]
- Liu, J.; Qian, Y.; Yang, Y.; Yang, Z. Can artificial intelligence improve the energy efficiency of manufacturing companies? Evidence from China. Int. J. Environ. Res. Public Health 2022, 19, 2091. [Google Scholar] [CrossRef] [PubMed]
- Yu, L.; Zeng, C.; Wei, X. The impact of industrial robots’ application on air pollution in China: Mechanisms of energy use efficiency and green technological innovation. Sci. Prog. 2022, 105, 00368504221144093. [Google Scholar] [CrossRef] [PubMed]
- Xu, R.; Zhang, H.; Han, M.; Yang, L.Y. Robot adoption and corporate pollution emissions: Evidence from China. Pac. -Basin Financ. J. 2025, 90, 102647. [Google Scholar] [CrossRef]
- Zi, S.; Pan, Z.; Chen, Y.; Liu, X.; Ban, Q. Intelligent Manufacturing and Pollution Emissions from Chinese Manufacturing Firms: Theories and Mechanisms. Sustainability 2025, 17, 773. [Google Scholar] [CrossRef]
- Acemoglu, D.; Restrepo, P. The race between man and machine: Implications of technology for growth, factor shares, and employment. Am. Econ. Rev. 2018, 108, 1488–1542. [Google Scholar] [CrossRef]
- Huang, G.; He, L.Y.; Lin, X. Robot adoption and energy performance: Evidence from Chinese industrial firms. Energy Econ. 2022, 107, 105837. [Google Scholar] [CrossRef]
- Zhu, H.; Sang, B.; Zhang, C.; Guo, L. Have industrial robots improved pollution reduction? A theoretical approach and empirical analysis. China World Econ. 2023, 31, 153–172. [Google Scholar] [CrossRef]
- Shapiro, J.S.; Walker, R. Why is pollution from US manufacturing declining? The roles of environmental regulation, productivity, and trade. Am. Econ. Rev. 2018, 108, 3814–3854. [Google Scholar] [CrossRef]
- Fan, H.; Hu, Y.; Tang, L. Labor costs and the adoption of robots in China. J. Econ. Behav. Organ. 2021, 186, 608–631. [Google Scholar] [CrossRef]
- Lin, X.; Liu, Q.; Feng, G. Smart Manufacturing and Green Development: From the Perspective of Industrial Robot Imports. World Econ. 2023, 46, 3–31. [Google Scholar]
- Forslid, R.; Okubo, T.; Ulltveit-Moe, K.H. Why are firms that export cleaner? International trade, abatement and environmental emissions. J. Environ. Econ. Manag. 2018, 91, 166–183. [Google Scholar] [CrossRef]
- Ma, S.; Wei, W.; Li, J. Has the digital economy improved the ecological environment? Empirical evidence from China. Environ. Sci. Pollut. 2023, 30, 91887–91901. [Google Scholar] [CrossRef]
- Zhu, Z.; Song, T.; Huang, J. Executive Cognitive Structure, Digital Policy, and Firms’ Digital Transformation. IEEE Trans. Eng. Manag. 2022, 71, 2579–2592. [Google Scholar] [CrossRef]
- Wang, Y.; Dong, W. How is the rise of robots affecting China’s labor market?—Evidence from listed manufacturing companies. Econ. Res. 2020, 55, 159–175. [Google Scholar]
- Acemoglu, D.; Restrepo, P. Automation and new tasks: How technology displaces and reinstates labor. J. Econ. Perspect. 2019, 33, 3–30. [Google Scholar] [CrossRef]
- Fang, X.; Liu, M. How does the digital transformation drive digital technology innovation of enterprises? Evidence from enterprise’s digital patents. Technol. Forecast. Soc. Change 2024, 204, 123428. [Google Scholar] [CrossRef]

| Variable Type | Symbols | Variable Description |
|---|---|---|
| Explained variable | Poll_inten | Enterprise pollutant intensity, total enterprise pollutant emissions/total enterprise assets × 10,000 |
| Explanatory variables | Robot | Robot applications, ln (enterprise robot stock +1) |
| Control variables | Age | Enterprise age, ln (enterprise age +1) |
| Lev | Debt-to-asset ratio, total liabilities/total assets of the enterprise | |
| ROE | Return on equity, net profit/net assets | |
| Cashflow | Operating cash flow, net cash flow/total assets | |
| Growth | Sales growth rate, (current year’s main business income—last year’s main business income)/last year’s main business income | |
| Board | Board size, ln (number of board members) | |
| Indep | Proportion of independent directors, number of independent directors/numbers of board members | |
| Top1 | Shareholding ratio of the largest shareholder | |
| Dual | The value for chairman and general manager is 1, otherwise 0 | |
| SOE | Property nature: 0 for state-owned enterprises and 1 for private enterprises |
| Variables | N | Mean | S.D. | Min | Max |
|---|---|---|---|---|---|
| Robot | 29,175 | 0.1879 | 1.1711 | −1.1877 | 138.5898 |
| SO2 | 29,175 | 0.2763 | 1.7565 | −1.8696 | 206.9020 |
| NOX | 29,175 | 0.0617 | 0.3137 | −0.6431 | 27.3745 |
| COD | 29,175 | 0.1614 | 0.8665 | −1.3429 | 93.9752 |
| NH | 31,484 | 0.4596 | 0.2295 | 0.0579 | 0.9840 |
| Lev | 31,483 | 0.0461 | 0.0711 | −0.2628 | 0.2332 |
| ROA | 31,442 | 0.0714 | 0.1434 | −0.7201 | 0.3863 |
| ROE | 31,484 | 0.0497 | 0.0771 | −0.1994 | 0.2728 |
| Cashflow | 29,561 | 0.1803 | 0.4686 | −0.6711 | 3.0180 |
| Growth | 31,473 | 2.3386 | 0.2181 | 1.7703 | 2.9789 |
| Board | 31,473 | 0.4131 | 0.0594 | 0.2000 | 0.6285 |
| Indep | 31,109 | 0.3177 | 0.4985 | 0.0000 | 1.0000 |
| Dual | 31,461 | 0.3643 | 0.5178 | 0.0000 | 1.0000 |
| SOE | 31,484 | 3.1405 | 0.3873 | 1.5249 | 3.8123 |
| Age | 31,484 | 0.3792 | 0.1630 | 0.0990 | 0.8203 |
| Top1 | 31,484 | 1.1061 | 1.1895 | 0.1029 | 6.6219 |
| Variables | Air Pollutant Emission Intensity | Water Pollutant Emission Intensity | ||
|---|---|---|---|---|
| SO2 | NOX | COD | NH | |
| (1) | (2) | (3) | (4) | |
| Robot | 0.3127 *** (0.0126) | 0.4553 *** (0.0184) | 0.1012 *** (0.0044) | 0.2671 *** (0.0107) |
| Lev | 0.0213 (0.0176) | 0.0296 (0.0253) | 0.0039 (0.0068) | 0.0172 (0.0147) |
| ROA | 0.1788 *** (0.0607) | 0.3146 *** (0.0872) | 0.0584 ** (0.0260) | 0.1792 *** (0.0510) |
| ROE | 0.0729 ** (0.0284) | 0.1335 *** (0.0406) | 0.0239 ** (0.0120) | 0.0767 *** (0.0233) |
| Cashflow | 0.0134 (0.0164) | 0.0301 (0.0239) | 0.0040 (0.0075) | 0.0110 (0.0138) |
| Growth | 0.0164 *** (0.0028) | 0.0239 *** (0.0043) | 0.0051 *** (0.0013) | 0.0139 *** (0.0024) |
| Board | −0.0038 (0.0114) | −0.0017 (0.0165) | −0.0040 (0.0053) | 0.0015 (0.0096) |
| Indep | 0.0341 (0.0315) | 0.0503 (0.0453) | −0.0023 (0.0143) | 0.0275 (0.0258) |
| Dual | 0.0015 (0.0034) | 0.0021 (0.0048) | 0.0013 (0.0015) | 0.0017 (0.0028) |
| SOE | 0.0121 (0.0104) | 0.0184 (0.0152) | 0.0055 (0.0038) | 0.0108 (0.0085) |
| Age | 0.0092 (0.0169) | 0.0108 (0.0244) | 0.0039 (0.0065) | 0.0042 (0.0143) |
| Top1 | 0.0415 * (0.0222) | 0.0469 (0.0321) | 0.0144 * (0.0081) | 0.0299 (0.0189) |
| Enterprise fixed effect | YES | YES | YES | YES |
| Industry-year fixed effect | YES | YES | YES | YES |
| Provincial-year fixed effect | YES | YES | YES | YES |
| Observations | 27,196 | 27,196 | 27,196 | 27,196 |
| R2 | 0.813 | 0.816 | 0.658 | 0.814 |
| Panel A | IV1 Regression | |||
| Air Pollutant Emission Intensity | Water Pollutant Emission Intensity | |||
| Variables | SO2 | NOX | COD | NH |
| (1) | (2) | (3) | (4) | |
| Robot | 0.2102 ** (0.0557) | 0.3198 *** (0.0793) | 0.0675 *** (0.0245) | 0.1883 *** (0.0458) |
| Observations | 26,757 | 26,757 | 26,757 | 26,757 |
| R2 | 0.380 | 0.391 | 0.179 | 0.384 |
| Panel B | IV2 Regression | |||
| Air Pollutant Emission Intensity | Water Pollutant Emission Intensity | |||
| Variables | SO2 | NOX | COD | NH |
| (5) | (6) | (7) | (8) | |
| Robot | 0.6141 ** (0.3029) | 0.6685 ** (0.2960) | 16.9129 ** (8.6771) | 0.3969 ** (0.1695) |
| Observations | 25,860 | 25,860 | 25,860 | 25,860 |
| R2 | −0.005 | 0.014 | −0.014 | 0.007 |
| Control variables | is | is | is | is |
| Enterprise fixed effect | is | is | is | is |
| Industry-year fixed effect | is | is | is | is |
| Province-year fixed effect | is | is | is | is |
| KP-LM | 318.23 | 323.41 | 387.26 | 441.57 |
| First stage F value | 90.26 | 90.26 | 90.26 | 90.26 |
| Variables | Air Pollutant Emission Intensity | Water Pollutant Emission Intensity | ||
|---|---|---|---|---|
| SO2 | NOX | COD | NH | |
| (1) | (2) | (3) | (4) | |
| Robot_Install | 0.0138 *** (0.0015) | 0.0206 *** (0.0021) | 0.0046 *** (0.0007) | 0.0124 *** (0.0012) |
| Control variables | is | is | is | is |
| Enterprise fixed effect | is | is | is | is |
| Industry-year fixed effect | is | is | is | is |
| Provincial—year fixed effect | is | is | is | is |
| Observations | 23,554 | 23,554 | 23,554 | 23,554 |
| R2 | 0.825 | 0.826 | 0.654 | 0.825 |
| Variables | EFF | EFF_Air | EFF_Water | EFF_Solid |
|---|---|---|---|---|
| (1) | (2) | (3) | (4) | |
| Robot | 1.0880 *** (0.1168) | 0.3708 *** (0.048) | 0.1567 *** (0.0188) | 0.3805 *** (0.0414) |
| Observation value | 20,840 | 20,840 | 20,840 | 20,840 |
| Control variables | YES | YES | YES | YES |
| Enterprise fixed effect | YES | YES | YES | YES |
| Industry-year fixed effect | YES | YES | YES | YES |
| Province—Year fixed effect | YES | YES | YES | YES |
| R2 | 0.379 | 0.374 | 0.338 | 0.367 |
| Panel A | Manufacturing Enterprises | |||
| Air Pollutant Emission Intensity | Water Pollutant Emission Intensity | |||
| SO2 | NOX | COD | NH | |
| (1) | (2) | (3) | (4) | |
| Robot | 0.2985 *** (0.0153) | 0.4375 *** (0.0224) | 0.0971 *** (0.0056) | 0.2574 *** (0.0130) |
| Observations | 18,316 | 18,316 | 18,316 | 18,316 |
| R2 | 0.811 | 0.813 | 0.631 | 0.811 |
| Panel B | Samples from 2006 to 2020 | |||
| SO2 | NOX | COD | NH | |
| (1) | (2) | (3) | (4) | |
| Robot | 0.2960 *** (0.0116) | 0.4325 *** (0.0168) | 0.096 *** (0.0038) | 0.2543 *** (0.0099) |
| Observations | 32,491 | 32,491 | 32,491 | 32,491 |
| R2 | 0.790 | 0.793 | 0.640 | 0.791 |
| Control variables | YES | YES | YES | YES |
| Enterprise fixed effect | YES | YES | YES | YES |
| Industry-year fixed effect | YES | YES | YES | YES |
| Provincial-year fixed effect | YES | YES | YES | YES |
| Panel A | SO2 | NOX | COD | NH |
| (1) | (2) | (3) | (4) | |
| Robot × Reg | 0.2241 *** (0.0139) | 0.3238 *** (0.0199) | 0.0714 *** (0.0046) | 0.1908 *** (0.0116) |
| Observations | 25,589 | 25,589 | 25,589 | 25,589 |
| R2 | 0.834 | 0.842 | 0.658 | 0.836 |
| Panel B | SO2 | NOX | COD | NH |
| (1) | (2) | (3) | (4) | |
| Robot × heavy | 0.0319 ** (0.0130) | 0.0413 ** (0.0173) | 0.0095 ** (0.0045) | 0.0286 ** (0.0112) |
| Observations | 23,589 | 23,589 | 23,589 | 23,589 |
| R2 | 0.835 | 0.842 | 0.659 | 0.838 |
| Panel C | SO2 | NOX | COD | NH |
| (1) | (2) | (3) | (4) | |
| Robot × Soe | 0.0146 *** (0.0054) | 0.0212 *** (0.0077) | 0.0035 * (0.0018) | 0.0117 *** (0.0045) |
| Observations | 23,422 | 23,422 | 23,422 | 23,422 |
| R2 | 0.869 | 0.873 | 0.709 | 0.871 |
| Control variables | YES | YES | YES | YES |
| Enterprise fixed effect | YES | YES | YES | YES |
| Industry-year fixed effect | YES | YES | YES | YES |
| Province-year fixed effect | YES | YES | YES | YES |
| Variables | Productivity Boost Effect | Technological Progress Effect | Emission Reduction Technology Effects | |||
|---|---|---|---|---|---|---|
| TFP_LP (1) | TFP_OP (2) | Enrgy_Coal (3) | Eergy_Gas (4) | Env_inv (5) | SO2_remove (6) | |
| Robot | 1.7552 *** (0.0134) | 1.5120 *** (0.0166) | 0.4937 *** (0.1051) | 0.8765 *** (0.1824) | 1.4909 ** (0.6160) | 0.7985 ** (0.3922) |
| Control variables | YES | YES | YES | YES | YES | YES |
| Enterprise fixed effect | YES | YES | YES | YES | YES | YES |
| Industry-year fixed effect | YES | YES | YES | YES | YES | YES |
| Provincial—year fixed effect | YES | YES | YES | YES | YES | YES |
| Observations | 26,605 | 26,605 | 26,605 | 26,605 | 26,605 | 26,605 |
| R2 | 0.899 | 0.887 | 0.301 | 0.304 | 0.809 | 0.880 |
Disclaimer/Publisher’s Note: The statements, opinions and data contained in all publications are solely those of the individual author(s) and contributor(s) and not of MDPI and/or the editor(s). MDPI and/or the editor(s) disclaim responsibility for any injury to people or property resulting from any ideas, methods, instructions or products referred to in the content. |
© 2025 by the authors. Licensee MDPI, Basel, Switzerland. This article is an open access article distributed under the terms and conditions of the Creative Commons Attribution (CC BY) license (https://creativecommons.org/licenses/by/4.0/).
Share and Cite
Chen, F.; Liu, W. Does Industrial Robot Adoption Reduce Pollution Emission? Evidence from China. Sustainability 2025, 17, 6202. https://doi.org/10.3390/su17136202
Chen F, Liu W. Does Industrial Robot Adoption Reduce Pollution Emission? Evidence from China. Sustainability. 2025; 17(13):6202. https://doi.org/10.3390/su17136202
Chicago/Turabian StyleChen, Fang, and Wenge Liu. 2025. "Does Industrial Robot Adoption Reduce Pollution Emission? Evidence from China" Sustainability 17, no. 13: 6202. https://doi.org/10.3390/su17136202
APA StyleChen, F., & Liu, W. (2025). Does Industrial Robot Adoption Reduce Pollution Emission? Evidence from China. Sustainability, 17(13), 6202. https://doi.org/10.3390/su17136202