Article

Analysis of Ecosystem Pattern Evolution and Driving Forces in the Qin River Basin in the Middle Reaches of the Yellow River

1
School of Engineering and Technology, China University of Geosciences, Beijing 100083, China
2
Langfang Integrated Natural Resources Survey Center, China Geological Survey, Langfang 065000, China
3
Hebei Center for Ecological and Environmental Geology Research, Hebei GEO University, Shijiazhuang 050031, China
4
Department of Geological Engineering and Geomatics, Chang’an University, Xi’an 710054, China
5
Center for Hydrogeology and Environmental Geology, China Geological Survey, Tianjin 300304, China
6
Key Laboratory of Coupling Process and Effect of Natural Resources Elements, Beijing 100055, China
*
Authors to whom correspondence should be addressed.
Sustainability 2025, 17(13), 6199; https://doi.org/10.3390/su17136199
Submission received: 13 May 2025 / Revised: 20 June 2025 / Accepted: 1 July 2025 / Published: 7 July 2025

Abstract

As an ecological transition zone, the ecosystem of the Qin River Basin in the middle reaches of the Yellow River is of great significance to the regional ecological balance. With the rapid socio-economic development, land use changes are significant, and the spatial and temporal patterns of ecosystems are evolving. Exploring its dynamics and driving mechanisms is crucial to the ecological protection and sustainable development of watersheds. This research systematically examines the spatiotemporal dynamics and driving mechanisms of ecosystem patterns in the middle Yellow River’s Qin River Basin (1990–2020). Quantitative assessments integrating ecosystem transition metrics and redundancy analysis reveal three critical insights: (1) dominance of agricultural land and woodland (74.81% combined coverage), with grassland (18.58%) and other land types (6.61%) constituting secondary components; (2) dynamic interconversion between woodland and grassland accompanied by urban encroachment on agricultural land, manifesting as net reductions in woodland (−13.74%), farmland (−6.60%), and wetland (−38.64%) contrasting with grassland (+43.34%) and built-up area (+116.63%) expansion; (3) quantified anthropogenic drivers showing agricultural intensification (45.03%) and ecological protection measures (36.50%) as primary forces, while urbanization account for 18.47% of observed changes. The first two RDA ordination axes significantly (p < 0.01) explain 68.3% of the variance in ecosystem evolution, particularly linking land-use changes to socioeconomic indicators. Based on these findings, the study proposes integrated watershed management strategies emphasizing scientific land-use optimization, controlled urban expansion, and systematic ecological rehabilitation to enhance landscape stability in this ecologically sensitive region. The conclusions of this study have important reference value for other ecologically sensitive watersheds in land use planning, ecological protection policy making, and ecological restoration practice, which can provide a theoretical basis and practical guidance.

1. Introduction

Ecological geology is a field that encompasses the study of the interactions between geological processes and ecosystems [1]. Previous research has shown that during the Neogene period, there was a significant faunal turnover due to accelerated rates of extinction and origination, with colony size being strongly related to these rates [2,3,4,5]. Additionally, landscape indicators such as mining intensity have been used to assess ecological impairment in watersheds, with evidence of threshold effects on benthic macroinvertebrate communities [6,7,8,9,10]. The development and categorization of ecological geology have been topics of interest, with discussions on the conceptual framework and terminological structure of the field [11,12,13]. Some scholars have explored the status, tasks, and problems of further developing ecological geology [14]. The influence of soil dynamics research at the Department of Engineering Geology has also been highlighted [15,16,17]. Recent studies have focused on geochemical processes from weathering rocks to soils, providing insights into the geological genesis of ecological issues in China, such as land salinization, desertification, and Karst rocky desertification [18,19,20,21,22,23]. Overall, ecological geology plays a crucial role in understanding the complex interactions between geological processes and ecosystems, with ongoing research aimed at addressing current environmental challenges [24,25,26].
The evolution of ecosystem patterns is influenced by natural conditions and human social activities. Studying the evolution of regional ecosystem patterns is an important basis for understanding the relationship between ecological environment change and human activities [27,28,29].
Cheng Min et al. [30] studied the spatial changes of ecosystems in the Bohai Coastal Zone through landscape area change, attitude of movement, change index, and landscape type transfer matrix; Liao Zhihong et al. [31] analyzed the assessment of ecosystem drivers in the Northeastern Forest Belt. Ma Guoqiang et al. [32] studied the evolution of the landscape pattern of the Yilong Lake Basin and its drivers, and explored the relationship between land use types, distribution, and spatial pattern change characteristics in relation to local socio-economic development and disturbance of natural factors. They also suggested that reducing the excessive impacts of human activities on the watershed ecosystem is a key factor for the localized protection of wetland resources and maintenance of wetland ecological functions. Gao Zuqiao et al. [33] quantitatively analyzed the landscape pattern evolution characteristics and driving forces of wetlands in the Yellow River urban belt of Ningxia from 2000 to 2018 using landscape indices and geoprobes. Paulina Guarderas et al. [34] analyzed land use and land cover change in a tropical mountain landscape in northern Ecuador. They utilize the Driver-Pressure-State-Impact-Response (DPSIR) framework and Markov chain probabilities to characterize land use–land cover (LULC) dynamics based on elevation and geography. Peng Jian et al. [35] used multivariate logistic regression to analyze the characteristics of ecological land dynamics in Shenzhen City, quantified the driving factors, and mapped the probability of ecological land transfer. This study describes the characteristics of urban ecological land changes due to rapid urbanization. It can be used as a decision-making basis for constructing the ecological security pattern of the urban landscape. Sun Menghua et al. [36] used spatial analysis and geoprobe techniques to study the spatial and temporal variation characteristics of land use and ecosystem service value (ESV) and their spatial variation drivers in Shaanxi, Gansu, and Ningxia regions of the Yellow River Basin. The results showed that NDVI was the dominant factor affecting spatial variability, while temperature and farmers’ per capita net income were important factors affecting spatial variability. Su kai et al. [37] used GIS (ArcGIS 10.8 (Environmental Systems Research Institute, Redlands, CA, USA)) spatial analysis techniques to analyze the characteristics of changes in ecosystem patterns, quality, and dominant services in the ecological barrier area of the Loess Plateau from 2005 to 2015. They used Pearson correlation analysis and redundancy to analyze the soil conservation function in the region mainly affected by climate change, economic development, and urban construction. Yang Lei et al. [38] analyzed the spatial and temporal changes of land use and ecosystem service value (ESV) in the urban agglomeration of central Yunnan using the equivalent factor method and hot spot analysis. They studied the effect of land use change on ESV and concluded that land use intensity, normalized vegetation index (NDVI), slope, and population density are the key factors affecting the change of ESV in the study area. Pan Zhenzhen et al. [39] took the vulnerability of ecosystems in the Yangtze River Basin from 1990 to 2018 as the research object, established a habitat–structure–function framework, and analyzed the spatial heterogeneity of the influence of factors on the change of ecosystem vulnerability by using geographically weighted regression models. Zhou Lulu et al. [40] explored the spatio-temporal evolutionary pattern of the factors influencing rural structural adjustment in rural Chongqing, a hilly mountainous area, during 2000–2018, from the perspectives of exogenous and endogenous drivers using the entropy method, spatial econometric modeling, and GTWR modeling. Shao Ming et al. [41] quantified the spatial patterns of the value of multiple ecosystem services in urban agglomerations from 2000 to 2015 using 12 national-level urban agglomerations as examples, and analyzed the impacts of natural and socioeconomic factors on these changes using ordinary least squares (OLS) and geographically weighted regression (GWR). Zhang Meng et al. [42] applied NTL and MODIS NDVI to construct the Normalized Impervious Surface Index (NISI) to study the urbanization process in the Yangtze River Delta region, and used geo-probes to combine anthropogenic and natural factors to investigate its driving mechanism. Yang Liangyan et al. [43] investigated the spatial and temporal characteristics of land use and land use change in the Maowusu Sandland from 1980 to 2018 using the land use transition matrix and change trajectory analysis. He Chengjin et al. [44] quantified the spatial and temporal changes in the ecological value of land in Sichuan Province using land-use data from 2000, 2005, 2010, 2015, and 2020. They used correlation coefficients and binary spatial autocorrelation methods to analyze the trade-offs and synergistic effects of ecosystem service values at city (autonomous prefecture) and grid scales. They also explored the synergistic effects between nine factors and ecosystem service values using geodetector modeling (GDM). Wang Zhichun et al. [45] studied the spatial and temporal evolution of the landscape pattern of four key wetlands in the Xiliao River Basin based on Landsat remote sensing images from 1985 and 2015 using 3S technology and landscape ecology index. Zhang Xinyu et al. [46] explored the landscape pattern of Midwood County and its impact on ecological values from 2005 to 2018 based on remote sensing imagery and socioeconomic data. Li Zhen et al. [47] investigated the spatial and temporal change characteristics of wetlands in the Sanjiang Plain based on Landsat images from 1980 to 2016 using land use dynamics and landscape indices in 1980, 1995, 2000, 2005, 2010, and 2016. They used the boosting regression trees (BRTs) method to analyze the drivers of wetland loss from three aspects: biophysical factors, socioeconomic factors, and land management factors.
The Qin River Basin covers a wide range of topographical features such as mountains, hills, and plains. It contains different ecosystem types such as forest, farmland, grassland, and wetland. Its socio-economic development pattern and ecological problems are highly representative. The ecological changes in the basin not only directly affect the production and life of local residents but also have great significance to the ecological security and sustainable development of the whole middle reaches of the Yellow River and even the Yellow River basin. At present, domestic and foreign scholars lack specialized research on the Qin River Basin in the middle reaches of the Yellow River based on the perspective of ecosystem integrity. Therefore, quantitatively grasping the ecosystem condition and spatial and temporal change characteristics of the middle reaches of the Yellow River in the Qin River Basin, analyzing the driving factors affecting the evolution of the ecosystem pattern, and identifying the existing problems and proposing targeted measures will have a positive effect on the promotion of the ecological protection and high-quality development of the Yellow River Basin. In this paper, we selected four years, 1990, 2000, 2010, and 2020, to analyze the ecosystem composition, change characteristics, and pattern evolution of the Qin River Basin as a whole, and to analyze and discriminate the driving factors affecting the evolution of the ecosystem pattern. In order to be able to address the impacts of urbanization, agricultural development, and ecological protection on the evolution of regional ecosystem patterns. It provides a scientific basis for the ecological protection and high-quality development of the Yellow River Basin.

2. Materials and Methods

2.1. Study Area

Qin River is located in the middle reaches of the Yellow River, originating in Qinyuan County, Changzhi City, and flows from north to south through Changzhi, Linfen, Jincheng City, and enters Henan Province in Yangcheng County, Jincheng City. The watershed is relatively rich in aquatic life and contains mineral resources such as coal, gas beds, ferromanganese ore, and ferroaluminum ore. The total area of the river basin is 13,532 km2, and the total length of the main stream is 485 km, of which 12,264 km2 is in Shanxi, and the length of the main stream is 363 km. The terrain is high in the north and low in the south, with the upper reaches mainly in stony mountainous areas, and the central part is mostly in the soil and rocky hilly areas. The land on both sides of the river valley is fertile, which is the main agricultural area (Figure 1). The basin has a continental monsoon climate with four distinct seasons. The average multi-year precipitation is between 660 and 650 mm, mostly in the form of heavy rainfall in July and August. Water surface evaporation is about 1000 mm. The basin is located on the eastern flank of the Loess Plateau in western North China, and the landscape in general is a mountainous plateau extensively covered by loess. The types of landforms are complex and varied, including mountains, hills, plateaus, basins, and tablelands. Most of the area is above 1000 m above sea level, and the terrain has significant ups and downs. In the area of mountains and hills, rolling hills, gullies, and ravines, the area has a “multi”-shaped fracture basin. The stratigraphy in the area mainly consists of the Ordovician Middle Fengfeng Formation, the Carboniferous Middle Benxi Formation and Taiyuan Formation, the Permian Lower Shanxi Formation, the Lower Stone Box Formation, and the Upper Stone Box Formation. The overall tectonic form of the Neoproterozoic Pliocene, Quaternary Middle Pleistocene, Upper Pleistocene, and Holocene is basically oblique tectonics with a high level in the southeast and west, and a low level in the north and central parts of the city. In between, there are high and low undulating radial fold groups, and the folds are generally more open. Because of the influence of the Yanshan period tectonics and the later Himalayan period activities, the area contains the extension of large-scale fracture zones, such as the Jinhuo fold fault zone, Sitou fault, Yangquan fault, etc. This led to the derivation of a series of smaller constructions, all influenced by the main construction.

2.2. Data Sources and Processing

The data are provided by Geospatial Data Cloud (http://www.gscloud.cn/) with Landsat TM5, ETM+, and OLI data from 1990 to 2020 in 10-year phases, with a total of 4 phases of remote sensing data (Table 1). The 2010–2020 data use Globe Land 30 data, TM5, ETM+, OLI multispectral images, and China Environmental Disaster Reduction Satellite (HJ-1) multispectral images, and the 2020 version of the data also uses 16-m resolution Gaofen-1 (GF-1) multispectral images.

2.3. Research Methodology

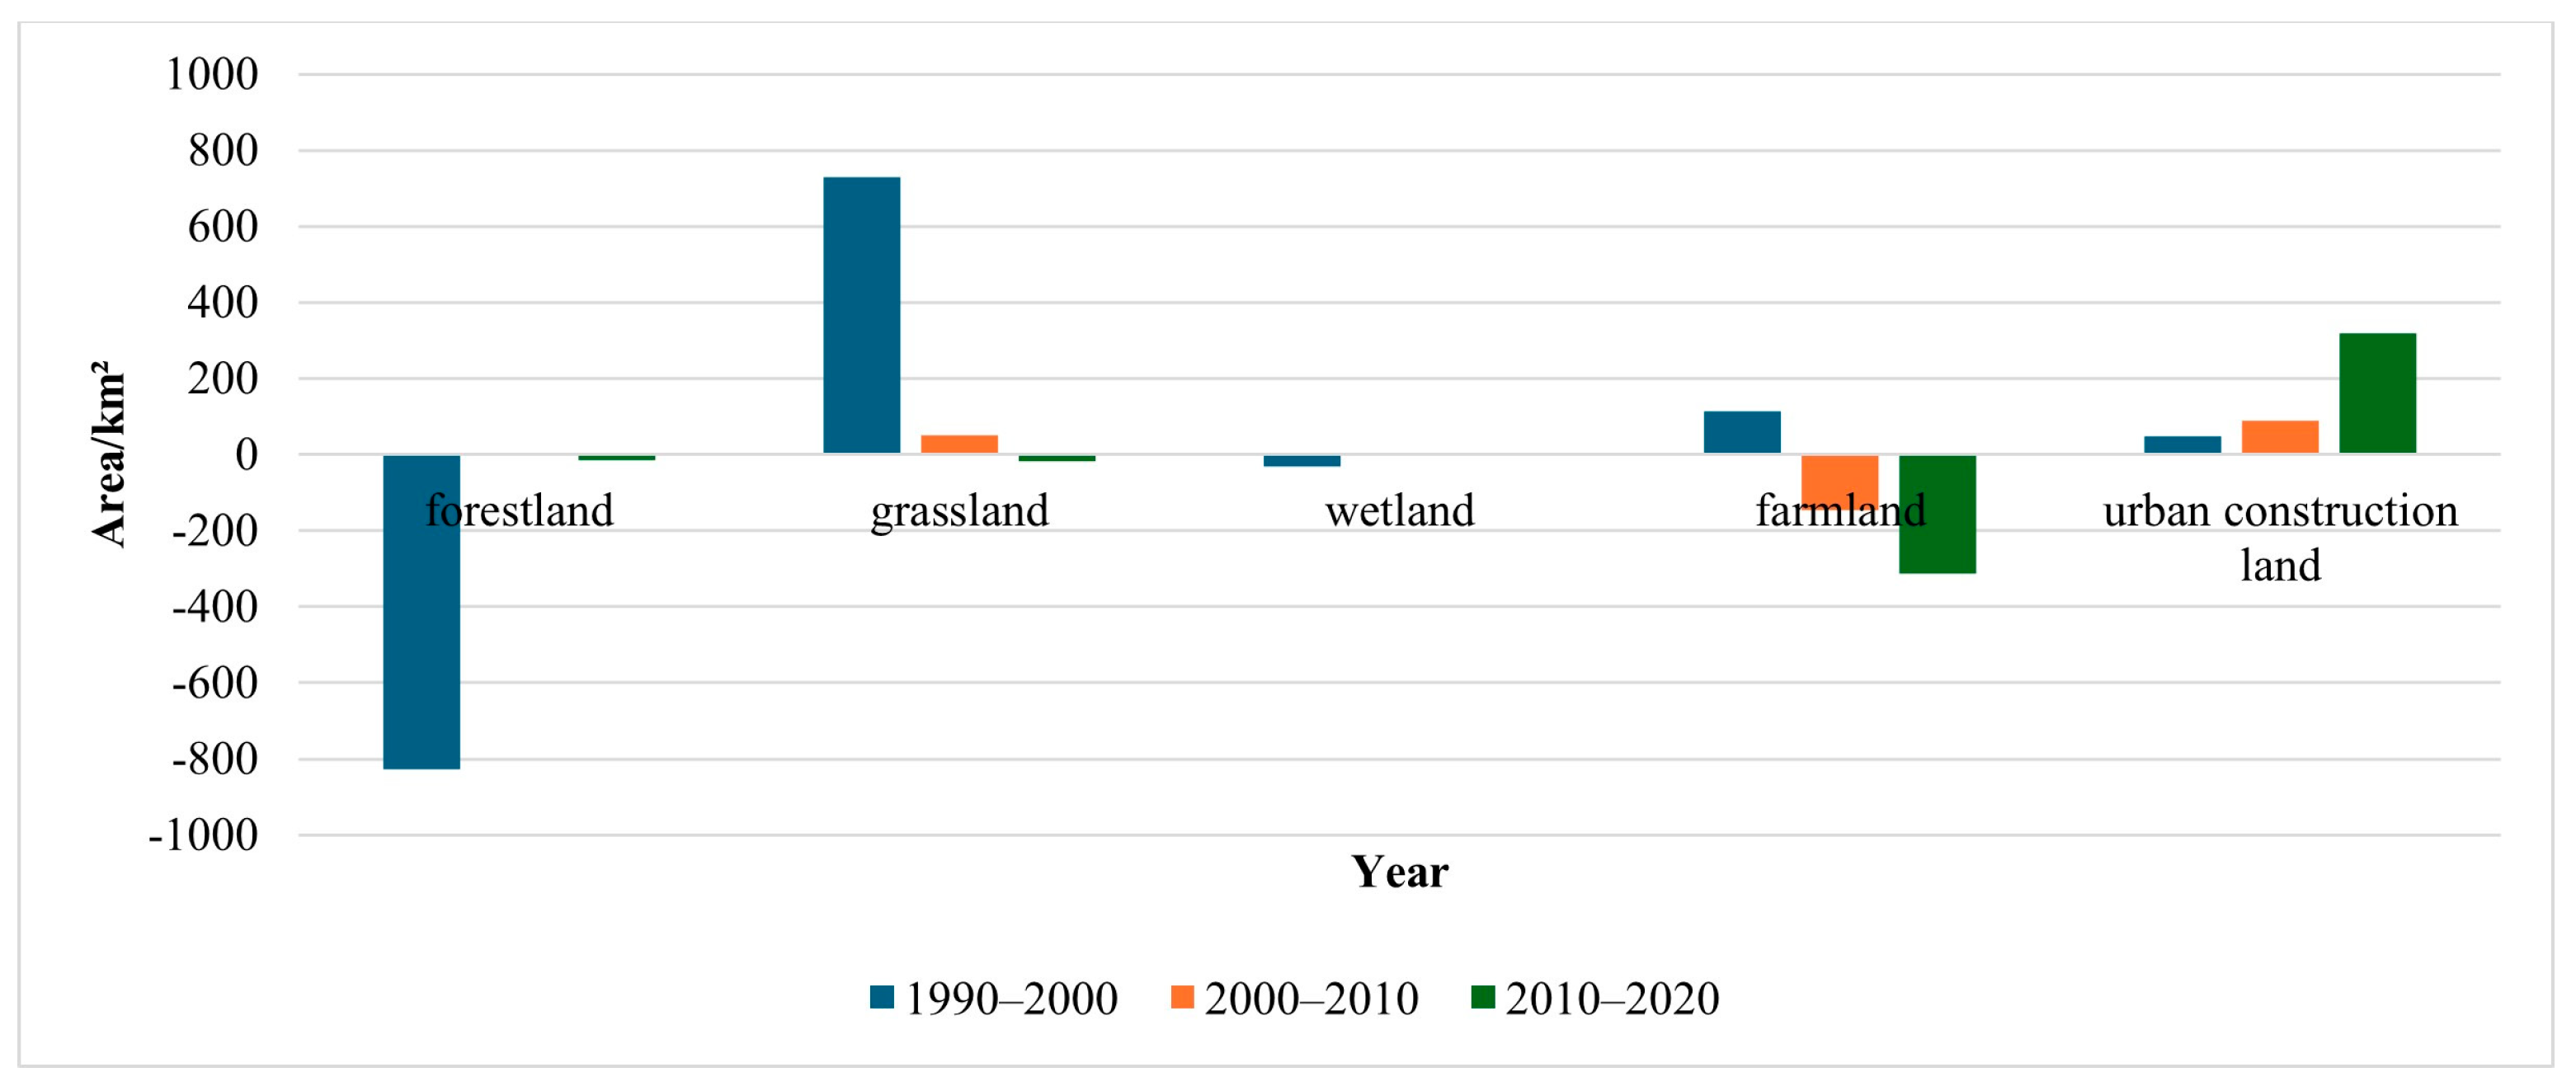
2.3.1. Magnitude of Ecosystem Change C i

In order to analyze the changes in the composition of regional ecosystems and to count the magnitude of change of each type in each time period, the magnitude of change of ecosystems was calculated. The formula for calculating the magnitude of change ( C i ) is as follows:
C i = a i b i b i × 100 %
where i is the percentage of ecosystems in category i at the end of the study; b i is the percentage of ecosystems in category i at the beginning of the study.

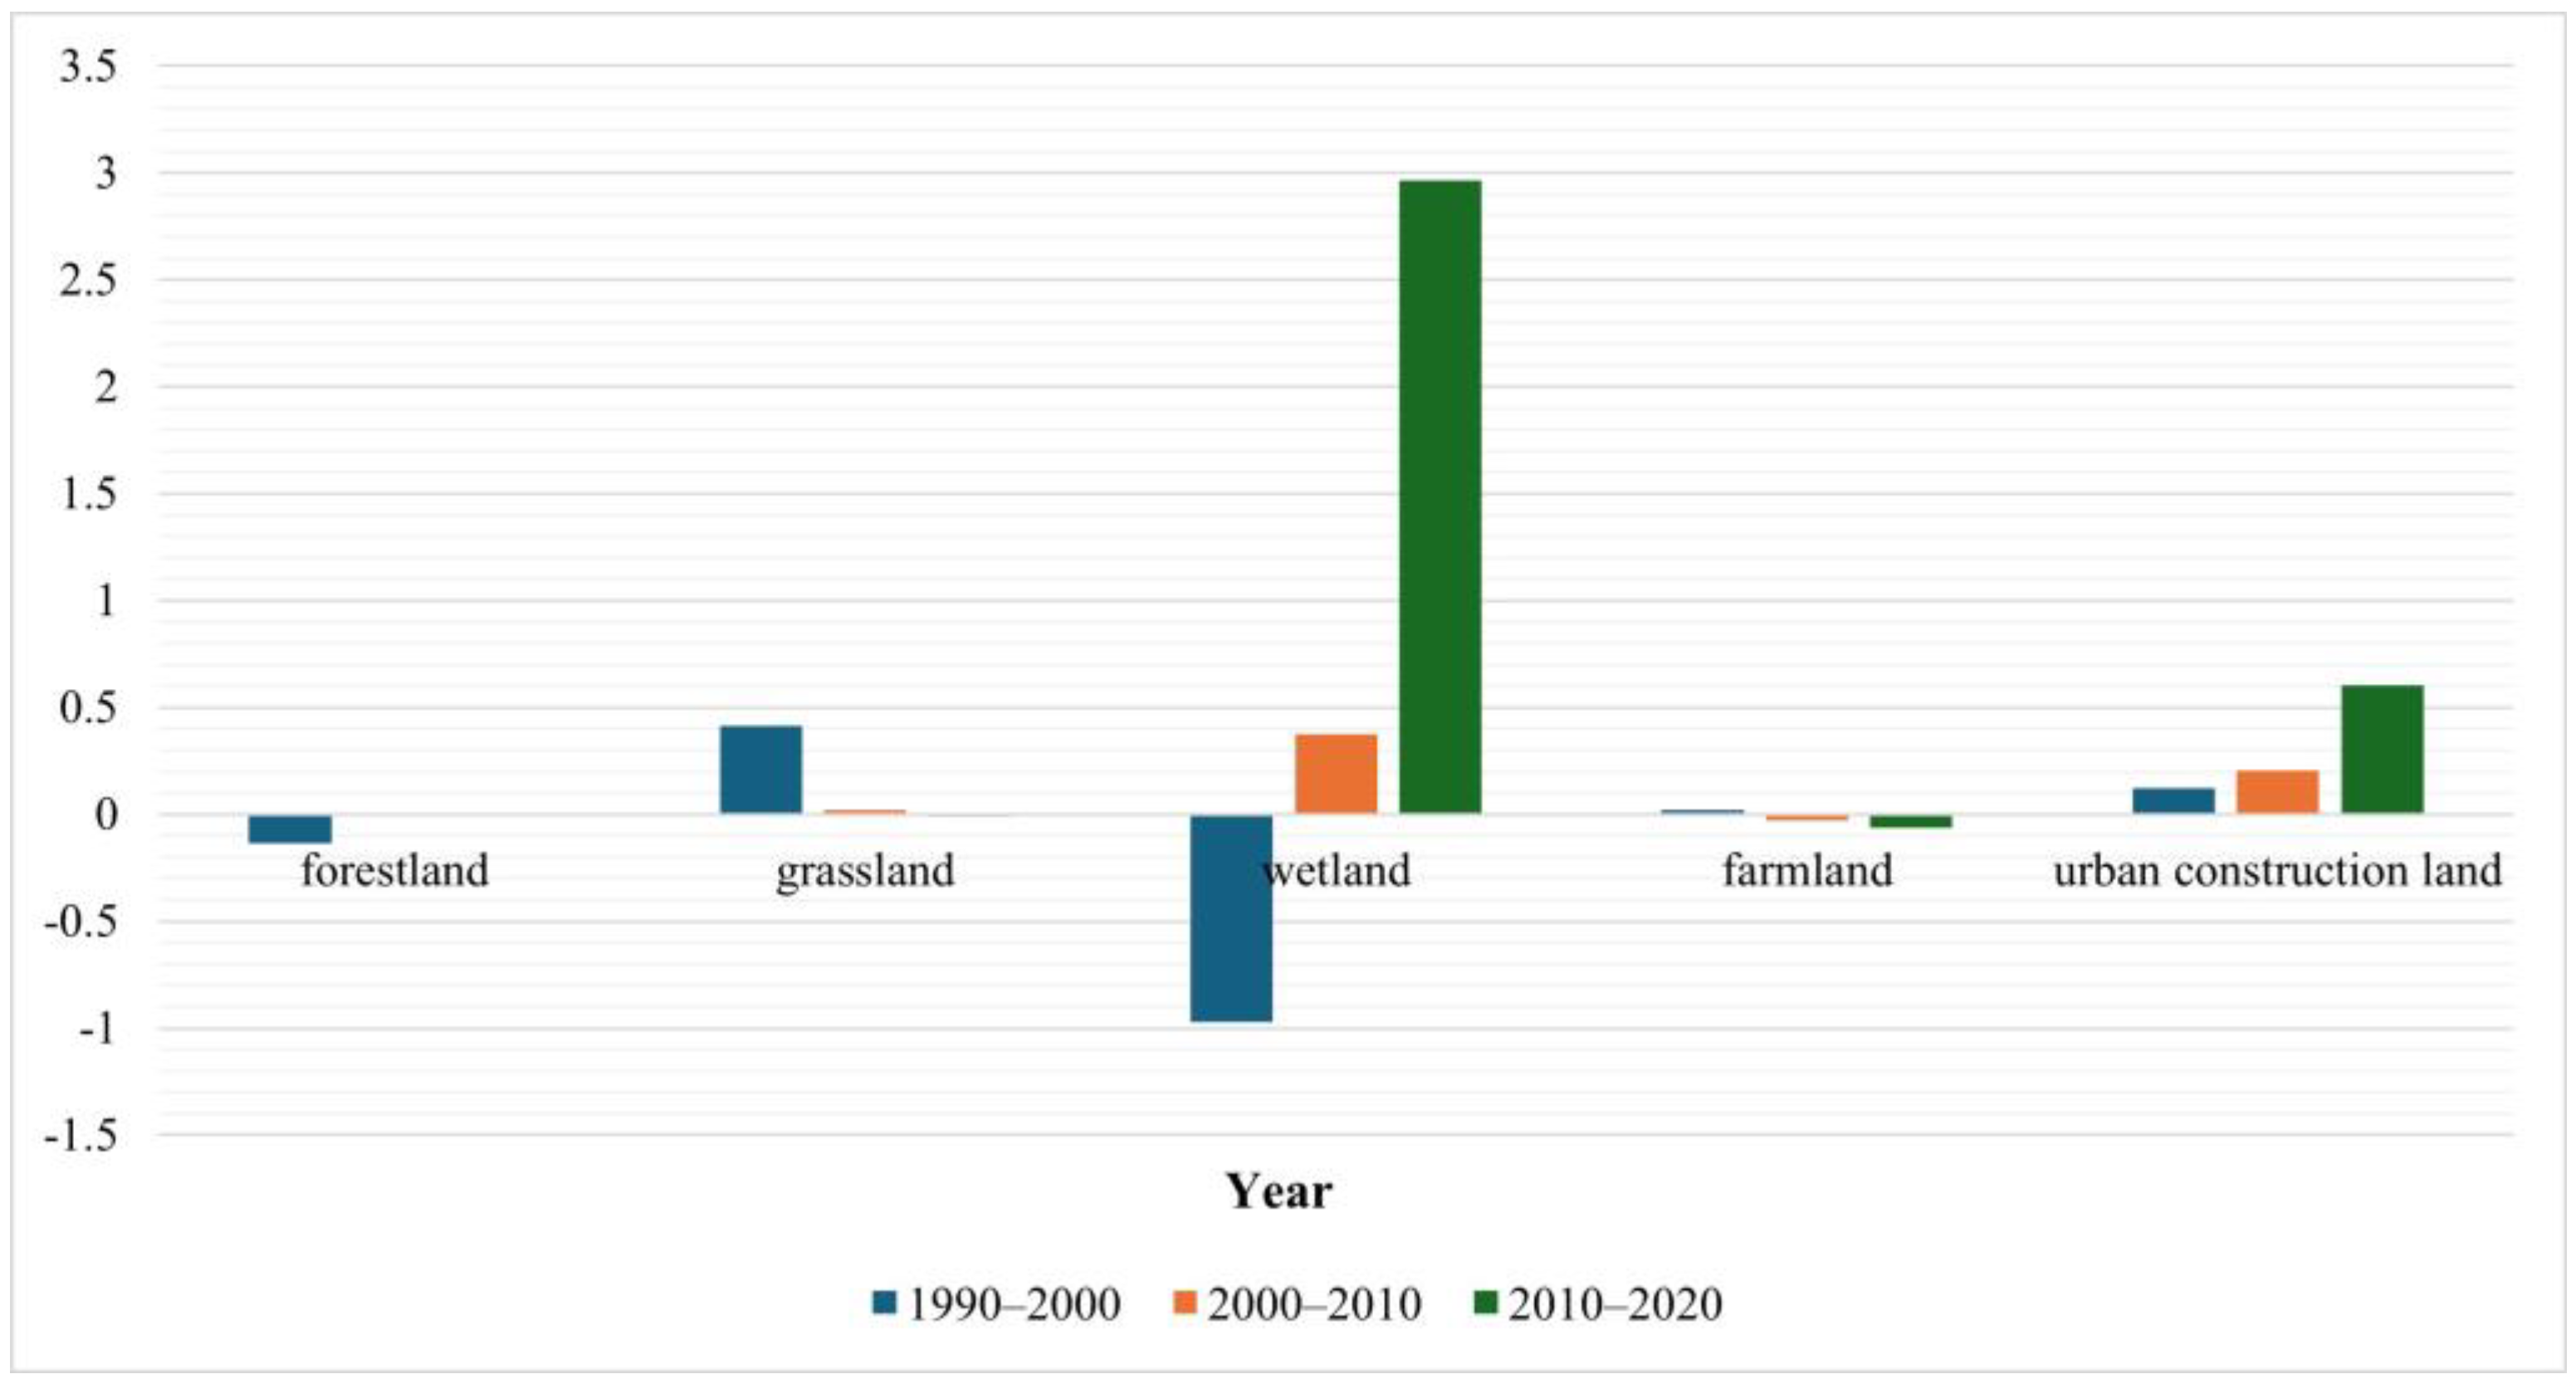
2.3.2. Rate of Ecosystem Change K i

K i = [ j 1 n ( S i , j / S i ) ] × ( 1 / t ) × 100 %
where S i is the area of ecosystem type i in the starting year, km2; S i , j is the net change in area, km2, of type i ecosystems interconverted with other types of ecosystems j from the start time to the cut-off time period; t is the time period, i.e., the difference between the cutoff time and the start time; n is the number of ecosystem types.

2.3.3. Dynamics of Ecosystem Types D i

D i = j = 1 n S i , j S a × 1 t × 100 %
where S a is the total area of the region, km2; S i , j denotes the absolute value of the area of interconversion of ecosystem type i with other types of ecosystem type j from the study start time to the end time period; t is the time period. The dynamics of that ecosystem type reflect the intensity of change in the ecosystem type corresponding to that time period.

2.3.4. Field Validation of Remote Sensing Interpretation

(1)
Selection of sample points and sample plots
We selected 100 multiple sample sites and plots covering different ecosystem types (woodland, grassland, wetland, cropland, construction land, and other land) in the study area. This is shown in Figure 1b. These sites and plots were selected with due consideration to the diversity of ecosystems and the representativeness of their spatial distribution to ensure that the field data can fully reflect the actual situation in the study area.
(2)
Contents of field surveys
Land use type validation: We combine handheld GPS and on-site photography to record land use types and form a field validation dataset, so as to realize the field validation of remote sensing interpretation categories.
Vegetation type and cover: We determined the type, growth status, and cover of vegetation through field observations and sample plot surveys, which were validated in comparison with satellite remote sensing classification results.
(3)
Data processing and validation methods
We assessed the accuracy of the satellite results by comparing and analyzing the data obtained from the field survey with the satellite remote sensing results. The validation results showed that our satellite remote sensing classification and ecosystem change assessment results had a high degree of consistency with the field data, which, to some extent, proved the reliability of the study results.

3. Results

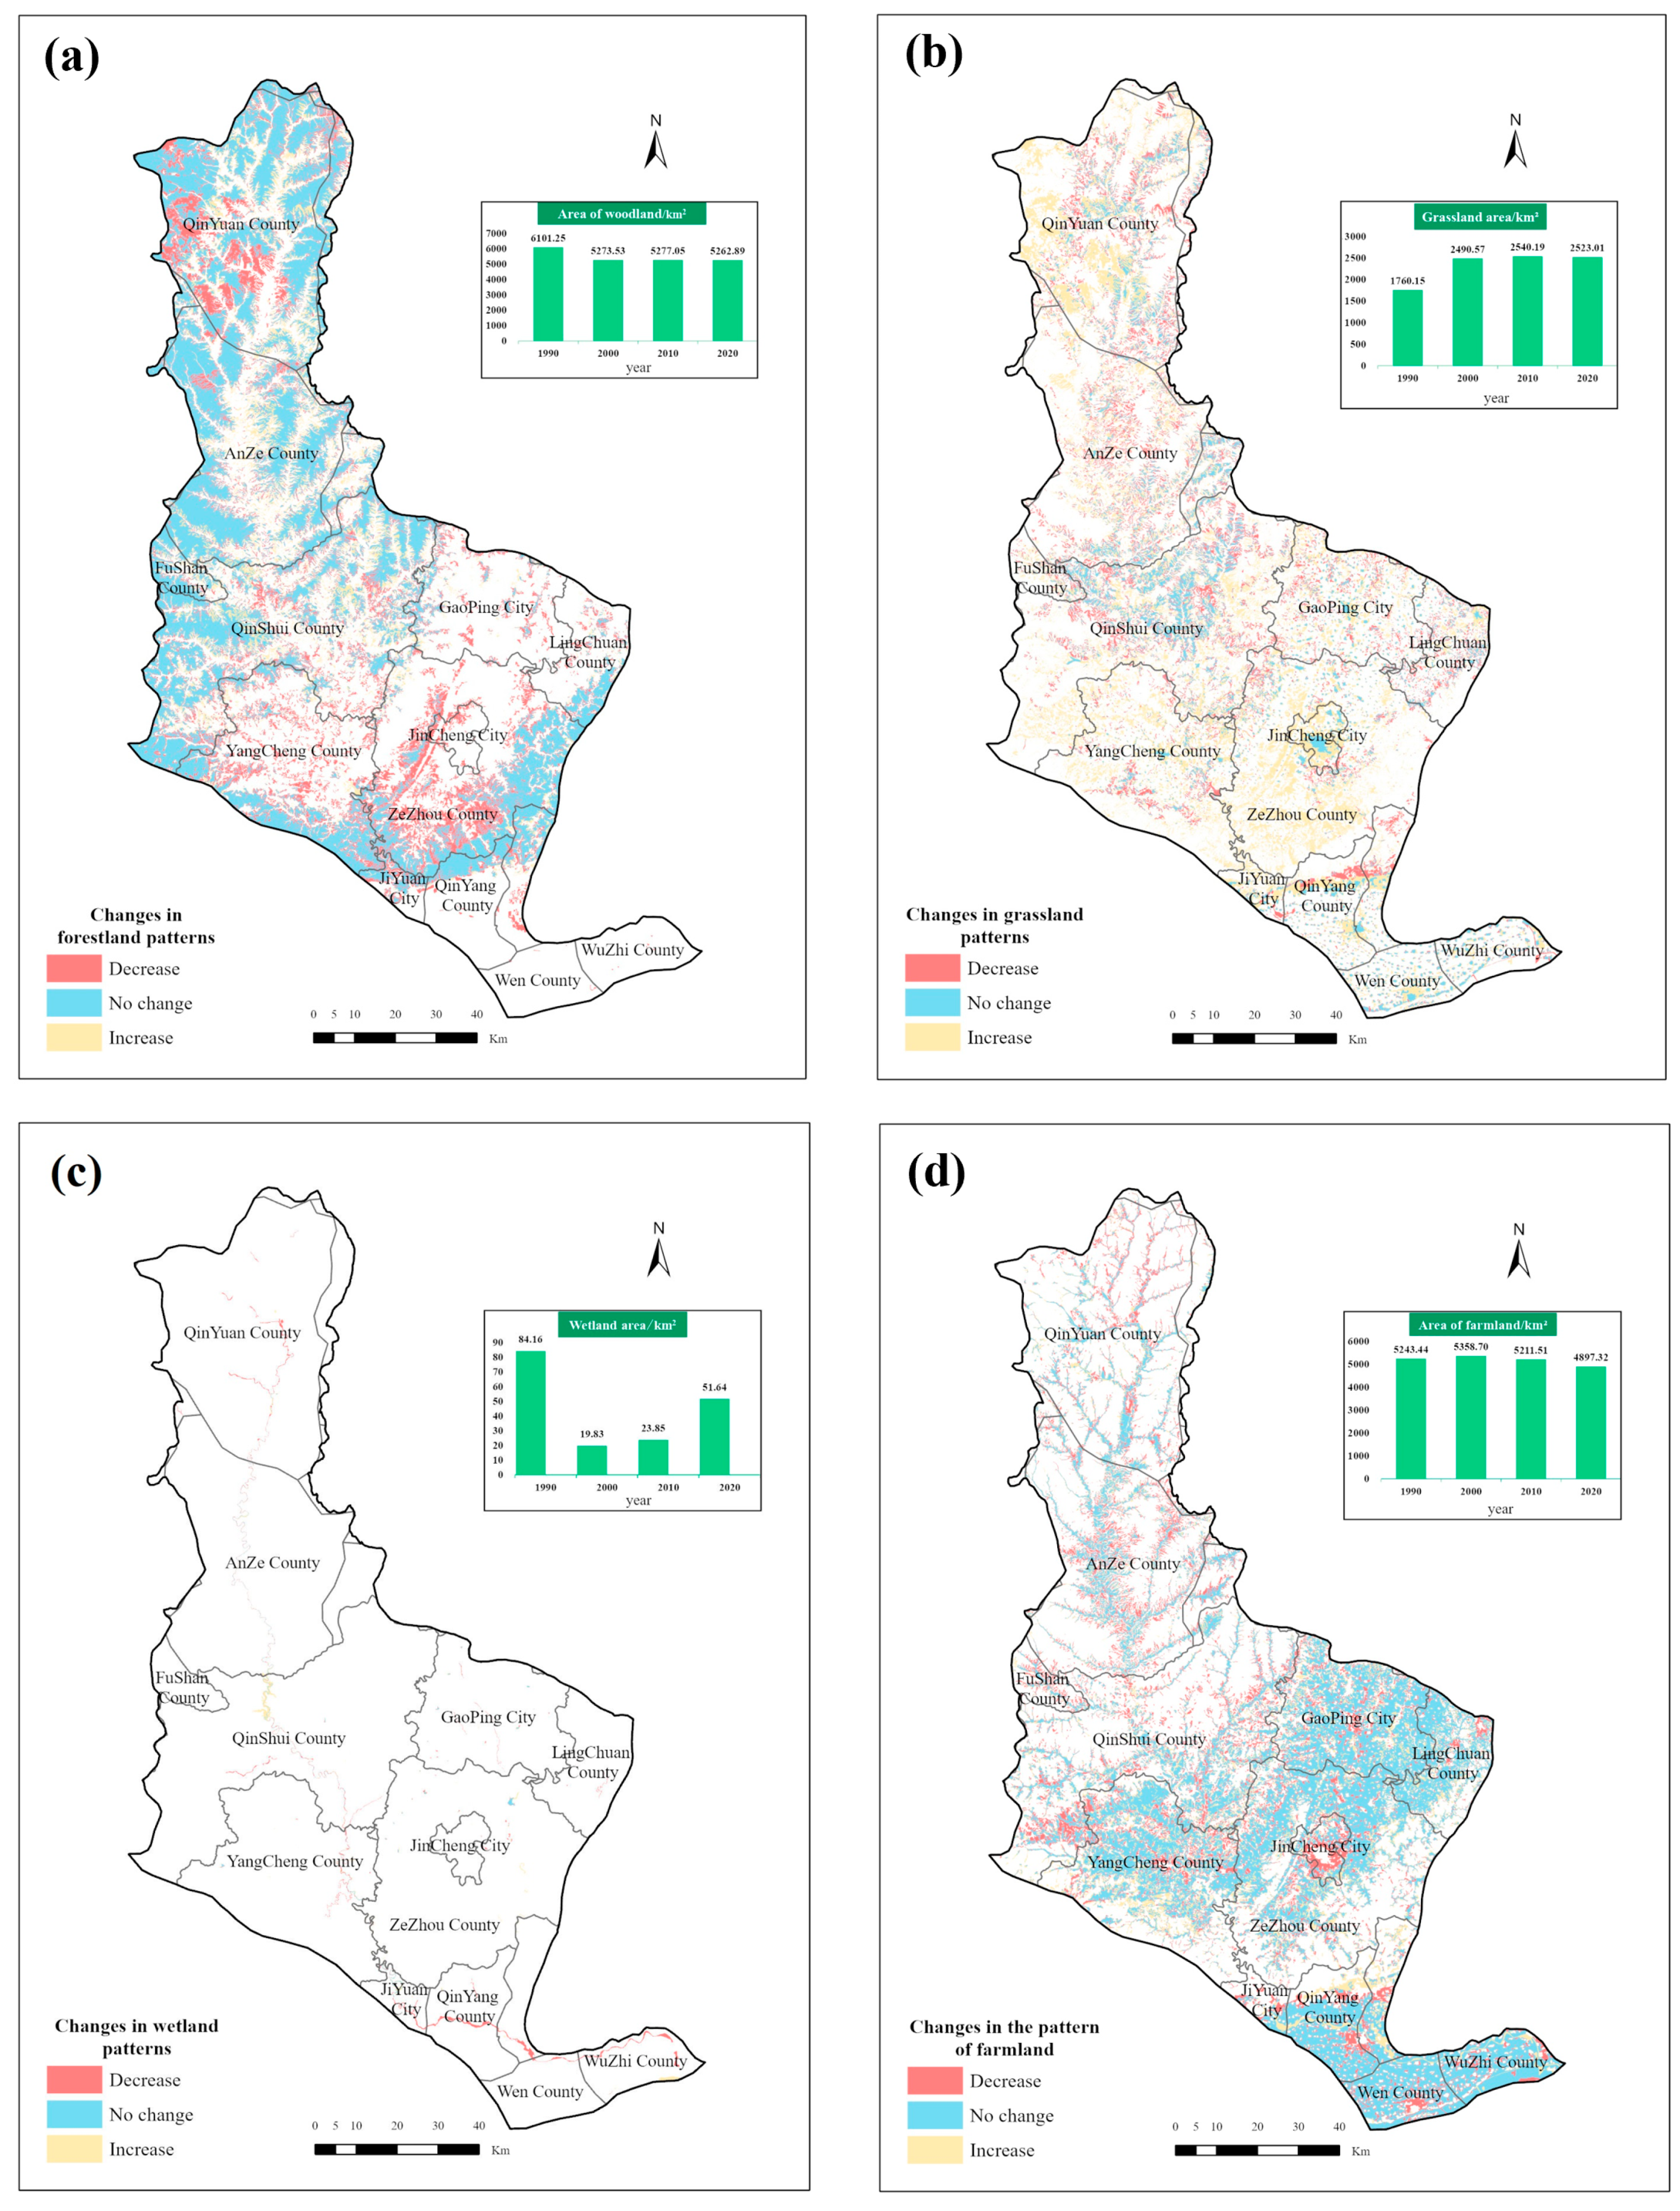
3.1. Distributional Characteristics of Ecosystem Patterns

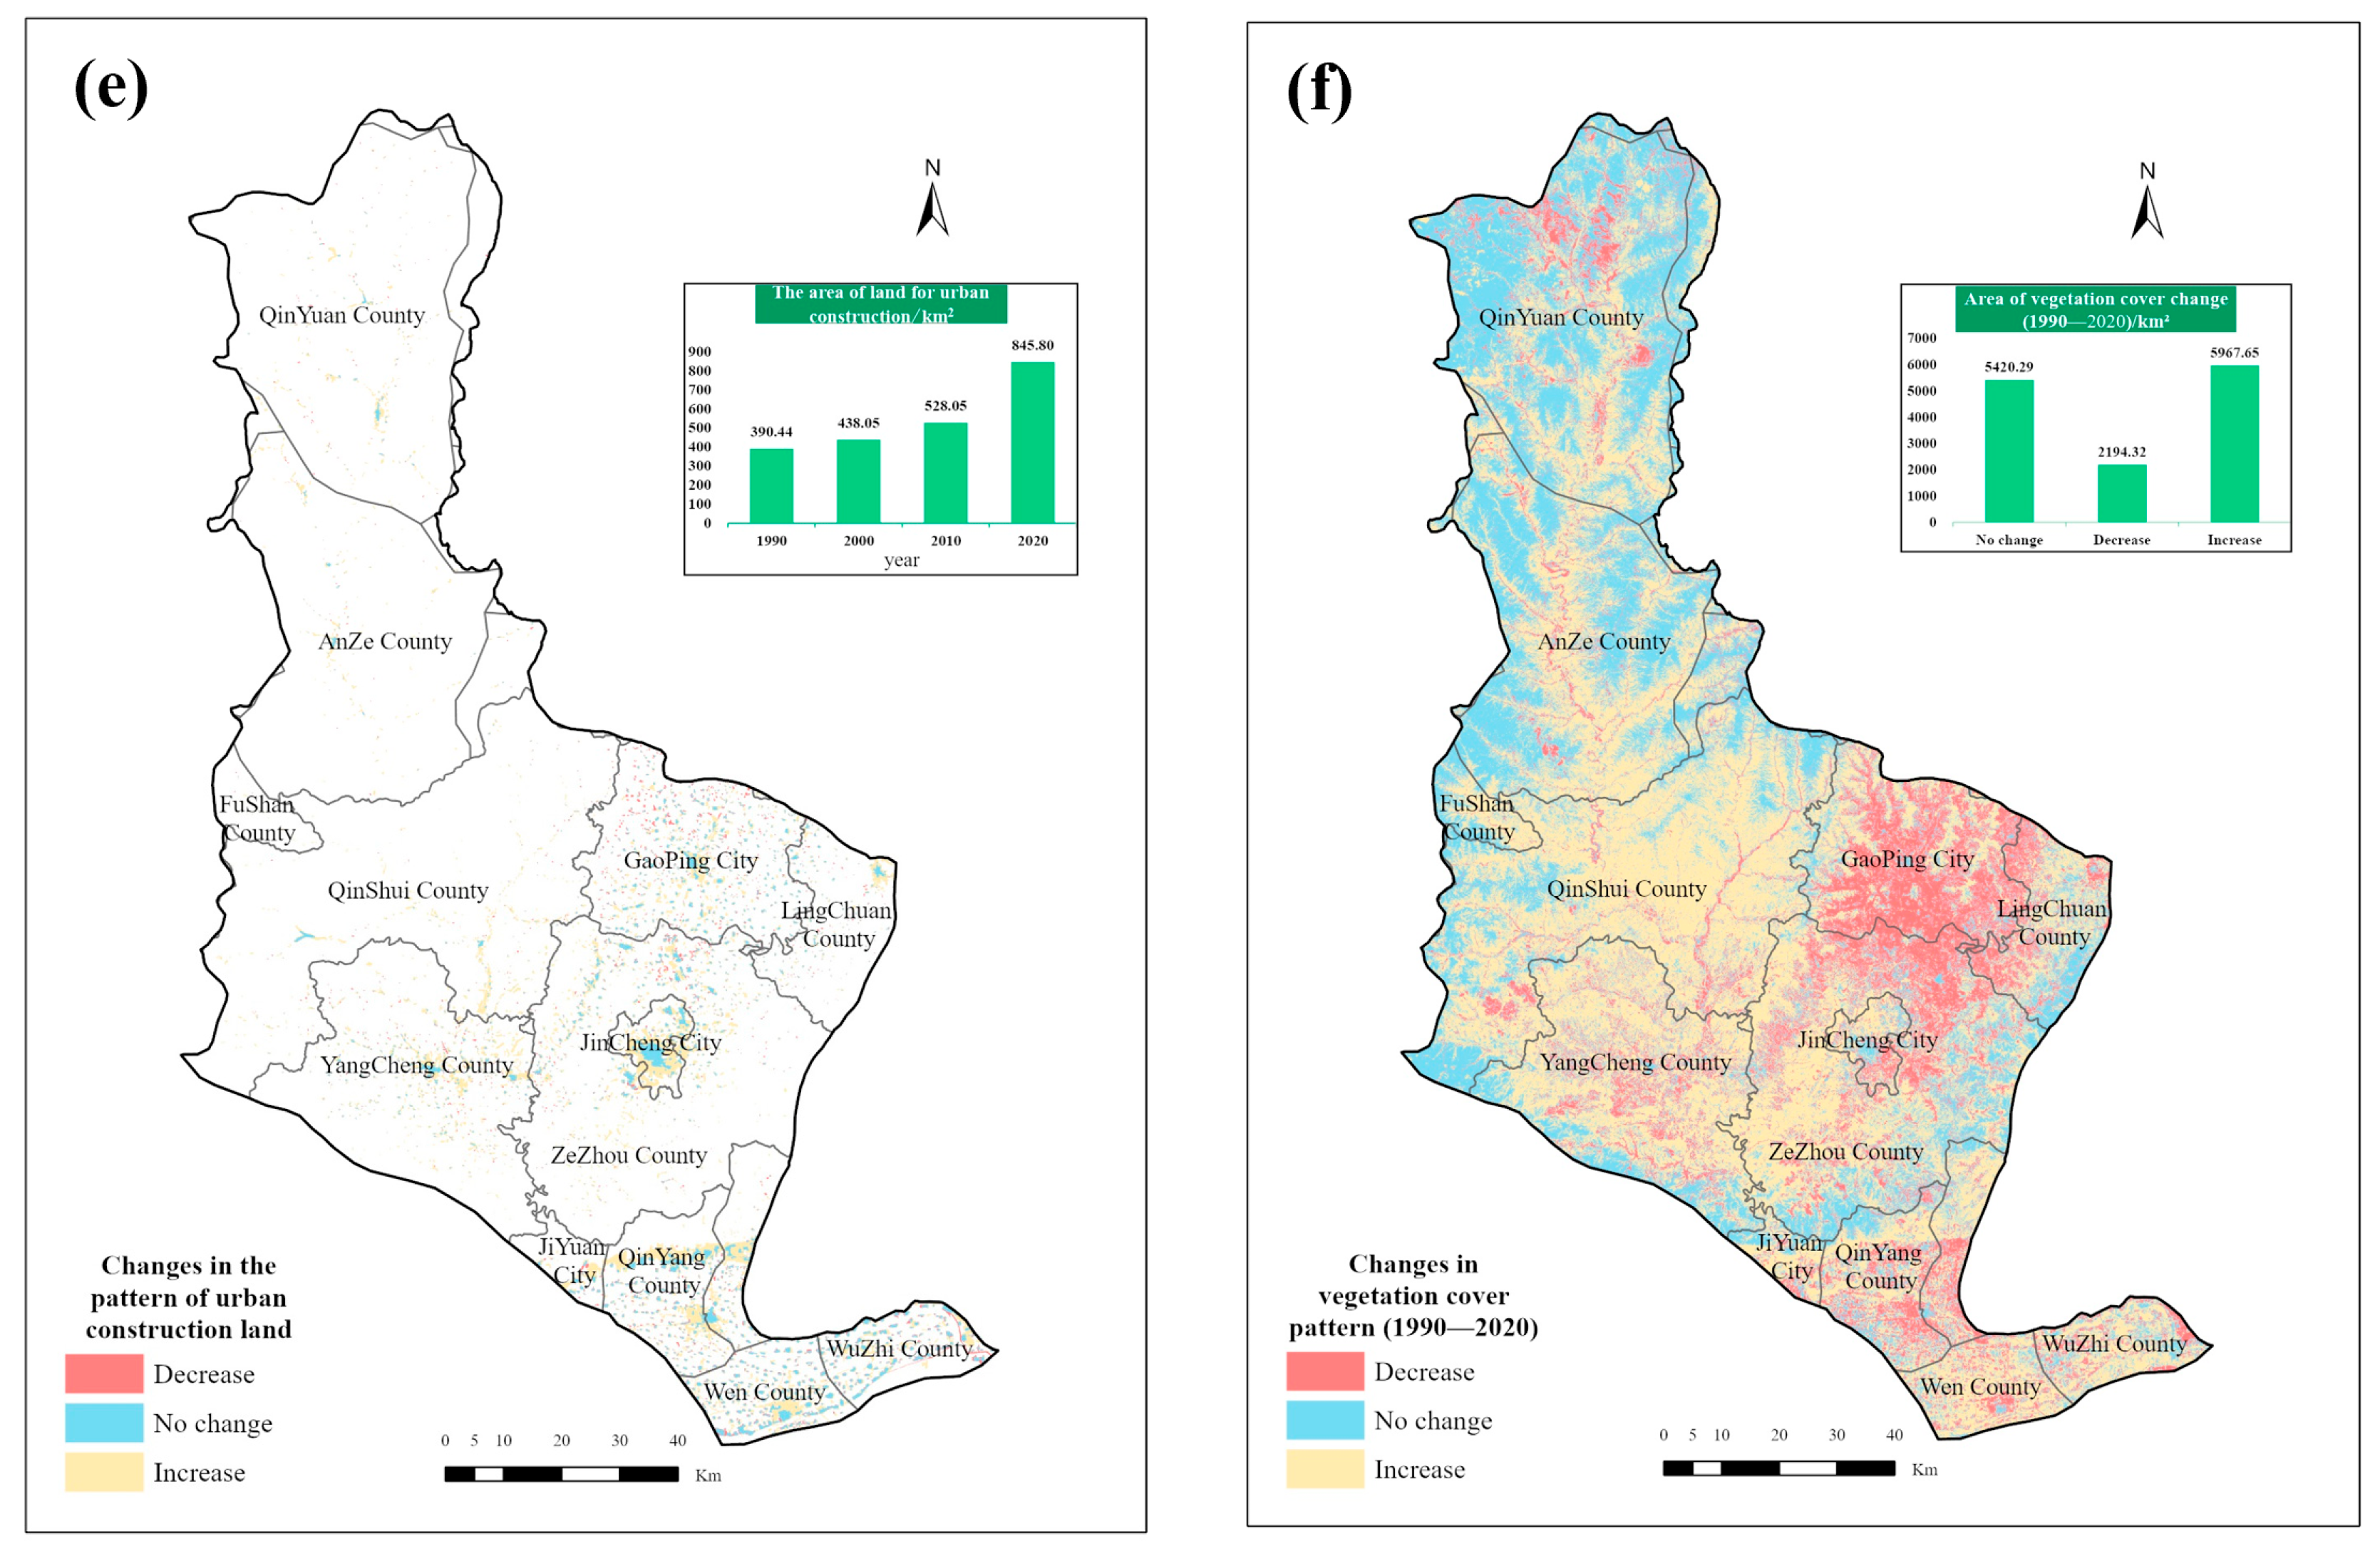
3.1.1. Spatial Distribution Characteristics

The spatial distribution of ecosystems in the Qin River Basin in 2020 is shown in Figure 2. The ecosystem of the Qin River Basin is dominated by forests, grasslands, and farmlands, of which forest ecosystems are mainly distributed in the mountains on both sides of the gullies in the middle and upper reaches of the Qin River Basin and in the mountains on the border between Jin and Henan. Grassland ecosystems are mainly found in the gently sloping areas on both sides of the gullies. The farmland ecosystems are mainly located in Gaoping, Lingchuan, Yangcheng, and the Henan alluvial plain areas of Jincheng City. Wetland ecosystems are mainly located in the Zhangfeng Reservoir and the river zone. Urban ecosystems are mainly located in urban concentration areas such as Jincheng City and Jiaozuo City.

3.1.2. Ecosystem Components

In the ecosystem composition in 2020 (Table 2), forest ecosystems and agro-ecosystems accounted for a comparable area of 38.75% and 36.06% of the total area, respectively. This was followed by grassland ecosystems (18.58%), with the three together accounting for 93.39% of the total area. The area of urban ecosystems and wetland ecosystems is relatively small at 6.61%.

3.2. Characterizing Changes in Ecosystem Patterns

3.2.1. Characterization of Spatial Changes

From 1990 to 2020, the area of forestland, farmland, and wetland in the Qin River Basin ecosystem decreased (Figure 3), and the area of grassland and urban construction land increased. The area of forestland decreased from 6101.25 km2 to 5262.89 km2 (Figure 4). The areas with reduced forestland are mainly located in the mountains of Qinyuan County in the upper reaches of the Qin River Basin and in the mountainous areas of the Jin-Yu border in the middle reaches, with sporadic distribution in other areas. The area of grassland increased from 1760.15 km2 to 2523.01 km2, and the areas of increased grassland were mainly distributed in the upper and middle reaches of the Qin River Basin with gentle slopes. The wetland area decreased from 84.16 km2 to 51.64 km2, and the wetland reduction area was mainly in the downstream Henan floodplain. The area of farmland decreased from 5243.44 km2 to 4897.32 km2. The decrease in farmland was mainly concentrated in urban areas such as Jincheng, Jiaozuo, and Gaoping. The area of urban construction land increased from 390.44 km2 to 845.80 km2. The increase in urban construction land area was mainly concentrated in urban areas such as Jincheng, Jiaozuo, and Gaoping. Vegetation coverage increased by 5967.65 km2, remained unchanged by 2194.32 km2, and decreased by 5420.29 km2.

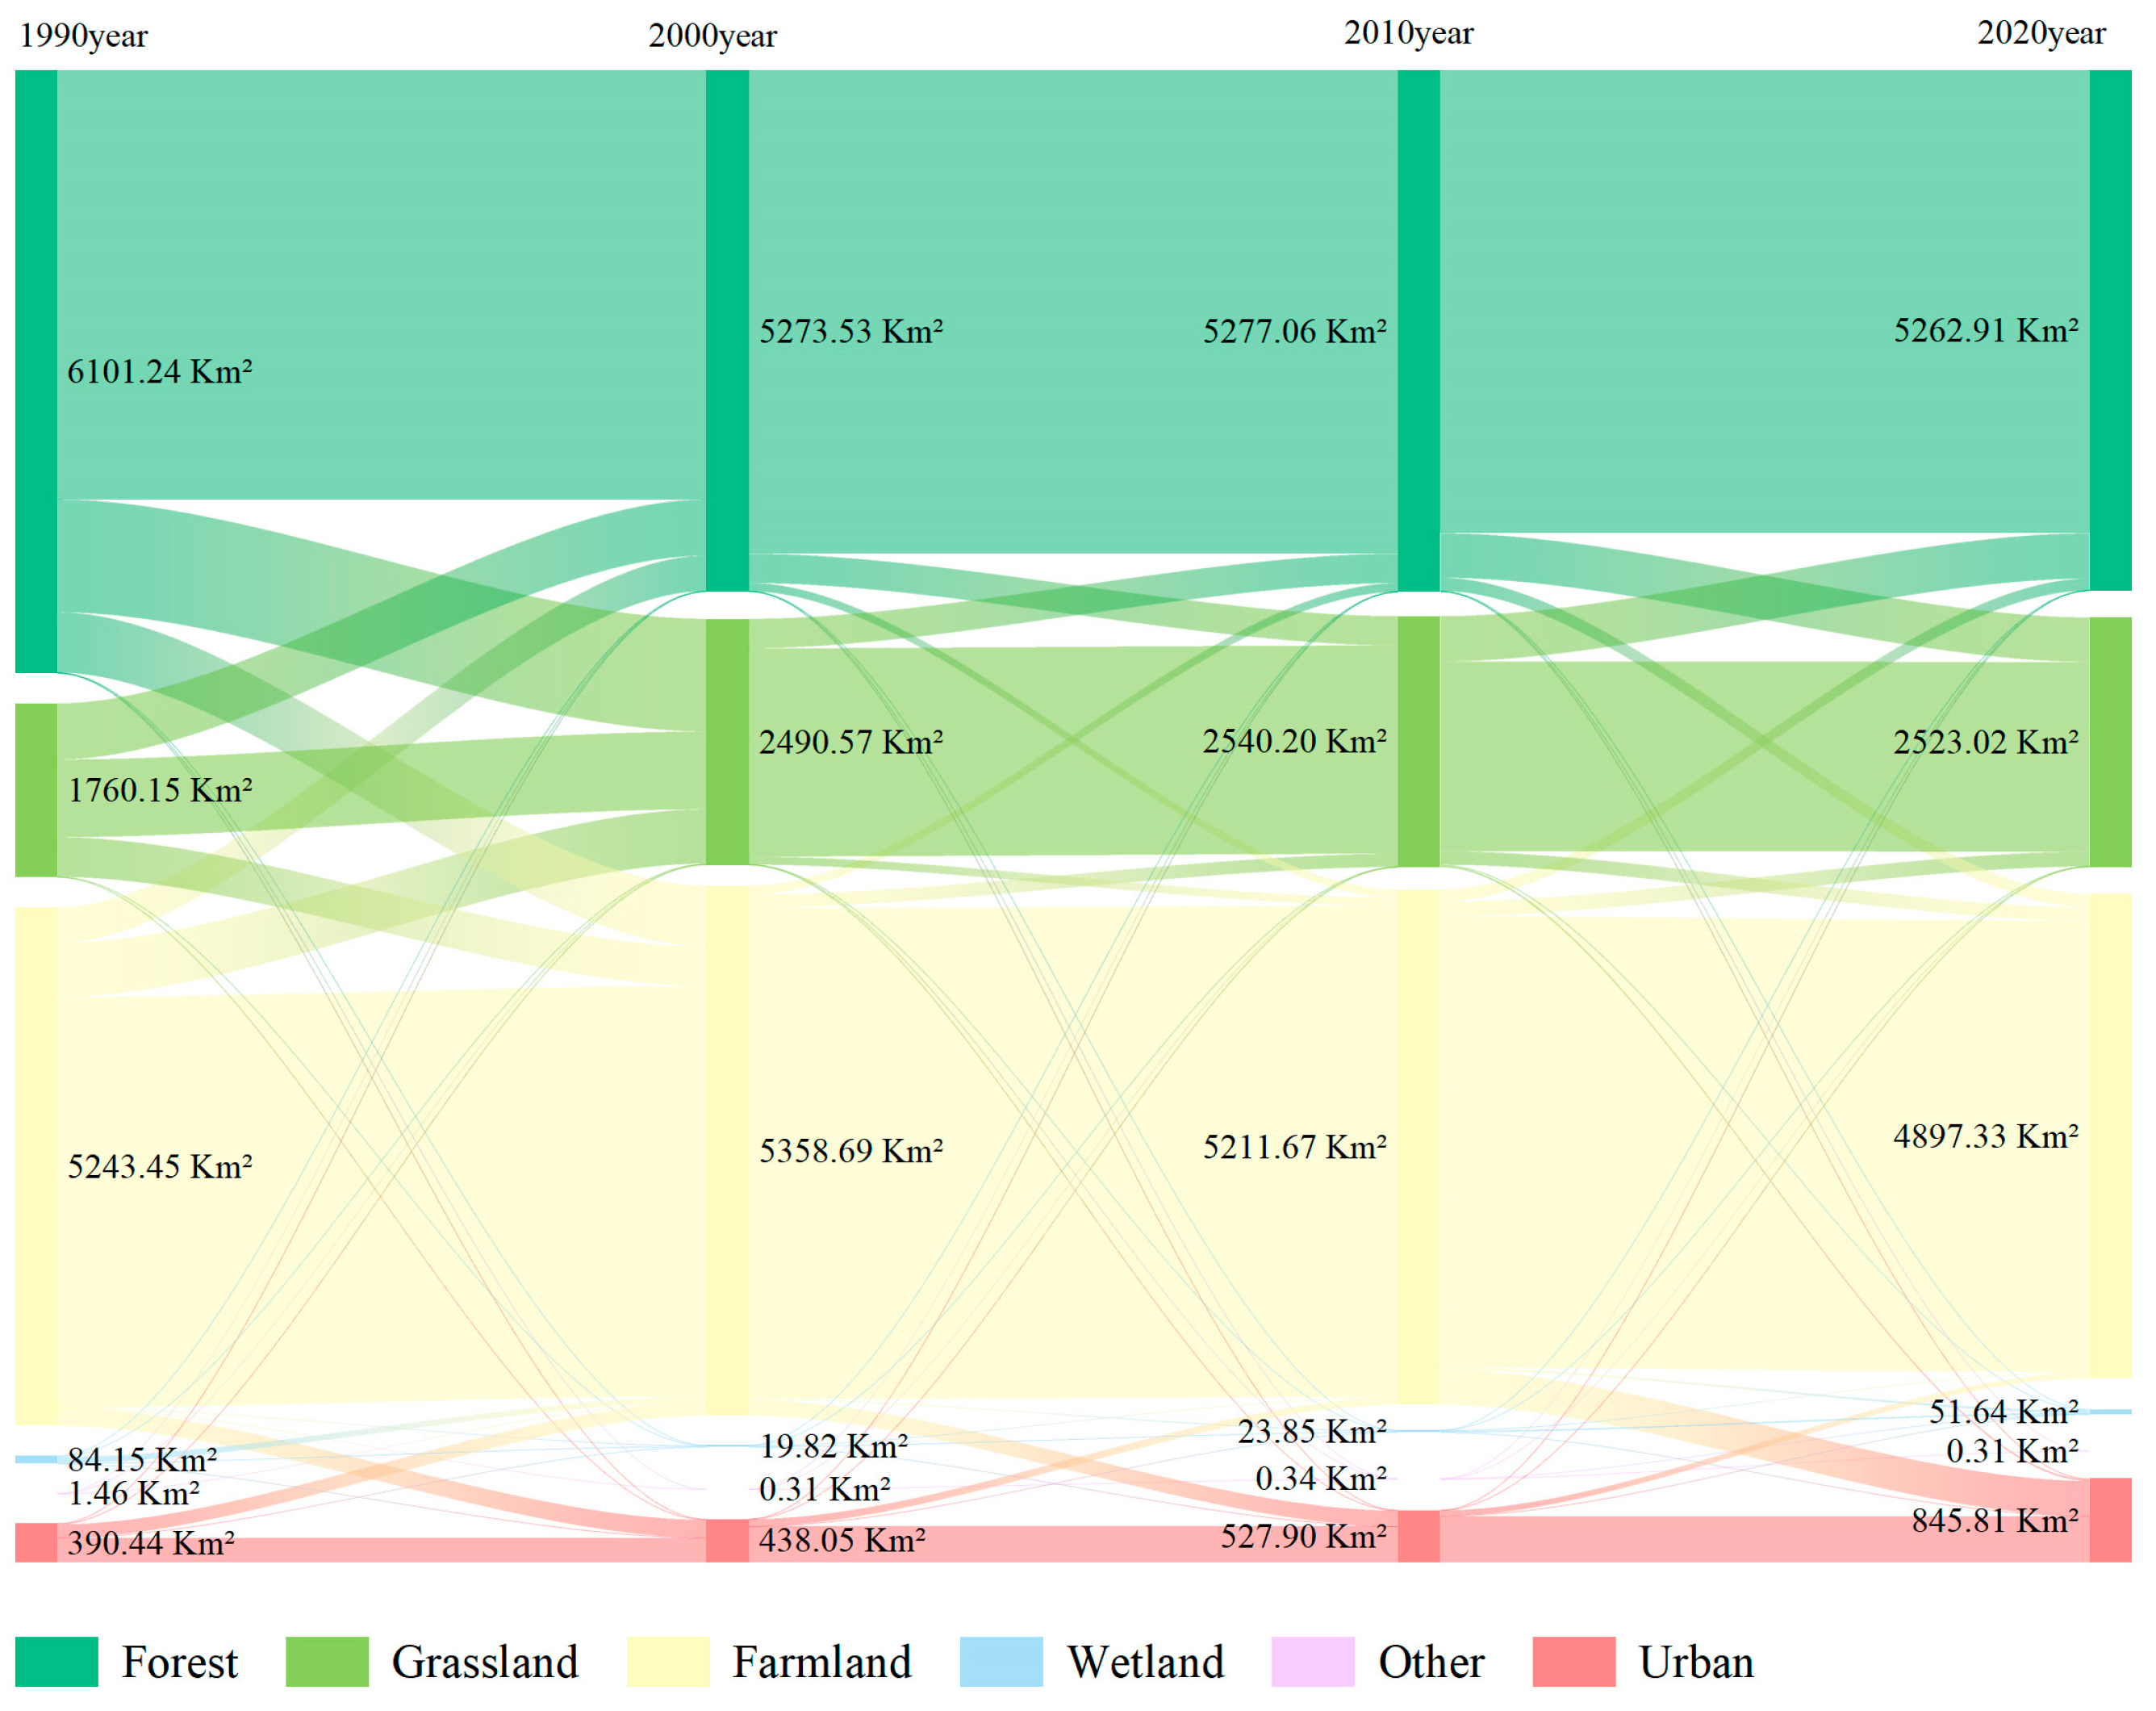
3.2.2. Changes in Ecosystem Composition

The ecosystem evolution was dominated by the conversion of woodland to grassland (Table 3). At the same time, the conversion of grassland to woodland was more pronounced, with the two showing dynamic interconversion (Figure 5). Secondly, the conversion of arable land to residential land.

3.3. Analysis of Drivers of Change in the Ecosystem Landscape

Changes in ecosystem patterns are influenced by both anthropogenic and natural factors. Combined with the analysis of the ecosystem evolution characteristics of the Qin River Basin, it can be seen that from 1990 to 2020, the grassland area and urban construction land area in the Qin River Basin have increased, while the forest area has decreased, indicating that anthropogenic factors have brought about changes in the ecosystem. Based on this, this study selected three elements of urbanization, agricultural development, and ecological environmental protection as driving forces to analyze the situation of the evolutionary characteristics of the ecosystem pattern in the Qin River Basin.
The ecosystem area change approach was used to characterize the role of each driver in the change of ecosystem pattern in the Qin River Basin. Urbanization extracts the area of forest land, grassland, cropland, wetland, etc., and converts it to urban construction land. Agricultural development extracts the area of forest land, grassland, wetland, and other types of land, and converts it to farmland. Ecological protection and restoration involve converting the area of cropland and urban construction land to forest land, grassland, and wetland. On this basis, the ratio of the amount of ecosystem change under the drivers to the total amount of ecosystem change was used to characterize the contribution of each driver. The statistics of the contribution of each driver to the changes in the ecosystem pattern of the Qin River Basin are shown in Table 4.

3.3.1. Agricultural Development

Agricultural development led to changes in the ecosystem area of 1787.83 km2, with a contribution rate of 45.03%. This is the first driving force that triggers ecosystem changes in the Qin River Basin.
The area of agro-ecosystems in the Qin River Basin increased by 115.26 km2 from 1990 to 2000, mainly due to the conversion of grassland and woodland. The area of farmland ecosystems in the Qin River Basin decreased by 147.04 km2 from 2000 to 2010, mainly due to the conversion of pastures and towns. The area of farmland ecosystems in the Qin River Basin decreased by 314.33 km2 from 2010 to 2020, mainly due to the conversion of towns.

3.3.2. Ecological Conservation and Restoration

Ecological protection and restoration led to changes in the ecosystem area of 1449.22 km2, with a contribution rate of 36.50%. This is the second driving force that triggers ecosystem changes in the Qin River Basin.
From 1990 to 2000, the area of the grassland ecosystem in the Qin River Basin increased by 730.4 km2, and the area of the forest ecosystem decreased by 827.73 km2, which is mainly the direct transformation of the two. From 2000 to 2010, the area of the grassland ecosystem in the Qin River Basin increased by 49.62 km2, and the area of the forest ecosystem increased by 3.52 km2, which is mainly the transformation of the farmland ecosystem. From 2010 to 2020, the area of the grassland ecosystem in the Qin River Basin decreased by 17.18 km2, and the area of the forest ecosystem decreased by 14.16 km2, mainly due to the transformation of towns and cities.

3.3.3. Urbanization

The development of urbanization led to changes in the ecosystem of 733.38 km2, with a contribution rate of 18.47%. This is the third driving force that triggers ecosystem changes in the Qin River Basin.
The area of urban ecosystems in the Qin River Basin increased by 46.47 km2 from 1990 to 2000. The area of urban ecosystems in the Qin River Basin increased by 90.01 km2 from 2000 to 2010. The area of urban ecosystems in the Qin River Basin increased by 317.74 km2 from 2010 to 2020.
In summary, anthropogenic factors played a major driving role in the evolution of the ecosystem pattern of the Qin River Basin from 1990 to 2020, especially the implementation of ecological restoration and protection projects, which vigorously improved the quality of the ecological environment of the Qin River Basin. At the same time, urbanization and agricultural development are also closely related to the changes of the ecosystem in the Qin River Basin, which have an important impact on the ecological security pattern of the basin.

4. Discussion

4.1. Characterization of Changes in Ecosystem Patterns

The area of forested land in the Qin River Basin decreased from 6101.25 km2 in 1990 to 5262.89 km2 in 2020, a decrease of −13.74%. The decreased area is mainly concentrated in the mountains of Qinyuan County in the upper reaches of the basin and in the mountains of the Jin-Yu border in the middle reaches. This phenomenon may be related to several factors. On the one hand, there may be excessive deforestation in the upstream and midstream areas for timber demand or land reclamation to meet the needs of local agriculture or economic development. On the other hand, it may be affected by climate change, such as changes in precipitation patterns and rising temperatures, which affect forest growth and regeneration and lead to the degradation of some forested areas. Reduced forested areas have significant impacts on ecosystem functions, such as weakening water-holding capacity and increasing the risk of soil erosion, and may also pose a threat to biodiversity, with the loss of habitat for many forest-dependent plants and animals. The grassland area increased from 1760.15 km2 to 2523.01 km2 during this period, an increase of 43.34%. It is mainly distributed in the gently sloping areas in the upper and middle reaches of the watershed. This may be due to the succession of vegetation type to grassland in some areas after the reduction in forest land. In addition, human activities may also have played a driving role, such as the implementation of the policy of returning farmland to forest and grassland in some areas, which has gradually restored the original cultivated land or degraded forest land to grassland. The increase in the area of grassland is, to a certain extent, conducive to the conservation of soil and water, and provides more resources for the development of animal husbandry. However, it is also necessary to pay attention to the quality and sustainability of grassland and to avoid overgrazing, which leads to grassland degradation. The wetland area decreased from 84.16 km2 to 51.64 km2, a reduction of up to −38.64%. The main reason is that the water level of the downstream Henan alluvial flood plain is lowered, resulting in a reduction in the water area. The drastic reduction in wetland area seriously affected its ecological service function. As the habitat of many rare species, a natural sewage treatment system, and a flood regulation buffer zone, the shrinking area of wetlands will impair biodiversity and reduce the flood regulation capacity. It may also affect the water supply and quality of water resources in the surrounding areas. The lowering of water levels may be related to a number of factors, such as the exploitation of upstream water resources, reduced precipitation due to climate change, and over-exploitation of groundwater by human activities. Dam construction and intake placement are key anthropogenic factors that affect hydrologic conditions in wetlands. In the Qin River Basin, with the development of society and economy, human beings have constructed a large number of dams and water intakes to meet the demand for agricultural irrigation, industrial water, and domestic water. These engineering facilities have altered the natural runoff process of the river, resulting in reduced water recharge to the downstream wetlands, thus accelerating the shrinkage of the wetlands. Due to the interception of upstream dams, a number of small wetlands in the watershed have lost stable water recharge and are drying up. The impact of climate change on wetlands cannot be ignored. During the study period, the precipitation in the Qin River Basin showed some fluctuation and a decreasing trend, while the temperature showed an increasing trend. Decreased precipitation leads to reduced natural recharge of wetlands, while higher temperatures increase evaporation from wetlands, causing the water balance of wetlands to be disrupted and further exacerbating wetland degradation. The area of farmland decreased from 5243.44 km2 to 4897.32 km2, a decrease of −6.60%. It is mainly concentrated in urban areas such as Jincheng, Jiaozuo, and Gaoping. This is closely related to the accelerated urbanization process, with towns expanding and constantly encroaching on the surrounding farmland. With the development of the urban economy, the demand for land for construction has continued to grow, and agricultural land has been converted in large quantities into land for urban construction. This change reflects the restructuring of the regional economy and also has implications for food security and agro-ecosystems. On the one hand, the reduction in the area of agricultural land may threaten local food self-sufficiency; on the other hand, the fragmentation of traditional agro-ecosystems may affect the stability of agro-ecosystems and biodiversity. The area of urban construction land increased from 390.44 km2 to 845.80 km2, an increase of 116.63%. It is concentrated in urban areas such as Jincheng, Jiaozuo, and Gaoping. Rapid urbanization is the main driver of this change, with population growth, economic development, and industrialization processes contributing to the increasing size of towns and cities. The increase in land for urban construction has altered the original ecosystem pattern, with a large amount of natural and agricultural land being replaced by impermeable man-made structures, leading to the disruption of ecosystem connectivity and the loss of biological habitats. It may also trigger a series of environmental problems, such as the heat island effect. With the increase in population, there has been a corresponding increase in human demand for land, including land for housing and infrastructure. This has directly contributed to the process of urbanization, resulting in the conversion of large amounts of agricultural land and natural ecosystems into land for construction. At the same time, population growth will also increase the demand for agricultural products, thus contributing to the expansion of agricultural land and further changing land use patterns. The impact of migration on land use is more complex. On the one hand, the inflow of migrants to cities accelerates urbanization and increases the demand for land for construction; on the other hand, the outflow of migrants from rural areas may lead to a reduction in the rural population, thus affecting agricultural production and land-use patterns. Land abandonment has occurred in some rural areas due to the outflow of young and middle-aged laborers, which has changed the land use structure to a certain extent. Subsidies provided by the Government for agricultural production may reduce the cost of agricultural production and increase agricultural returns, thereby encouraging farmers to increase inputs into agricultural production and expand the area of land used for agriculture. Subsidies, including for the cultivation of food crops, may induce farmers to reclaim more arable land for food production. The remarkable increase in urbanization (+116.63%) may indeed be driven more by urban development policies than by purely natural processes. During the study period, national and local governments introduced a series of policies to promote urbanization, including urban planning, infrastructure development, and industrial policies. These policies accelerated the urbanization process by attracting population and resources to concentrate in cities, leading to the conversion of a large amount of agricultural land and natural ecosystems into urban construction land.
Combining Figure 5 and Figure 6, we found that the ecosystem pattern of the Qinhe River Basin showed significant dynamic changes during 1990–2020. Among them, the inter-conversion between forest land and grassland and urban encroachment on farmland are the main features. This finding has some similarity with the findings of other tributaries in the Yellow River basin. Some scholars’ studies on the Weihe River Basin also showed that urbanization and agricultural intensification had a significant impact on the ecosystem of the region, which led to the reduction in woodland and grassland as well as the expansion of urban land use [48]. However, compared to the Weihe River Basin, the Qin River Basin showed a greater reduction in wetlands (−38.64%), which may be related to the specific ecological conditions and intensity of human activities in the basin. From 1990 to 2020, the area of forest land converted to grassland is 1140.47 km2, while the area of grassland converted to forest land is 567.73 km2. This intertransfer phenomenon reflects the complexity and dynamics of ecosystems. In terms of natural factors, climatic fluctuations, fires, etc., may affect the turnover of vegetation types, allowing woodlands and grasslands to transform into each other under certain conditions. Anthropogenic factors, such as the previously mentioned policy of returning farmland to forests and grasslands, as well as activities such as overgrazing and irrational deforestation, may change the distribution pattern of forests and grasslands. This dynamic interchange has important implications for ecosystem stability and function. For example, appropriate woodland–grassland conversion may be conducive to the maintenance of biodiversity but may lead to degradation of ecosystem function if the conversion process is too drastic or irrational. The conversion of cropland to residential land is also an important feature of the changing ecosystem pattern in the Qim River Basin. During the period 1990–2020, a large amount of arable land was converted into residential land, which is directly related to the demand for housing due to population growth in the process of urbanization and the expansion of cities. This conversion has had a double impact on agricultural production and the ecosystem. From an agricultural point of view, the reduction in high-quality arable land could affect the region’s agricultural production capacity and food security. From an ecological perspective, the destruction of cropland ecosystems reduces the carbon sequestration capacity of soils and alters surface runoff and soil erosion patterns, as well as reducing the diversity of biological habitats.
The pattern changes of ecosystems in this study were analyzed using conventional analyses of magnitude of change, rate of change, and attitude of motivation, which more objectively reflected the changes of ecosystems at the watershed scale and elaborated the indications of pattern evolution. In such a complex geographic environment as the Qin River Basin, the magnitude of change, the rate of change, and the attitude of motivation can directly reflect the degree of change of the ecosystem’s state in different periods. By comparing the magnitude of changes in ecosystem types in different periods, the increase or decrease in the area of forests, grasslands, croplands, wetlands, and urban construction land can be clarified, accurately reflecting the spatial distribution characteristics of different types of ecosystems. For the forest ecosystems in the mountains on both sides of the gullies in the middle and upper reaches of the Qin River Basin and in the mountains on the border between Jin and Henan, we can clarify the increase or decrease in the forest cover area by comparing the magnitude of the change in the area of the land-use types in different periods, and accurately reflecting the changing dynamics of the vegetation cover in the mountain ecosystems. For grassland ecosystems distributed in gently sloping areas on both sides of gullies, the rate of change calculation can more effectively highlight the rate of ecosystem change and help to detect some gradual changes, including the rate of interconversion between grassland and woodland. In contrast, the dynamic attitude analysis integrates the time and space factors. It is more sensitive to the monitoring of dynamic changes in farmland ecosystems distributed in Gaoping, Lingchuan, Yangcheng, and Henan alluvial plain areas of Jincheng City, and can promptly capture the speed and trend of encroachment of construction land expansion on cropland ecosystems in the urbanization process. This provides targeted and detailed data support for regional ecological studies in different terrains.
At present, the landscape pattern index method and the ecosystem service value assessment method are often used in ecosystem pattern studies. Compared with the analyses of change magnitude, change rate, and attitude of motivation used in our study, the landscape pattern index method focuses on analyzing changes in ecosystem patterns from the perspective of spatial structure, with attention to the spatial relationships and distribution patterns among different landscape elements. It has unique advantages for studying landscape fragmentation and connectivity. However, it is relatively insufficient for revealing the dynamic process of ecosystem change and the causes of change. Our study focuses on the changes in the ecosystem pattern of the Qin River Basin over different periods of time, with a greater emphasis on the temporal dimension, while the analysis of the magnitude of change, the rate of change and the attitude of motivation focuses more on reflecting the ecosystem changes from the perspective of quantitative and temporal changes. Therefore, the approach taken in this study is more helpful in analyzing the trend and rate of change and can better explore the drivers of ecosystem change by combining it with other socio-economic data, for example. The ecosystem services valuation approach focuses on reflecting the importance and changes in ecosystems by placing an economic value on the various services provided by ecosystems. It emphasizes the contribution of ecosystems to the economic value of human society and is more likely to draw the attention of policymakers and the public to ecological protection. However, there are more subjective factors and uncertainties in its assessment process, and different assessment methods and parameter choices may lead to large differences in results. We use conventional magnitude of change, rate of change, and mobility analyses that focus more on changes in the state of the ecosystem itself and do not directly address the assessment of economic values. We are more objective and direct, and can accurately reflect the actual changes in the ecosystem and provide basic data for scientific research and management of the Qin River Basin.

4.2. Driver Analysis

Agricultural development was the primary driver of ecosystem change in the Qin River Basin, with a contribution of 45.03%, resulting in the alteration of an ecosystem area of 1787.83 km2. During the period 1990–2000, the area of farmland ecosystems increased as a result of the conversion of grassland and woodland. This may be attributed to the need for agricultural development at that time, which prompted the reclamation of wasteland and woodland in order to expand the area of cultivated land for food production. However, the decrease in the area of agro-ecosystems in 2000–2010 and in 2010–2020 is transformed mainly towards grasslands and towns. This reflects a change in the weight of agriculture in regional development with the restructuring of the economy. At the same time, urbanization is accelerating, encroaching on some farmland. This increasing and decreasing trend indicates that agricultural development has gone through different stages of development in the evolution of the ecosystem pattern in the Qin River Basin, which has had a complex and continuous impact on the ecosystem.
Ecological conservation and restoration contributed 36.50%. This has transformed 1449.22 km2 of ecosystems and has been an important driver. In 1990–2000, the interconversion between grasslands and forests was more pronounced. This may be a dynamic equilibrium adjustment within the ecosystem under natural restoration and human intervention. Subsequently, from 2000 to 2010, grassland and forest areas increased through the conversion of agro-ecosystems. This shows that the implementation of ecological protection policies is beginning to bear fruit, such as the return of farmland to forests and grasslands, and other measures are beginning to work, which improves the quality of the ecological environment in the watershed. The area of grassland and forest has been reduced by urban construction from 2010 to 2020. However, on the whole, ecological protection and restoration have played a positive role in reversing and improving the evolution of the ecosystem pattern of the Qin River Basin, which is of great significance in maintaining the regional ecological balance.
The contribution of urbanization development was 18.47%, which led to changes in the ecosystem of 733.38 km2. The area of urban ecosystems continued to increase between 1990–2000 and 2010–2020. The growth rate accelerated, especially in 2010–2020. This is in line with the trend of accelerated urbanization in the country as a whole. Urbanization continues to encroach on ecological land such as forest land, grassland, and cropland, changing the original pattern of the ecosystem. Although the contribution of urbanization construction to ecosystem change is relatively low, the continued expansion has had a non-negligible impact on the ecological security pattern of the Qin River Basin, such as fragmentation of ecological habitats and reduction in biodiversity may follow.
In terms of drivers, we quantified the main contribution of agricultural exploitation (45.03%) and ecological protection and restoration (36.50%) to the evolution of ecosystems, while the contribution of urbanization was relatively small (18.47%). This result differs from studies in the Loess Plateau region, which found that ecological conservation measures played a more significant role in the region. This difference may stem from differences in policy implementation efforts and ecological response mechanisms in different regions. In the Loess Plateau region, large-scale ecological restoration projects (e.g., returning farmland to forests and grasslands) have been effectively implemented, which significantly contributed to the increase in vegetation cover and ecosystem recovery [49]. In contrast, the ecological conservation measures in the Qin River Basin may have been relatively weak in terms of the scope and intensity of implementation, resulting in a smaller contribution to ecosystem evolution. At the same time, we also noted differences in other similar studies on the rate of ecosystem evolution. A study of the middle reaches of the Yangtze River found that the rate of ecosystem evolution in the region was significantly higher than in the Yellow River Basin. This may be related to natural conditions such as precipitation, soil fertility, and socio-economic factors such as higher levels of economic development and population density in the Yangtze River Basin. In the Yangtze River Basin, natural conditions are favorable and human activities are more intensive, which leads to more frequent and intense disturbances to the ecosystem, thus contributing to rapid changes in the ecosystem pattern [50].
In this study, we determined the driving forces and their contribution by analyzing changes in ecosystem area. Although this method can visualize the changes in ecosystem patterns, it has some limitations. For example, the interactions and feedback mechanisms between the drivers are not sufficiently taken into account. Agricultural development may affect the urbanization process. Ecological protection and restoration may also have indirect impacts on agriculture and urbanization. These complex relationships were not explored in depth in this study. In addition, although we know that anthropogenic factors are dominant, the influence of natural factors such as climate change on the evolution of the ecosystem pattern of the Qin River Basin should not be neglected, and the subsequent study can be further improved. Future research can adopt more complex models and methods, such as the system dynamics model, to comprehensively consider the interrelationships of multiple factors and deeply analyze the intrinsic mechanism of the evolution of the ecosystem pattern in the Qin River Basin. This will provide a more comprehensive and accurate scientific basis for regional ecological protection and sustainable development.

5. Conclusions

This study systematically analyzed the spatial and temporal dynamics of the ecosystem pattern and its driving mechanism in the Qin River Basin of the middle reaches of the Yellow River from 1990 to 2020 and clarified the characteristics of the ecosystem evolution and the main driving force in the region. This study provides a valuable theoretical basis and practical guidance for the ecological protection and high-quality development of the Yellow River Basin.
(1) This study comprehensively reveals the characteristics of the evolution of the ecosystem pattern in the Qin River Basin. We quantitatively analyzed the changes in area, dynamic intertransferences, and the overall trend and rate of change in the ecosystem pattern of each land use type during the study period. The spatial differentiation characteristics of ecosystem evolution were clarified. This provides a detailed database for an in-depth understanding of the dynamic evolution of the region’s ecosystems. The study found that the net decrease in the area of woodland, cropland, and wetland contrasted sharply with the expansion of grassland and built-up land. There is also an obvious dynamic intertransfer between forest land and grassland, which provides a key entry point for further exploration of the ecosystem evolution mechanism.
(2) This study reveals the core evolution characteristics of the Qin River Basin ecosystem from 1990 to 2020: the ratio of agricultural land to forested land reaches 74.81%; the areas of forested land, cultivated land, and wetland decrease by 13.74%, 6.60%, and 38.64%, respectively; and the areas of grassland (+43.34%) and built-up land (+116.63%) expand significantly. At the same time, we clarified the dynamic intertransfer relationship between forest land and grassland (1140.47 km2 of forest land to grassland, 567.73 km2 of grassland to forest land) and the conversion scale of cropland urbanization and deeply analyzed the driving mechanism of ecosystem evolution. Through the quantitative analysis of the contribution rate of driving forces, we clarified the dominant role of anthropogenic factors (agricultural development 45.03%, ecological protection and restoration 36.50%, and urbanization 18.47%) on the ecosystem pattern. Meanwhile, we clarified the characteristics of the first-increasing and then-decreasing impacts of agricultural development, the positive reversal and improvement of ecological protection and restoration, and the continuous expansion of the impacts of urbanization, which provided a scientific basis for the development of targeted ecological management strategies. This study also points out the direction of future research in considering the interaction of driving forces and the influence of natural factors, which provides a reference for exploring the intrinsic mechanism of ecosystem evolution in depth.
(3) This study optimizes the system of methods for analyzing changes in ecosystem patterns. The analytical methods of change magnitude, rate of change, and attitude of motivation that we adopted can reflect the trend and speed of ecosystem pattern change in the Qin River Basin more intuitively and objectively compared with the landscape pattern index method and ecosystem service value assessment method. This provides new and more applicable analytical tools and methodological ideas for regional ecological research and helps to improve the accuracy and reliability of ecosystem evolution studies.
(4) This study proposes targeted and operational integrated watershed management strategies. Based on our findings, we emphasize the importance of scientific land use optimization, controlled urban sprawl, and systematic ecological restoration. This provides concrete practical guidance for enhancing the landscape stability of the Qin River Basin and helps to promote the synergy between ecological conservation and sustainable development in the region.

Author Contributions

Conceptualization, Y.L., S.W. and M.Z.; methodology, Y.B. and J.P.; software, Z.W.; validation, M.L. and P.S.; formal analysis, Z.W.; investigation, N.Z. and K.X.; resources, Z.W.; data curation, Z.W. and Y.B.; writing—original draft preparation, Y.L.; writing—review and editing, Y.B.; supervision, J.P. All authors have read and agreed to the published version of the manuscript.

Funding

This research was funded by the Open Project Program of Hebei Center for Ecological and Environmental Geology Research (JSYF-202206 and JSYF-202406). The investigation was also financially supported by the Geological Survey Project of Ecological Protection and Restoration in the Middle Reach of the Black River Region (DD20211573 and DD20242705).

Institutional Review Board Statement

Not applicable.

Informed Consent Statement

Not applicable.

Data Availability Statement

Data is contained within the article.

Acknowledgments

We thank Yuze Bai, Siyuan Wang, and Mingdong Zang for their assistance during the study. We are grateful to the reviewers and editors for their constructive comments, which have substantially improved the manuscript.

Conflicts of Interest

The authors declare no conflicts of interest.

References

  1. Cantonati, M.; Stevens, L.E.; Segadelli, S.; Springer, A.E.; Goldscheider, N.; Celico, F.; Filippini, M.; Ogata, K.; Gargini, A. Ecohydrogeology: The interdisciplinary convergence needed to improve the study and stewardship of springs and other groundwater-dependent habitats, biota, and ecosystems. Ecol. Indic. 2020, 110, 105803. [Google Scholar] [CrossRef]
  2. Johnson, K.G.; Budd, A.F.; Stemann, T.A. Extinction selectivity and ecology of Neogene Caribbean reef corals. Paleobiology 2016, 21, 52–73. [Google Scholar] [CrossRef]
  3. Luyi, M.; Xiaokang, L.; Arnaud, B.; Dieter, K.; Xu, D.; Haijun, S. Morphological complexity promotes origination and extinction rates in ammonoids. Curr. Biol. 2024, 34, 5587–5594.e2. [Google Scholar] [CrossRef]
  4. Pearce, E.A.; Mazier, F.; Fyfe, R.; Davison, C.W.; Normand, S.; Serge, M.-A.; Scussolini, P.; Svenning, J.-C. Higher abundance of disturbance-favoured trees and shrubs in European temperate woodlands prior to the late-quaternary extinction of megafauna. J. Ecol. 2024, 112, 2813–2827. [Google Scholar] [CrossRef]
  5. Hrysiewicz, A.; Williamson, J.; Evans, C.D.; Jovani-Sancho, A.J.; Callaghan, N.; Lyons, J.; White, J.; Kowalska, J.; Menichino, N.; Holohan, E.P. Estimation and validation of InSAR-derived surface displacements at temperate raised peatlands. Remote Sens. Environ. 2024, 311, 114232. [Google Scholar] [CrossRef]
  6. Petty, J.T.; Fulton, J.B.; Strager, M.P.; Merovich, G.T., Jr.; Stiles, J.M.; Ziemkiewicz, P.F. Landscape indicators and thresholds of stream ecological impairment in an intensively mined Appalachian watershed. J. N. Am. Benthol. Soc. 2010, 29, 1292–1309. [Google Scholar] [CrossRef]
  7. Cianciolo, T.R.; McLaughlin, D.L.; Zipper, C.E.; Timpano, A.J.; Soucek, D.J.; Schoenholtz, S.H. Impacts to water quality and biota persist in mining-influenced Appalachian streams. Sci. Total Environ. 2020, 717, 137216. [Google Scholar] [CrossRef]
  8. Leitner, P.; Borgwardt, F.; Birk, S.; Graf, W. Multiple stressor effects on benthic macroinvertebrates in very large European rivers—A typology-based evaluation of faunal responses as a basis for future bioassessment. Sci. Total Environ. 2021, 756, 143472. [Google Scholar] [CrossRef]
  9. Costas, N.; Pardo, I.; Mendez-Fernandez, L.; Martinez-Madrid, M.; Rodriguez, P. Sensitivity of macroinvertebrate indicator taxa to metal gradients in mining areas in Northern Spain. Ecol. Indic. 2018, 93, 207–218. [Google Scholar] [CrossRef]
  10. Dias, H.Q.; Sukumaran, S.; Neetu, S.; Ridha, H. Benthic community resilience in two differently impacted tropical estuaries: Taxonomic vs functional approaches. J. Environ. Manag. 2022, 324, 116264. [Google Scholar] [CrossRef]
  11. Korolev, V.A.; Buslaeva, O.V. A system of proper environmental geology categories. Mosc. Univ. Geol. Bull. 2012, 67, 298–307. [Google Scholar] [CrossRef]
  12. Trofimov, V.T. Ecological geology, environmental geology, geoecology: Contents and relations. Mosc. Univ. Geol. Bull. 2008, 63, 59–69. [Google Scholar] [CrossRef]
  13. Trofimov, V.T.; Balykova, S.D.; Nikolaeva, S.K. Engineering and Ecological Geology at Moscow State University in the 2008–2017 Period (to the 80th Anniversary of the Chair of Engineering and Ecological Geology). Mosc. Univ. Geol. Bull. 2018, 73, 1–12. [Google Scholar] [CrossRef]
  14. Peng, J.; Shen, Z.; Zhang, W.; Song, W. Deep-Learning-Enhanced CT Image Analysis for Predicting Hydraulic Conductivity of Coarse-Grained Soils. Water 2023, 15, 2623. [Google Scholar] [CrossRef]
  15. Marquez, C.O.; Garcia, V.J.; Schultz, R.C.; Isenhart, T.M. A conceptual framework to study soil aggregate dynamics. Eur. J. Soil Sci. 2019, 70, 466–479. [Google Scholar] [CrossRef]
  16. Zhang, C.; Liu, Z.; Deng, P. Contact angle of soil minerals: A molecular dynamics study. Comput. Geotech. 2016, 75, 48–56. [Google Scholar] [CrossRef]
  17. Zhang, Z.; Furman, A. Soil redox dynamics under dynamic hydrologic regimes—A review. Sci. Total Environ. 2021, 763, 143026. [Google Scholar] [CrossRef]
  18. Guo, X.-Y.; Li, J.; Jia, Y.-H.; Yuan, G.-L.; Zheng, J.-L.; Liu, Z.-J. Geochemistry Process from Weathering Rocks to Soils: Perspective of an Ecological Geology Survey in China. Sustainability 2023, 15, 1002. [Google Scholar] [CrossRef]
  19. Callow, J.N.; Hipsey, M.R.; Vogwill, R.I.J. Surface water as a cause of land degradation from dryland salinity. Hydrol. Earth Syst. Sci. 2020, 24, 717–734. [Google Scholar] [CrossRef]
  20. Smith, J.D.; Koenig, L.E.; Sleckman, M.J.; Appling, A.P.; Sadler, J.M.; DePaul, V.T.; Szabo, Z. Predictive Understanding of Stream Salinization in a Developed Watershed Using Machine Learning. Environ. Sci. Technol. 2024, 58, 18822–18833. [Google Scholar] [CrossRef]
  21. Zhang, S.; Xiong, K.; Min, X.; Zhu, D. Vegetation vulnerability in karst desertification areas is related to land-atmosphere feedback induced by lithology. Catena 2024, 247, 108542. [Google Scholar] [CrossRef]
  22. Wang, Q.; Xiong, K.; Zhou, J.; Xiao, H.; Song, S. Impact of land use and land cover change on the landscape pattern and service value of the village ecosystem in the karst desertification control. Front. Environ. Sci. 2023, 11, 1020331. [Google Scholar] [CrossRef]
  23. D’Ettorre, U.S.; Liso, I.S.; Parise, M. Desertification in karst areas: A review. Earth-Sci. Rev. 2024, 253, 104786. [Google Scholar] [CrossRef]
  24. Korolev, V.A.; Trofimov, V.T. The Development of a General Classification of Continental Ecological-Geological Systems. Mosc. Univ. Geol. Bull. 2022, 77, 211–219. [Google Scholar] [CrossRef]
  25. Chen, Q.; Ning, Y. Projecting LUCC dynamics and ecosystem services in an emerging urban agglomeration under SSP-RCP scenarios and their management implications. Sci. Total Environ. 2024, 949, 175100. [Google Scholar] [CrossRef] [PubMed]
  26. Giovannelli, D.; Barry, P.H.; de Moor, J.M.; Jessen, G.L.; Schrenk, M.O.; Lloyd, K.G. Sampling across large-scale geological gradients to study geosphere-biosphere interactions. Front. Microbiol. 2022, 13, 998133. [Google Scholar] [CrossRef]
  27. Zoelch, T.; Wamsler, C.; Pauleit, S. Integrating the ecosystem-based approach into municipal climate adaptation strategies: The case of Germany. J. Clean. Prod. 2018, 170, 966–977. [Google Scholar] [CrossRef]
  28. Plakidas, K.; Schall, D.; Zdun, U. Evolution of the R software ecosystem: Metrics, relationships, and their impact on qualities. J. Syst. Softw. 2017, 132, 119–146. [Google Scholar] [CrossRef]
  29. Wang, J.; He, T.; Lin, Y. Changes in ecological, agricultural, and urban land space in 1984-2012 in China: Land policies and regional social-economical drivers. Habitat Int. 2018, 71, 1–13. [Google Scholar] [CrossRef]
  30. Cheng, M.; Huang, B.; Kong, L.; Ouyang, Z. Ecosystem Spatial Changes and Driving Forces in the Bohai Coastal Zone. Int. J. Environ. Res. Public Health 2019, 16, 536. [Google Scholar] [CrossRef]
  31. Liao, Z.; Su, K.; Jiang, X.; Zhou, X.; Yu, Z.; Chen, Z.; Wei, C.; Zhang, Y.; Wang, L. Ecosystem and Driving Force Evaluation of Northeast Forest Belt. Land 2022, 11, 1306. [Google Scholar] [CrossRef]
  32. Ma, G.; Li, Q.; Yang, S.; Zhang, R.; Zhang, L.; Xiao, J.; Sun, G. Analysis of Landscape Pattern Evolution and Driving Forces Based on Land-Use Changes: A Case Study of Yilong Lake Watershed on Yunnan-Guizhou Plateau. Land 2022, 11, 1276. [Google Scholar] [CrossRef]
  33. Gao, Z.-Q.; Bai, Y.-P.; Zhou, L.; Qiao, F.-W.; Song, L.-J.; Chen, X.-N. Characteristics and driving forces of wetland landscape pattern evolution of the city belt along the Yellow River in Ningxia, China. Ying Yong Sheng Tai Xue Bao J. Appl. Ecol. 2020, 31, 3499–3508. [Google Scholar] [CrossRef]
  34. Guarderas, P.; Smith, F.; Dufrene, M. Land use and land cover change in a tropical mountain landscape of northern Ecuador: Altitudinal patterns and driving forces. PLoS ONE 2022, 17, e0260191. [Google Scholar] [CrossRef]
  35. Peng, J.; Zhao, M.; Guo, X.; Pan, Y.; Liu, Y. Spatial-temporal dynamics and associated driving forces of urban ecological land: A case study in Shenzhen City, China. Habitat Int. 2017, 60, 81–90. [Google Scholar] [CrossRef]
  36. Sun, M.-H.; Niu, W.-H.; Zhang, B.-B.; Geng, Q.-L.; Yu, Q. Spatial-temporal evolution and responses of ecosystem service value under land use change in the Yellow River Basin: A case study of Shaanxi-Gansu-Ningxia region, Northwest China. Ying Yong Sheng Tai Xue Bao J. Appl. Ecol. 2021, 32, 3913–3922. [Google Scholar] [CrossRef]
  37. Su, K.; Liu, H.; Wang, H. Spatial-Temporal Changes and Driving Force Analysis of Ecosystems in the Loess Plateau Ecological Screen. Forests 2022, 13, 54. [Google Scholar] [CrossRef]
  38. Yang, L.; Liu, F. Spatio-Temporal Evolution and Driving Factors of Ecosystem Service Value of Urban Agglomeration in Central Yunnan. Sustainability 2022, 14, 10823. [Google Scholar] [CrossRef]
  39. Pan, Z.; Gao, G.; Fu, B. Spatiotemporal changes and driving forces of ecosystem vulnerability in the Yangtze River Basin, China: Quantification using habitat-structure-function framework. Sci. Total Environ. 2022, 835, 155494. [Google Scholar] [CrossRef]
  40. Zhou, L.; Wang, L.; Su, K.; Bi, G.; Chen, H.; Liu, X.; Yang, Q. Spatiotemporal Characteristics of Rural Restructuring Evolution and Driving Forces in Mountainous and Hilly Areas. Land 2022, 11, 848. [Google Scholar] [CrossRef]
  41. Shao, M.; Wu, L.; Li, F.; Lin, C. Spatiotemporal Dynamics of Ecosystem Services and the Driving Factors in Urban Agglomerations: Evidence From 12 National Urban Agglomerations in China. Front. Ecol. Evol. 2022, 10, 804969. [Google Scholar] [CrossRef]
  42. Zhang, M.; Du, H.; Zhou, G.; Mao, F.; Li, X.; Zhou, L.; Zhu, D.; Xu, Y.; Huang, Z. Spatiotemporal Patterns and Driving Force of Urbanization and Its Impact on Urban Ecology. Remote Sens. 2022, 14, 1160. [Google Scholar] [CrossRef]
  43. Yang, L.; Sun, Z.; Li, J.; Shi, L.; Kong, H.; Yang, Y.; Li, T. Spatiotemporal patterns and driving forces of land-use and land-cover change in the Mu Us Sandy Land, China from 1980 to 2018. Arid. Land Res. Manag. 2022, 36, 109–124. [Google Scholar] [CrossRef]
  44. He, C.; Shao, H.; Xian, W. Spatiotemporal Variation and Driving Forces Analysis of Eco-System Service Values: A Case Study of Sichuan Province, China. Int. J. Environ. Res. Public Health 2022, 19, 8595. [Google Scholar] [CrossRef]
  45. Wang, Z.; Zhao, H.; Zhao, C. Temporal and Spatial Evolution Characteristics of Land Use and Landscape Pattern in Key Wetland Areas of the West Liao River Basin, Northeast China. J. Environ. Eng. Landsc. Manag. 2022, 30, 195–205. [Google Scholar] [CrossRef]
  46. Zhang, X.; Li, H.; Xia, H.; Tian, G.; Yin, Y.; Lei, Y.; Kim, G. The Ecosystem Services Value Change and Its Driving Forces Responding to Spatio-Temporal Process of Landscape Pattern in the Co-Urbanized Area. Land 2021, 10, 1043. [Google Scholar] [CrossRef]
  47. Li, Z.; Liu, M.; Hu, Y.; Xue, Z.; Sui, J. The spatiotemporal changes of marshland and the driving forces in the Sanjiang Plain, Northeast China from 1980 to 2016. Ecol. Process. 2020, 9, 24. [Google Scholar] [CrossRef]
  48. Chang, S.; Wei, Y.; Dai, Z.; Xu, W.; Wang, X.; Duan, J.; Zou, L.; Zhao, G.; Ren, X.; Feng, Y. Landscape ecological risk assessment and its driving factors in the Weihe River basin, China. J. Arid Land 2024, 16, 603–614. [Google Scholar] [CrossRef]
  49. Tang, Z.; Zhou, Z.; Wang, D.; Luo, F.; Bai, J.; Fu, Y. Impact of vegetation restoration on ecosystem services in the Loess plateau, a case study in the Jinghe Watershed, China. Ecol. Indic. 2022, 142, 109183. [Google Scholar] [CrossRef]
  50. Du, H.; Wu, J.; Li, W.; Wan, Y.; Yang, M.; Feng, P. Temporal-Spatial Characteristics and Trade-off-Synergy Relationships of Water-Related Ecosystem Services in the Yangtze River Basin from 2001 to 2021. Sustainability 2024, 16, 3605. [Google Scholar] [CrossRef]
Figure 1. (a) The study area is distributed in the Loess Plateau; (b) ecosystem distribution map of the study area; (c) terrain map of study area.
Sustainability 17 06199 g001
Figure 2. (a) The 1990 of Ecosystem distribution map of the Qin River Basin; (b) the 2000 of Ecosystem distribution map of the Qin River Basin; (c) the 2010 of Ecosystem distribution map of the Qin River Basin; (d) the 2020 of Ecosystem distribution map of the Qin River Basin.
Sustainability 17 06199 g002
Figure 3. (a) Changes in forestland ecosystem pattern from 1990 to 2020; (b) changes in grassland ecosystem pattern from 1990 to 2020; (c) changes in wetland ecosystem pattern from 1990 to 2020; (d) changes in farmland ecosystem pattern from 1990 to 2020; (e) changes in urban construction land ecosystem pattern from 1990 to 2020; (f) changes in vegetation coverage pattern from 1990 to 2020.
Sustainability 17 06199 g003aSustainability 17 06199 g003b
Figure 4. Magnitude of ecosystem type change in the Qin River Basin from 1990 to 2020.
Sustainability 17 06199 g004
Figure 5. Rate of ecosystem type change in the Qin River Basin, 1990–2020.
Sustainability 17 06199 g005
Figure 6. Changes in ecosystem transfer in the Qin River Basin from 1990 to 2020.
Sustainability 17 06199 g006
Table 1. Data sources.
No.Data TypeData SourceData Precision
1ForestData Center for Resources and Environmental Sciences, Chinese Academy of Sciences
Remote sensing monitoring data of land use/land cover in China over multiple periods
83.21%
2Grassland88.33%
3Wetland92.28%
4Farmland89.04%
5Urban97.44%
6Other 91.37%
Table 2. Ecosystem area and proportion of the Qin River Basin.
Ecosystem
Types
1990200020102020
Area
(km2)
ProportionArea
(km2)
ProportionArea
(km2)
ProportionArea
(km2)
Proportion
FL 15243.4438.61%5358.7039.46%5211.5138.37%4897.3236.06%
FE 26101.2544.93%5273.5338.83%5277.0538.86%5262.8938.75%
GE 31760.1512.96%2490.5718.34%2540.1918.70%2523.0118.58%
UE 4390.442.87%438.053.23%528.053.89%845.806.23%
WE 584.160.62%19.830.15%23.850.18%51.640.38%
OE 61.460.01%0.310.00%0.330.00%0.310.00%
1 Farmland Ecosystem; 2 Forest Ecosystem; 3 Grassland Ecosystem; 4 Urban Ecosystem; 5 Wetland Ecosystem; 6 Other land Ecosystem.
Table 3. Ecosystem area transfer matrix in the Qin River Basin from 1990 to 2020.
TimeTypologyGrasslandFarmlandBare GroundForestWetlandHomeTotal
1990–2000Grassland786.43548.580.031140.4710.274.782490.55
Farmland400.804150.481.33611.4659.04135.545358.65
Bare ground0.000.020.000.290.000.000.31
Forest567.73358.370.104341.024.192.115273.51
Wetland1.135.430.003.519.420.3319.83
Home4.06180.570.004.491.23247.68438.04
Total1760.155243.441.466101.2484.16390.4413,580.98
2000–2010Grassland2107.13133.090.01297.082.110.772540.19
Farmland81.194965.590.0083.517.3174.045211.65
Bare ground0.020.000.120.190.000.000.33
Forest297.9789.070.174888.750.860.235277.05
Wetland2.0411.030.001.389.290.1123.85
Home2.22159.910.002.620.25362.90527.90
Total2490.575358.690.315273.5319.83438.0413,580.98
2010–2020Grassland1919.18150.470.02450.531.391.432523.01
Farmland136.524563.720.00133.515.4958.094897.32
Bare ground0.000.000.030.280.000.000.31
Forest458.99120.940.284682.100.310.295262.89
Wetland8.3821.190.015.3316.320.4151.64
Home17.13355.350.005.310.34467.68845.80
Total2540.195211.650.335277.0523.85527.9013,580.98
Vertical columns represent the previous cycle, and horizontal rows represent the next cycle.
Table 4. Statistics of ecosystem area changes in the Qin River Basin under the driving force from 1990 to 2020.
ProjectsUrbanizationAgricultural DevelopmentEcological Protection and Restoration
Changes in ecosystem areaGrassland23.41618.51/
Farmland695.83/1071.30
Bare ground0.001.330.00
Forest12.42828.48/
Wetland1.8284.650.00
Home/267.67377.92
Total733.481787.831449.22
Contribution rate18.47%45.03%36.50%
Disclaimer/Publisher’s Note: The statements, opinions and data contained in all publications are solely those of the individual author(s) and contributor(s) and not of MDPI and/or the editor(s). MDPI and/or the editor(s) disclaim responsibility for any injury to people or property resulting from any ideas, methods, instructions or products referred to in the content.

