Article

Microwave-Assisted Pyrolysis of Polyethylene and Polypropylene from End-of-Life Vehicles: Hydrogen Production and Energy Valorization

by
Grigore Psenovschi
1,2,
Ioan Calinescu
1,*,
Alexandru Fiti
3,
Ciprian-Gabriel Chisega-Negrila
1,
Sorin-Lucian Ionascu
4,5 and
Lucica Barbes
4,6,*
1
Faculty of Chemical Engineering and Biotechnologies, National University of Science and Technology Politehnica of Bucharest, 011061 Bucharest, Romania
2
National Institute for Research & Development in Chemistry and Petrochemistry (ICECHIM), 060021 Bucharest, Romania
3
Daily Sourcing & Research SRL, 011061 Bucharest, Romania
4
Doctoral School of Biotechnical Systems Engineering, National University of Science and Technology Politehnica of Bucharest, 060042 Bucharest, Romania
5
Faculty of Mechanical, Industrial and Maritime Engineering, “Ovidius” University of Constanța, 900527 Constanta, Romania
6
Faculty of Applied Sciences and Engineering, “Ovidius” University of Constanța, 900527 Constanta, Romania
*
Authors to whom correspondence should be addressed.
Sustainability 2025, 17(13), 6196; https://doi.org/10.3390/su17136196
Submission received: 20 May 2025 / Revised: 30 June 2025 / Accepted: 4 July 2025 / Published: 6 July 2025
(This article belongs to the Special Issue Novel and Scalable Technologies for Sustainable Waste Management)

Abstract

Plastic waste is currently a major concern in Romania due to the annual increase in quantities generated from anthropogenic and industrial activities, especially from end-of-life vehicles (ELVs), and the need to reduce environmental impact. This study investigates an alternative valorization route for polypropylene (PP) and polyethylene (PE) plastic waste through microwave-assisted pyrolysis, aiming to maximize conversion into gaseous products, particularly hydrogen-rich gas. A monomode microwave reactor was employed, using layered configurations of plastic feedstock, silicon carbide as a microwave susceptor, and activated carbon as a catalyst. The influence of catalyst loading, reactor configuration, and plastic type was assessed through systematic experiments. Results showed that technical-grade PP, under optimal conditions, yielded up to 81.4 wt.% gas with a hydrogen concentration of 45.2 vol.% and a hydrogen efficiency of 44.8 g/g. In contrast, PE and mixed PP + PE waste displayed lower hydrogen performance, particularly when containing inorganic fillers. For all types of plastics studied, the gaseous fractions obtained have a high calorific value (46,941–55,087 kJ/kg) and at the same time low specific CO2 emissions (4.4–6.1 × 10⁻⁵ kg CO2/kJ), which makes these fuels very efficient and have a low carbon footprint. Comparative tests using conventional heating revealed significantly lower hydrogen yields (4.77 vs. 19.7 mmol/g plastic). These findings highlight the potential of microwave-assisted pyrolysis as an efficient method for transforming ELV-derived plastic waste into energy carriers, offering a pathway toward low-carbon, resource-efficient waste management.

1. Introduction

Plastic materials, considered a revolutionary innovation of the 20th century, have now become a significant environmental threat. As a result, plastic waste management has become a critical global challenge, requiring sustainable, long-term solutions. The European Union’s 2050 strategy aims to implement comprehensive initiatives to address major public interest challenges related to the sustainable integration of plastic materials into the circular economy [1]. However, it is important to note that in Europe, plastic waste is currently managed without a focus on the differentiated recovery of polymers [2,3].
In Romania, since the adoption of Directive 2000/53/EC, slow progress has been made in managing waste from end-of-life vehicles (ELVs) [4,5]. ELVs have reached the end of their operational life due to aging, mechanical failure, or accidents. Once no longer functional, ELVs become hazardous waste, contributing to environmental degradation through rusting, fluid leakage, decomposition, and excessive landfill use. Therefore, ELVs must be dismantled and processed for the recovery of reusable parts, material recycling, or energy recovery. This task is complex because each vehicle contains approximately 30,000 components made of various materials. According to 2006 data from a Romanian study [6], ELVs comprised 70–74% metals (68% ferrous, 6% non-ferrous) and 26–30% non-metallic materials, including plastics, elastomers, glass, fluids, and electronics. More data from 2007 and 2015 reveal significant changes in composition [7]: steel content decreased from 66.3% to 61.4%; non-ferrous metals increased from 7.8% to 11.6%; plastics rose from 13.8% to 16.0%, reflecting a broader trend toward lightweight construction materials; and other components (e.g., elastomers, glass, and liquids) showed only minor variations, remaining relatively constant over time. These developments underscore the growing complexity of ELV recycling processes and the need for flexible, efficient recovery technologies. Most research studies have focused on developing technologies for the separation, recovery, and reuse of ferrous and non-ferrous materials, with less emphasis on the reuse, recycling, and energy recovery of polymer materials found in various automotive components, which are either reassembled as individual parts or mixed [8]. A significant amount of plastic waste is generated during vehicle dismantling. On average, a car contains around 200 kg of plastic [9]. There are many types of plastics used, but the most common are PP (24.5%) and PE + PP mixtures (20.3%) [9].
Recycling plastic components obtained from end-of-life vehicle (ELV) dismantling involves mechanical and chemical methods, each with its own advantages and specific limitations. Mechanical recycling, the most used method, includes sorting, shredding, and granulating plastic. However, this process can lead to the degradation of the material’s properties, limiting its use in products with strict performance requirements [2,10]. Chemical recycling, on the other hand, allows for the conversion of plastic waste into secondary raw materials, such as synthetic oils or monomers [10], which can be used in the production of new polymers, thus reducing dependence on fossil fuels [11,12], as well as for energy purposes. Chemical recycling of plastic waste can separate combustible gas fractions, liquid fractions similar to those obtained from oil processing, and small amounts of solid residues (char) with lower energy significance [13].
The chemical recycling processes for plastics that currently yield the best results are those based on pyrolytic processes (generally carried out at 400–600 °C and without air) [14]. Additionally, by integrating microwave-generating systems (microwave-induced pyrolysis), improvements can be produced in both energy consumption and operating costs [15,16]. In Europe, a diverse range of plastic waste recycling and energy recovery processes is applied [17,18,19,20,21,22,23,24,25,26]. These methods are summarized in Table 1, highlighting the target plastic types, typical temperature ranges, and main outputs. Today, landfilling is globally seen as the dominant treatment method for plastic waste. This situation will change in the next 20–30 years, as plastic waste will become both a source of raw materials for the chemical industry and an energy supplier [21].
Pyrolysis typically requires more energy than depolymerization with water under supercritical conditions because it involves a phase change, and the process operates at high temperatures (sometimes exceeding 800 °C). This process results in low yields of energy-rich compounds if operated without catalysts, and the oil generated from pyrolysis requires further processing, resulting in high overall costs. Various catalysts are added to improve conversion, fuel product quality, and selectivity, and reduce temperature and reaction time in the pyrolysis process [16,22,23]. Activated carbon (AC)’s high surface area and porosity promote secondary reactions. Its thermal stability and hydrogen-donor properties further enhance light hydrocarbon formation [29,30,31]. Experimental studies have shown that the optimum temperature for catalytic degradation using activated carbon is around 450 °C, achieving higher conversion efficiency compared to thermal pyrolysis alone. The addition of activated carbon to polypropylene pyrolysis affects the composition and yield of the resulting hydrocarbons. Compared to non-catalytic pyrolysis, the presence of AC tends to increase the formation of liquid hydrocarbons (pyrolysis oils) by enhancing secondary cracking of heavy volatiles; reduce char formation by preventing polymer crosslinking; improve gaseous hydrocarbon selectivity by promoting dehydrogenation and gas-phase reactions [30,31]. The pore structure and surface functionalization of AC play a crucial role in determining aromatic hydrocarbon formation. Research suggests that H3PO4-activated carbon enhances the production of aromatics and fuel-range hydrocarbons, making it a promising catalyst for obtaining high-value chemical feedstocks. The catalytic performance of AC is further influenced by reactor configuration, feedstock composition, and pyrolysis operating conditions [32].
Microwave-assisted plastics pyrolysis has been researched on a laboratory scale [33,34,35] or pilot scale [36]. The use of microwaves is advantageous because it enables high heating rates (60–80 °C/min), improved process control, and increased production speed [37].
However, there are also several challenges:
  • Ordinary plastics (PE, PP) have dielectric properties that do not allow them to convert microwave energy into heat (loss tangent = 0.001–0.002). For this reason, it is mandatory to use compounds that absorb microwave energy very well and allow the heating of the reaction mixture, such as silicon carbide (tan δ = 0.25−0.37), activated carbon (tan δ = 0.31−0.9), or ferric oxide (tan δ = 0.199) [37];
  • The depth of penetration of microwaves in the mixture of materials subjected to pyrolysis is limited to a few tens of cm. For this reason, pyrolysis reactors are small: laboratory-scale reactors are typically made of quartz while pilot-scale reactors operate continuously but with relatively low flow rates—around 10 kg/h [36].
Despite these limitations, microwave-assisted pyrolysis can lead to high yield in gas fraction due to the high heating rate and pyrolysis temperature that can be easily set to 600–700 °C [34,37,38].
Polypropylene, a polymer that can constitute between 15% and 35% of the total mass of plastic materials used in the manufacture of automobiles, has shown a particularly high potential for pyrolysis, making it a key area of interest for researchers [14,39]. PP pyrolysis, when conducted in a batch reactor, yields 49.6% gas fraction, 48.8% liquid fraction, and 1.6% solid residue, with the liquid fraction yield increasing significantly at lower temperatures [40]. The temperature applied during pyrolysis varies depending on the desired final product. Temperatures between 300 °C and 500 °C are recommended for optimal liquid fraction yields. Ejiogu et al. [41] found that by maintaining a reaction time of 90 min at approximately 260 °C, PP pyrolysis produces 89.98% liquid fraction, 6.37% gas fraction, and 3.65% char [41]. To obtain larger quantities of gas fraction, temperatures above 500°C can be applied. Furthermore, fast pyrolysis can favor the formation of gases and, consequently, solid residues, which require careful process optimization if the goal is to maximize the production of liquid fuels. Although PP pyrolysis generally does not require different catalysts compared to PE or other polymers, their use has been tested to improve and optimize the selective composition of the reaction products [16]. The gaseous fraction (syngas) resulting from pyrolysis is primarily composed of hydrogen (H2), light hydrocarbons such as methane (CH4), ethylene (C2H4), and propylene (C3H6), along with small amounts of CO and CO2. Hydrogen, with a calorific value of approximately 120 MJ/kg, represents a clean energy source and is also suitable for use in fuel cells. Methane is a valuable energy production source with a calorific value ranging between 25 and 45 MJ/kg. This saturated hydrocarbon has been reported to be obtained in the gaseous fraction of alkanes (97.7%) from the pyrolytic process of PP [42]. It is also worth mentioning the significant variability in the yield of pyrolysis products (wt.%) depending on the type of pyrolysis, reactor type, temperature pyrolysis, or heating rate (°C/min), as follows: 6.6% syngas, 13.3% char, and 80.1% oil for slow pyrolysis in a batch reactor at 380 °C with a heating rate of 3 °C/min; 30.36% syngas, 1.64% char, and 68% oil for fast pyrolysis in a micropyrolyser at 600 °C, which is comparable to zeolite-catalyzed pyrolysis, yielding 37% syngas and 63% oil with no char, using a batch reactor at a temperature of 460 °C. A higher syngas content of 55.8% was obtained in fluidized bed reactor pyrolysis, although the process temperature was significantly higher, at approximately 760 °C [16].
This study investigates the pyrolysis of polyolefins (polypropylene (PP) and polypropylene + polyethylene (PP + PE)) sourced from end-of-life vehicles (ELVs) dismantled at an automotive recycling unit in Agigea, Constanța County, Romania. The process utilizes activated carbon as a catalyst, enabling a straightforward setup with a single reactor.
Pyrolysis has been studied both in a microwave-heated reactor and in a conventional (electric) heated reactor. A microwave absorber (SiC) has also been added to the reactor to allow better heating in the microwave.
The research aimed to establish the experimental conditions that maximize hydrogen gas production during pyrolysis. The complex composition of the liquid fraction obtained from pyrolysis makes its direct use difficult, requiring complex processing. The gaseous fraction can be used as fuel in motor generators to produce electricity and heat. The high hydrogen content will lead to both an increase in calorific value and a decrease in specific CO2 emissions.
The objective of the research was to study the microwave-assisted pyrolysis of plastic waste from the dismantling of cars containing PE and PP. The difficulty of processing the liquid fraction obtained by pyrolysis is well known due to its complex composition, which requires complicated treatment only possible in a petrochemical refinery. For this reason, the goal was to develop a process that predominantly produces the gaseous fraction, with the hydrogen content in this fraction being as high as possible. Such a fraction will contain hydrogen and light hydrocarbons (C1-C6) and can be used as fuel in internal combustion engines to drive electric generators, thereby producing electricity and thermal energy with lower CO2 emissions. In this way, a plastic waste pyrolysis plant can operate independently, and the electricity and heat generated can be easily utilized. The liquid fractions will be produced in small quantities and can be sent to a refinery for processing.

2. Materials and Methods

All reagents utilized in this study were of the highest purity, suitable for analytical, chromatographic, or spectroscopic applications.
Figure 1 describes the working procedure. The reactor is loaded with layers of plastic, activated carbon, and silicon carbide, then inserted into a monomode microwave cavity. After initiating microwave heating (max. 660 °C for 10 min), the process is monitored in real-time. Gaseous and liquid products are collected and analyzed, while solid residues are weighed post-reaction. The yields and the calorific value of the gas are calculated to evaluate process efficiency.

2.1. Feedstock

Silicon carbide (SiC) (Green Silicon Carbide, 2–4 mm, Sinabuddy Mineral, Zhengzhou, China), activated carbon (AC) (Coconut Shell activated carbon 6 × 12 mesh, Legend Inc. SUA, Sparks, NV, USA). polypropylene (PP) granules (referred as PP_T), and polyethylene (LDPE MI 2) (referred as PE_T) granules were purchased from Romcolor, Copăceni, Romania [27]. Additionally, polypropylene obtained from automotive dismantling (referred to as PP_W), and two types of mixed polyolefin waste—composed of polypropylene and polyethylene—collected from car components obtained from SC Pieseauto Dez SRL, Constanta, Romania (designated as PP + PE_W1 and PP + PE_W2, respectively), were used as representative plastic waste feedstocks.

2.2. Catalyst Preparation

Activated carbon was used as the catalytic agent in varying mass concentrations, while silicon carbide (SiC) served as a microwave susceptor to enable efficient heating during pyrolysis. The activated carbon acted as a solid-phase catalyst to promote the thermal decomposition of plastic waste, whereas SiC primarily absorbed microwave radiation and rapidly transferred heat to the reaction system due to its excellent dielectric loss properties.

2.3. Characterization Techniques

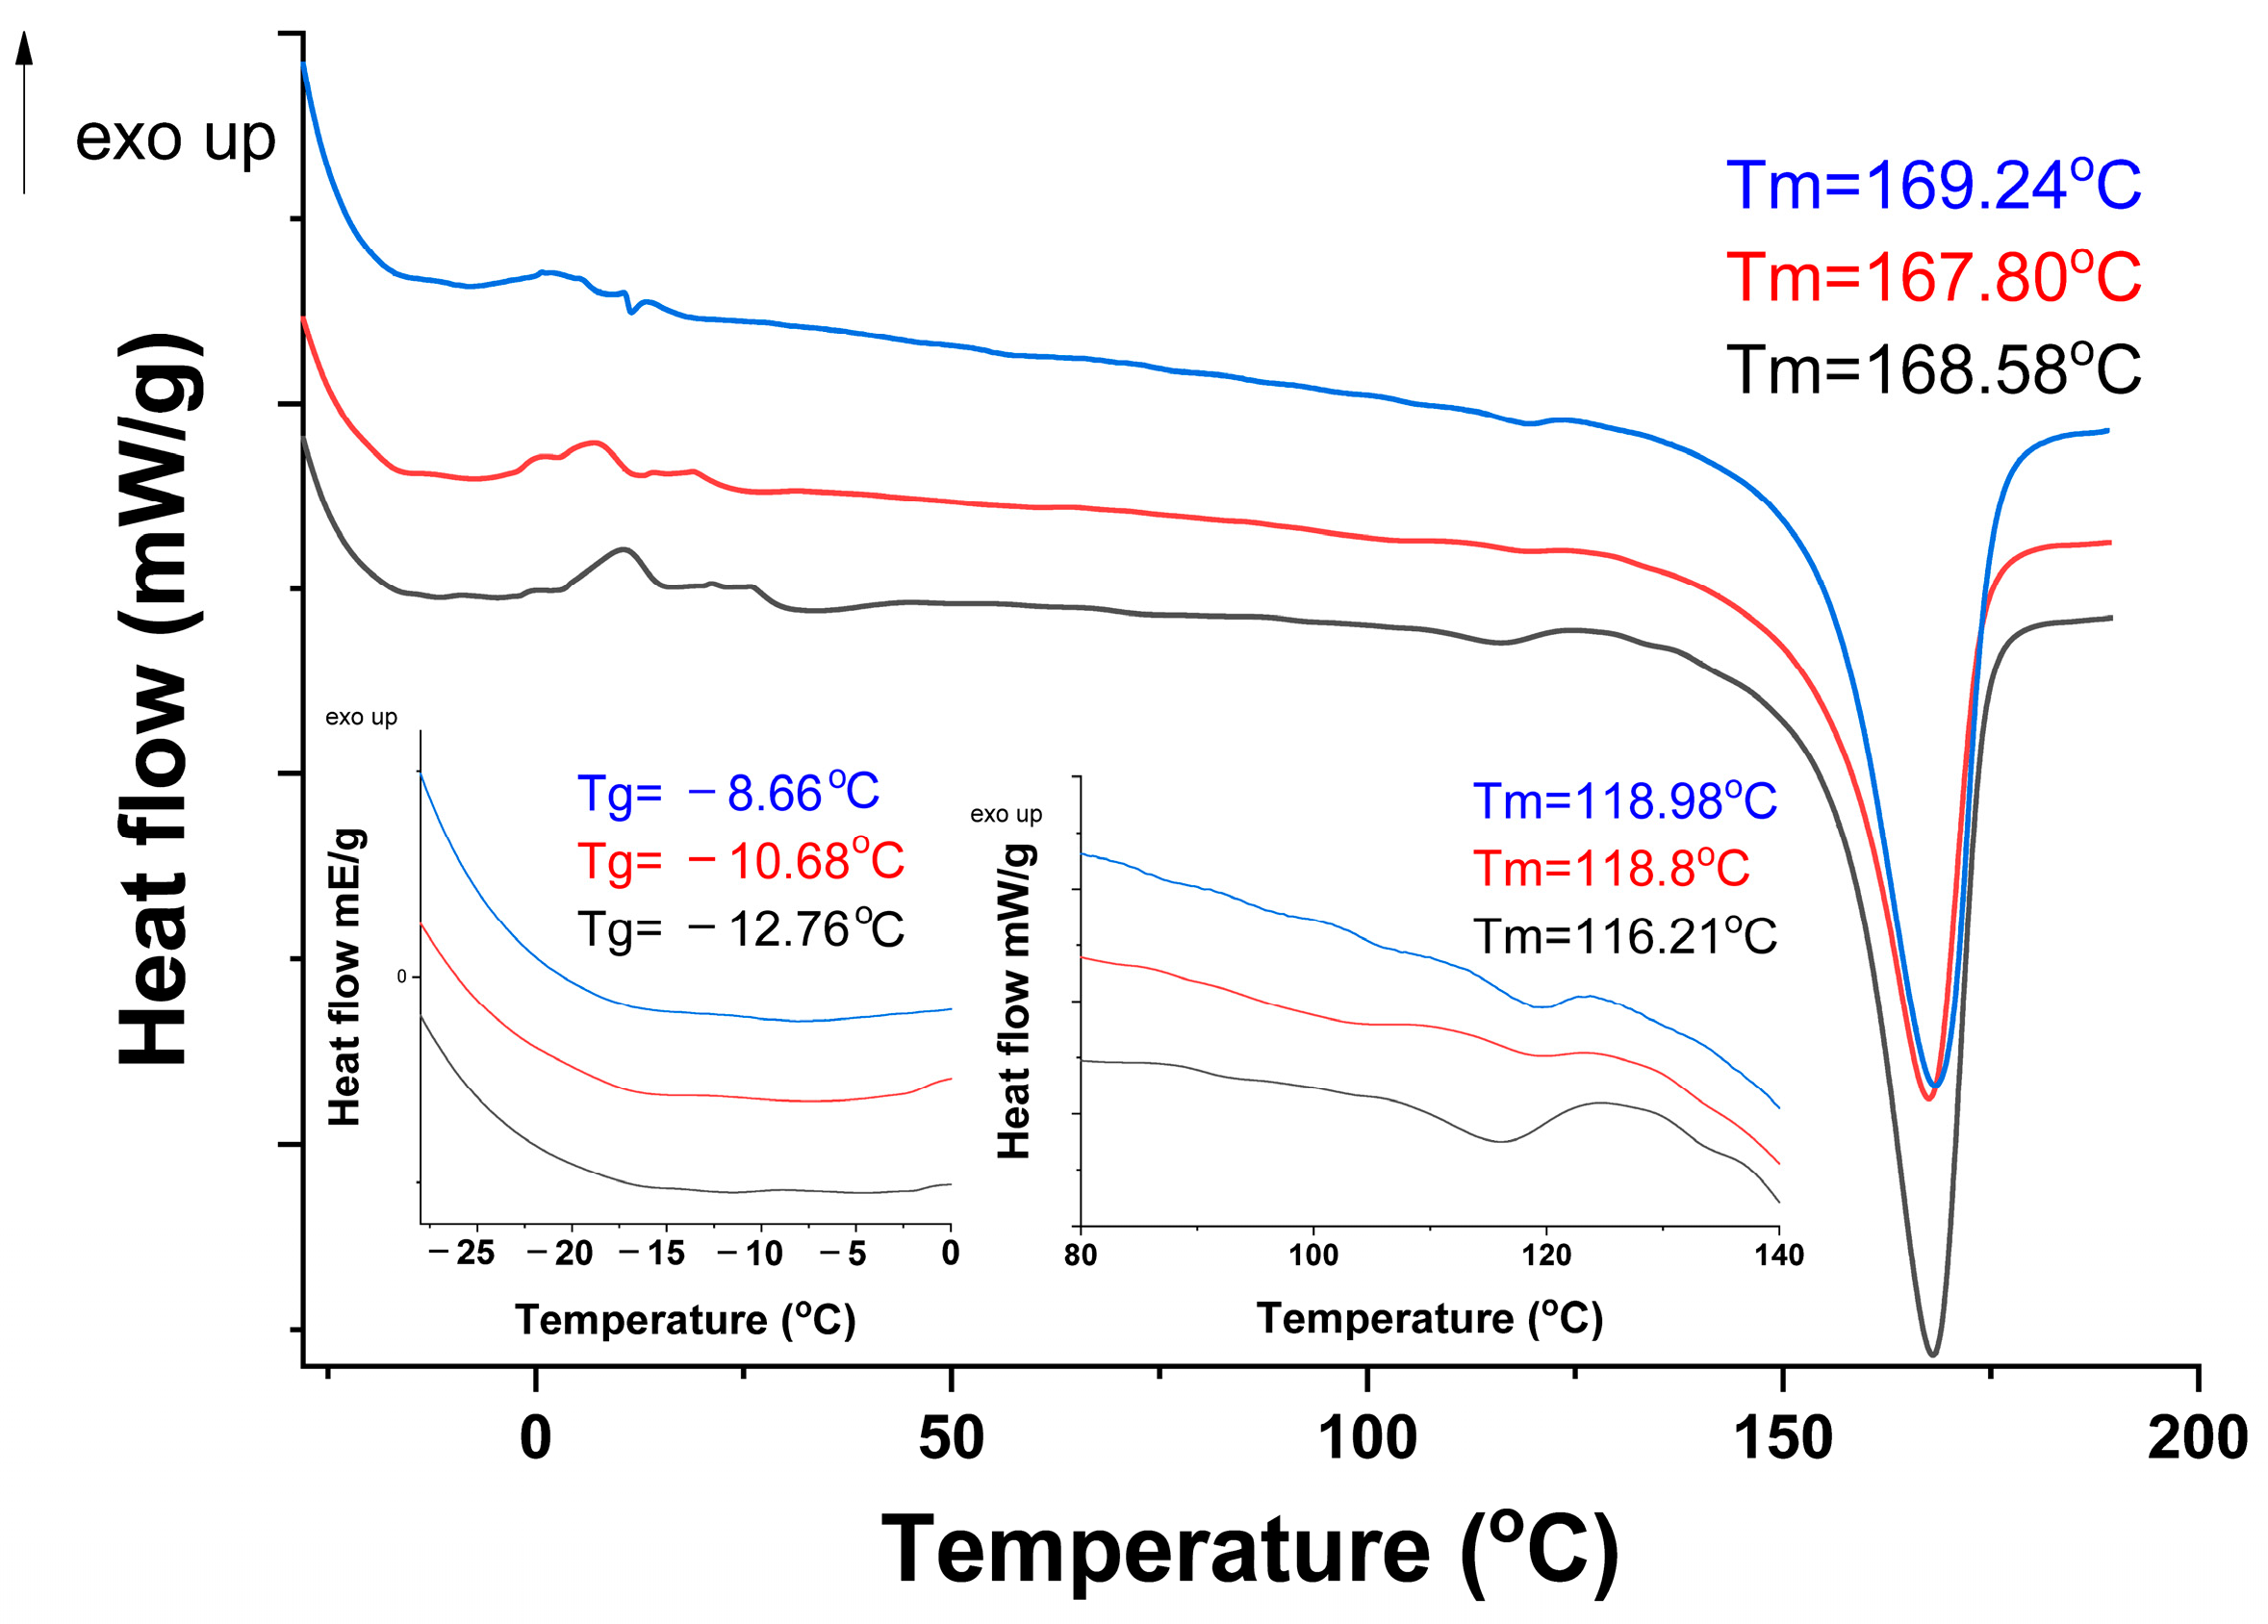
2.3.1. Analysis of Raw Materials (FTIR/DSC/XRD/TGA-DTG)

The polymeric waste materials’ FTIR spectra were obtained using a Perkin Elmer Spectrum Two (Perkin Elmer, Waltham, MA, USA) with a Pike MiracleTM ATR modulus (550–4000 cm−1, 1 cm−1 resolution, and data averaging at 16 scans). DSC analysis was performed on a Setaram Setline DSC equipment, on approximately 10 mg of sample, from −30 °C to 200 °C, with a heating rate of 10 °C/min under a nitrogen atmosphere.
The thermogravimetric analysis (TGA-DTG) was performed using a thermogravimetric device model Netzsch TG 209 F3 Tarsus (NETZSCH, Selb, Germany). Each sample mass (approximately 4 mg) was heated under a nitrogen atmosphere (flow rate 20 mL/min) from 25 to 900 °C, at a heating rate of 10 °C/min in an alumina crucible (Al2O3).
The surface morphology of activated carbon and silicon carbide samples, both before and after pyrolysis, was analyzed using a HitachiTM 4000Plus Tabletop Scanning Electron Microscope (SEM) (Tokyo, Japan). The instrument operated at an accelerating voltage of 10 kV, in high vacuum mode (H), using a backscattered electron (BSE) detector to obtain compositional and topographical contrast.
Samples were mounted on standard aluminum stubs using conductive carbon tape and analyzed without any additional coating. The use of BSE imaging allowed effective observation of morphological features, surface degradation, and pore blockage, potentially caused by interaction with pyrolysis vapors or solid residues. Comparative analysis was performed on samples recovered from microwave-assisted pyrolysis, conventional heating, and untreated samples.
Wide-angle X-ray diffraction (XRD) analysis was performed using a Rigaku Miniflex 2 (Tokyo, Japan) diffractometer over a 2θ range of 10–70°, with Ni-filtered CuKα radiation, a scan rate of 2°/min, and a step size of 0.02°.

2.3.2. Active Carbon Analysis

Textural properties of the activated carbon samples were characterized using a Quantachrome NOVA 2200e surface area and pore size analyzer. The measurements were performed by nitrogen (N2) for adsorption–desorption. Before analysis, each sample was subjected to degassing at 160 °C under vacuum for 4 h to eliminate adsorbed moisture and surface contaminants. The specific surface area was determined using the Brunauer–Emmett–Teller (BET) method, while the total pore volume and average pore diameter were calculated using the Barrett–Joyner–Halenda (BJH) model based on the desorption branch of the isotherm. The analysis was conducted exclusively on activated carbon samples, both fresh and recovered from pyrolysis experiments conducted under microwave and conventional heating conditions. These measurements provided quantitative insight into the textural degradation or pore-blocking phenomena associated with thermal exposure and interactions with silicon carbide during pyrolysis.

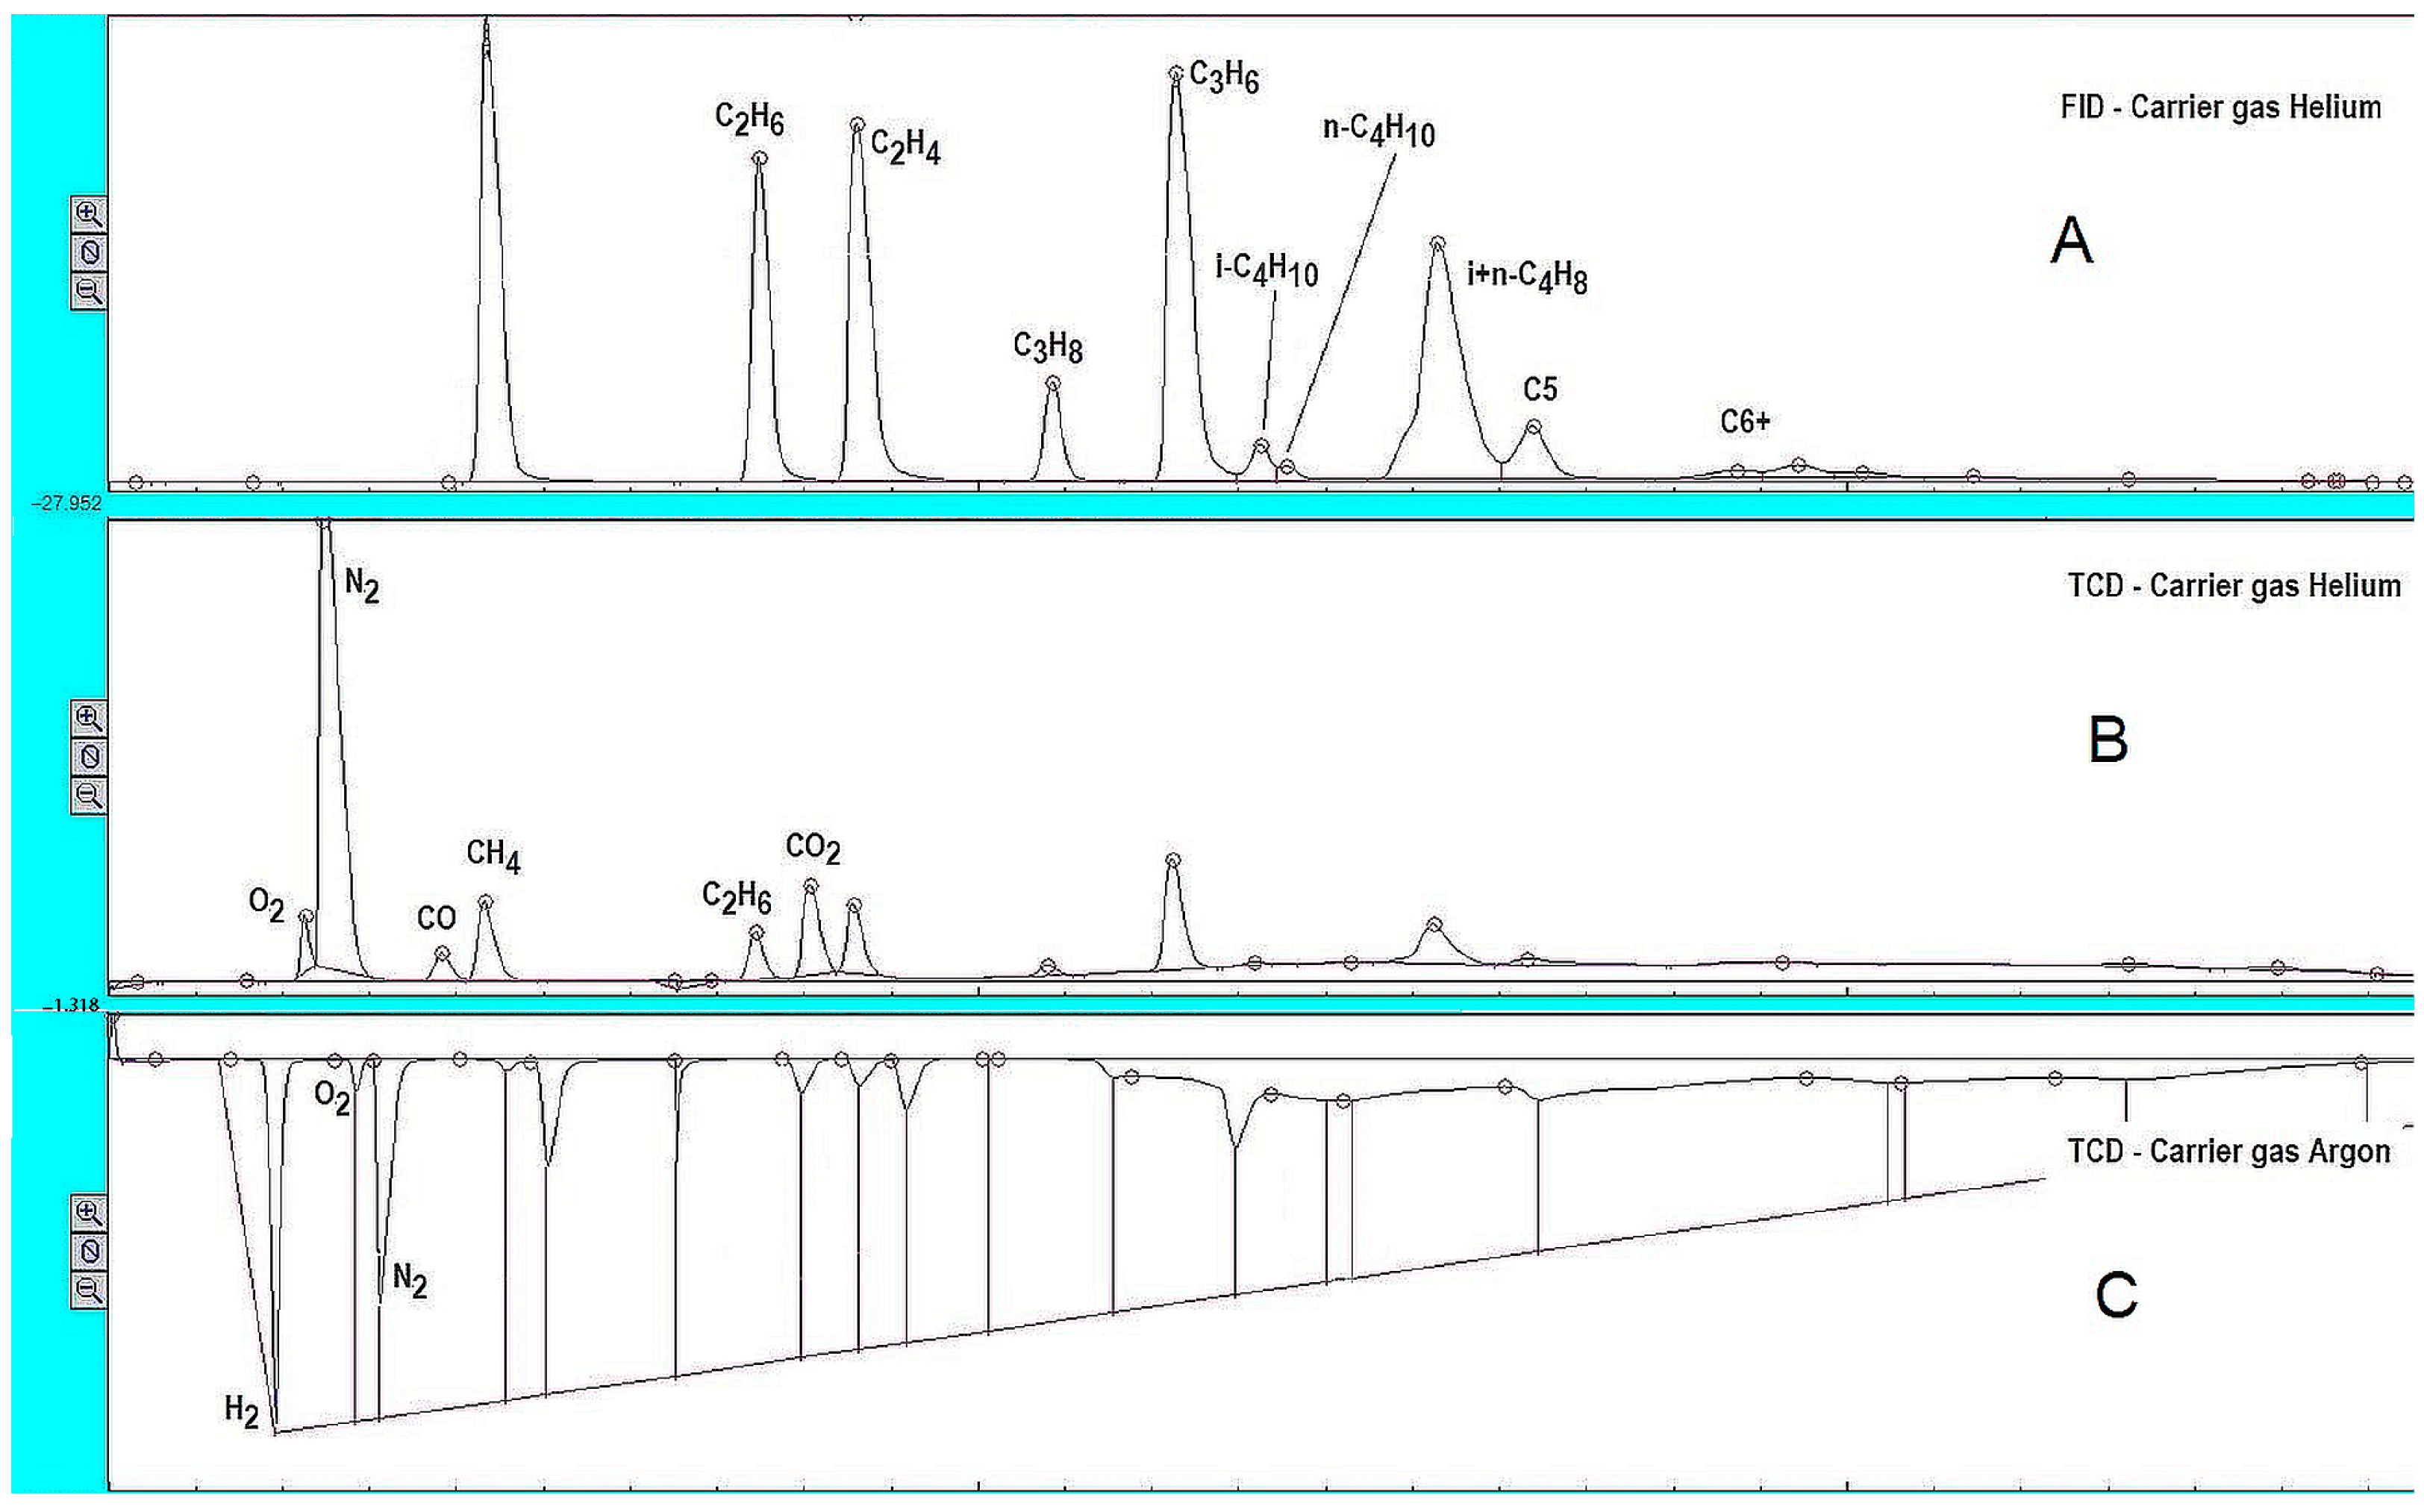
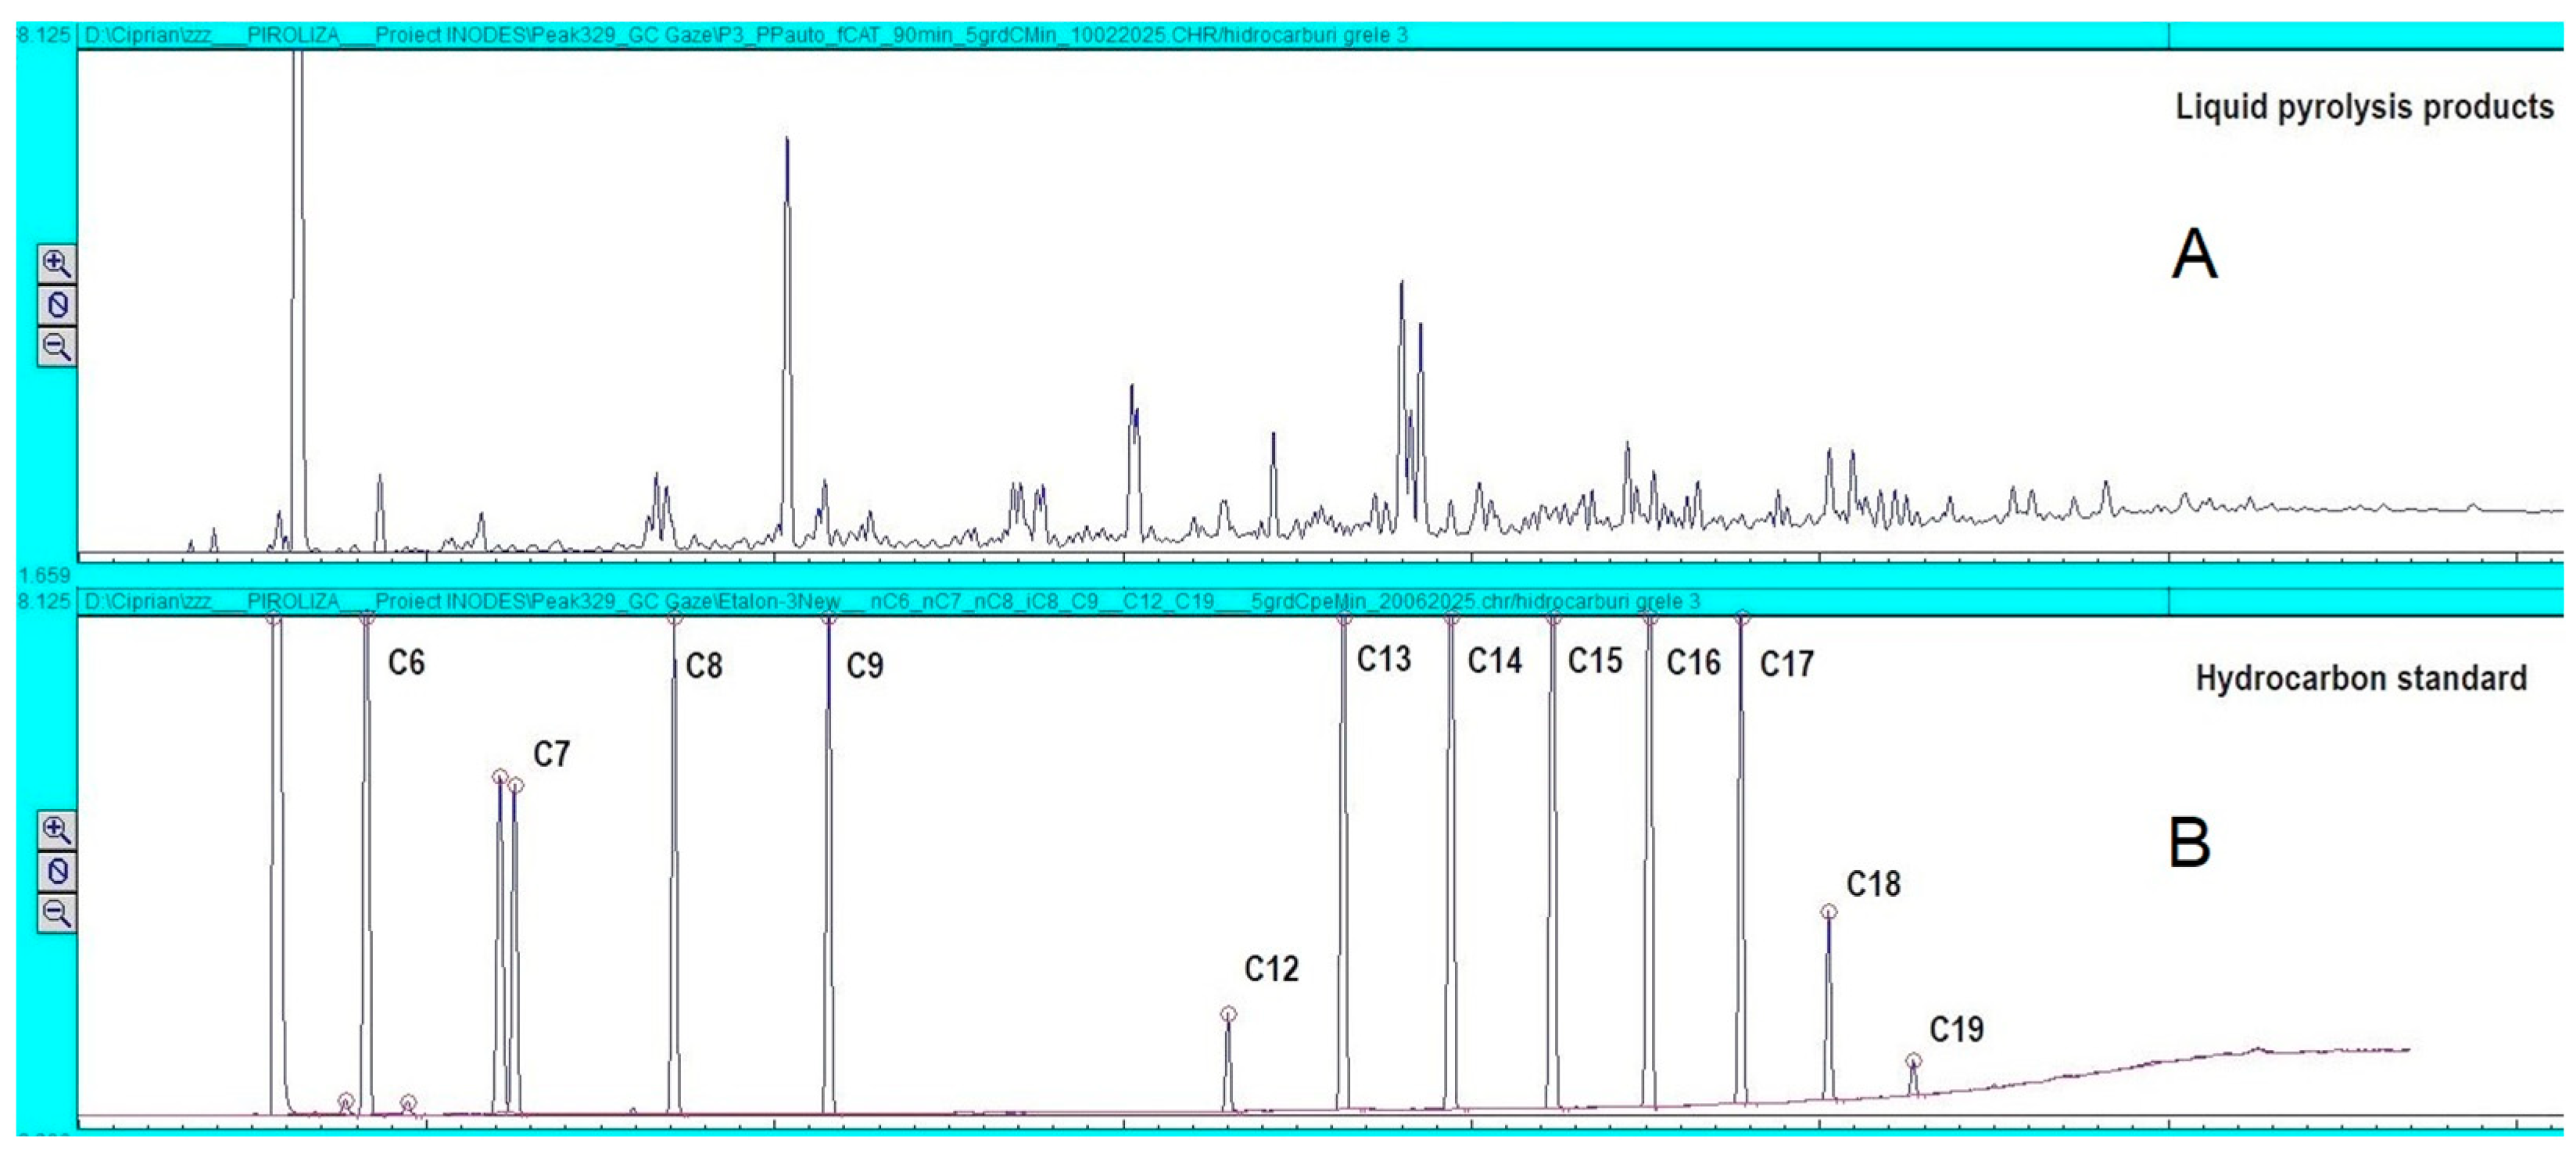
2.3.3. GC Analysis of the Liquid and Gaseous Products Obtained

The gaseous products were analyzed using a gas chromatograph (GC) model Buck Scientific 910 (Buck Scientific Instruments, Norwalk, CT, USA), equipped with two packed columns: (1) a molecular sieve 13X column (6″ × 0.53 mm) for the separation of atmospheric gases including N2, O2, CO, and CO2, and (2) a silica gel column (6″ × 0.53 mm) for the separation of light hydrocarbons such as CH4, C2H6, C2H4, C3H8, C3H6, n-C4H10, i-C4H10, C4H8, and i-C4H8. Helium and argon were used as the carrier gas at a constant flow rate of 30 mL min−1 and pressure of 84 psi [27]. Gas samples were introduced using a gas-tight syringe directly from TEDLAR gas sampling bags via a rubber septum. A typical chromatogram for the gas fraction is described in Figure 2.
The liquid fraction was analyzed using a second configuration of the Buck Scientific 910 GC system, equipped with a capillary column (MTX-1, 60 m length, 0.53 mm internal diameter). The temperature program included an initial hold at 40 °C for 2.5 min, ramping at 5 °C min−1 to 315 °C, followed by a 30-min isothermal hold at 315 °C. Detection was performed using both a flame ionization detector (FID) and a discharge ionization detector (DLCD). Liquid samples were injected using a 10 μL Hamilton microliter syringe. A typical chromatogram for the liquid fraction is presented in Figure 3. To establish the composition of the liquid fraction (gasoline, kerosene, diesel, and heavy), the retention times obtained from the analysis of a mixture of n-alkanes were used.

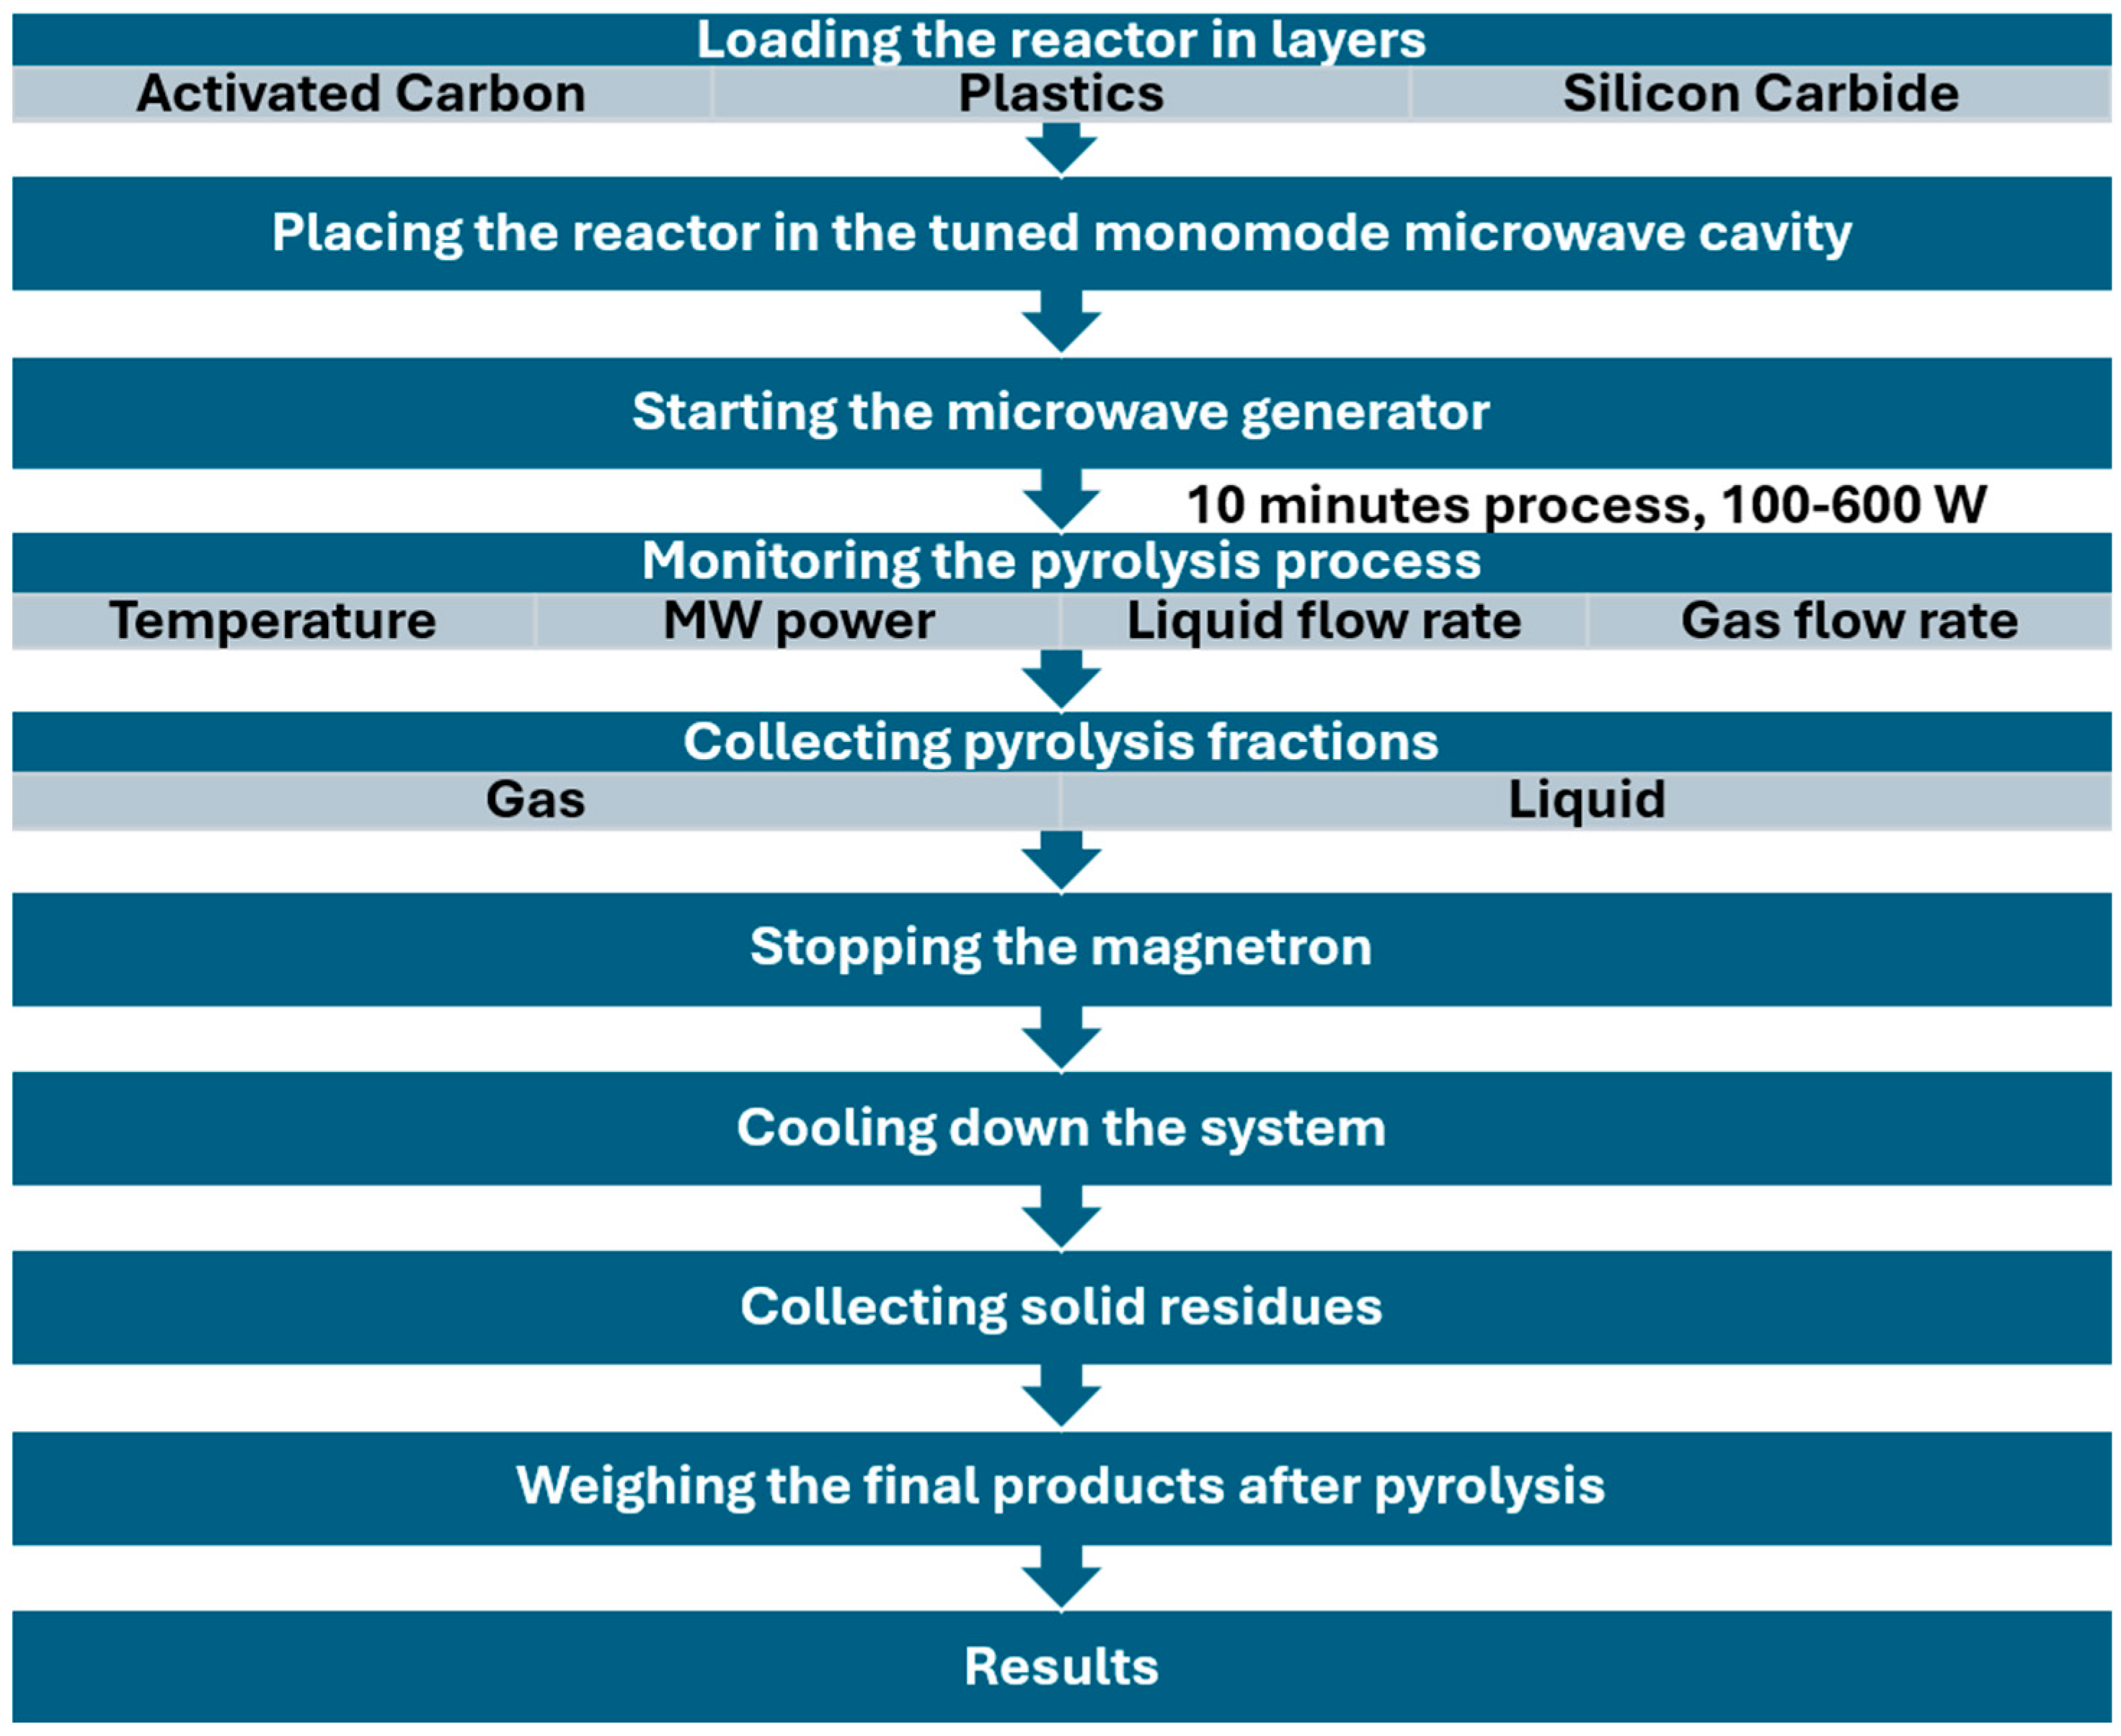
2.4. Microwave Pyrolysis Setup

The pyrolysis experiments were conducted in a custom quartz tube reactor (17 mm inner and 20 mm outer diameter) placed within a monomode microwave cavity. The installation setup is shown in Figure 4, while the main parameters of the microwave-assisted pyrolysis process are presented in Table 2. The temperature during the reaction was monitored using an infrared reading device positioned to measure the external surface of the quartz reactor. The catalyst mass ranged from 0 to 6 g, depending on the experimental configuration.
All experiments were carried out in a nitrogen atmosphere to maintain inert conditions. Before microwave irradiation, nitrogen (N2) was purged through the system at a flow rate of 50 mL/min for 5 min to eliminate residual oxygen, then decreased to 1 mL/min during the pyrolysis. Microwave heating was applied at a dynamic input power level (max. 700 W), depending on temperature, for a reaction time of 10 min.
The plastic and catalyst were arranged in a layered configuration, with several variations explored, which are detailed in the Section 3. After the reaction, the gaseous products were collected using gas-tight TEDLAR bags, the liquid fraction was condensed and trapped using a cold trap, and the remaining solids were recovered from the reactor and weighed for yield determination. To test the activity of the catalyst (AC) already used in one experiment, it was separated from silicon carbide and reused in another experiment.

2.5. Product Yield

The yields of liquid and solid fractions were determined gravimetrically based on the mass balance before and after the pyrolysis process. Thus, the yield in the gaseous fraction is calculated with Equation (1):
G a s   y i e l d = m 0 m l i q u i d m u n r e a c t e d m 0 × 100 %   ( w t . % )
The hydrogen efficiency was calculated to evaluate the effectiveness of hydrogen production during pyrolysis, using Equation (2):
H y d r o g e n   e f f i c i e n c y = m a s s   o f   h y d r o g e n   i n   g a s   ( g ) t h e o r e t i c a l   m a s s   o f   h i d r o g e n   i n   p l a s t i c   ( g )  
The theoretical mass of hydrogen in the gas fraction is acquired from GC-MS analysis. Theoretical mass of hydrogen in plastic is 0.142857 g (for both PE and PP).
A representative value for the process is the hydrogen generation efficiency determined by Equation (3):
H y d r o g e n   y i e l d = m o l e   o f   h y d r o g e n   p r o d u c e d   m a s s   o f   p l a s t i c ( m m o l   g p l a s t i c 1 )

2.6. Calorific Value of Gases

For each component of the gaseous fraction, the Gross Heating Value (GHV) in the literature was identified. It is also easy to estimate the number of moles of CO2 emitted at combustion for each compound, see Table 3.
Using these values, and the volumetric composition data (Ci), the GHV for each gas mixture obtained [kJ/m3] is determined using Equation (4):
G H V m i x t u r e = 1 n G H V i   × C i 100   ( k J / m 3 )
For the equivalent CO2 emission into the flue gases, the volume concentrations and CO2 emission values for each component are obtained [Equation (5)]:
C O 2   e m i s s i o n s m i x t u r e   L = 1 n C O 2   e m i s s i o n s i   × C i 100   ( L   C O 2   /   L   g a s e o u s   m i x t u r e )
To be able to make comparisons with other fuels, we need to determine the CO2 emissions expressed in kg CO2/kJ:
C O 2   s p e c i f i c _ e m i s s i o n s m i x t u r e = C O 2   e m i s s i o n s m i x t u r e   L ÷ 22.4 × 44 G H V m i x t u r e   ( k g   C O 2   /   k J )  

3. Results and Discussion

The objective of the research carried out was to pyrolyze waste plastics (PP and PE) resulting from the dismantling of cars in such conditions that the conversion into gaseous fraction is increased as much as possible, and these gases contain a higher concentration of hydrogen. PP and PE were used as materials, both in pure technical condition and as waste resulting from the dismantling of cars: PP from the door pillar; PP + PE waste 1 from the seat support, and PP + PE waste 2 from the armrest. The raw material was characterized by:
-
FT-IR/DSC/XRD analysis to establish the composition of plastic waste;
-
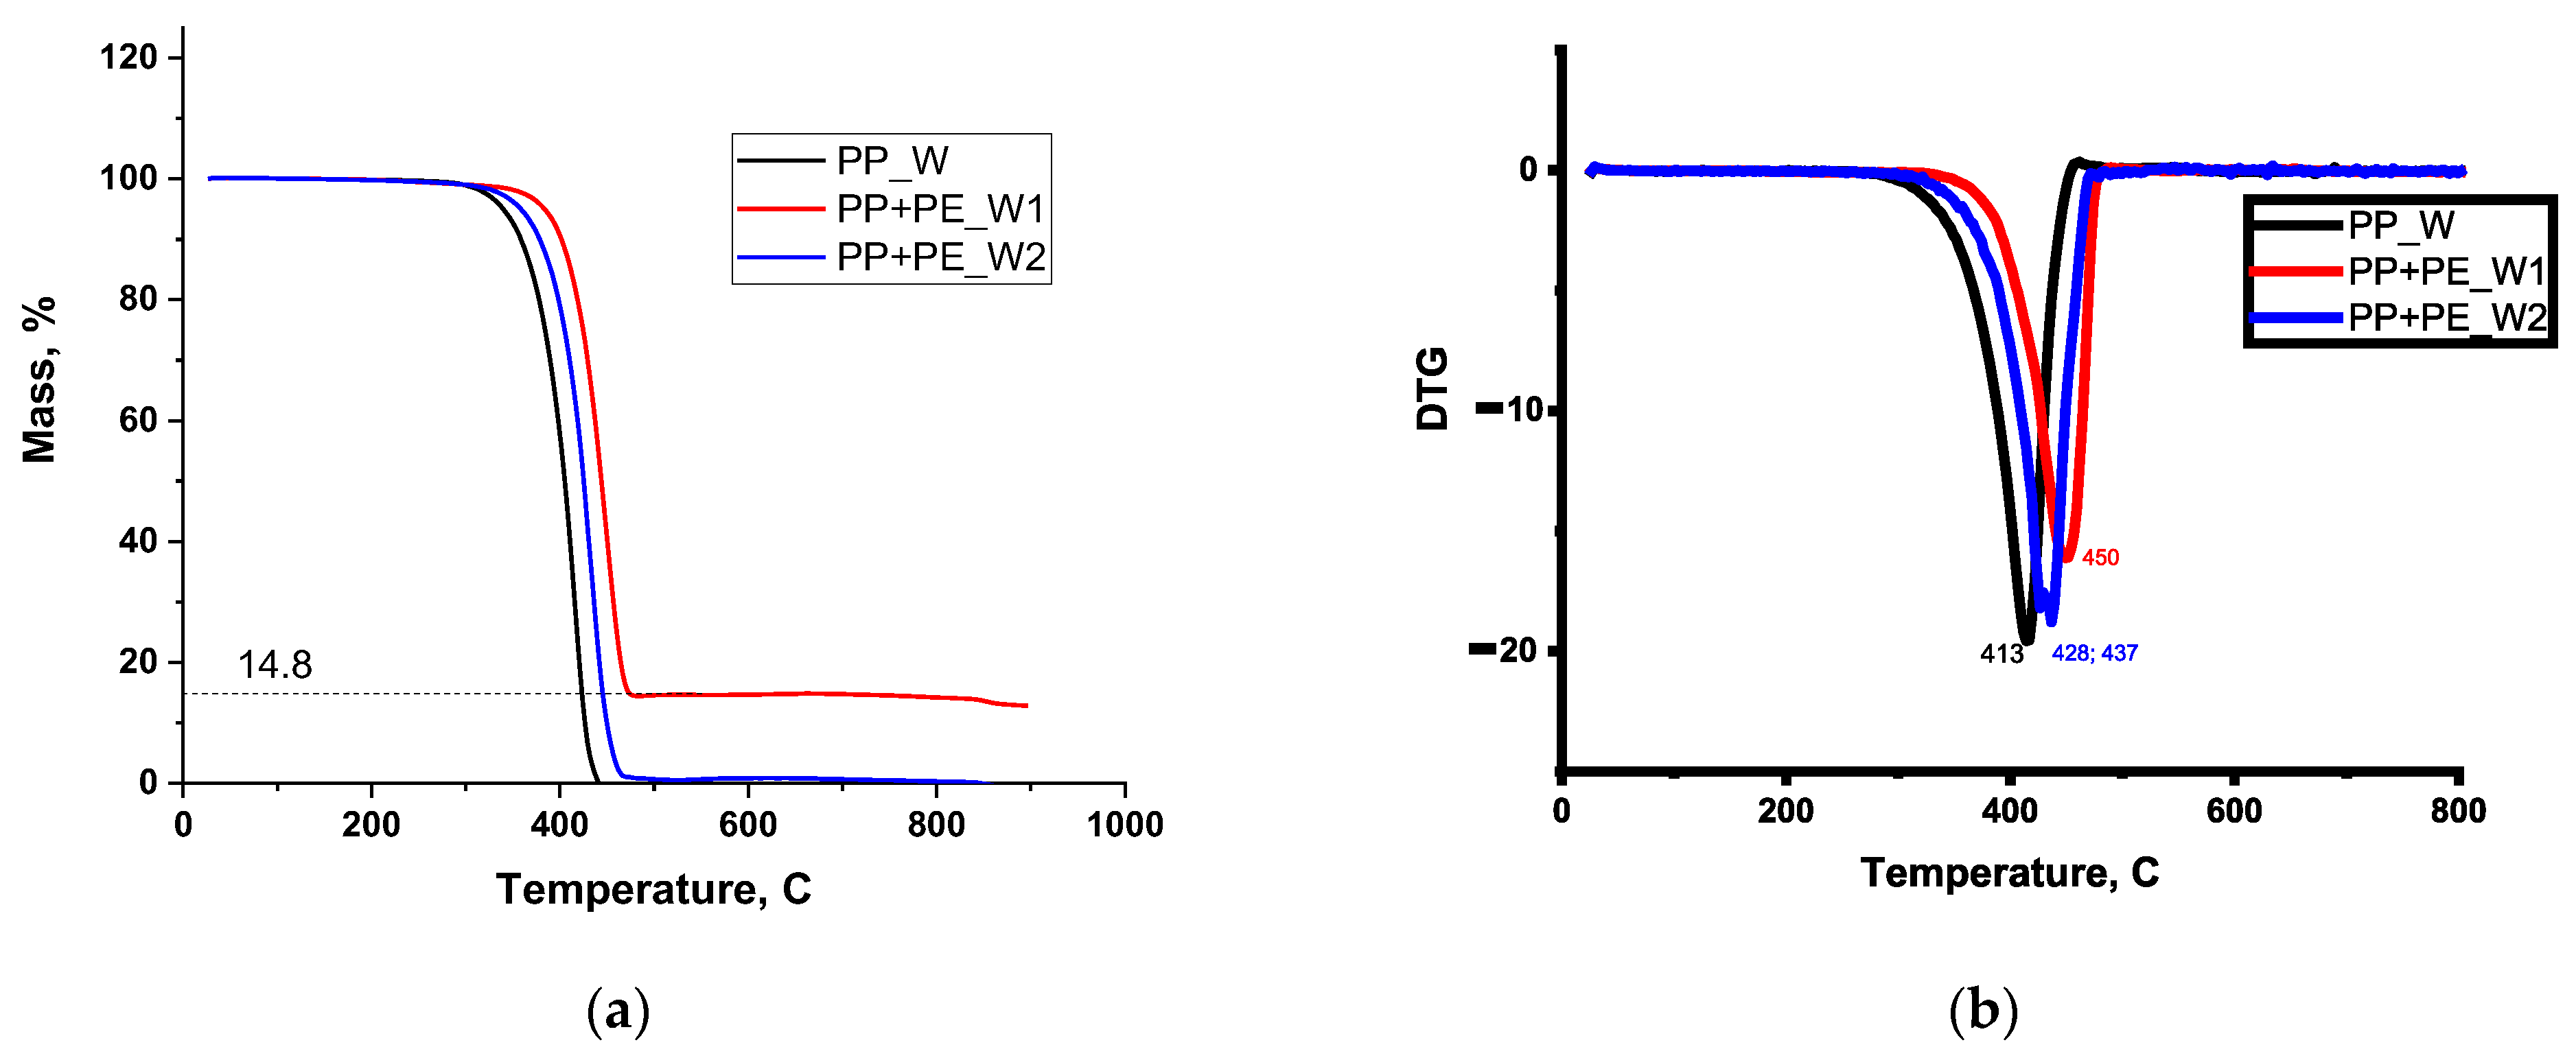
TGA/DTG analysis to establish the behavior at thermal decomposition.
Pyrolysis was performed in a quartz reactor that was heated both conventionally and with microwaves. The gaseous and liquid products obtained were characterized by GC analysis, and the solid products by SEM and BET analysis.
All experiments were performed in triplicate, and the results were presented as averages with corresponding ranges of variation.

3.1. FTIR/DSC/XRD/TGA Analysis of Raw Materials

FT-IR spectra of the analyzed samples are shown in Figure 5, with characteristic bands shown in Table 4.
In the FTIR spectra for the technical PE reference sample, the –CH2– asymmetric and symmetric peaks at 2915 and 2847 cm−1, respectively, can be observed, followed by the signal specific for the –CH2– scissoring vibration at 1465 cm−1 and the –CH2– rocking vibration at 719 cm−1. The –CH2– rocking vibration from 719 cm−1, which is characteristic of polyethylene due to its long, continuous –CH2– sequences, is not observed in polypropylene because the presence of pendant –CH3 groups disrupts such sequences and prevents the collective rocking motion. It should be noted that the absorption band at 1165 cm−1 may appear in PE+PP-1, particularly when the polypropylene content is relatively high, even though this band is not distinctly prominent or characteristic in the pure polypropylene spectrum. Based on the obtained spectra, we can conclude that our raw materials contain varying proportions of PE, with PE+PP-1 showing a higher amount, as indicated by the signal at 719 cm−1, which also confirms the crystallinity of PE [46]. DSC analysis of the plastic samples is shown in Figure 6.
From the DSC analysis (Figure 7), a glass transition temperature characteristic of polypropylene was observed for all samples, occurring around –10 °C, which is typical for isotactic PP. Additionally, two melting stages were observed: a weak signal around 120 °C, characteristic of polyethylene, and a visible transition around 168 °C, specific to polypropylene [47].
From the XRD analysis (Figure 7), it can be seen that the X-ray diffraction pattern of the PP_W sample shows only the characteristic diffraction peaks of polypropylene, while the other two samples present the Bragg reflections of both polypropylene and polyethylene, along with a different inorganic phase. One can notice that the PP+PE_W1 sample has a higher crystallinity than the other two samples and a higher content of crystalline inorganic filler.
The data from the TGA/DTG analysis (Figure 8) show us that the PP waste decomposes completely (at 413 °C is the maximum decomposition rate). The PP + PE waste samples exhibit different behaviors. In the PP+PE_W2 sample, the additive content is low and fully decomposes during pyrolysis. In the DTG curve shown in Figure 8b, two decomposition rate peaks are observed at 428 °C and 437 °C. The PP+PE_W1 sample has a different behavior; the TGA analysis, Figure 8a, shows us that this sample contains a component that does not decompose thermally and that is in significant concentration of 14.8% (it could be a component that increases the mechanical strength of this plastic). The maximum thermal decomposition speed of this plastic is at 450 °C.

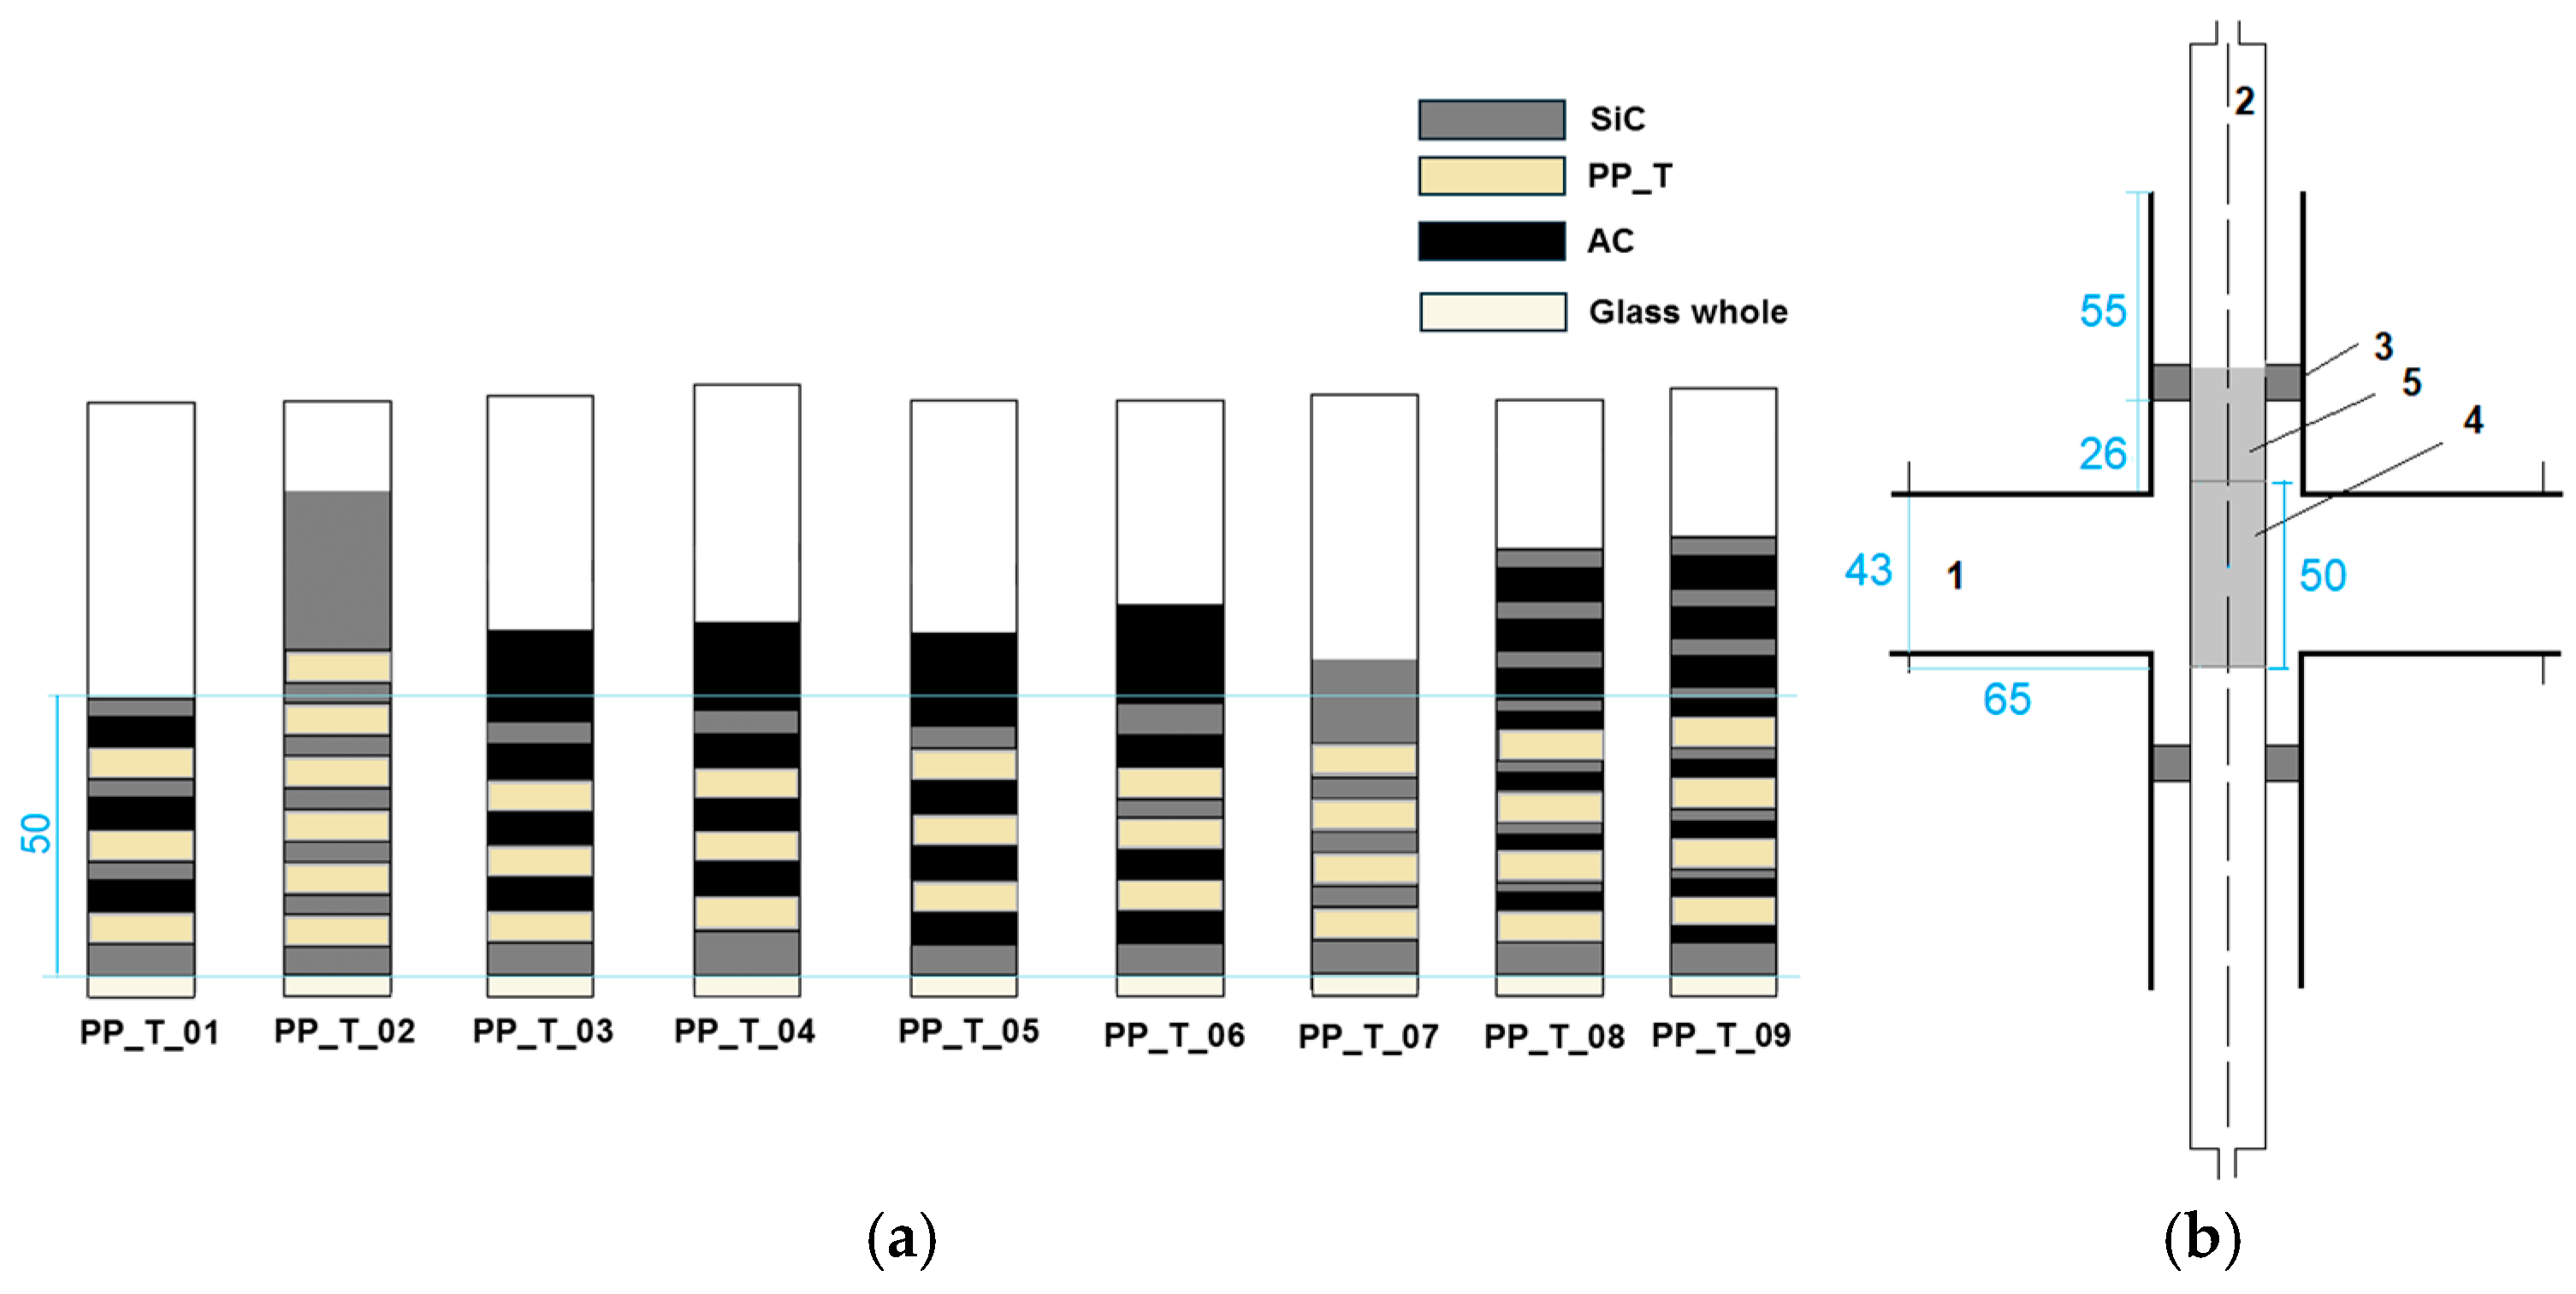
3.2. Experimental Configurations and Product Yields

In the single-mode applicator, microwave energy absorption is realized only in the presence of silicon carbide. For uniform heating of the plastic granules, it is necessary to alternate between plastic and silicon carbide layers. To evaluate the influence of catalyst loading and layering on the pyrolysis of polypropylene (PP), nine different experimental configurations were designed, labeled PP_T_01 to PP_T_09. These configurations varied in the amount and distribution of silicon carbide (SiC) and activated carbon (AC), layered alternately with PP feedstock inside the reactor (Figure 9). The visual representation in Figure 9 shows light grey layers as PP, dark grey as SiC, and black as AC.
Each configuration was subjected to pyrolysis at 750 °C for 10 min in a nitrogen atmosphere, using a monomode microwave reactor at up to 600 W. The corresponding yields of gas, liquid, and solid products were recorded and are summarized in Table 5.
Hydrogen concentration in the gas products varied significantly across the tested configurations, indicating a strong dependence on catalyst presence, particularly activated carbon (AC), and its interplay with the feedstock and microwave susceptor (SiC). The lowest hydrogen content (7.25%) was recorded in configuration PP_T_01, which used a relatively low catalyst loading (3 g AC and 5 g SiC), and in PP_T_02, which lacked AC entirely, despite having a high amount of SiC (15 g). This suggests that microwave susceptibility alone is insufficient to promote hydrogen generation in the absence of a catalyst.
Notably, the highest H2 concentration (45.23 vol.%) was achieved in configuration PP_T_09, where 4 g PP was processed with 5.5 g activated carbon and 8 g SiC. This configuration combined an optimized balance of microwave energy absorption and catalytic surface area, highlighting the synergistic role of AC in promoting dehydrogenation and secondary cracking reactions.
Intermediate H2 concentrations were observed in configurations with moderate AC loadings, such as PP_T_03 (19.75%), PP_T_05 (19.27%), and PP_T_06 (25.37%), all of which used 6 g of activated carbon. These results suggest that while AC promotes hydrogen formation, the effect is not strictly linear and may depend on additional factors such as catalyst dispersion, local temperature distribution, and residence time.
From the analysis of the results presented in Table 2 and the configurations in Figure 3A, it can be seen that the quartz reactor must be loaded in such a way that the total height of the layers is over 5 cm (the active area that is subject to microwave heating), so that at the end of the pyrolysis time in the single-mode cavity there is enough material susceptible to microwave heating to obtain a more complete conversion of the plastic subjected to pyrolysis.
Due to its superior performance, configuration PP_T_09 was selected as the reference setup for subsequent experiments involving different polypropylene and polyethylene waste sources. Below, this experiment will be noted as PP_T.

3.3. Influence of Plastic Type

The type of plastic feedstock used in the pyrolysis process significantly influenced both the gas yield and the composition of the gaseous fraction, particularly the hydrogen content. Experiments were conducted using polypropylene granules (PP_T), polyethylene granules (PE_T), and plastic waste from automotive dismantling operations, which included both PP waste (PP_W) and two types of PP+PE (PP+PE_W1 and PP+PE_W2) waste mixtures. The results are shown in Table 6.
Among the technical plastic tested PP (PP_T) produced high hydrogen yield (32.01 mmol/g plastic) and a relatively high gas fraction (81.44 wt. %), coupled with a high hydrogen efficiency of 44.81 g/g. This confirms the high suitability of polypropylene for microwave-assisted pyrolysis aimed at hydrogen-rich gas production.
On the other hand, technical PE (PE_T) generated a similar gas yield (77.9 wt.%) but yielded significantly less hydrogen (14.31 mmol/g) and had a hydrogen efficiency of only 20.03 g/g, less than half the efficiency of PP_T_09. This supports the conclusion that PE, under the same pyrolysis conditions, is less favorable for hydrogen production than PP.
Among the mixed plastic waste samples, a contrasting behavior was observed. PP+PE_W1, despite having a relatively low gas yield (66.7 wt.%) and the highest solid residue (22.32 wt.%), due to filler content in the plastic waste, as confirmed by previous TGA analysis, surprisingly showed the highest hydrogen yield (34.4 mmol/g) and the best hydrogen efficiency (56.4 g/g). This anomaly suggests that PP+PE_W1 may contain components or structures that promote hydrogen generation or inhibit secondary reactions that consume hydrogen, though its high solid residue points to the presence of undecomposed materials or inert fillers.
PP+PE_W2 yielded high gas (87.08 wt.%) and high conversion (96.8%) yet produced the lowest hydrogen yield (6.2 mmol/g) and hydrogen efficiency (8.66 g/g) of all tested samples.
These results highlight that not only the polymer type (PP or PE) but also the origin and purity of plastic waste (presence of fillers, additives, or degradation products) play crucial roles in determining the effectiveness of microwave pyrolysis for hydrogen generation. Clean technical PP remains the most efficient feedstock, while mixed or contaminated wastes require further pretreatment or catalyst optimization to enhance hydrogen yields.
The results obtained by us are consistent with other results presented in the literature. From the data presented in Table 7, it can be seen that in this article increased yields were obtained in the gas phase, which we consider to be an important advantage of our research.
The composition of the gas fraction resulting from microwave-assisted pyrolysis varied significantly depending on the type and origin of the plastic feedstock (Table 8). The primary gaseous products included hydrogen (H2), methane (CH4), ethane (C2H6), ethylene (C2H4), propane (C3H8), propylene (C3H6), butenes, and small fractions of carbon oxides (CO, CO2), as well as heavier hydrocarbons (C5–C6+).
PP_T produced a gas highly enriched in CH4 (43.28%) and H2 (45.23%), with negligible amounts of unsaturated light hydrocarbons such as ethylene (0.03%) and propylene (0.15%). This composition reflects efficient chain scission reactions with limited secondary reactions, yielding primarily small, saturated molecules and H2. The low CO and CO2 levels (1.04% and 1.51%) also support the idea of non-oxidative degradation pathways.
PE_T, as expected for polyethylene, gave a more diverse composition, with moderate H2 (36.63%) and CH4 (22.76%), but significantly higher levels of ethylene (18.39%) and ethane (5.42%). The presence of olefins like C2H4 and C3H6 (3.93%) indicates incomplete cracking or lower reactivity of the resulting alkenes under the tested conditions. These results are consistent with a PE saturated backbone, which tends to produce more olefinic products through β-scission.
The waste PP (PP_W) generated gas with high H2 content (46.5%) and elevated levels of olefins and C3–C4 fragments, including propylene (5.41%) and C4 unsaturated (totaling 2.65%), compared to PP_T. This suggests more extensive secondary cracking, possibly catalyzed by additives present in the post-consumer material. Additionally, the presence of CO2 (4.09%) was the highest from all polymers, likely reflecting the degradation of additives or minor oxygenated components.
Among all samples, PP + PE_W1 generated an exceptionally high hydrogen content, reaching 75.35 vol.%, far surpassing that of PP_T (45.23%) and PE_T, 36.63%. This suggests unusually effective cracking or dehydrogenation behavior, possibly influenced by the composition of the waste mixture. Interestingly, despite its high hydrogen yield, PP + PE_W1 showed minimal CH4 content (0.29%) and very low levels of CO and CO2 (0.16% and 0.35%, respectively), suggesting a strong selectivity toward H2 formation with limited reforming or oxidation reactions.
The sample PP + PE_W2 displayed a low H2 concentration (20.05%) but elevated CH4 (23.32%), C3H6 (7.96%), and significant C4–C6 hydrocarbon content. This broader product distribution points to more complex pyrolysis behavior, potentially caused by fillers and stabilizers in the material.

3.4. Influence of MW Heating and AC

Table 6 and Table 8 show the results obtained from conventional pyrolysis (electric heating) performed in the same configuration (PP_T) with the use of SiC and AC—PP_W_conv_01 or only SiC PP_W_conv_02.
By comparison, PP_W_conv_01 and PP_W_conv_02, both processed using conventional heating, exhibited markedly lower hydrogen yields—16.51% and 9.32%, respectively. At the same time, they showed higher concentrations of heavier hydrocarbons, including C4 and C5–C6+ species, with up to 6.55–7.16% C4 alkenes and 3.29–7.16% C6+ compounds. The increased formation of heavier products and lower H2 levels suggests less intense cracking and reduced secondary reactions, likely due to the slower, surface-limited heating and lack of microwave-specific effects.

3.5. Reuse of CA in Pyrolysis

In the experiment PP_W2, the activated carbon already used in the experiment PP_W was used. The data presented in Table 6 and Table 8 show that the catalyst has retained its activity quite well, the gaseous fraction contains an H2 concentration of 46.16% very close to the value of 46.5% obtained with the fresh catalyst. However, a difference was observed in terms of PP conversion: in the first experiment, it was 95%, whereas upon catalyst reuse, the conversion dropped to 83.3%. In order to establish the reusability of the catalyst, however, further studies are needed.

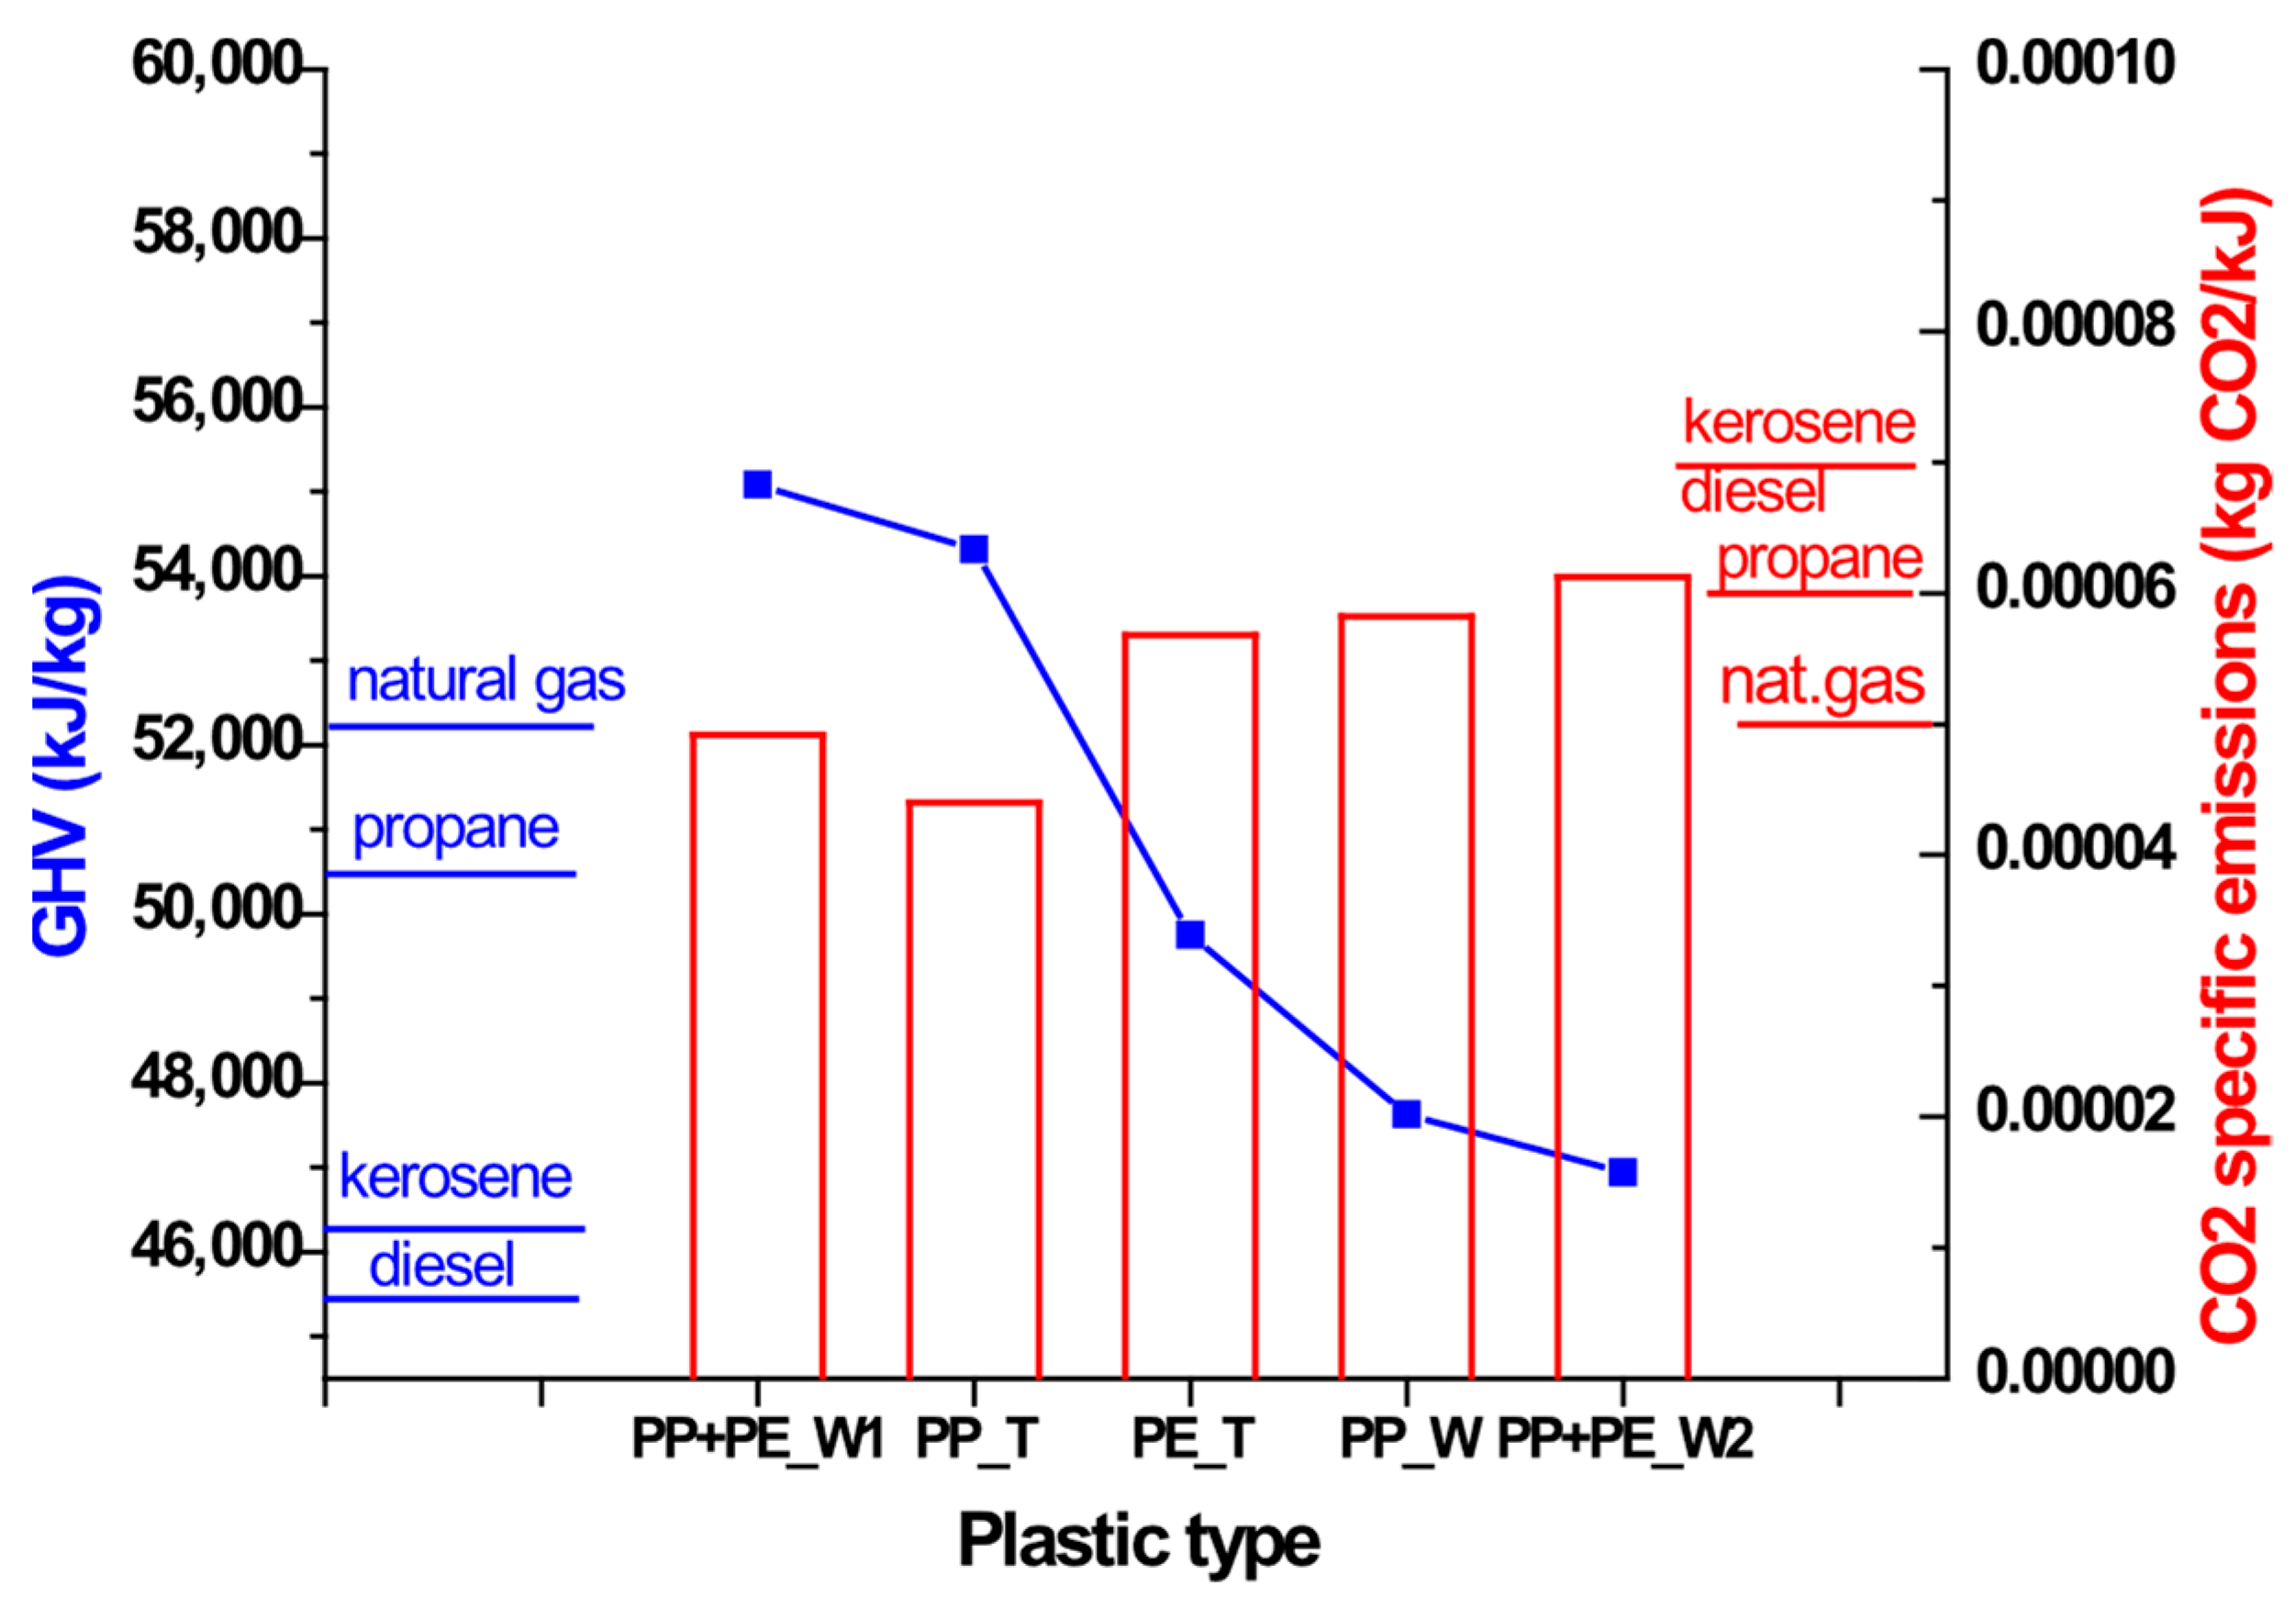
3.6. Calorific Power of Gases

The gross heating value (GHV) and CO2 emissions of the gaseous products resulting from pyrolysis varied significantly based on the type of plastic feedstock and the heating method applied, which are shown in Table 9.

3.6.1. Analysis of the Gaseous Mixture (Vol.%)

Among all samples, conventionally heated polypropylene waste (PP_W_conv_01 and PP_W_conv_02) exhibited the highest GHV values, reaching 64,272.68 kJ/m3 and 66,926.83 kJ/m3, respectively. This increase is attributed to the high concentration of saturated and unsaturated C3-C6 hydrocarbons, which contribute substantially to the energy density of the gas.
Microwave-assisted pyrolysis of PE (PE_T) and waste PP (PP_W) also yielded relatively high calorific values, over 27,000 kJ/m3, confirming the potential of these routes for generating fuel-rich gas mixtures. However, microwave-treated PP (PP_T) resulted in the lowest GHV (27,959.21 kJ/m3), due to the dominant presence of hydrogen (45.23 vol.%) and the comparatively lower fraction of hydrocarbons.
CO2 emissions per liter of gaseous product were lowest for PP_T (0.63 L CO2/L gas) and PP + PE_W1 (0.90 L CO2/L gas), suggesting a cleaner gas mixture and lower carbon footprint. Conventionally heated samples emitted over 2.0 L CO2/L gas, indicating a higher environmental impact associated with the wider hydrocarbon distribution.

3.6.2. Analysis of the Gaseous Mixture (wt.%)

When we analyze the GHV expressed in kJ/kg, the best results are obtained when the hydrogen concentration is high for the PP_T (54,320.32 kJ/kg) and PP_PE_W1 samples (55,087.35 kJ/kg). In all other cases, GHV values are obtained for the gas mixture higher than the corresponding values for conventional fuels such as kerosene or diesel (see Table 9).
Specific CO2 emissions, expressed as kilograms of CO2 per kilojoule of energy (kg CO2/kJ), ranged from 4.40 × 10⁻⁵ kg CO2/kJ (PP_T) to 6.23 × 10⁻⁵ kg CO2/kJ (PP_W_conv_02), further highlighting the superior carbon efficiency of microwave pyrolysis, particularly for hydrogen-rich gas generation when lower values are obtained than those corresponding to natural gas. In all other cases, lower specific CO2 emission values are obtained than those related to classic fuels such as kerosene or diesel.
These findings reinforce the idea that microwave-assisted pyrolysis with AC as the catalyst (while potentially yielding lower-energy gas due to high hydrogen content) provides a more sustainable and low-carbon pathway, especially when the targeted application involves clean hydrogen or syngas production.
The calorific power and carbon intensity of the pyrolysis-derived gases were evaluated and compared against common commercial fuels, which are presented in Table 10.
The highest GHV (kJ/kg) was recorded for the MW-heated PP + PE_W1, reaching 55,087 kJ/kg, closely followed by PP_T (54,320.32 kJ/kg). These values surpass those of common liquid or gaseous fuels (see Table 10 and Figure 10), highlighting the energy-dense nature of certain pyrolysis-derived gases.
From an environmental standpoint, specific CO2 emissions from the pyrolysis gases were generally lower or comparable to commercial fossil fuels. The cleanest composition was observed in PP_T (4.40 × 10⁻⁵ kg CO2/kJ), notably lower than propane (5.96 × 10⁻⁵), natural gas (5.01 × 10⁻⁵), and significantly better than kerosene (6.94 × 10⁻⁵) or diesel (7.03 × 10⁻⁵). Even the most carbon-intensive sample, PP_W_conv_02, remained within a competitive range at 6.23 × 10⁻⁵ kg CO2/kJ, between the propane and kerosene range.

3.7. Liquid Fraction

The distribution of hydrocarbon chain lengths in the liquid products reveals important trends regarding the influence of both the pyrolysis method and the nature of the plastic feedstock. The results of the liquid fraction are presented in Table 11.
Microwave-assisted pyrolysis with an AC catalyst generally favors the production of lighter hydrocarbons. Samples such as PP_T and PP + PE_W1 exhibited high proportions of C4–C9 compounds (66.7% and 73.5%, respectively), indicating efficient cracking and a product composition more suitable for fuel applications. The PP_W sample also maintained a relatively light profile, with 50.7% in the C4–C9 range and 41.7% in the C10–C13 range, suggesting that even mixed plastic waste can yield favorable distributions under microwave conditions.
In contrast, conventional heating resulted in heavier liquid fractions. The PP_W_conv_01 experiment produced only 20.4% C4–C9 compounds but a dominant 56.2% in the C10–C13 range and a significant 13.5% in the C20+ range. Similarly, PP_W_conv_02, another conventionally heated sample, showed a broader distribution with increased C14–C19 (18.3%) and C20+ (6.9%) fractions. These results suggest that conventional heating leads to less selective cracking, favoring the formation of heavier hydrocarbons.
Feedstock composition also plays a critical role. PP + PE_W2, a mixed plastic waste sample, exhibited the broadest distribution and the highest C20+ content (16.4%), indicative of reduced cracking efficiency.
In the case of catalyst reuse (PP_W2), the concentration of the heavier fractions (C14–C19 and C20+) increases slightly, but the majority still consists of the lighter fractions C4–C9 (40.8%) and C10-C13 (42.5%).

3.8. Energy Distribution: Gas and Liquid Fractions

Using the GHV data (kJ/kg gas mixture) from Table 10 and the product distribution data from Table 6, along with an average value of 45,800 kJ/kg for the liquid fraction, we calculated the energy values presented in Table 12 for both the gaseous and liquid fractions. The energy stored in the gaseous fraction is 7.1 to 10.5 times higher than that in the liquid fraction. This demonstrates the superiority of the microwave-assisted pyrolysis process when using an activated carbon catalyst.

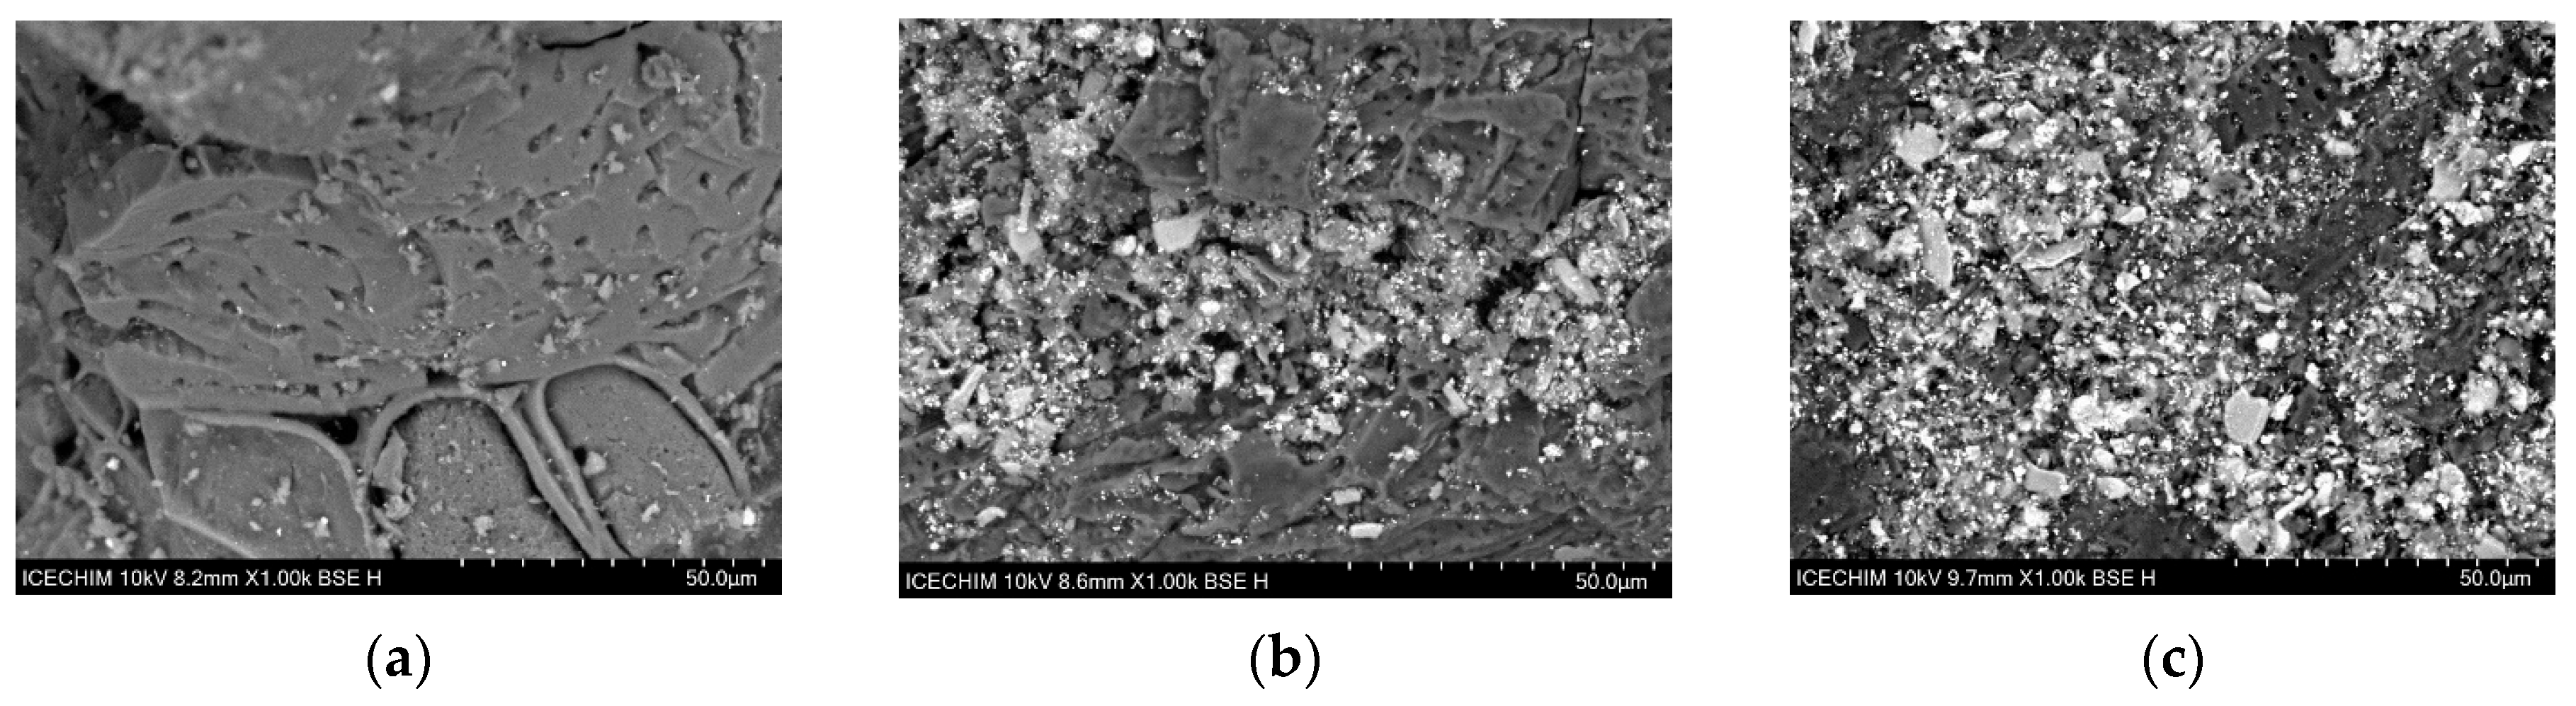
3.9. Morphological and Textural Changes in Activated Carbon and Silicon Carbide

The textural properties of activated carbon were evaluated by BET analysis before and after its use in pyrolysis experiments, with results presented in Table 13. The untreated (control) sample exhibited the highest specific surface area of 825.89 m2/g, a pore volume of 0.45 cm3/g, and an average pore diameter of 3.87 nm, confirming a highly mesoporous structure favorable for catalytic applications.
After exposure to microwave-assisted pyrolysis conditions, the surface area decreased to 604.52 m2/g, with a corresponding reduction in pore volume to 0.34 cm3/g and a slight narrowing of the average pore diameter to 3.80 nm. This loss in surface area may be attributed to deposits of carbon mass during pyrolysis.
In comparison, the activated carbon recovered from conventional pyrolysis showed a less pronounced reduction in surface area (738.17 m2/g) and pore volume (0.40 cm3/g), suggesting a milder impact on the porous structure in the absence of strong microwave-induced gradients.
These data are confirmed by the SEM images of activated carbon and silicon carbide shown in Figure 11 and Figure 12. Abundant deposits of carbonic material are formed on the surface of the activated carbon (more numerous in the case of microwave-assisted pyrolysis). Even though activated carbon lost 26.8% of its specific surface area during pyrolysis, its catalytic activity remains important (see experiments PP_W vs. PP_W2). On the surface of silicon carbide, these deposits of carbonic material are much less numerous.

4. Limitations and Prospects

This study relies on microwave-assisted pyrolysis of polyethylene and polypropylene from end-of-life vehicles. The use of microwaves in the pyrolysis of plastics allows a significant increase in the proportion of the gaseous fraction in the total products obtained. This will allow for industrial units using such a process to easily capitalize on these gaseous fractions that can be used as fuel in electricity generators. When the gaseous fraction has a high hydrogen content, electricity and heat can be obtained with a reduced footprint of CO2 emissions. The results obtained confirm the preponderance of the gaseous fraction (78–90 wt.%) with a high efficiency of obtaining hydrogen of up to 56.4 g H2/g of plastic consumed.
However, to lay the foundations for industrial production units, many additional studies are needed. First and foremost, it is necessary to build a continuously operating installation with a consistent flow rate of several tens of kilograms per hour. Only with such a setup will it be possible to obtain results that enable a proper techno-economic analysis.

5. Conclusions

Pyrolysis-derived gas from plastic waste, particularly polypropylene, has shown significant potential as an alternative fuel. The gas produced exhibits a high energy density, making it a promising sustainable energy source. Additionally, this approach could contribute to reducing carbon emissions, aligning with global efforts to minimize the environmental impact of waste.
Microwave-assisted pyrolysis shows considerable promise in producing cleaner gas compositions with very good value for GHV (kJ/kg). The use of microwaves enhances selectivity towards lighter hydrocarbons, which are highly valuable for fuel refining, thus offering a potential route for producing more refined fuels.
The study also highlights the effectiveness of microwave-assisted pyrolysis in producing hydrogen. This method results in a higher hydrogen yield (up to 34.4 mmol H2/g plastic), with improved efficiency compared to conventional pyrolysis. Enhanced hydrogen production underscores the potential of microwave energy in breaking down polypropylene and promoting the formation of hydrogen-rich gases, which are of great interest for future energy applications.
Furthermore, activated carbon, used as a catalyst in this study, plays a crucial role in enhancing the pyrolysis process. Its presence significantly influences the distribution of liquid and gaseous products, improving the overall yield and promoting the formation of lighter, more valuable hydrocarbons. The combination of microwave energy and activated carbon as a catalyst provides a unique advantage in optimizing product formation and refining the process. Thus, the GHV values of the gaseous fraction are 7.4 to 10.5 times higher than that of the liquid fraction, which is an important advantage because gas fraction can be easily recovered energetically with a reduced carbon footprint.
The results demonstrate that the type of plastic feedstock, particularly the mixture of polypropylene with polyethylene (PP + PE), influences the product yield and composition. Cleaner feedstocks allow for more precise control over the pyrolysis process, leading to more favorable outcomes in terms of product distribution.
The morphological analysis of the activated carbon and silicon carbide used during pyrolysis, carried out by BET analysis and electron microscopy (SEM), showed that carbon deposits are formed on the surface of the activated carbon and, to a lesser extent, on the surface of the silicon carbide. These deposits reduce the specific surface area of the activated carbon, and the possibilities of its reactivation are to be studied. Future work should focus on regenerating spent catalysts to improve long-term viability.
Microwave-assisted pyrolysis presents significant advantages for converting polypropylene waste into valuable fuels, especially when applied to cleaner feedstocks or controlled waste mixtures. Its ability to produce high-quality liquid products and hydrogen-rich gases, along with the use of activated carbon as a catalyst, offers an opportunity for advancing sustainable waste-to-energy technologies and reducing the environmental pollution of plastic waste.

Author Contributions

Conceptualization, I.C. and L.B.; methodology, I.C. and A.F.; formal analysis, C.-G.C.-N.; investigation, G.P.; resources, S.-L.I.; writing—original draft preparation, I.C. and L.B.; writing—review and editing, G.P.; supervision, I.C. All authors have read and agreed to the published version of the manuscript.

Funding

This research received no external funding.

Institutional Review Board Statement

Not applicable.

Informed Consent Statement

Not applicable.

Data Availability Statement

Data are contained within the article.

Acknowledgments

The authors acknowledge that the financial support for this work was provided through: the PN 23.06 Core Program—ChemNewDeal within the National Plan for Research, Development and Innovation 2022–2027, developed with the support of the Ministry of Research, Innovation, and Digitalization, project no. PN 23.06.01.01, AQUAMAT; and the Competitiveness Operational Program 2014–2020, Action 1.1.4: Attracting high-level personnel from abroad to enhance the RD capacity, project: P_37_471, “Ultrasonic/Microwave Nonconventional Techniques as new tools for nonchemical and chemical processes”, financed by contract: 47/05.09.2016.

Conflicts of Interest

Author Alexandru Fiti was employed by the company Daily Sourcing & Research SRL. The remaining authors declare that the research was conducted in the absence of any commercial or financial relationships that could be construed as a potential conflict of interest.

Abbreviations

PPPolypropylene
PEPolyethylene
PSPolystyrene
ELVEnd-of-life vehicle
PVCPolyvinyl chloride
PETPolyethylene terephthalate
PAPolyamide
PCPolycarbonate
PUPolyurethane
LDPELow-density polyethylene
PMMAPolymethyl methacrylate
MWMicrowave
MAPMicrowave-assisted pyrolysis
SiCSilicon carbide
ACActivated carbon
GCGas Chromatography
FTIRFourier-transform infrared spectroscopy
XRDX-ray diffraction
MSMass spectrometry
BSEBackscattered electron
FIDFlame ionization detector
TCDThermal conductivity detector
TGAThermogravimetric analysis
IRInfrared
DTGDerivative thermogravimetry
DSCDifferential scanning calorimetry
GHVGross Heating Value (or Higher Heating Value)
SEMScanning Electron Microscopy
BETBrunauer–Emmett–Teller (surface area analysis method)
BJHBarrett–Joyner–Halenda (desorption branch of the isotherm)

References

  1. European Commission/Environment/Circular Economy—A New Circular Economy Action Plan. For a Cleaner and More Competitive Europe. 2020. Available online: https://ec.europa.eu/environment/circular-economy/index_en.htm (accessed on 15 February 2025).
  2. Davidson, M.G.; Furlong, R.A.; McManus, M.C. Developments in the life cycle assessment of chemical recycling of plastic waste—A review. J. Clean. Prod. 2021, 293, 126163. [Google Scholar] [CrossRef]
  3. Schwarz, A.E.; Ligthart, T.N.; Godoi Bizarro, D.; De Wild, P.; Vreugdenhil, B.; van Harmelen, T. Plastic recycling in a circular economy; determining environmental performance through an LCA matrix model approach. Waste Manag. 2021, 121, 331–342. [Google Scholar] [CrossRef] [PubMed]
  4. Rovinaru, F.I.; Rovinaru, M.D.; Rus, A.V. The Economic and Ecological Impacts of Dismantling End-of-Life Vehicles in Romania. Sustainability 2019, 11, 6446. [Google Scholar] [CrossRef]
  5. Barbeş, L.; Manea, L.C.; Manea, A.T.; Ionaşcu, S.L. Advancements in Automotive Waste Management. In Proceedings of the CONAT 2024 International Congress of Automotive and Transport Engineering, Brasov, Romania, 6–8 November 2024; Springer Nature: Cham, Switzerland, 2025. [Google Scholar]
  6. Institute for Electrotechnical Research and Design. Development of a Methodology for Monitoring the Achievement of Targets Regarding the Reuse, Recycling, and Recovery of End-of-Life Vehicles Internal Report; CALIST Contract No. 5798/13.11.2006; Institute for Electrotechnical Research and Design: Bucharest, Romania, 2006. (In Romanian) [Google Scholar]
  7. Pischinger, S.; Seiffert, U. Vieweg Handbuch Kraftfahrzeugtechnik, 9th ed.; Springer: Berlin/Heidelberg, Germany, 2021; ISBN 978-3-658-25556-5. [Google Scholar]
  8. Cardamone, G.F.; Ardolino, F.; Arena, U. Can plastics from end-of-life vehicles be managed in a sustainable way? Sustain. Prod. Consum. 2022, 29, 115–127. [Google Scholar] [CrossRef]
  9. Ortego, A.; Russo, S.; Iglesias-Émbil, M.; Valero, A.; Magdalena, R. Exergy Assessment of Plastic Car Parts. Vehicles 2023, 5, 1211–1226. [Google Scholar] [CrossRef]
  10. Jeswani, H.; Kruger, C.; Russ, M.; Horlacher, M.; Antony, F.; Hann, S.; Azapagic, A. Life cycle environmental impacts of chemical recycling via pyrolysis of mixed plastic waste in comparison with mechanical recycling and energy recovery. Sci. Total Environ. 2021, 769, 144483. [Google Scholar] [CrossRef]
  11. Zhang, C.-Y.; Nakatani, J. Implications of chemical recycling of plastic waste for climate change impacts: A critical review. Sustain. Prod. Consum. 2024, 48, 301–323. [Google Scholar] [CrossRef]
  12. Das, S.; Liang, C.; Dunn, J.B. Plastics to fuel or plastics: Life cycle assessment-based evaluation of different options for pyrolysis at end-of-life. Waste Manag. 2022, 153, 81–88. [Google Scholar] [CrossRef]
  13. Radhakrishnan, K.; Senthil Kumar, P.; Rangasamy, G.; Praveen Perumal, L.; Sanaulla, S.; Nilavendhan, S.; Manivasagan, V.; Saranya, K. A critical review on pyrolysis method as sustainable conversion of waste plastics into fuels. Fuel 2023, 337, 126890. [Google Scholar] [CrossRef]
  14. Jahirul, M.I.; Rasul, M.G.; Schaller, D.; Khan, M.M.K.; Hasan, M.M.; Hazrat, M.A. Transport fuel from waste plastics pyrolysis—A review on technologies, challenges opportunities. Energy Convers. Manag. 2022, 258, 115451. [Google Scholar] [CrossRef]
  15. Kulas, D.G.; Zolghadr, A.; Chaudhari, U.S.; Shonnard, D.R. Economic and environmental analysis of plastics pyrolysis after secondary sortation of mixed plastic waste. J. Clean. Prod. 2023, 384, 135542. [Google Scholar] [CrossRef]
  16. Hasan, M.M.; Haque, R.; Jahirul, M.I.; Rasul, M.G. Pyrolysis of plastic waste for sustainable energy Recovery: Technological advancements and environmental impacts. Energy Convers. Manag. 2025, 326, 119511. [Google Scholar] [CrossRef]
  17. Kibria, M.G.; Masuk, N.I.; Safayet, R.; Nguyen, H.Q.; Mourshed, M. Plastic Waste: Challenges and Opportunities to Mitigate Pollution and Effective Management. Int. J. Environ. Res. 2023, 17, 20. [Google Scholar] [CrossRef] [PubMed]
  18. Garcia-Gutierrez, P.; Amadei, A.M.; Klenert, D.; Nessi, S.; Tonini, D.; Tosches, D.; Ardente, F.; Saveyn, H. Environmental and Economic Assessment of Plastic Waste Recycling; EUR 31423 EN; Publications Office of the European Union: Luxembourg, 2023. [Google Scholar] [CrossRef]
  19. Eze, W.U.; Umunakwe, R.; Obasi, H.C.; Ugbaja, M.I.; Uche, C.C.; Madufor, I.C. Plastics waste management: A review of pyrolysis technology. Clean Technol. Recycl. 2021, 1, 50–69. [Google Scholar] [CrossRef]
  20. Venturelli, M.; Falletta, E.; Pirola, C.; Ferrari, F.; Milani, M.; Montorsi, L. Experimental evaluation of the pyrolysis of plastic residues and waste tires. Appl. Energy 2022, 323, 119583. [Google Scholar] [CrossRef]
  21. van Eijk, F.; Beuken, E.; Sederel, W.; Groen, J.; Perez, M.; Locati, G. Chemical Recycling in Circular Perspective. From Vision to Action: How Chemical Recycling Steers the Transition Towards a Circular and Carbon Neutral Chemical Industry. 2023. Available online: https://circulareconomy.europa.eu/platform/sites/default/files/2023-08/Chemical%20Recycling%20in%20Circular%20Perspective.pdf (accessed on 2 June 2025).
  22. Munir, D.; Irfan, M.F.; Usman, M.R. Hydrocracking of virgin and waste plastics: A detailed review. Renew. Sustain. Energy Rev. 2018, 90, 490–515. [Google Scholar] [CrossRef]
  23. Munir, D.; Amer, H.; Aslam, R.; Bououdina, M.; Usman, M.R. Composite zeolite beta catalysts for catalytic hydrocracking of plastic waste to liquid fuels. Mater. Renew. Sustain. Energy 2020, 9, 9. [Google Scholar] [CrossRef]
  24. Kunwar, B.; Moser, B.R.; Chandrasekaran, S.R.; Rajagopalan, N.; Sharma, B.K. Catalytic and thermal depolymerization of low value post-consumer high density polyethylene plastic. Energy 2016, 111, 884–892. [Google Scholar] [CrossRef]
  25. Kumari, A.; Kumar, S. Pyrolytic degradation of polyethylene in autoclave under high pressure to obtain fuel. J. Anal. Appl. Pyrolysis 2017, 124, 298–302. [Google Scholar] [CrossRef]
  26. Brems, A.; Dewil, R.; Baeyens, J.; Zhang, R. Gasification of plastic waste as waste-to-energy or waste-to-syngas recovery route. Nat. Sci. 2013, 5, 695–704. [Google Scholar] [CrossRef]
  27. Calinescu, I.; Psenovschi, G.; Cojocaru, M.; Chisega-Negrila, C.G.; Albulescu, C.; Brebu, M.; Trifan, A.; Ignat, N.D.; Chipurici, P. Catalytic Pyrolysis of Low-Density Polyethylene Waste. Sustainability 2024, 16, 6788. [Google Scholar] [CrossRef]
  28. Punkkinen, H.; Oasmaa, A.; Luntama, J.L.; Nieminen, M.; Laine-Ylijok, J. Thermal Conversion of Plastic Containing Waste: A Review; Research Report No D4.1-22; VTT’s Research Information Portal: Espoo, Finland, 2017. [Google Scholar]
  29. Wang, X.; Cheng, H.; Ye, G.; Fan, J.; Yao, F.; Wang, Y.; Jiao, Y.; Zhu, W.; Huang, H.; Ye, D. Key factors and primary modification methods of activated carbon and their application in adsorption of carbon-based gases: A review. Chemosphere 2022, 287, 131995. [Google Scholar] [CrossRef]
  30. Sun, K.; Huang, Q.; Meng, X.; Chi, Y.; Yan, J. Catalytic pyrolysis of waste polyethylene into aromatics by H3PO4-activated carbon. Energy Fuels 2018, 32, 9772–9781. [Google Scholar] [CrossRef]
  31. González, Y.S.; Costa, C.; Márquez, M.C.; Ramos, P. Thermal and catalytic degradation of polyethylene wastes in the presence of silica gel, 5A molecular sieve and activated carbon. J. Hazard. Mater. 2011, 187, 101–112. [Google Scholar] [CrossRef] [PubMed]
  32. Zhang, Y.; Duan, D.; Lei, H.; Villota, E.; Ruan, R. Jet fuel production from waste plastics via catalytic pyrolysis with activated carbons. Appl. Energy 2019, 251, 113337. [Google Scholar] [CrossRef]
  33. Dong, Y.; Liu, B.; He, M.; Zhang, Z.; Tang, C.; Zhao, J.; Wu, H.; Fan, Y.; Ma, W. Microwave-coupled recycling of plastic waste into hydrogen and carbon nanotubes over economical iron-based catalyst. Int. J. Hydrogen Energy 2025, 115, 24–36. [Google Scholar] [CrossRef]
  34. Hu, X.; Ma, D.; Zhang, G.; Ling, M.; Hu, Q.; Liang, K.; Lu, J.; Zheng, Y. Microwave-assisted pyrolysis of waste plastics for their resource reuse: A technical review. Carbon Resour. Convers. 2023, 6, 215–228. [Google Scholar] [CrossRef]
  35. Liu, Z.; Xie, M.; Zhou, T.; Yang, J.; Yang, Y.; Liu, T.; Dai, S.; Huang, Q.; Cen, Q.; Xiao, P.; et al. A review on liquid fuel produced from microwave-assisted pyrolysis of plastic waste. Process Saf. Environ. Prot. 2024, 187, 833–844. [Google Scholar] [CrossRef]
  36. Zhou, N.; Dai, L.; Lv, Y.; Li, H.; Deng, W.; Guo, F.; Chen, P.; Lei, H.; Ruan, R. Catalytic pyrolysis of plastic wastes in a continuous microwave assisted pyrolysis system for fuel production. Chem. Eng. J. 2021, 418, 129412. [Google Scholar] [CrossRef]
  37. Islam, K.M.O.; Ahmad, N.; Ummer, A.C.; Ahmed, U.; Siddiqui, M.N.; Millan, M.; Abdul Jameel, A.G. Microwave-Assisted pyrolysis of waste plastics: A comprehensive review on process parameters, catalysts, and future prospects. Results Eng. 2025, 26, 105571. [Google Scholar] [CrossRef]
  38. Putra, P.H.M.; Rozali, S.; Patah, M.F.A.; Idris, A. A review of microwave pyrolysis as a sustainable plastic waste management technique. J. Environ. Manag. 2022, 303, 114240. [Google Scholar] [CrossRef]
  39. Guo, G.; Fan, K.; Guo, Z.; Guo, W. Pyrolysis behavior of automotive polypropylene plastics: ReaxFF molecular dynamics study on the co-pyrolysis of polypropylene and EPDM/POE. Energy 2023, 280, 128202. [Google Scholar] [CrossRef]
  40. Demirbas, A. Pyrolysis of municipal plastic wastes for recovery of gasoline-range hydrocarbons. J. Anal. Appl. Pyrolysis 2004, 72, 97–102. [Google Scholar] [CrossRef]
  41. Kevin Ejiogu, I.; Ibeneme, U.; Olukemi Aiyejagbara, M.; Oyemachi, D. Pyrolysis of Waste Plastics as an Effective Tool in Sustainable Environmental Waste Management. Mod. Chem. 2021, 9, 33–39. [Google Scholar] [CrossRef]
  42. Zhou, X.-L.; He, P.-J.; Peng, W.; Lü, F.; Shao, L.-M.; Zhang, H. From plastics to methane and carbon spheres: The evolution of pyrolysis products during pyrolysis under autogenic atmosphere. J. Anal. Appl. Pyrolysis 2022, 161, 105421. [Google Scholar] [CrossRef]
  43. The Engineering ToolBox. Heating Values of Fuel Gases. Available online: https://www.engineeringtoolbox.com/heating-values-fuel-gases-d_823.html (accessed on 15 May 2025).
  44. Socrates, G. Infrared and Raman Characteristic Group Frequencies: Tables and Charts; John Wiley & Sons: Hoboken, NJ, USA, 2004; pp. 53, 73–75. ISBN 978-0-470-09307-8. [Google Scholar]
  45. Barbes, L.; Stihi, C.; Radulescu, C. ATR-FTIR spectrometry characterisation of polymeric materials. Rom. Rep. Phys. 2014, 66, 765–777. [Google Scholar]
  46. Dai, S.; Luo, C.; Zhang, C.; Wang, H.; Zhang, Y.; Yuan, L. Determination of small-amount polypropylene in imported recycled polyethylene/polypropylene blends by Fourier transform infrared spectroscopy. EDP Sci. 2021, 261, 02067. [Google Scholar] [CrossRef]
  47. Bashirgonbadi, A.; Ureel, Y.; Delva, L.; Fiorio, R.; Van Geem, K.M.; Ragaert, K. Accurate determination of polyethylene (PE) and polypropylene (PP) content in polyolefin blends using machine learning-assisted differential scanning calorimetry (DSC) analysis. Polym. Test. 2024, 131, 108353. [Google Scholar] [CrossRef]
  48. Ding, K.; Liu, S.; Huang, Y.; Liu, S.; Zhou, N.; Peng, P.; Wang, Y.; Chen, P.; Ruan, R. Catalytic microwave-assisted pyrolysis of plastic waste over NiO and HY for gasoline-range hydrocarbons production. Energy Convers. Manag. 2019, 196, 1316–1325. [Google Scholar] [CrossRef]
  49. Cui, Y.; Zhang, Y.; Cui, L.; Liu, Y.; Li, B.; Liu, W. Microwave-assisted pyrolysis of polypropylene plastic for liquid oil production. J. Clean. Prod. 2023, 411, 137303. [Google Scholar] [CrossRef]
  50. Cui, Y.; Zhang, Y.; Cui, L.; Xiong, Q.; Mostafa, E. Microwave-assisted fluidized bed reactor pyrolysis of polypropylene plastic for pyrolysis gas production towards a sustainable development. Appl. Energy 2023, 342, 121099. [Google Scholar] [CrossRef]
  51. Carbon Dioxide Emissions Coefficients. Available online: https://www.eia.gov/environment/emissions/co2_vol_mass.php (accessed on 14 May 2025).
Figure 1. Schematic diagram of working procedure.
Sustainability 17 06196 g001
Figure 2. A typical example of chromatograms for a gas mixture. (A) carrier gas—helium, FID detector—used for calculating volume concentrations for: C2—C6 hydrocarbons; (B) carrier gas—helium, TCD detector—used for calculating volume concentrations for: O2, N2, CO, CH4, C2H6, and CO2; (C) carrier gas—argon, TCD detector—used for calculating volume concentrations for H2.
Sustainability 17 06196 g002
Figure 3. Representative chromatograms of liquid products (A) and a hydrocarbon standard (B).
Sustainability 17 06196 g003
Figure 4. Microwave-catalytic pyrolysis installation. 1—Microwave Generator GMP 30K SM 56T400 FST 3 IR (Sairem—France); 2—Standard WR340 waveguide (Sairem France, Décines-Charpieu, France); 3—2.45 GHz 4-Stub Automatic Tuner AI 4S A 2450/340 (Sairem—France); 4—Single-mode cavity (Sairem—France); 5—Sliding Short Circuit PCCMWR340L130PVMR1PE (Sairem—France); 6—Quartz reactor; 7—Digital mass flow controller for nitrogen—Smart-Trak® 50 Series (Sierra—USA, Sierra, CA, USA); 8—Liquid fraction collection vessel; 9—1 Liter Tedlar bag (CEL Scientific Corporation—USA, Santa Fe Springs, CA, USA) for collecting gaseous fraction; 10—Infrared sensor Micro-epsilon (Messtechnik—Germany, Hofgeismar, Germany).
Sustainability 17 06196 g004
Figure 5. FT-IR analysis of plastic samples. PE_T—granules of polyethylene; PP_T—granules of polypropylene; PP_W—polypropylene waste obtained from automotive dismantling; PE+PP-1 and PE+PP-2—mixtures of polyethylene and polypropylene waste obtained from automotive dismantling.
Sustainability 17 06196 g005
Figure 6. DSC analysis of plastic samples.
Sustainability 17 06196 g006
Figure 7. X-ray diffraction patterns of plastic raw materials.
Sustainability 17 06196 g007
Figure 8. TGA/DTG analysis of plastic waste: (a) TGA analysis; (b) DTG analysis.
Sustainability 17 06196 g008
Figure 9. Schematic representation of layered configurations in the quartz reactor: (a) Layered configurations; (b) quartz reactor in the single mode cavity: 1—single-mode cavity; 2—quartz reactor; 3—Teflon rings coated with aluminum foil for reactor centering; 4—reactor filling, in the active area; 5—additional reactor filler. The dimensions of the monomode cavity and the quartz reactor are shown in mm.
Sustainability 17 06196 g009
Figure 10. Calorific value (GHV) and CO2 specific emissions of gaseous fraction obtained at microwave assisted pyrolysis of plastic vs. conventional fuels.
Sustainability 17 06196 g010
Figure 11. SEM images (×1000) of activated carbon. (a) initial; (b) conventional pyrolysis (PP_W_conv_1) (c) microwave-assisted pyrolysis (PP_W).
Sustainability 17 06196 g011
Figure 12. SEM images (x1000) of silicon carbide. (a) initial; (b) conventional pyrolysis (PP_W_conv_1) (c) microwave-assisted pyrolysis (PP_W).
Sustainability 17 06196 g012
Table 1. Overview of plastic waste recycling and recovery processes applied in Europe.
ProcessTarget PlasticTemperature RangeMain OutputsReferences
Mechanical recyclingPE, PP, PS, PET20–250 °CPellets, flakes[17,18]
Chemical recyclingMixed plastic waste-Feedstock for the chemical industry[19]
Solvent purificationPS, PE, PP, PVC100–250 °CPurified polymers, monomers[17,18]
Chemical depolymerizationPA, PC, PU, PET200–300 °CMonomers
(e.g., terephthalic acid, ethylene glycol)
[20]
Hydro-conversionMixed plastics300–500 °CSynthetic fuels[21,22]
Thermal
depolymerization
PMMA, PS450–600 °CMonomers
(e.g., styrene)
[18,23]
GasificationMixed plastic waste700–1200 °CSyngas (CO + H2), slag[24,25,26]
PyrolysisMixed plastic waste, PE, PP, PS400–800 °CLiquid fuels, syngas, and char[16,17,27,28]
Thermo-catalytic
degradation
PE, PP, PS, 400–600 °CLower-molecular
hydrocarbons,
aromatics
[22,27]
Table 2. Main parameters of microwave-assisted plastic waste pyrolysis.
ParameterValue
Microwave frequency2.45 GHz
Maximum MW power600 W
Cavity typeMonomode
Reactor materialQuartz
Table 3. Gross heating value and CO2 emissions for gaseous fractions [43].
ComponentGross Heating Value, kJ/m3CO2 Emissions (L/L)
H212.1090
CO12.0351
CH437.6691
C2H666.4332
CO2 0.000 0
C2H460.7692
C3H895.8303
C3H687.0373
i-C4H10120.1604
n-C4H10120.1604
1-C4H8114.6464
2-C4H8114.6464
C5148.3285
C6173.8886
Table 4. Characterization of plastic samples with FT-IR spectral data.
SampleAbsorption Bands (cm−1)AssignmentsReferences
PE_T2915 (vs)
2847 (s)
1465 (m)
719 (m)
−CH2– (asy) C–H stretch
–CH2– (sy) C–H stretch
–CH2– scissoring vibration
–CH2–rocking vibration
[44]
PP_T
PP_W
2954 (m)
2917 (s)
2844 (w)
1455; 1456 (m)
1376 (m-s)
–CH3(asy) C–H stretch
–CH2– (asy) C–H stretch
–CH2– (sy) C–H stretch
–CH2–scissoring vibration
-CH3 umbrella bending mode
[45]
PE+PP-1
PE+PP-2
2954 (m)
2915 (s)
2847 (w)
1459; 1455 (m)
1376 (m-s)
1165 (m-s)
–CH3(asy) C–H stretch
–CH2– (asy) C–H stretch
–CH2– (sy) C–H stretch
–CH2–scissoring vibration
–CH3 umbrella bending mode
–CH3 symmetric deformation and
C–C backbone
[46]
(vs)—very strong band; (s)—strong band; (m)—medium band; (w)—weak band; (m-s)—medium-strong band. (asy)—asymmetric; (sy)—symmetric.
Table 5. Experimental yields and hydrogen production for each reactor configuration using polypropylene feedstock.
ConfigurationAmounts (g)Content (%)Conversion
(%)
H2
(vol.%)
Feedstock AC SiCSiCAC
PP_T_0133545.4527.27557.25
PP_T_02601571.430.006616.19
PP_T_0336430.7746.1562.319.75
PP_T_0436535.7142.869.510.41
PP_T_0536430.7746.1540.319.27
PP_T_0636535.7142.865725.37
PP_T_0740866.670.0093.5022.74
PP_T_0845743.7531.2592.7513.87
PP_T_0945.5845.7131.4390.345.23
Table 6. Product distribution from microwave and conventional pyrolysis of various polypropylene and polyethylene feedstocks.
Exp.Results (wt.%)Conversion
(%)
H2 Efficiency
(g/g)
H2 Yield
(mmol/g Plastic)
Unreacted SolidLiquidGas
PE_T7 ± 0.1512.1 ± 0.69.95 ± 1.177.9 ± 1.593.0 ± 0.420.03 ± 1.614.3 ± 0.6
PP_T9.75 ± 0.36.65 ± 1.211.91 ± 1.381.44 ± 1.590.3 ± 0.344.81 ± 1.832.0 ± 0.3
PP_W5 ± 0.057.72 ± 0.714.39 ± 1.577.89 ± 1.895.0 ± 0.227.5 ± 3.519.7 ± 2.4
PP+PE_W11 ± 0.222.32 ± 2.111.3 ± 1.266.7 ± 1.799.0 ± 0.556.4 ± 2.134.4 ± 0.4
PP+PE_W23.17 ± 0.74.48 ± 0.037.08 ± 2.087.08 ± 1.096.8 ± 0.68.66 ± 0.16.2 ± 0.1
PP_W_conv_13.6 ± 0.13.46 ± 0.56.92 ± 0.889.62 ± 1.996.3 ± 0.36.68 ± 0.34.77 ± 1.4
PP_W_conv_20.2 ± 0.050.1 ± 0.0213.3 ± 0.785.6 ± 2.199.0 ± 0.23.64 ± 0.42.6 ± 1.2
PP_W216.5 ± 0.84.4 ± 0.610.4 ± 0.785.2 ± 1.883.3 ± 0.537.2 ± 0.526.5 ± 0.8
Table 7. Comparison of the product distribution between our work and those reported in the literature for PP and PE plastics.
ReferencesFeedMicrowave Oven and SettingsTemp.Product Distribution
[48]LDPE6 microwave ovens with power of 1800 W and frequency of 2.45 GHz were used. 1 L round-bottom flask was used as a reactor vessel. SiC absorbent. Microwave power used 150–200 W. HY catalyst450 °COil: 34%
Gas: 38%
Coke: 28%
500 °COil: 57%
Gas: 42%
Coke: 3%
550 °COil: 54%
Gas: 44%
Coke: 2%
600 °COil: 49%
Gas: 50%
Coke: 1%
[49]PPMicrowave power: 0–1000 W, Frequency: 2.45 GHz, 100 mL Quartz reactor used as vessel, Absorbent SiC: 2–3 mm, Microwave power used 600 W350 °COil: 3%
Gas: 8%
Residue: 89%
450 °COil: 79%
Gas: 14%
Residue: 7%
550 °COil: 66%
Gas: 34%
Residue: 0%
[50]PPMicrowave fluidizing bed reactor was used. Microwave oven power range: 200–1000 W, Microwave frequency: 2.45 GHz, Absorbent SiC: 40 g, Microwave power used 800 W, Fluidizing velocity: 2.3 × 10⁻³ m/s700 °CWax: 35%
Gas: 65%
900 °CWax: 24%
Gas: 76%
1000 °CWax: 34%
Gas: 66%
1100 °CWax: 39%
Gas: 61%
This paperPE
PP
PP+PE
Quartz reactor in monomode applicator; 2.45 GHz; 600 W max power500–700 °C
500–700 °C
500–700 °C
Oil: 9.9%
Gas: 77.9%
Residue: 12.1%
Unreacted: 7%
Oil: 10.4–14.4%
Gas: 77.9–85.2%
Residue: 4.4–7.7%
Unreacted: 5–16.5%
Oil: 7.1–11.3%
Gas: 66.7–87–1
Residue: 4.5–22%
Unreacted: 1–3.2%
Table 8. Gas concentration of gas fraction from microwave and conventional pyrolysis.
Exp.Concentration (vol.%)
H2COCH4C2H6CO2C2H4C3H8C3H6i-C4H10n-C4H101-C4H82-C4H8C5C6+
PE_T36.632.1122.765.420.7118.391.943.930.001.002.041.920.572.59
PP_T45.231.0443.288.611.510.030.030.150.010.000.000.070.020.02
PP_W46.500.7816.524.254.0915.531.895.410.220.150.592.060.481.52
PP + PE_W175.350.160.297.070.350.681.213.350.360.290.302.681.516.41
PP + PE_W220.050.6823.328.252.5019.641.797.960.950.581.164.922.255.93
PP_W_conv_116.510.3526.629.653.2413.342.317.651.381.481.115.903.297.16
PP_W_conv_29.320.0030.0010.690.0021.002.169.870.300.431.386.551.696.61
PP_W246.162.3727.072.330.5414.321.22.430.160.070.311.520.371.15
Table 9. GHV and CO2 emissions on various types of plastics—MW and conventional pyrolysis.
Exp.GHVmixtureCO2 EmissionsCO2 Specific
Emissions
kJ/m3kJ/kgL CO2/L Gas
Mixture
kg CO2/kJ
PE_T44,398.2549,750.551.285.68 × 10−5
PP_T27,959.2154,320.320.634.40 × 10−5
PP_W37,577.7847,625.471.365.82 × 10−5
PP + PE_W136,016.2055,087.350.904.92 × 10−5
PP + PE_W259,826.7246,941.681.866.12 × 10−5
PP_W_conv_0164,272.6846,313.502.026.17 × 10−5
PP_W_conv_0266,926.8348,457.282.126.23 × 10−5
PP_W234,509.6352,137.780.915.16 × 10−5
Table 10. Calorific power and carbon intensity of commercial fuels [10,43,51].
FuelGHVCO2 Emissions
kJ/m3kJ/kgkg CO2/kJ
propane99,00050,4005.96 × 10−5
kerosene37,40046,2006.94 × 10−5
diesel38,57845,6007.03 × 10−5
natural gas37,28552,2005.01× 10−5
Table 11. Liquid fraction analysis, C4–C9 (Gasoline), C10–C13 (Kerosene), C14–C19 (Diesel), C20+ (Heavy).
Exp.C4–C9
(wt. %)
C10–C13
(wt. %)
C14–C19
(wt. %)
C20+
(wt. %)
PP_T66.7 ± 527.5 ± 74.3 ± 21.45 ± 1
PP_W50.7 ± 741.7 ± 86 ± 0.31.5 ± 1.2
PP + PE_W173.5 ± 615.7 ± 35.7 ± 25.1 ± 2
PP + PE_W236.4 ± 1235 ± 811.6 ± 716.4 ± 13
PP_W_conv_0120.4 ± 456.2 ± 89.9 ± 1.113.5 ± 1.5
PP_W_conv_0235.9 ± 638.8 ± 6.518.3 ± 36.9 ± 2
PP_W240.8 ± 942.5 ± 810.2 ± 46.5 ± 3
Table 12. Energy distribution of gas and liquid fractions.
Exp.GHV
GasLiquidGas/Liquid
PE_T38,755.684557.18.50
PP_T44,238.475450.28.12
PP_W37,095.485221.27.10
PP + PE_W136,836.914950.97.44
PP + PE_W240,876.823893.010.50
PP_W244,421.394763.29.33
Table 13. BET analysis of activated carbon.
Exp.Surface Area
(m2/g)
Pore Volume
(cm3/g)
Pore Diameter
(nm)
control825.890.453.87
MW604.520.343.80
conventional738.170.43.85
Disclaimer/Publisher’s Note: The statements, opinions and data contained in all publications are solely those of the individual author(s) and contributor(s) and not of MDPI and/or the editor(s). MDPI and/or the editor(s) disclaim responsibility for any injury to people or property resulting from any ideas, methods, instructions or products referred to in the content.

