

Game Analysis Between Manufacturer and Retailer Under Carbon Tax Policy
Abstract
1. Introduction
2. Methodology
2.1. Problem Description and Symbol Explanation
2.2. Model Assumptions
- Consumer demand rises with the rise in the manufacturer’s carbon abatement rate or retailer’s promotion rate but decreases with the increase in retail price per unit commodity. And we have ; among them, represents market capacity, , , and represent the sensitivity coefficients of consumer demand to the commodity’s retail price, manufacturer’s carbon abatement rate, and retailer’s promotion rate, respectively, and , , , and .
- The manufacturer implements carbon abatement measures to increase its carbon abatement rate, such as adopting efficient carbon abatement technologies, and pays the carbon abatement cost. This cost increases with the increase in , that is , and the increase shows an accelerating trend, that is . The article here supposes that , where represents the manufacturer’s carbon abatement cost coefficient.
- The retailer increases their promotion rate by increasing advertising investment. Similarly to the carbon abatement cost of the manufacturer, the article here supposes that , where represents the retailer’s promotion cost coefficient.
- Within a sales cycle, the possible inventory cost and shortage cost of the product are out of consideration.
- The manufacturer and retailer have complete information, and both parties are rational players in the game.
- For the simplification of the model, the article here supposes that the manufacturer’s production cost equals 0.
3. Results and Discussion
3.1. Model Solutions
3.1.1. A Centralized Scenario
3.1.2. A Decentralized Scenario
3.2. Model Analyses
3.2.1. The Comparisons of the Optimal Carbon Abatement Rates and Supply Chain Profits in the Two Games
3.2.2. Sensitivity Analyses
- (1)
- The sensitivity analyses of the optimal carbon abatement rates
- (2)
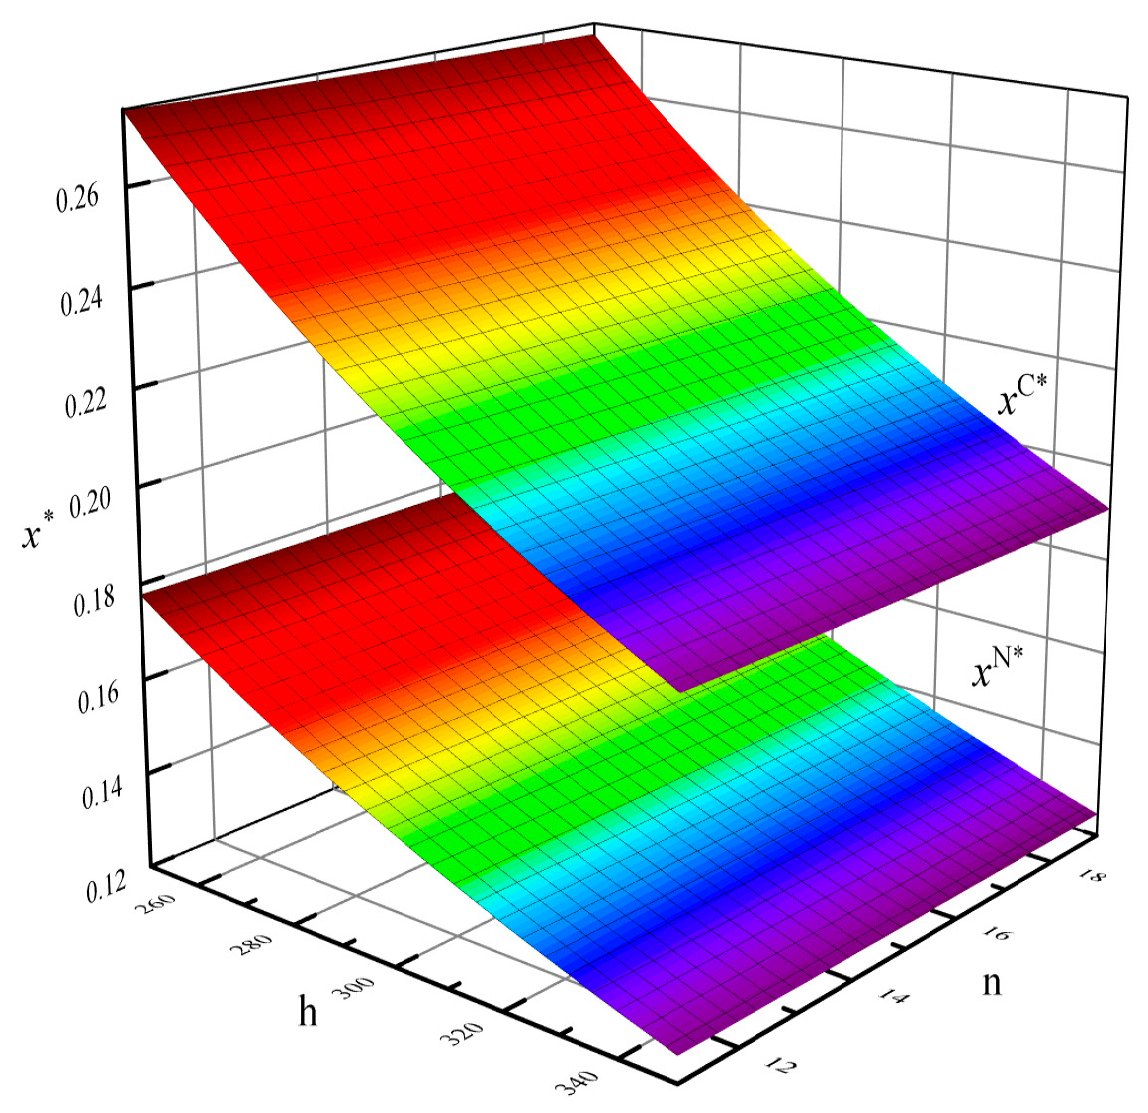
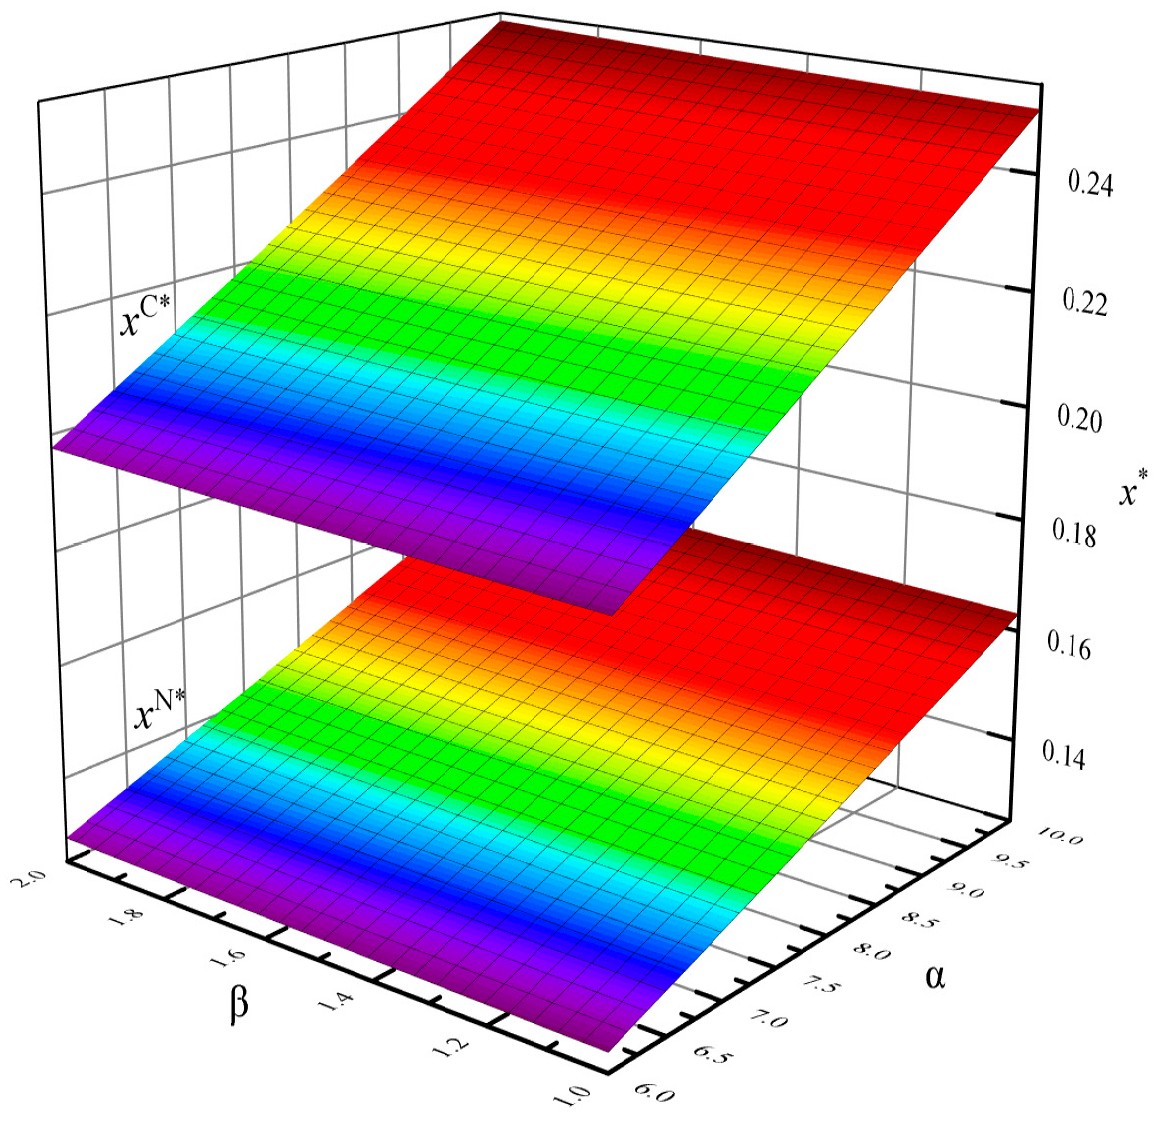
- The sensitivity analyses of the optimal retail prices
- (3)
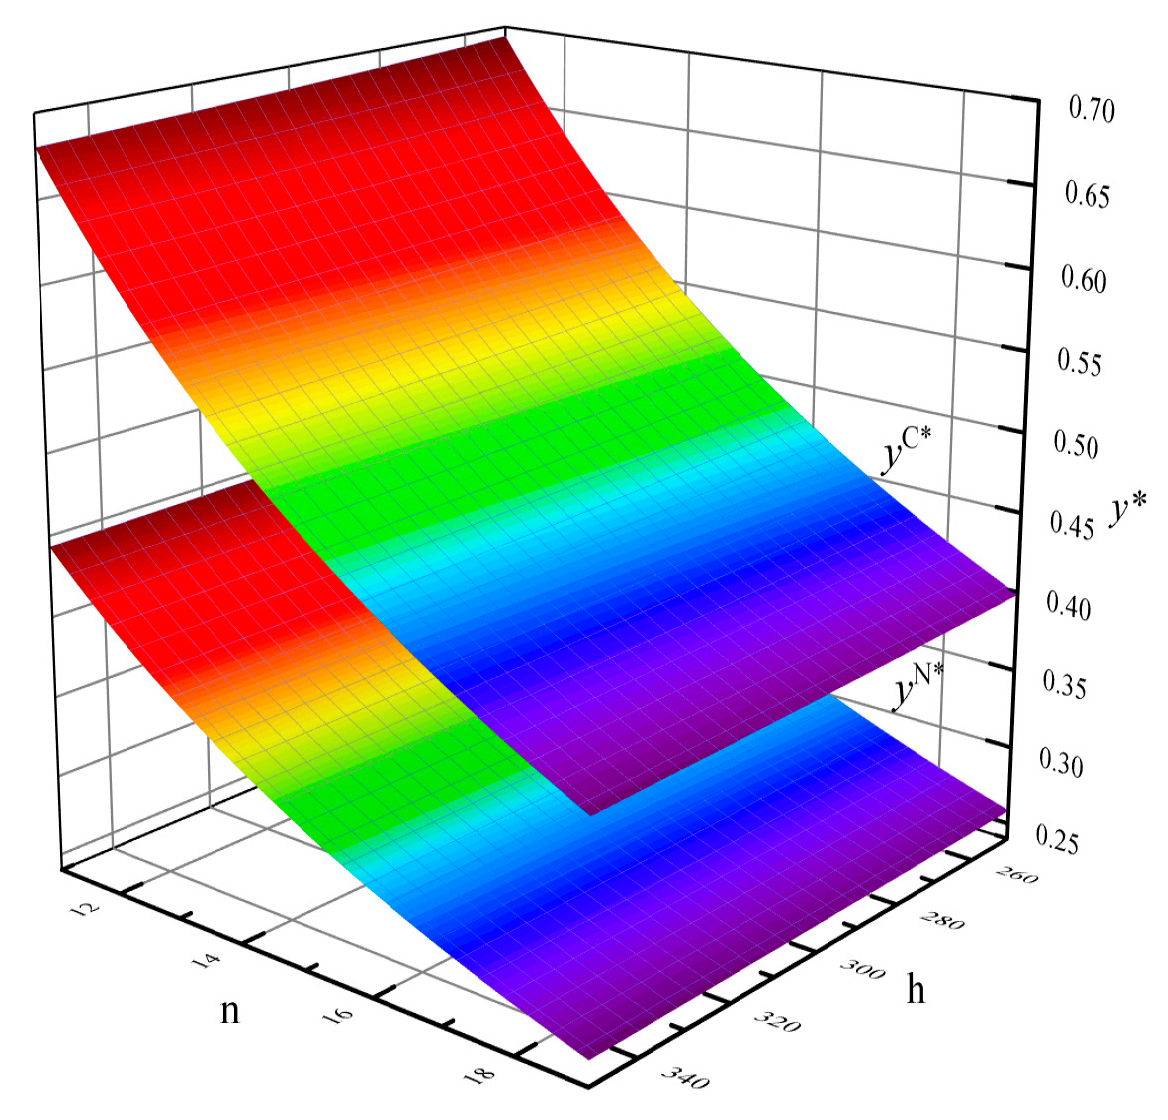
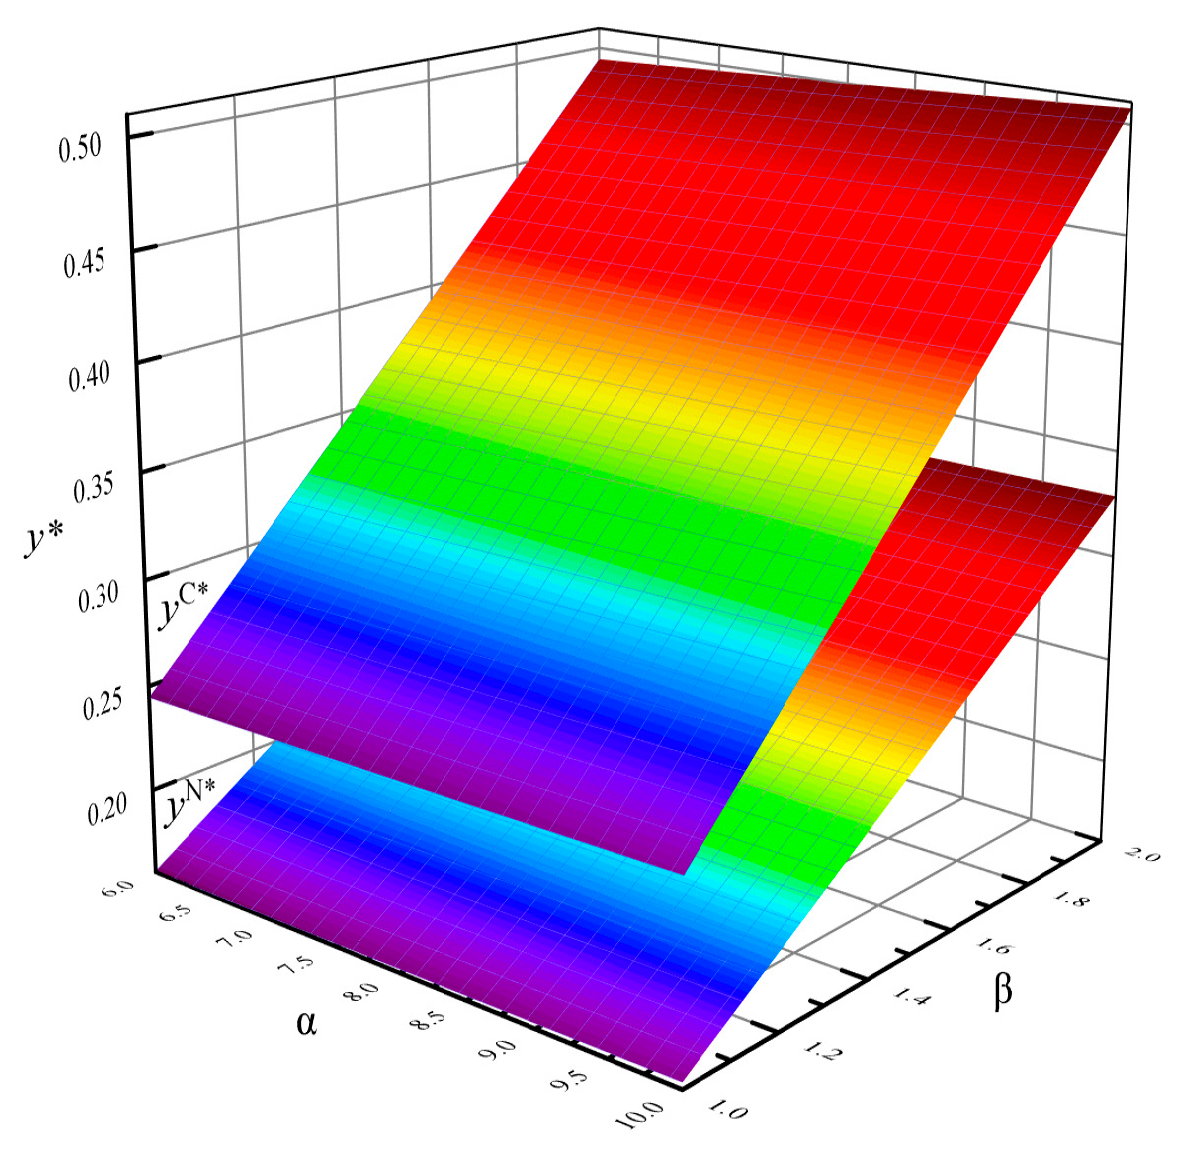
- The sensitivity analyses of the optimal promotion rates
- (4)
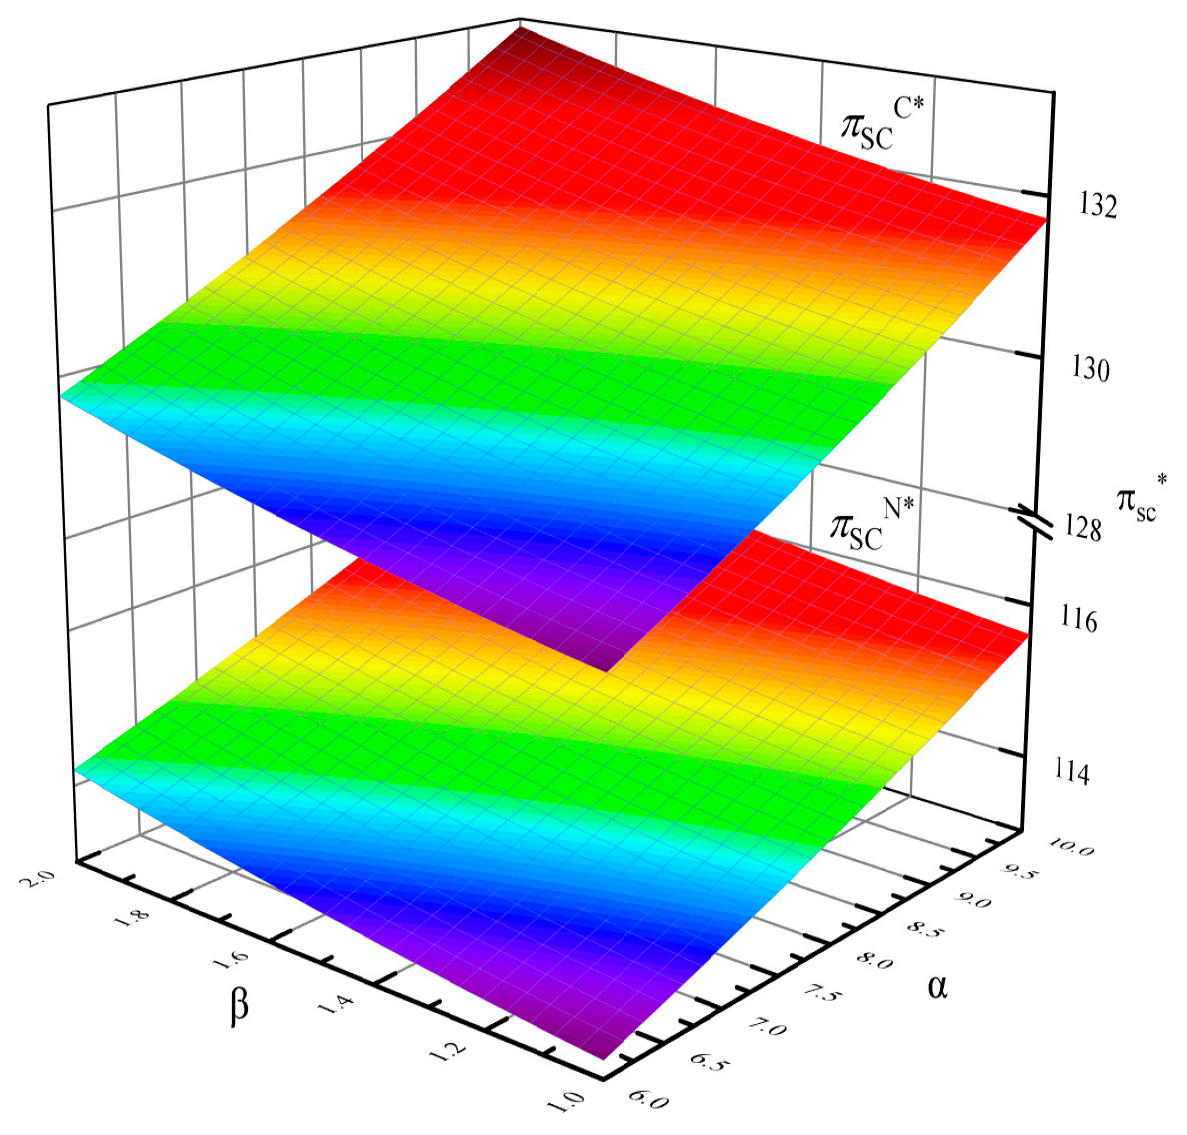
- The sensitivity analyses of the optimal supply chain profits
3.3. Numerical Simulations
3.3.1. The Comparisons of the Optimal Carbon Abatement Rates and Supply Chain Profits in the Two Games
3.3.2. Sensitivity Analyses
- (1)
- The sensitivity analyses of the optimal carbon abatement rates
- (2)
- The sensitivity analyses of the optimal retail prices
- (3)
- The sensitivity analyses of the optimal promotion rates
- (4)
- The sensitivity analyses of the optimal supply chain profits
4. Conclusions
Author Contributions
Funding
Institutional Review Board Statement
Informed Consent Statement
Data Availability Statement
Conflicts of Interest
References
- IPCC. Summary for policymakers. In Climate Change 2023: Synthesis Report; Contribution of Working Groups I, II and III to the Sixth Assessment Report of the Intergovernmental Panel on Climate Change; Core Writing Team, Lee, H., Romero, J., Eds.; IPCC: Geneva, Switzerland, 2023; pp. 1–34. [Google Scholar]
- Grubb, M.; Poncia, A.; Drummond, P.; Neuhoff, K.; Hourcade, J. Policy complementarity and the paradox of carbon pricing. Oxf. Rev. Econ. Policy 2023, 39, 711–730. [Google Scholar] [CrossRef]
- Su, L.; Cao, Y.; Zhang, W. Low-carbon supply chain operation decisions and coordination strategies considering the consumers’ preferences. Sustainability 2023, 15, 11078. [Google Scholar] [CrossRef]
- Yang, S.; Yu, J. Low-carbonization game analysis and optimization in a two-echelon supply chain under the carbon-tax policy. J. Chin. Econ. Foreign Trade Stud. 2016, 9, 113–130. [Google Scholar] [CrossRef]
- Duan, C.; Yao, F.; Guo, X.; Yu, H.; Wang, Y. The impact of carbon policies on supply chain network equilibrium: Carbon trading price, carbon tax and low-carbon product subsidy perspectives. Int. J. Logist. Res. Appl. 2024, 27, 1251–1275. [Google Scholar] [CrossRef]
- Wu, H.; Sun, Y.; Su, Y.; Chen, M.; Zhao, H.; Li, Q. Which is the best supply chain policy: Carbon tax, or a low-carbon subsidy? Sustainability 2022, 14, 6312. [Google Scholar] [CrossRef]
- Yu, L.; Xu, H.; Zhang, Z. Tripartite evolutionary game analysis of supply chain low-carbon transformation considering the coupling of carbon tax and subsidy regulations. MDE Manage Decis. Econ. 2024, 45, 702–725. [Google Scholar] [CrossRef]
- Wang, H.; Chen, L.; Liu, J. An evolutionary game theory analysis linking manufacturing, logistics, and the government in low-carbon development. J. Oper. Res. Soc. 2022, 73, 1014–1032. [Google Scholar] [CrossRef]
- Guo, W.; Liang, Y.; Lei, M. Dynamic strategy for low-carbon supply chain considering retailers competition and technological innovation. Heliyon 2024, 10, e27474. [Google Scholar] [CrossRef]
- Wang, Y.; Yu, Z.; Jin, M.; Mao, J. Decisions and coordination of retailer-led low-carbon supply chain under altruistic preference. Eur. J. Oper. Res. 2021, 293, 910–925. [Google Scholar] [CrossRef]
- Huo, H.; Liu, H.; Bao, X.; Cui, W. Game analysis of supply chain enterprises’ choice of carbon emission reduction behavior under environmental regulation and consumers’ low carbon preference. Discrete Dyn. Nat. Soc. 2022, 2022, 3013289. [Google Scholar] [CrossRef]
- Hu, Z.; Wang, S. An evolutionary game model between governments and manufacturers considering carbon taxes, subsidies, and consumers’ low-carbon preference. Dyn. Games Appl. 2022, 12, 513–551. [Google Scholar] [CrossRef]
- Li, S.; Qu, S.; Wahab, M.I.M.; Ji, Y. Low-carbon supply chain optimisation with carbon emission reduction level and warranty period: Nash bargaining fairness concern. Int. J. Prod. Res. 2024, 62, 6665–6687. [Google Scholar] [CrossRef]
- Zhong, Y.; Sun, H. Game theoretic analysis of prices and low-carbon strategy considering dual-fairness concerns and different competitive behaviours. Comput. Ind. Eng. 2022, 169, 108195. [Google Scholar] [CrossRef]
- Rustico, E.; Dimitrov, S. Environmental taxation: The impact of carbon tax policy commitment on technology choice and social welfare. Int. J. Prod. Econ. 2022, 243, 108328. [Google Scholar] [CrossRef]
- Goh, H.H.; Xu, Z.; Liang, X.; Zhang, D.; Dai, W.; Liu, H.; Kurniawan, T.A.; Wong, S.Y.; Goh, K.C. Solving carbon tax challenges with a holistic approach: Integrating evolutionary game theory and life cycle energy solutions. J. Clean. Prod. 2023, 423, 138817. [Google Scholar] [CrossRef]
- Wu, X.; Liu, P.; Yang, L.; Shi, Z.; Lao, Y. Impact of three carbon emission reduction policies on carbon verification behavior: An analysis based on evolutionary game theory. Energy 2024, 295, 130926. [Google Scholar] [CrossRef]
- Zhang, Y.; Chi, Y.; Li, G.; Zhang, X. The impact of carbon tax policy on residents’ welfare of china and its heterogeneity under the carbon neutrality goal: A cge model-based analysis. J. Clean. Prod. 2024, 434, 140442. [Google Scholar] [CrossRef]
- Köppl, A.; Schratzenstaller, M. Carbon taxation: A review of the empirical literature. J. Econ. Surv. 2023, 37, 1353–1388. [Google Scholar] [CrossRef]
- Yu, W.; Wang, Y.; Feng, W.; Bao, L.; Han, R. Low carbon strategy analysis with two competing supply chain considering carbon taxation. Comput. Ind. Eng. 2022, 169, 108203. [Google Scholar] [CrossRef]
- Xia, X.; Li, C.; Zhu, Q. Game analysis for the impact of carbon trading on low-carbon supply chain. J. Clean. Prod. 2020, 276, 123220. [Google Scholar] [CrossRef]
- Chen, W.; Hu, Z. Using evolutionary game theory to study governments and manufacturers’ behavioral strategies under various carbon taxes and subsidies. J. Clean. Prod. 2018, 201, 123–141. [Google Scholar] [CrossRef]
- Gibbons, R. A Primer in Game Theory; Pearson Education: London, UK, 1992. [Google Scholar]
- Aust, G.; Buscher, U. Vertical cooperative advertising and pricing decisions in a manufacturer-retailer supply chain: A game-theoretic approach. Eur. J. Oper. Res. 2012, 223, 473–482. [Google Scholar] [CrossRef]
- Spengler, J.J. Vertical integration and antitrust policy. J. Polit. Econ. 1950, 58, 347–352. [Google Scholar] [CrossRef]
- Sheng, J.; Zhou, W.; Zhu, B. The coordination of stakeholder interests in environmental regulation: Lessons from china’s environmental regulation policies from the perspective of the evolutionary game theory. J. Clean. Prod. 2020, 249, 119385. [Google Scholar] [CrossRef]
- Wang, S.; Zheng, Y. Evolutionary game analysis of data trade benefits: Behavioral choices of enterprises and governments. Syst. Eng. Theory Pract. 2025, 45, 944–956. [Google Scholar]


| Variable Types | Decision Variables | Non-Decision Variables | |
|---|---|---|---|
| Manufacturer | : Wholesale price per unit product | : Retail price per unit commodity | : Manufacturer’s carbon abatement cost |
| : Manufacturer’s profit | |||
| : Carbon abatement rate | : The amount of CO2 per unit product before carbon abatement | ||
| : The carbon tax rate levied by the government on per unit CO2 emissions | |||
| Retailer | : Marginal profit per unit commodity | : Retailer’s promotion cost | |
| : Retailer’s profit | |||
| : Promotion rate | : Consumer demand | ||
| : Supply chain profit | |||
| Game Types | ||||
|---|---|---|---|---|
| The centralized game where the manufacturer and the retailer jointly make decisions (C) | 0.22516 | 4.52752 | 0.500357 | 131.344 |
| The decentralized game where the manufacturer and the retailer each make decisions simultaneously (N) | 0.14658 | 5.73941 | 0.325733 | 115.346 |
Disclaimer/Publisher’s Note: The statements, opinions and data contained in all publications are solely those of the individual author(s) and contributor(s) and not of MDPI and/or the editor(s). MDPI and/or the editor(s) disclaim responsibility for any injury to people or property resulting from any ideas, methods, instructions or products referred to in the content. |
© 2025 by the authors. Licensee MDPI, Basel, Switzerland. This article is an open access article distributed under the terms and conditions of the Creative Commons Attribution (CC BY) license (https://creativecommons.org/licenses/by/4.0/).
Share and Cite
Yu, J.; Yang, S.; Feng, Z. Game Analysis Between Manufacturer and Retailer Under Carbon Tax Policy. Sustainability 2025, 17, 6183. https://doi.org/10.3390/su17136183
Yu J, Yang S, Feng Z. Game Analysis Between Manufacturer and Retailer Under Carbon Tax Policy. Sustainability. 2025; 17(13):6183. https://doi.org/10.3390/su17136183
Chicago/Turabian StyleYu, Jun, Shihui Yang, and Zongxian Feng. 2025. "Game Analysis Between Manufacturer and Retailer Under Carbon Tax Policy" Sustainability 17, no. 13: 6183. https://doi.org/10.3390/su17136183
APA StyleYu, J., Yang, S., & Feng, Z. (2025). Game Analysis Between Manufacturer and Retailer Under Carbon Tax Policy. Sustainability, 17(13), 6183. https://doi.org/10.3390/su17136183