Article

Economy-Wide Material Flow Accounting: Application in the Italian Glass Industry

1
EUAbout, 1000 Bruxelles, Belgium
2
Dipartimento di Scienze Teoriche e Applicate (DiSTA), Università Telematica eCampus, 22060 Novedrate, Italy
3
Centro di Ricerca per l’Innovazione e l’Imprenditorialità (C.I.I.), Università Politecnica Delle Marche, 60131 Ancona, Italy
4
Dipartimento di Ingegneria Industriale, Università di Bologna, 40126 Bologna, Italy
5
Laboratory of Chemical Engineering and Engineering Sustainability, Faculty of Pure and Applied Sciences, Open University of Cyprus, Giannou Kranidioti 89, Latsia 2231, Cyprus
*
Author to whom correspondence should be addressed.
Sustainability 2025, 17(13), 6180; https://doi.org/10.3390/su17136180
Submission received: 15 May 2025 / Revised: 20 June 2025 / Accepted: 3 July 2025 / Published: 5 July 2025
(This article belongs to the Collection Waste Management towards a Circular Economy Transition)

Abstract

Italy supplies about one-seventh of the European Union’s total glass production, and the sector’s sizeable resource demands make it a linchpin of national industrial strategy. With growing environmental regulations and the push for resource efficiency, Material Flow Accounting has become essential for companies to stay compliant and advance sustainability. The investigation concentrates on Italy’s glass industry to clarify its material requirements, ecological footprint, and overall sustainability performance. STAN software v2, combined with an Economy-Wide Material Flow Accounting (EW-MFA) framework, models the national economy as a single integrated input–output system. By tracking each material stream from initial extraction to end-of-life, the analysis delivers a cradle-to-grave picture of the sector’s environmental impacts. During the 2021 production year, Italy’s glass makers drew on a total of 10.5 million tonnes (Mt) of material inputs, supplied 76% (7.9 Mt) from domestic quarries, and 24% (2.6 Mt) via imports. Outbound trade in finished glass removed 1.0 Mt, leaving 9.5 Mt recorded as Domestic Material Consumption (DMC). Within that balance, 6.6 Mt (63%) was locked into long-lived stock, whereas 2.9 Mt (28%) left the system as waste streams and airborne releases, including roughly 2.1 Mt of CO2. At present, the post-consumer cult substitutes only one-third of the furnace batch, signalling considerable scope for improved circularity. When benchmarked against EU-27 aggregates for 2021, Italy registers a NAS/DMI ratio of 0.63 (EU median 0.55) and a DPO/DMI ratio of 0.28 (EU 0.31), indicating a higher share of material retained in stock and slightly lower waste generated per ton of input. A detailed analysis of glass production identifies critical stages, environmental challenges, and areas for improvement. Quantitative data on material use, waste generation, and recycling rates reveal the industry’s environmental footprint. The findings emphasise Economy-Wide Material Flow Accounting’s value in evaluating and improving sustainability efforts, offering insights for policymakers and industry leaders to drive resource efficiency and sustainable resource management. Results help scholars and policymakers in the analysis of the Italian glass industry context, supporting in the data gathering, while also in the use of this methodology for other sectors.

1. Introduction

Economy-Wide Material Flow Accounting (EW-MFA) is a comprehensive framework used to quantify the material inputs and outputs within an economy. It provides critical insights into the material basis of economic activities, enabling the assessment of resource efficiency, sustainability, and environmental impacts. In the context of the Italian glass industry, the application of EW-MFA is particularly pertinent, because the method is harmonised through EU-wide standards, and its application by different researchers yields results that are comparable across Europe and readily usable by EU policymakers. The glass industry in Italy is characterised by substantial material throughput due to the high demand for both container and flat glass products. In 2022, Italy’s glass production estimated to reached approximately 4.7 million tonnes according to [1], representing a critical component of the national economy, as it also accounts for 11.7% of EU production [2]. This industry’s nature underscores the necessity for detailed EW-MFA to optimise resource use, reduce waste, and mitigate environmental impacts.
Accounting for roughly 15% of total EU glass output, the Italian value-chain stands among the continent’s largest. In 2021, its furnaces produced 5.9 million tonnes of molten glass, divided into 4.7 Mt of container stock and 1.2 Mt of flat glass. The network comprises 32 core manufacturers running 60 melting furnaces, supported by more than 300 downstream processing sites, and together they generate about €6 billion in annual turnover [3].
The transition from traditional waste management to sustainable practices within the European Union has spurred significant research on resource extraction and waste use. This evolution aligns with the shared commitment among member states toward environmentally responsible waste management practices, as shown by ongoing improvements and convergence [4]. However, a critical challenge appears in reintegrating recovered materials into production processes to efficiently close resource cycles. This paper focuses on EW-MFA methodology, starting from the notable contributions from OECD and EUROSTAT, as for other scientific literature contributions analysed in [5].
The OECD has played a pivotal role with publications such as “Measuring Material Flows and Resource Productivity Volume I: The OECD Guide”, offering a comprehensive overview of material flow approaches and measurement tools at the national level. Subsequent volumes include “Volume II: The Accounting Framework”, providing a theoretical and technical elucidation of Material Flow Accounting concepts and methodologies, and “Volume III: Inventory of Countries’ Activities”, which assesses ongoing or planned activities concerning the measurement and analysis of natural and material resource flows in OECD countries and select non-member economies [5].
Conversely, in 2018, EUROSTAT published a document titled “Secondary materials in European material flow accounts in raw material equivalents” [6], along with the Economy-wide Material Flow Accounts manual, which introduced the EU Raw Material Equivalent (RME) model was defined [7]. The latter forms statistics of the total amount of materials that flow into national economies, changes in the stocks of materials within the economic system, and the total amount of materials that were taken out from the economy and released into the environment.
A standard glass-making line starts with batch mixing, proceeds to melting at about 1550 °C, and then moves through forming and annealing. Taken together, those steps demand roughly 4–6 GJ t−1 of finished glass [8], 80–90% supplied by methane [9], making decarbonisation a priority. Combustion and limestone decomposition emit ~0.73 t CO2 t−1 glass, while limited cullet availability keeps the national batch-recycled share at only 30%, far below the 90% technical ceiling demonstrated at best-practice EU plants.
This paper applies the guidelines for EW-MFA established by the OECD and Eurostat, utilising STAN software v2. STAN is a pivotal tool for building a simulation model that mirrors the complex workings of Italy’s economy and, within that framework, charts the main actors and material streams of the glass value chain. Its user-friendly interface, paired with powerful analytical functions, makes it possible to examine how industrial activities interact and translate into environmental pressures. Although STAN has been used in other contexts, no previous research has produced a reconciled model of Italy’s glass supply chain. The present study applies EW-MFA to this sector, providing complete material flow balances, spotlighting data gaps, and offering actionable guidance for policymakers [10,11].
This life-cycle oriented approach is particularly beneficial for aiding decision-makers in developing sustainable strategies and policies, supporting the transition towards a circular economy, through a sustainable material and waste management, in accordance with the SDG12 ([4,12,13]).

Literature Review

In modern industry, the term “glass” generally refers to silica-based compositions dominated by SiO2. These materials are valued for their blend of high optical transparency, mechanical strength, chemical durability, and excellent formability. Such performance stems from a three-step production route as follows: the batch is first melted at very high temperature, then shaped while still viscous, and finally cooled slowly (annealed) so internal stresses dissipate, and the amorphous network is fixed. By adjusting the mix of minor additives, manufacturers can introduce colour or tailor chemical-physical traits for specific end uses. As shown in Figure 1 (left panel), activities in the Italian glass sector can be grouped into two overarching streams [14]. The Italian glass chain divides into primary manufacture and secondary processing. Primary production embraces four product groups: flat sheets, hollow containers, insulating wools and yarns, and a residual “other” category that covers artistic or specialty items. By the end of 2023, thirty-seven firms were operating melting furnaces in at least one of the first three NACE classifications—23.11 for flat glass, 23.13 for hollow ware, and 23.14 for insulation wools and yarns. Companies engaged in secondary processing cutting, tempering, coating, laminating, or otherwise finishing semi-manufactured glass are more geographically dispersed, with eleven plants in northern Italy, three in the centre, and five in the south [15].
Previous investigations of the Italian glass supply chain fall into three broad types. Plant-level life-cycle assessments and energy audits [16] measure furnace efficiency but stop at the factory boundary, overlooking quarry overburden, international trade, and the build-up of long-lived stock. Hybrid input–output models provide economy-wide coverage yet work at two-digit NACE resolution, making it impossible to distinguish flat, container and fibre production routes. Corporate sustainability reports [14] supply headline tonnages but lack internal mass balances and give no indication of statistical uncertainty. EW-MFA overcomes these limitations by enforcing full mass closure and producing the harmonised indicators DMI, DPO, and NAS that Eurostat uses for cross-country comparisons. The study adopts STAN because its algebraic error-reconciliation reduces data inconsistencies and it automatically generates Sankey diagrams, whereas alternative MFA tools such as Matflow omit one or more of these functions. EW-MFA can provide the system scope and numerical robustness that earlier approaches could not deliver. Downstream, authorised processors turn glass-packaging waste into secondary raw material. Using advanced sorting equipment, they remove contaminants and produce cullet that meets end-of-waste criteria, ready for remelting into new bottles and jars; the treated cullet is then returned to the furnaces of glassworks, completing the loop for container glass.
Glassworks companies in Italy, in collaboration with the CoReVe consortium, recycle glass packaging waste into new containers, embodying a circular model. To extend the analysis, the focus shifts to the physical goods released to the market, broken out into four product classes flat sheets, hollow ware, insulating wools, and glass yarns. Figure 1 portrays the sector in two panels; the bar chart on the right sets four material-flow metrics side by side: Production, Import, Export, and Apparent Consumption. These categories run along the x-axis, while their corresponding masses appear on the y-axis in tonnes (t). Two colour shades separate the years: light blue for 2021 and dark blue for 2022, allowing a quick year-on-year comparison of each stream.
A more detailed look at its chemical make-up indicates that the glass produced in greatest volume is soda lime silica glass (Schmitz A. et al. [17], is predominantly made up of 70% silicon dioxide (SiO2) from sand, 15% sodium oxide (Na2O) from soda ash, and 12% calcium oxide (CaO) from limestone, along with 3% other compounds). Sodium oxide lowers the melting point of silica, while calcium oxide stabilises the mixture, enhancing glass durability. Glass is 100% recyclable and can be endlessly reproduced without losing properties. In Europe, recycling applies to specific types: GL70, GL71, and GL72. Recycled glass (cullet) increasingly replaces raw materials, with up to 90% used in new green bottles, maintaining shape, colour, and quality under strict standards. The closed-loop lifecycle of glass production ensures continuous reuse of cullet, reducing the need for raw materials. Figure 2 outlines the main steps of this process.
Glass making starts with batch preparation, during which silica sand, soda ash, limestone and a defined share of cullet are blended to a uniform mix. A global study by Butler and Hooper estimates the average recycling rate for container glass at around 30–35%; their mass balance treats every discarded container as returning to the furnace for fresh container production and notes that post-consumer cullet is seldom used to replace raw materials in flat-glass manufacture [19]. The blended batch is subsequently charged to the melting furnace and heated to around 1500 °C, ensuring full fusion before fining begins. In both flat- and container-glass lines, the process delivers a melt yield of approximately 85%.
During fabrication, the viscous melt is shaped by drawing, pressing or blow-and-blow methods into flat sheets or hollow articles and then slowly cooled to relieve thermal stresses and to secure the desired mechanical properties. In 2014, global production amounted to 71 Mt of flat glass and 79 Mt of container glass, while forming efficiencies averaged 85% for flat products and 90% for hollowware. The finished goods are subsequently distributed to their end-use markets, completing the material loop and preparing the stock for a future round of recycling. In the “End of Life” stage, glass is assessed for recycling, landfill, or incineration, focusing on sustainability and resource efficiency. The process begins with collecting and sorting glass, followed by thorough cleaning to remove impurities like labels and caps. Cleaned glass is then crushed into cullet, the primary raw material for new glass production. This reduces the need for virgin materials and decreases energy consumption and emissions. Cullet undergoes rigorous checks to remove metals and other contaminants, including ceramics, and is sorted by colour.

2. Materials and Methods

EW-MFA analysis categorises flows by their origin and destination (Domestic or Rest of the World), whether they are directly observed or calculated (Direct or Indirect), and whether input flows enter the economy (Used or Unused). Output flows are classified as Processed or Non-Processed.
Figure 3 portrays the economy as a physical hub positioned between incoming resource streams and outgoing releases. On the supply side, materials extracted within national borders, such as fossil fuels, mineral ores, and biomass, enter as domestic extraction, while quantities moved but not incorporated into production (overburden, haul-backs, logging residues, and the like) are recorded separately as unused domestic extraction. Cross-border flows appear as imports, supplemented by the upstream or embodied material required to manufacture those imported goods.
Inside the economy, these inputs either accumulate as net additions to stock, such as buildings and infrastructure, or pass straight through as material throughput. Recycling loops shown at the bottom of the diagram illustrate how secondary materials cycle back into production, offsetting a portion of primary input.
The outflow section of the scheme separates material fates into distinct categories. Goods that cross national borders are registered as exports, accompanied by their upstream or embodied resource footprints. Releases grouped as “to nature” include emissions to air and water, waste routed to landfill, and dissipative losses such as fertiliser run-off or tyre abrasion. To mirror the treatment of inputs, the framework also logs unused domestic extraction discarded during mining or harvesting and never entering the economy. Collectively, these categories complete the mass balance in economy-wide MFA, guaranteeing that every tonne extracted, transformed, traded, stockpiled, or released is recorded consistently.

2.1. Key Indicators

Material Flow (MF) indicators assess the physical resource base of an economy, revealing environmental impacts and policy effects on material use. Together, the indicators capture the full material cycle resource inputs, use, changes in stocks, and outgoing flows, furnishing a comprehensive physical portrait of the economy. Relating them to macro-economic variables, for instance by expressing gross domestic product per unit of Direct Material Input (GDP/DMI), offers a practical yardstick for material productivity. Owing to this diagnostic power, material flow metrics now feature routinely in sustainability scorecards published by national governments and international bodies. The sections that follow outline each principal indicator group and single out the measures most commonly applied. Input indicators, influenced by foreign trade, natural resources, and technology, measure resources used in economic activities. Key indicators include Domestic Extraction Used (DEU), Direct Material Input (DMI), Total Material Input, and Total Material Requirement. Consumption indicators, such as Domestic Material Consumption (DMC) and Total Material Consumption, reflect materials consumed by economic activities. Balance-related metrics, most notably Net Additions to Stock (NAS) and the Physical Trade Balance (PTB), signal whether the domestic material stock is expanding or contracting. Output-oriented measures, including Domestic Processed Output (DPO), Total Domestic Output (TDO), and Exports (EXP), capture the volumes of material that exit the economy via production activities and cross-border trade.
For the Italian glass industry case study we organised the material flow metrics into five functional groups Inputs, Outputs, Consumption, Balance, and Productivity:
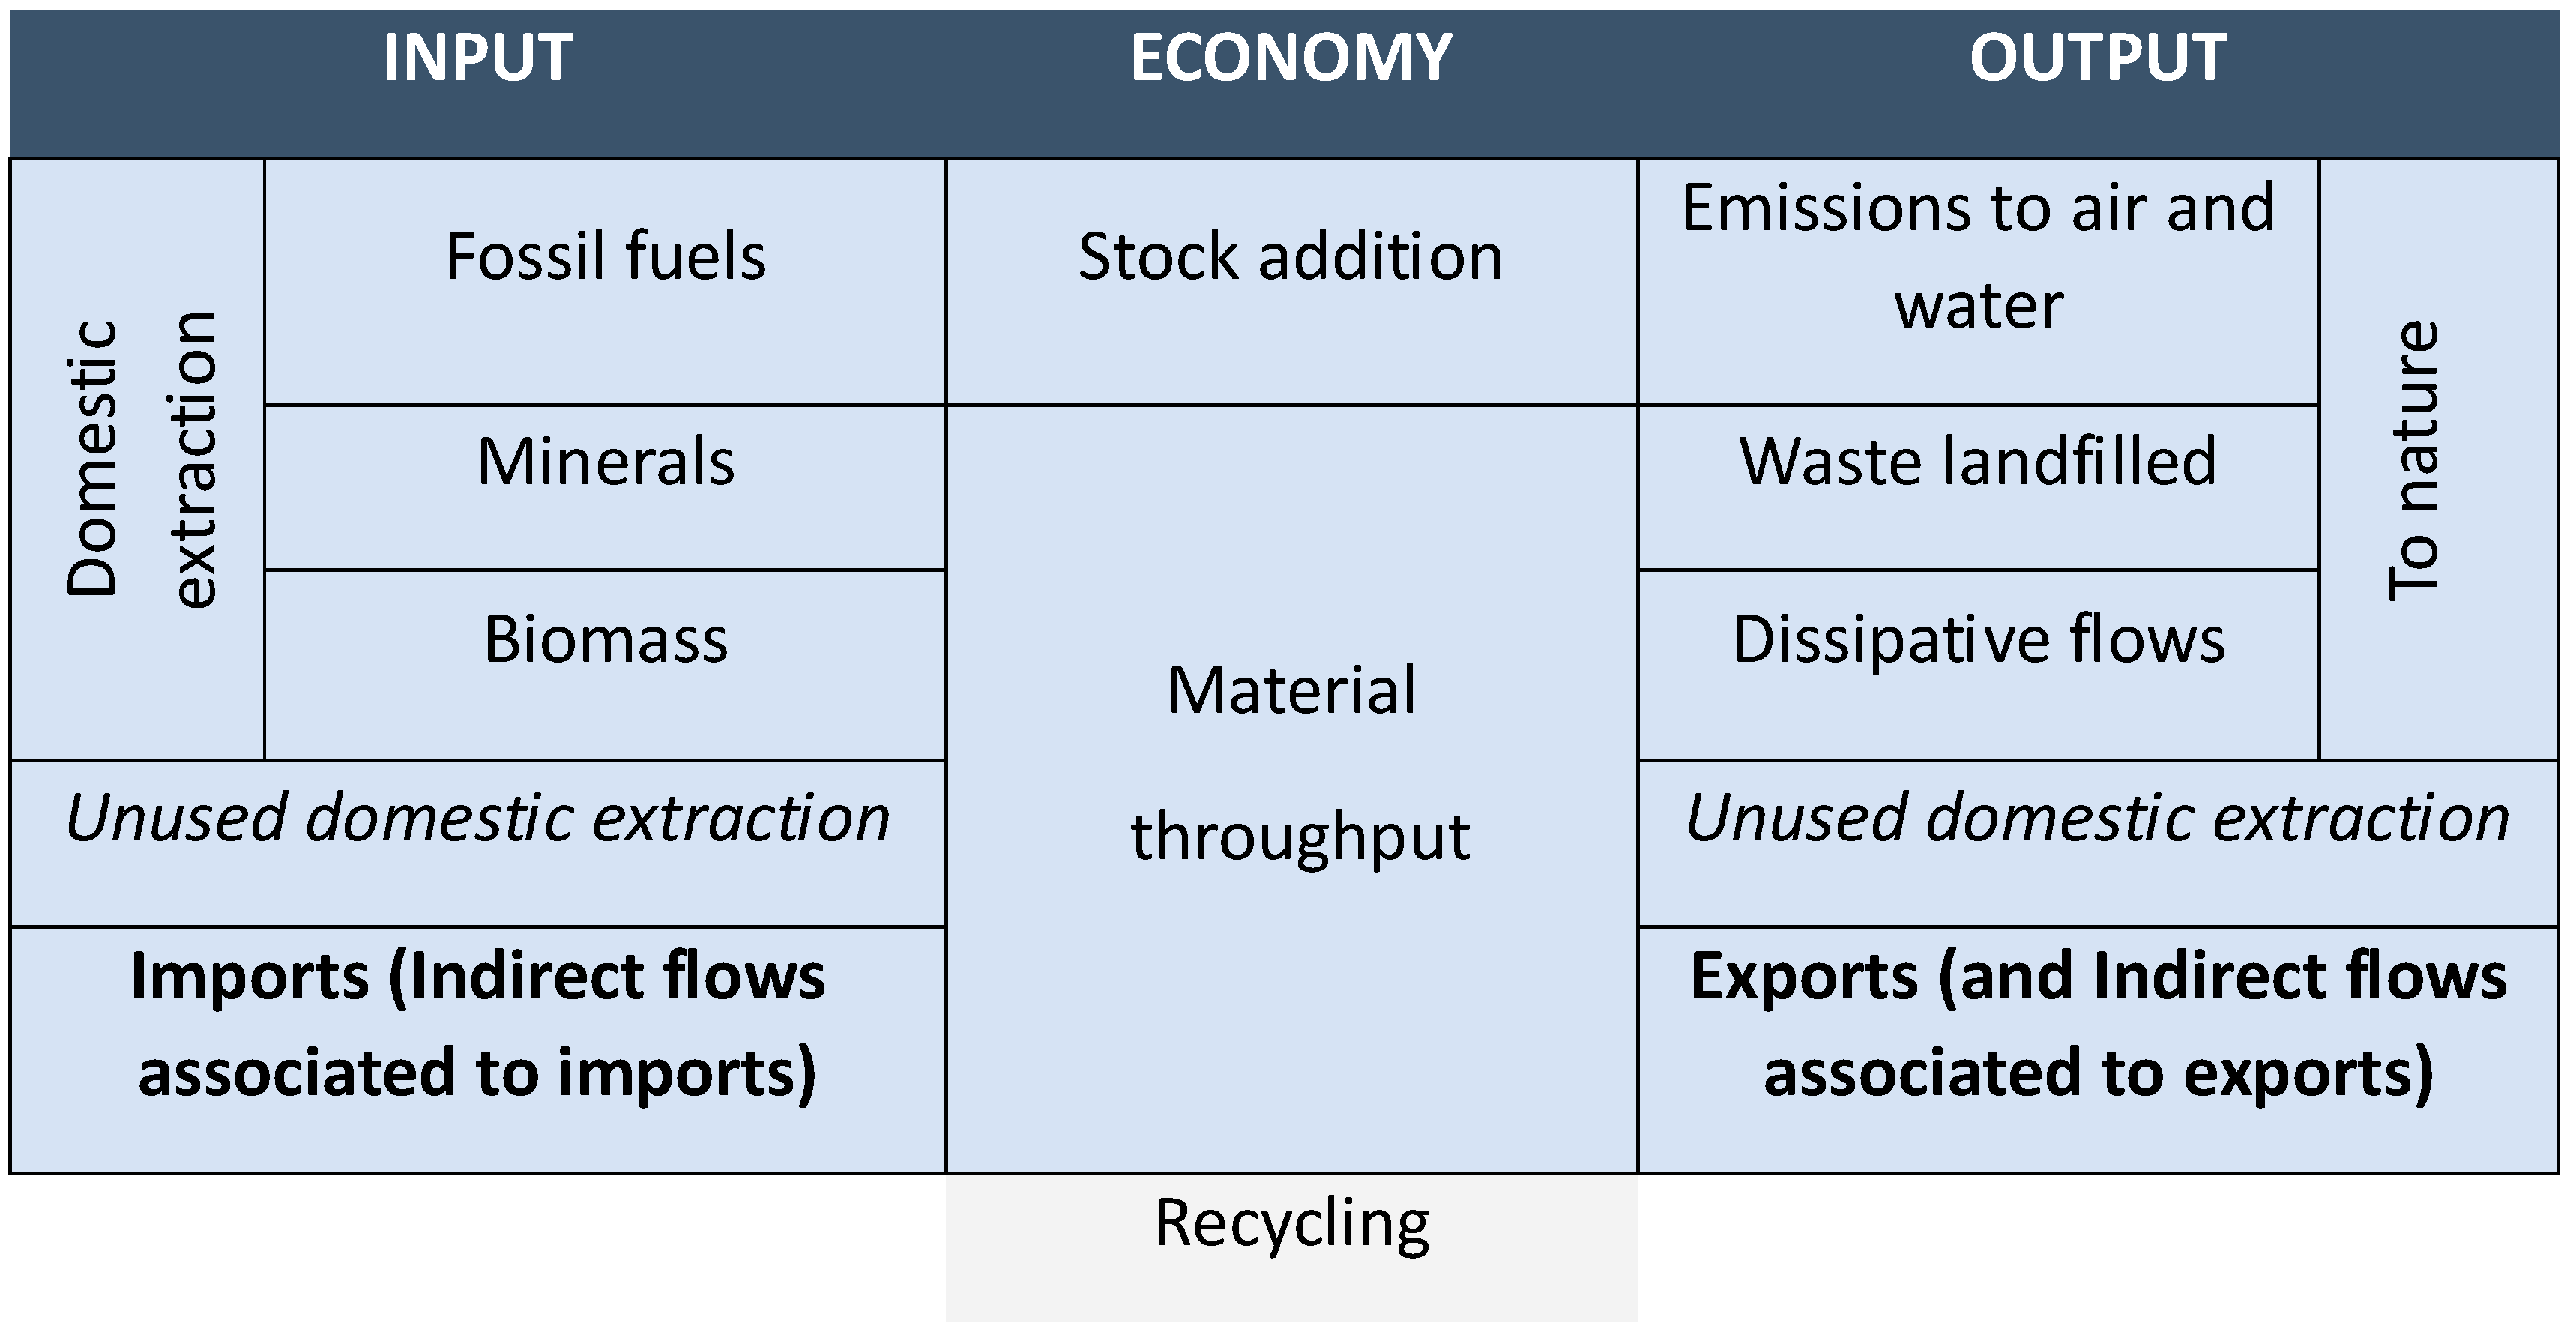
  • Inputs. Domestic Extraction Used (DEU) plus imports yields Direct Material Input (DMI).
  • Outputs. Domestic Processed Output (DPO) combined with exports gives Domestic Material Output (DMO).
  • Consumption. Domestic Material Consumption (DMC) is defined as DMI minus exports.
  • Balance. Net Additions to Stock (NAS) are calculated as DMI minus DPO minus exports, while the Physical Trade Balance (PTB) equals imports minus exports.
  • Productivity. Material productivity is expressed as GDP divided by DMI (GDP/DMI).
These indicators collectively provide insights into the material flow, resource utilisation, and sustainability of the Italian glass industry.

2.2. Software STAN

STAN—Substance Flow Analysis [21], is a specialised MFA programme created by the Waste and Resource Management Unit at TU Wien. The software tackles two persistent challenges in material flow work: fragmented toolchains and datasets that are incomplete or internally inconsistent. Through an intuitive drag-and-drop workspace, practitioners draw process boxes, system boundaries, and tonne-based flows, with annotations added as required. The diagram is then converted into four equation sets—mass balances, transfer coefficients, stock-change equations and concentration relationships—while every variable can be flagged as measured, unknown, or fixed [22]. Because uncertainty is embedded in the computation, STAN reconciles conflicting figures and identifies where fresh data would most improve reliability. In the present investigation, the package was pivotal for mapping the Italian glass sector, closing data gaps and deriving the flow indicators presented earlier.
Balance equation:
i n p u t s = o u t p u t s + c h a n g e   i n   s t o c k s
Transfer coefficient equation:
o u t p u t x = t r a n s f e r   c o e f f i c i e n t t o   o u t p u t   x   ·   i n p u t s
Stock equation:
Stock P e r i o d   i + 1 = S t o c k P e r i o d   i + C h a n g e   i n   s t o c k P e r i o d   i
Concentration equation:
M a s s S u b s t a n c e = m a s s g o o d   ·   c o n c e n t r a t i o n s u b s t a n c e
STAN’s primary features allow users to input various data types such as mass flows, stock information, concentrations, and transfer coefficients, distributed across goods, substances, energy, and time periods. The software constructs an interconnected database to assess substance movement through processes, industries, and environmental compartments, and users can export data via Excel for further analysis. STAN manages unknown data and contradictions by estimating or correcting values based on mass conservation, detecting gross errors, and estimating data uncertainty. While it relies on substantial and high-quality data, making accurate results dependent on data availability, STAN enables the identification of environmental hotspots and intervention points, making it a powerful tool for Substance Flow Analysis. However, careful data collection and system modelling are essential. STAN was chosen for its strong reconciliation algorithms and built-in uncertainty treatment, which maintain mass balance integrity and deliver reproducible outcomes even when material flow data are patchy or uncertain.

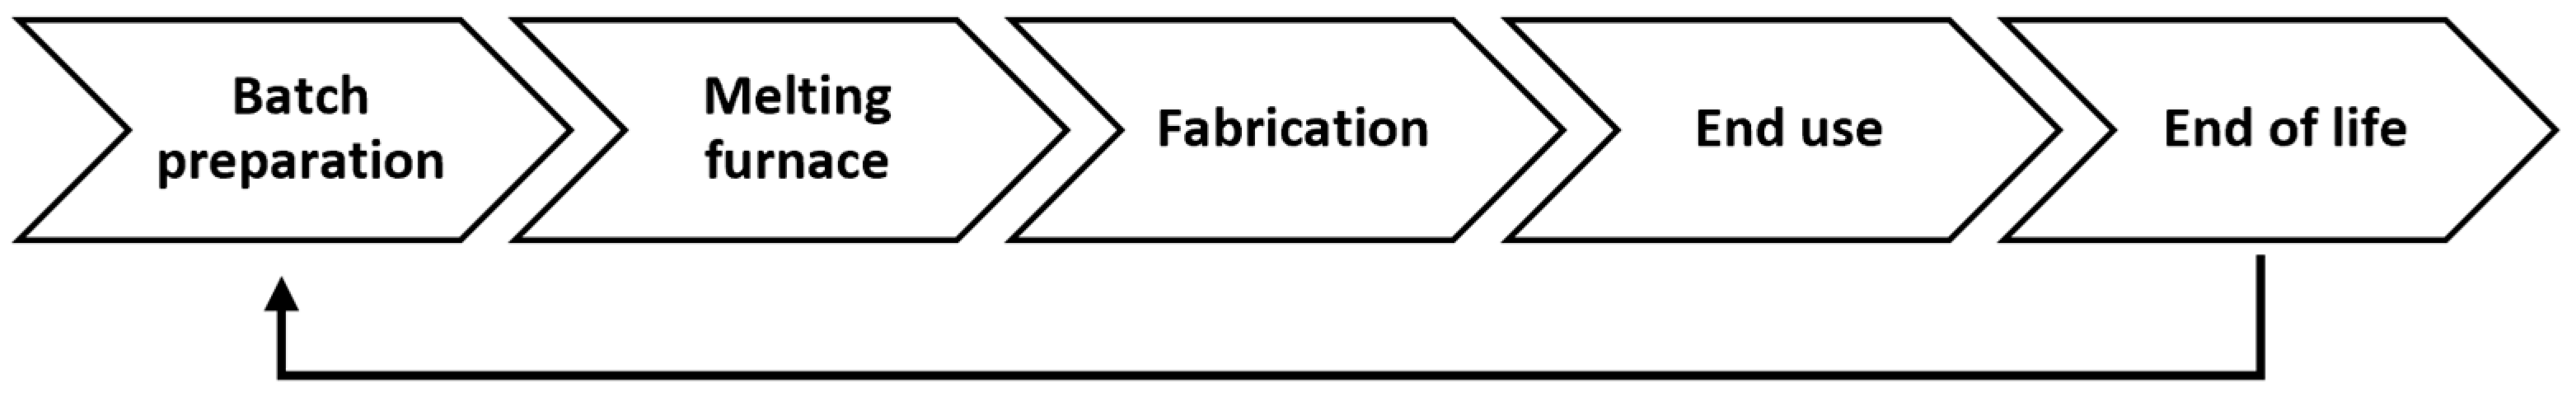
2.3. Stepwise Approach

Implementing EW-MFA requires a methodical approach: understanding the EW-MFA method, selecting the sector and material, researching material composition, defining system boundaries, and identifying key actors. Tools like STAN model material flows, ensuring data accuracy. The methodology is applied with attention to uncertainties and errors, presenting outcomes in technical tables and questionnaires for detailed reference [7].
The analysis begins with the primary category MF.3, represented by Table A in the official questionnaire’s tables [7], focusing on non-metallic minerals, specifically “Sand and gravel (3.08)” and “Limestone and gypsum (3.06),” essential for glass production. These minerals provide all necessary materials for the industry. Typical soda-lime glass contains 70% SiO2, 12% CaO, and 15% Na2O by mass. The silica fraction comes from high-purity sand, while the calcium oxide is derived from calcined limestone; sodium oxide is usually supplied as soda ash rather than directly from limestone, each raw material undergoing its own crushing, beneficiation, and pre-treatment steps. To quantify the annual tonnage of sand and limestone that must be quarried or imported, one back-calculates from finished-glass output: multiply the glass mass by the relevant oxide fraction, divide by the purity of the raw feed, and adjust for furnace yield and any cullet substitution. The result expressed in tonnes provide the upstream extraction and import volumes required to sustain production. As shown in Table 1, under the “MF.3 for glass production” heading, a sequence of steps and considerations about its constituents are required. The primary component, silicon dioxide, is found in “Silica sand,” which contains 90% silicon dioxide. Figures and rates for the internal extraction and imports of sand necessary to meet 2021 production levels must be considered. To supply the lime component (CaO) required for glass, limestone containing roughly 80–95% calcium carbonate (CaCO3) is first quarried. The stone is crushed and fed to calcination kilns, where high temperatures drive the decomposition reaction CaCO3 → CaO + CO2. This step releases carbon dioxide as a by-product and leaves behind quicklime (CaO), which is then ready for batching with the other glass-forming oxides, as detailed in the study by Stanmore B.R., Gilot P. [23]. To determine the yield of the calcination process, considerations of molecular weights lead to a calculated yield of 56.03%. Because both the mining yield of limestone and the calcination yield to CaO are known, and imported limestone is negligible, due to low quantity equal to 29,140 tonnes according to Eurostat [24], it is possible to back-calculate the quantity of domestic limestone that must be quarried (and, if any, imported) to supply the CaO needed for 2021 production.
Italy secures virtually all of its sodium oxide (Na2O) through the Solvay process. The pathway starts with limestone quarried on site, which is reacted with salt brine and water to generate soda ash (Na2CO3) at an approximate yield of 75% [25,26]. For decades, a single facility has covered roughly 90% of Italy’s soda ash demand. Soda ash is subsequently calcined, a step that releases CO2 and produces Na2O, which is fed directly into the glass mix. A stoichiometric comparison of the molecular weights of Na2CO3 and Na2O yields a conversion efficiency of 58.49% for this final step [27].
Attention now shifts to category MF.4—Fossil Energy Materials and Carriers in the Eurostat EW-MFA questionnaire tables [7]. Under the Eurostat EW-MFA framework, fossil energy materials and carriers are coded as category MF.4. This study examines three sub-classes within that group: 4.1 (coal and other solid fuels), 4.2 (liquid energy carriers), and 4.2.2 (natural gas). Sector-wide data for 2020 indicate that the Italian glass industry consumed 632,804 Tonnes of Oil Equivalent (TOE) of natural gas, 306,207 TOE of electricity and 35,599 TOE from other energy sources [14]. Converting the natural gas total from Tonnes of Oil Equivalent to cubic metres and then to mass, with Eurostat’s reference density of 0.8 kg m−3, gives ≈607 t. Only ≈27.3 t comes from domestic sources, while ≈579.6 t is imported, underscoring the sector’s strong dependence on external gas supplies. These tonnages cover on-site combustion only; further natural gas is indirectly embodied in the electricity drawn from the grid by glassworks.
Starting with the reported electricity consumption of 306,207 TOE from Assovetro, it is necessary to exclude renewable energy sources such as hydro, wind, solar, and geothermal, as these are immaterial in Material Flow Accounting analysis. For 2021, Italy’s energy mix included 57.5% thermal electricity. Using Terna’s data, specific sources are identified: 5.3% from solid fuels, 86.9% from natural gas, 2.1% from oil products, and 16.7% from other fuels, are presented under the heading “MF.4 Electricity calculation and conversion” in Table 1.
Next, electricity sources are converted from Tonnes of Oil Equivalent (TOE) into tonnes. This involves converting TOE to kilowatt-hours (kWh) using 5347 kWh per TOE, then to megajoules (MJ) by multiplying by 3.6, and finally, to tonnes using specific conversion factors for each energy source, based on Terna [28] and Eurostat [29]. These calculations and values are displayed under the voice “MF.4 Electricity calculation and conversion” in Table 1.
Table 1’s “MF.4 Fossil Energy Result” row aggregates the fossil fuel carrier figures, separating quantities drawn from domestic sources from those supplied through imports. To determine total Domestic Extraction (DE) and Imports (IM) for “MF.3 Non-Metallic Minerals” and “MF.4 Fossil Energy Materials/Carriers,” data from “MF.3 for glass production” and “MF.4 Fossil Energy Result”, plus 2021 glass imports of 1,760,000 tonnes, are aggregated. This yields the final DE and IM values essential for the model, shown in the sum-up table “Overall DE-IM Values”.
Regarding the Exports flow, considered in the official questionnaire’s tables [7], data related to the year under investigation originates directly from Assovetro [30].
A central facet of the analysis addresses the Domestic Processed Output flows generated by activities that lie within the study’s system boundary, using the categories defined in Eurostat’s reference tables [7]. The main categories under review include “MF 7.1, Emissions to Air,” “MF 7.2, Waste Disposal,” and “MF 7.3, Emissions to Water.” Regarding “MF 7.2, Waste Disposal,” according to the official Eurostat guidelines, this category specifically refers to the quantities of solid waste disposed of in uncontrolled landfills. Given that uncontrolled landfills are prohibited in Europe, it can be assumed that this figure is negligible or zero. Therefore, attention is focused on the remaining two categories.
For the MF 7.1 “Emissions to Air” category, the most complete emissions inventory on record was the 2020 dataset, which due to a lack of newer figures is adopted as a proxy for the study year. It highlights three principal pollutants from glass production: carbon dioxide (code 1.01), nitrogen oxides (1.04), and sulphur dioxide (1.14). These data have been published by Assovetro [14]. Table 1 brings these figures together under “Table F—Domestic Process Outputs.” It also records secondary releases linked to glass waste treatment and managed landfills: about 118.789 t of CO2 (code 1.01) and roughly 76.449 t of CH4 (1.02). Each number was calculated through a dedicated estimation procedure explained in the following subsection. A more detailed breakdown of CO2 emissions from Italy’s wider waste management sector can be found in [31]. Because no updated data were available, the study used the nation-wide 2020 waste management total—approximately 20.5 Mt of CO2—as a proxy for 2021. The glass sector’s share of this amount was estimated from its proportion of Italy’s overall CO2 inventory, reported by Assovetro as 2.07 Mt out of 352.425 Mt.
Using the same proportional allocation, Italy’s aggregate CH4 emissions of 13 million [32], scale to ≈76.000 t attributable to glass-waste management.
The final Domestic Processed Output considered is category MF 7.3, “emissions to water.” Because no monitoring figures exist for the glass sector itself, an indirect estimate was adopted as follows: the national total of hazardous substances discharged to water reported by the European Environment Agency—was multiplied by the same glass-industry share used for CO2 and CH4. Although approximate, this approach offers a reasonable first-order estimate of the sector’s aqueous releases.
Methane emissions, the glass sector’s contribution to these water emissions is noteworthy.
The overall amount for the domestic processed output encompasses contributions from “MF 7.1, Emissions to Air”, “MF 7.2, Waste Disposal”, and “MF 7.3. Emissions to Water”, is calculated in Table 1 under the heading “Overall DPO values”.
While examining Table G, the closing segment of the Eurostat questionnaire [7] and the balancing entries for the input side were calculated in the first place.
The Eurostat handbook prescribes a three-step routine for calculating balancing items, with the totals derived for the input side copied unchanged to the output side so the mass ledger closes. First, the amount of atmospheric oxygen consumed in combustion was estimated from measured furnace emissions of CO2, CO, SO2, N2O, and NO2, applying stoichiometric factors of 0.727 t O2 per tonne of CO2, 0.364 t O2 per tonne of N2O, and 0.5 t O2 per tonne of SO2; the resulting oxygen demands are reported in Table G. Second, the gross oxygen requirement associated with each fuel was obtained by multiplying its tonnage by a characteristic coefficient 0.215 t O2 t−1 for coal, 1.41 t O2 t−1 for fuel oil, and 1.83 t O2 t−1 for natural gas; these values are listed in the same table. Third, because fuels already contain a small share of oxygen that also participates in combustion, an in-situ fraction of 3.32% of coal mass and 0.19% of natural gas mass was deducted from the gross demand (no deduction could be made for oil owing to missing data). Summing the first two steps and then subtracting the third produced the balancing item in input (BII), which was carried across verbatim to the output column to keep the model internally consistent.
Following all these calculations, the resulting input, output, and consequent net additions to stock (NAS) flows are computed (see Table 2) and later uploaded into the STAN software. This led to the development of an expanded version incorporating primary processes and flows.

3. Results

Regarding the Domestic Extraction (DE) and Imports (IM) flows, the relevant figures are shown below. The first category, “MF.3 Non-Metallic Minerals”, represented under the “MF.3 for glass production” in Table 1, details the tonnage of non-metallic mineral inputs required by Italy’s glass industry in 2021.
The data for the partial steps previously explained for “MF.4 Fossil Energy Materials/Carriers” are presented under the heading “MF.4 Electricity calculation and conversion” in Table 1. Table 1 first examines the Domestic Energy (DE) and Imported Energy (IM) for each source of electricity in Italy in 2021. This is followed by converting the data from the original unit of measurement, expressed in Tones of Oil Equivalent (TOE), to tonnes to standardise all units used in the calculations.
The final value for the category “MF.4 Fossil Energy Materials/Carriers” is presented in the table entitled “MF.4 Fossil Energy Result” in Table 1. This shows the tonnes of fossil energy materials/carriers required for glass production in Italy in 2021. As a preliminary result, the table entitled “Overall DE-IM Values” is located just below the previous table. It shows the total values for domestic extraction and imports of the desired initial flows in Italy during 2021.
Continuing the examination, regarding the mere export flows, the data originates from Assovetro and, in the period 2021, the figures concerning the total volume of glass exported from Italy is documented at 1,000,000 tonnes.
To assess the value of the Domestic Processed Output, in Table 1, under the heading of “Table F—Domestic Processes Outputs”, the partial data and each relative source for the first two categories are presented as follows: “MF 7.1 Emissions to Air” and “MF 7.2 Waste Disposal.”
To find the final DPO value, the contribution from the “MF 7.3, Emissions to Water” is needed, starting from a national total of 108,376,915.2 tonnes [33] of harmful substances discharged for the year 2021, the share attributable to the glass industry estimated to be approximately 637,330.8 tonnes, assuming the impact of the sector at national level as 0.6% of the total emissions, relying on Ispra [31] and Assovetro [14] data. Summarising the analysis that encompasses contributions from “MF 7.1, Emissions to Air”, “MF 7.2, Waste Disposal”, and “MF 7.3, Emissions to Water”, the overall total for the Domestic Processed Output comprehensively presented in the following table “Overall DPO values”, as shown in Table 1.
Regarding the last flow to decide, the culmination of the detailed calculation process, including three subsequent steps with intermediate values, is shown in “Balancing Items” at the bottom of Table 1.
Finally, the final values of the most significant flows for the model, which also serve as the foundation for crafting the virtual model using the STAN software (Figure 4) and computing the indicators (listed at the bottom of Table 2), are presented at the top of Table 2 shown below.
To gauge Italy’s material performance against the wider European landscape, the study compared its flow indicators with the 2021 Economy-Wide Material Flow Accounts (EW-MFA) dataset released by Eurostat [34]. Italy’s NAS-to-DMI ratio stands at 0.41, eleven percentage points below the EU-27 median of 0.52. In other words, a smaller fraction of the material entering the Italian economy ends up locked into long-lived stock than is typical across the Union. By contrast, Italy’s DPO-to-DMI ratio is 0.63, nine points above the EU median of 0.54, evidence that, for every tonne of input, the country releases more waste and emissions than the European average. Together, the two metrics show that Italy both accumulates material less intensively and discards it more heavily, underscoring the need for policies that boost production-side efficiency and curb waste generation rather than focusing only on managing future stock outflows.
To fully understand the detailed Sankey diagram in Figure 4 and the summary version in Figure 5, certain important considerations need to be made. To distinguish different flows, three main colours are used: green for inputs from the natural environment into the Italian national system, blue for outputs directly into the environment, red for emissions generated within the system, and black for the various phases of the glass lifecycle. Furthermore, two key processes need to be explained, as seen below:
Industrial Yield: This process stock encapsulates the productive output, focusing on the quantity of glass products meeting distribution quality standards, energy transformation, and yields from raw material extraction (sand, limestone). These materials, including silicon dioxide (SiO2), sodium oxide (Na2O), and calcium oxide (CaO), enter directly from Domestic Extraction flows to form the final glass constituents.
Accumulation: The accumulation stock captures the bulk of finished glass that enters use or inventory but is not reprocessed within the reference year.
Given the production gap between 2020 and 2021, and the reliance on 2020 figures as proxies for missing 2021 data, a confidence interval of roughly ±10% is considered appropriate.

4. Discussion

The EW-MFA implementation started by setting precise system boundaries and spelling out the underlying assumptions; the scope spans the entire Italian economy and all actors within the glass value chain. Furthermore, advancements in waste management are explored, including tech-enabled approaches to minimise waste, streamline collection, and promote recycling, as well as broader applications of smart technologies in urban settings, with the specific focus on enhancing sustainability and resource management within the context of the glass industry and beyond.
An important assumption is that “Indirect Flows,” related to the physical upstream of material flows from imports and exports, and “Domestic Unused Extraction,” referring to movements of unused materials associated with raw material extraction domestically and abroad, are considered negligible due to their low relevance in tonnes per year.
Although the bulk of input data is drawn from 2021, gaps in energy use and emissions records were filled with 2020 values, introducing a year-long mismatch that could be eliminated by harmonising all datasets to a single reference year. Where public databases or company disclosures provided no numbers, the missing values were calculated from documented coefficients. Improving data resolution, particularly at the sub-process level and by individual fuel type, would further strengthen the analysis. Despite these limitations, the key flows and indicators derived from the model provide a reliable foundation for analysing the Italian glass sector. Critical insights for 2021 include the “Domestic extraction” of glass raw materials (sand and limestone) and energy sources needed for production, totalling approximately 7,951,147 tonnes. Italy posts a NAS/DMI ratio of 0.63, roughly eight points above the EU-27 median of 0.55, whereas its DPO/DMI stands at 0.28, just under the bloc’s median of 0.31. This combination means more material is locked into long-lived stock for every tonne entering the economy, while marginally less leaves as waste—an imbalance that foreshadows a surge of end-of-life glass unless circular loops are expanded.
Reducing this figure by increasing the national recycling rate would decrease the need for new raw materials. Additionally, minimising waste generation and maximising glass reuse within the industry are essential steps for sustainability improvements. The findings from numerous studies highlight substantial differences in municipal solid waste management performance between regions in the EU, even within the same country. This study’s focus on the Italian glass industry aligns with broader EU efforts to standardise and improve waste management practices, especially given the progressive convergence observed at a rate of 3.6% yearly, according to [4]. However, significant improvements are needed, particularly in regions with lagging performance. These insights support the need for comprehensive policy frameworks and targeted initiatives to bridge these gaps and promote uniform progress towards a circular economy.
The circular economy framework emphasises waste reduction, material circulation, and ecological restoration. This perspective aligns with the broader objectives of our study on the Italian glass sector, focusing on enhancing sustainability through efficient resource management and waste reduction.
A second pivotal flow category is “releases to air and water,” capturing the gaseous emissions and liquid effluents produced during both glass manufacturing operations and subsequent waste handling processes, 2,914,304.70 tonnes/year. In particular, the harmful emissions generated are derived from the energy intensive process, specifically during the melting phase for the high melting point of raw silica temperature, around 1700 °C. To reduce these emissions, it is crucial to implement efficient melting technologies, develop new glass composition to lower the melting point of modern glass products as the academic and industrial contexts are proposing [35,36], and maximise the reuse of cullet. Enhancing energy efficiency, optimising material formulations, and promoting recycling practices are key strategies in achieving significant emission reductions in the glass manufacturing process. Recycling success depends on cullet purity: the fewer contaminants present, the greater the share that can be re-melted into new glass. Achieving such quality is especially demanding for flat-glass production, which today uses only about 11% recycled material because the process requires extremely tight chemical specifications [37]. According to [16], a 10% increase in cullet in the container glass melting process reduces energy consumption by 2–3% and decreases CO2 emissions by 5%. This is because the substitution of raw materials having carbonate also lowers CO2 emissions released during decarbonation. Melting one tonne of cullet saves around 1.2 tonnes of virgin raw materials and reduces overall CO2 emissions (both direct and indirect) by about 60%, given that glass production is energy intensive and contributes significantly to global CO2 emissions.
The European Union has established a comprehensive regulatory framework aimed at advancing sustainable waste management practices. Since the 2008 Waste Framework Directive, EU legislation has steered Member States toward more sustainable municipal-waste systems. Chioatto E. et al. [38], using Data Envelopment Analysis to examine 75 NUTS-2 regions across Italy, France, Germany, and the Netherlands from 2008 to 2013, revealed significant progress in regions like Germany and the Netherlands which have notably reduced landfill use and increased recycling rates. In contrast, regions in Italy and France displayed lower performance levels, though they showed progressive improvement. This disparity highlights the need for further efforts, especially in regions with lower waste collection volumes, to accelerate alignment with EU targets. Upcoming research could merge the present static EW-MFA with a stock-driven dynamic model, enabling forecasts of future cullet flows and synchronising furnace decarbonisation plans with projected material availability.
Italy operates a mature glass container recycling network, yet performance differs markedly across the country. CoReVe figures for 2022 show a national recycling rate of 80.8%, with plants in the north consistently outpacing those in central and southern regions. Collection streams from northern municipalities already approach EU purity targets for cullet, whereas southern flows fall short because pick-up rates and sorting quality remain lower [16]. Expanding local collection programmes, adding colour sorting capacity, and widening the treatment centre network are therefore critical for boosting cullet use and keeping it economically attractive throughout Italy.

5. Conclusions

This research effectively implemented the EW-MFA methodology within the Italian glass industry, yielding profound insights into the usage of resources, environmental impacts, and opportunities for improvement. Utilising STAN software, the EW-MFA model provided a thorough and consistent depiction of material flows across the industry, from the extraction of raw materials to waste management at the end of the lifecycle. The model accurately portrays each production phase and its environmental repercussions, confirming its practical relevance.
Drawing from foundational works by the OECD and Eurostat, this study applied established theoretical frameworks and guidelines to accurately represent the material flows in the Italian glass sector. Despite facing challenges with data availability and consistency, the use of STAN software maintained methodological accuracy, ensuring reliable data depiction and system equilibrium. The research concentrated on crucial material flows, notably the extraction of raw materials such as sand and limestone, alongside significant emissions from glass manufacturing processes.
The analysis revealed high resource use and emissions but also clear opportunities for improvement, especially in terms of recycling rates globally, still very low if compared to EU, and data availability, which make it difficult to have a definitive dimension of the phenomenon. This study specifically found that an increase in the national recycling rate could drastically cut the demand for new raw materials, thus reducing environmental harm. Achieving these gains calls for sharper collection logistics—adding more colour-segregated drop-off points and engaging citizens in diligent glass sorting—so that incoming cullet meets the purity levels furnaces require. At the same time, progress in low-energy melting technologies and in novel glass formulations is needed to curb both fuel use and emissions, a task that relies on active collaboration between academia and industry.
The results emphasise the critical role of incorporating principles of the circular economy into policy frameworks to boost resource efficiency and sustainability. They advocate for policies that support recycling, enhance waste management, and foster innovation in glass production technology. The empirical data calls for stricter regulations and incentives to minimise the industry’s environmental footprint.
However, the study faced certain limitations. The bulk of the data originates from 2021, yet projections for energy usage and emissions had to rely on 2020 figures due to insufficient data from 2021, highlighting the need for improved data synchronisation. Additionally, some data points were challenging to obtain and required estimation through appropriate coefficients. Enhancing data segmentation could further improve the accuracy and reliability of the findings.
The study recommends additional research to refine the accuracy of data related to emissions, energy consumption, and recycling processes. There is also a need for more comprehensive data on the social and health impacts of material flows, aspects that were not thoroughly addressed in this analysis, such as labour conditions in mining or recycling facilities. Future research should delve into the wider implications of the circular economy, including its social dimensions such as equity and social justice, to foster a more holistic understanding of sustainable resource management.

Author Contributions

Conceptualization, S.A., M.C.L., A.P., P.S., I.V., and A.A.Z.; methodology, S.A., M.C.L., A.P., P.S., I.V., and A.A.Z.; software, S.A., M.C.L., A.P., P.S., I.V., and A.A.Z.; validation, S.A., M.C.L., A.P., P.S., I.V., and A.A.Z.; formal analysis, S.A., M.C.L., A.P., P.S., I.V., and A.A.Z.; investigation, S.A., M.C.L., A.P., P.S., I.V., and A.A.Z.; data curation, S.A., M.C.L., A.P., P.S., I.V., and A.A.Z.; writing—original draft preparation, S.A., M.C.L., A.P., P.S., I.V., and A.A.Z.; writing—review and editing, S.A., M.C.L., A.P., P.S., I.V., and A.A.Z.; visualization, S.A., M.C.L., A.P., P.S., I.V., and A.A.Z.; supervision, S.A., M.C.L., A.P., P.S., I.V., and A.A.Z. All authors have read and agreed to the published version of the manuscript.

Funding

This research received no external funding.

Institutional Review Board Statement

Not applicable.

Informed Consent Statement

Not applicable.

Data Availability Statement

Data available on request.

Conflicts of Interest

The authors declare no conflicts of interest.

References

  1. Vinci, G.; D’Ascenzo, F.; Esposito, A.; Musarra, M.; Rapa, M.; Rocchi, A. A sustainable innovation in the Italian glass production: LCA and Eco-Care matrix evaluation. J. Clean. Prod. 2019, 223, 587–595. [Google Scholar] [CrossRef]
  2. Statista. EU Total Glass Production 2010–2023. 2024. Available online: https://www.statista.com/statistics/1154296/glass-production-eu/ (accessed on 14 May 2025).
  3. Atzori, D.; Tiozzo, S.; Vellini, M.; Gambini, M.; Mazzoni, S. Industrial Technologies for CO2 Reduction Applicable to Glass Furnaces. Thermo 2023, 3, 682–710. [Google Scholar] [CrossRef]
  4. Chioatto, E.; Fedele, A.; Liscio, M.C.; Sospiro, P. Testing data envelopment analysis models on the performance of European Union regions in sustainable waste management. Waste Manag. 2024, 175, 170–182. [Google Scholar] [CrossRef] [PubMed]
  5. Chioatto, E.; Liscio, M.C.; Sospiro, P. State of the Art of Economy-Wide Material Flow Accounting in the Scientific Literature. In Trash or Treasure; Springer: Cham, Switzerland, 2024; pp. 57–78. [Google Scholar]
  6. EUROSTAT. Secondary Materials in European Material Flow Accounts in Raw Material Equivalents. 2018. Available online: https://ec.europa.eu/eurostat/documents/1798247/6874172/Eurostat+EEEA+technical+note+%282018%29+-+Secondary+materials+in+European+MFA-RME (accessed on 14 May 2025).
  7. EUROSTAT. Economy-Wide Material Flow Accounts-Handbook. 2018. Available online: https://ec.europa.eu/eurostat/documents/3859598/9117556/KS-GQ-18-006-EN-N.pdf/b621b8ce-2792-47ff-9d10-067d2b8aac4b?t=1537260841000 (accessed on 14 May 2025).
  8. JRC. Best Available Techniques (BAT) Reference Document for the Manufacture of Glass. 2013. Available online: https://eippcb.jrc.ec.europa.eu/sites/default/files/2019-11/GLS_Adopted_03_2012_0.pdf (accessed on 14 May 2025).
  9. Zier, M.; Stenzel, P.; Kotzur, L.; Stolten, D. A review of decarbonization options for the glass industry. Energy Convers. Manag. X 2021, 10, 100083. [Google Scholar] [CrossRef]
  10. Amicarelli, V.; Rana, R.L.; Lombardi, M.; Fellner, J.; Tricase, C.; Bux, C. Material flow analysis and carbon footprint of water-packaging waste management. Environ. Impact Assess. Rev. 2024, 106, 107517. [Google Scholar] [CrossRef]
  11. Lagioia, G.; Calabrò, G.; Amicarelli, V. Empirical study of the environmental management of Italy’s drinking water supply. Resour. Conserv. Recycl. 2012, 60, 119–130. [Google Scholar] [CrossRef]
  12. D’Adamo, I.; Daraio, C.; Di Leo, S.; Gastaldi, M.; Rossi, E.N. Driving EU sustainability: Promoting the circular economy through municipal waste efficiency. Sustain. Prod. Consum. 2024, 50, 462–474. [Google Scholar] [CrossRef]
  13. Chioatto, E.; Zecca, E.; D’Amato, A. Which innovations for Circular Business Models? A product life-cycle categorisation. Ind. Innov. 2024, 31, 809–831. [Google Scholar] [CrossRef]
  14. Assovetro Associazione Nazionale Degli Industriali del Vetro. Rapporto di Sostenibilità 2021; Assovetro Associazione Nazionale Degli Industriali del Vetro: Roma, Italy, 2021. [Google Scholar]
  15. CoReVe. Sintesi del Rapporto di Sostenibilità. 2023. Available online: https://coreve.it/wp-content/uploads/2024/10/COREVE-bilancio-2023-MR_compressed.pdf (accessed on 14 May 2025).
  16. Testa, M.; Malandrino, O.; Sessa, M.R.; Supino, S.; Sica, D. Long-term sustainability from the perspective of cullet recycling in the container glass industry: Evidence from Italy. Sustainability 2017, 9, 1752. [Google Scholar] [CrossRef]
  17. Schmitz, A.; Kamiński, J.; Scalet, B.M.; Soria, A. Energy consumption and CO2 emissions of the European glass industry. Energy Policy 2011, 39, 142–155. [Google Scholar] [CrossRef]
  18. Westbroek, C.D.; Bitting, J.; Craglia, M.; Azevedo, J.M.C.; Cullen, J.M. Global material flow analysis of glass: From raw materials to end of life. J. Ind. Ecol. 2021, 25, 333–343. [Google Scholar] [CrossRef]
  19. Butler, J.H.; Hooper, P.D. Chapter 15—Glass Waste. In Waste (Second Edition)—A Handbook for Management; Academic Press: Cambridge, MA, USA, 2019; pp. 307–322. [Google Scholar]
  20. EUROSTAT. Economy-Wide Material Flow Accounts and Derived Indicators—A Methodological Guide; EUROSTAT: Luxembourg, 2001. [Google Scholar]
  21. STAN Software, About STAN. Consultato il Giorno 2025. Available online: https://www.stan2web.net/infos/about-stan (accessed on 14 May 2025).
  22. Cencic, O.; Rechberger, H. Material Flow Analysis with Software STAN. 2008. Available online: https://www.researchgate.net/publication/284663142_Material_flow_analysis_with_Software_STAN (accessed on 14 May 2025).
  23. Stanmore, B.R.; Gilot, P. Review—Calcination and carbonation of limestone during thermal cycling for CO2 sequestration. Fuel Process. Technol. 2005, 86, 1707–1743. [Google Scholar] [CrossRef]
  24. Eurostat-European Commission, Material Flow Accounts (env_ac_mfa). 2024. Available online: https://ec.europa.eu/eurostat/databrowser/view/env_ac_mfa__custom_10057694/default/table?lang=en (accessed on 14 May 2025).
  25. Solvay. Solvay’s Soda Ash Production in Rosignano. 2020. Available online: https://www.solvay.com/sites/g/files/srpend616/files/2022-01/Solvay%20Rosignano%20-%20Factsheet.pdf (accessed on 14 May 2025).
  26. Sudsakorn, K.; Palitsakun, S. Production of Thermally Stable Solids from CO2 Capture Using Ammoniated Brine; In International ASET Inc.: Orléans, ON, Canada, 2018. [Google Scholar]
  27. Manahan, S.E. 5.13: Industrial Chemical Reactions—The Solvay Process. 2021. Available online: https://chem.libretexts.org/Bookshelves/Environmental_Chemistry/Green_Chemistry_and_the_Ten_Commandments_of_Sustainability_(Manahan)/05%3A_Chemical_Reactions-_Making_Materials_Safely_and_Sustainable/5.13%3A_Industrial_Chemical_Reactions_-_The_Solvay_Process (accessed on 14 May 2025).
  28. Terna S.p.A. Rete Elettrica Nazionale, Pubblicazioni Statistiche. Available online: https://www.terna.it/it/sistema-elettrico/statistiche/pubblicazioni-statistiche (accessed on 14 May 2025).
  29. Eurostat-European Commission. Glossary: Tonnes of Oil Equivalent (Toe). 2018. Available online: https://ec.europa.eu/eurostat/statistics-explained/index.php?title=Glossary:Tonnes_of_oil_equivalent_(toe) (accessed on 14 May 2025).
  30. Assovetro. Dati di Settore. [Consultato il Giorno 2025]. 2024. Available online: https://assovetro.it/dati-di-settore/ (accessed on 14 May 2025).
  31. ISPRA. Le Emissioni di Gas Serra in Italia: Obiettivi di Riduzione e Scenari Emissivi. 2023. Available online: https://www.isprambiente.gov.it/files2023/pubblicazioni/rapporti/rapporto_384_2023_le-emissioni-di-gas-serra-in-italia.pdf (accessed on 14 May 2025).
  32. ISPRA. Il Metano Nell’inventario Nazionale Delle Emissioni di Gas Serra. L’Italia e il Global Methane Pledge. 2021. Available online: https://www.isprambiente.gov.it/files2022/pubblicazioni/rapporti/r374-2022-1.pdf (accessed on 14 May 2025).
  33. European Environmental Agency. Industrial Reporting Under the Industrial Emissions Directive 2010/75/EU and European Pollutant Release and Transfer Register Regulation (EC) No 166/2006; European Environmental Agency: Copenhagen, Denmark, 2022. [Google Scholar]
  34. EUROSTAT. Material Flow Accounts-Main Indicators. [Consultato il giorno 2025]. 2024. Available online: https://ec.europa.eu/eurostat/databrowser/view/env_ac_mfain__custom_17169058/default/table?lang=en (accessed on 14 May 2025).
  35. Masai, H.; Nishibe, T.; Yamamoto, S.; Niizuma, T.; Kitamura, N.; Akai, T.; Ohkubo, T.; Yoshida, M. Low melting oxide glasses prepared at a melt temperature of 500 °C. Sci. Rep. 2021, 11, 214. [Google Scholar] [CrossRef] [PubMed]
  36. Chai, C.; Yan, Y.; Cao, B.; Guo, L.; Huang, L.; Xu, S.; Zhao, S. Low melting temperature chloride borosilicate photothermal refractive glass for holographic applications. Ceram. Int. 2025, 51, 15129–15137. [Google Scholar] [CrossRef]
  37. Kilinc, E.; Hand, R.J. Mechanical properties of soda–lime–silica glasses with varying alkaline earth contents. J. Non-Cryst. Solids 2015, 429, 190–197. [Google Scholar] [CrossRef]
  38. Chioatto, E.; Khan, M.A.; Sospiro, P. Sustainable solid waste management in the European Union: Four countries regional analysis. Sustain. Chem. Pharm. 2023, 33, 101037. [Google Scholar] [CrossRef]
Figure 1. Schematic representation of the Italian Glass Industry. Own elaboration based on Assovetro data.
Sustainability 17 06180 g001
Figure 2. Stages of glass production, from virgin feedstock to landfill disposal. Own elaboration based on Westbroek C.D. et al. [18].
Sustainability 17 06180 g002
Figure 3. Schematic of economy-wide material flows. Own elaboration from Eurostat [20].
Sustainability 17 06180 g003
Figure 4. Full model of Italy’s glass sector material flows, 2021. Own elaboration using STAN. Green for inputs, Black for internal flows, Red for Air/Water emissions, Blue for Outputs.
Sustainability 17 06180 g004
Figure 5. Sankey diagram view of material flows in Italy’s glass industry, 2021. Own elaboration.
Sustainability 17 06180 g005
Table 1. Intermediate calculation steps for the primary flows in the glass sector in Italy, 2021.
MF.3 for glass production, (tonnes)
Raw materialDE
equivalent
IM
equivalent
Silicon dioxide (Silica)70%4,223,861.6Sand eq.4,693,179.64,490,254.9202,924.6
Calcium oxide12%724,090.6Limestone eq.1,448,181.11,448,181.1negligible
Sodium oxide15%905,113.2Limestone eq.1,925,772.81,925,772.8negligible
MF.4 Fossil energy results (tonnes)
DE equivalentIM equivalent
Coal and other solid (4.1)6891.41886.5
Liquid energy (4.2)1450.2397.0
Natural gas (4.2.2)78,596.7594,187.1
MF 7.1 Emission to air
Quantity (tonnes)
CO2 (1.01) production direct and indirect2,070,002.0
CO2(1.01) waste management118,789.9
NOx 1.04)8198.0
SO2 (1.10)3457.0
Particles (1.14)78.1
CH4 (1.02) (from waste management)76,448.9
Overall DPO values Overall DE-IM values
DPO from production2,719,066 Total DE (tonnes)7,951,147.05
DPO from Waste Mgmt.195,238.83 Total IM (tonnes)2,559,395.25
Total DPO (tonnes)2,914,304.70
Balancing Items (Input = Output) (tonnes)
EmissionsInput valuesStep 1 (O2)Step 2 (O2)Step 3 (O2)
CO22,183,322.851,587,275.711797.127,751.24
NO28198.005705.812480.2-
SO23457.001728.501,226,686.7127,360.91
Coal8358.81
Oil products1759.03
Natural Gas670,320.58
Table 2. Summary of the principal material flow metrics and corresponding indicators for Italy’s glass sector in 2021.
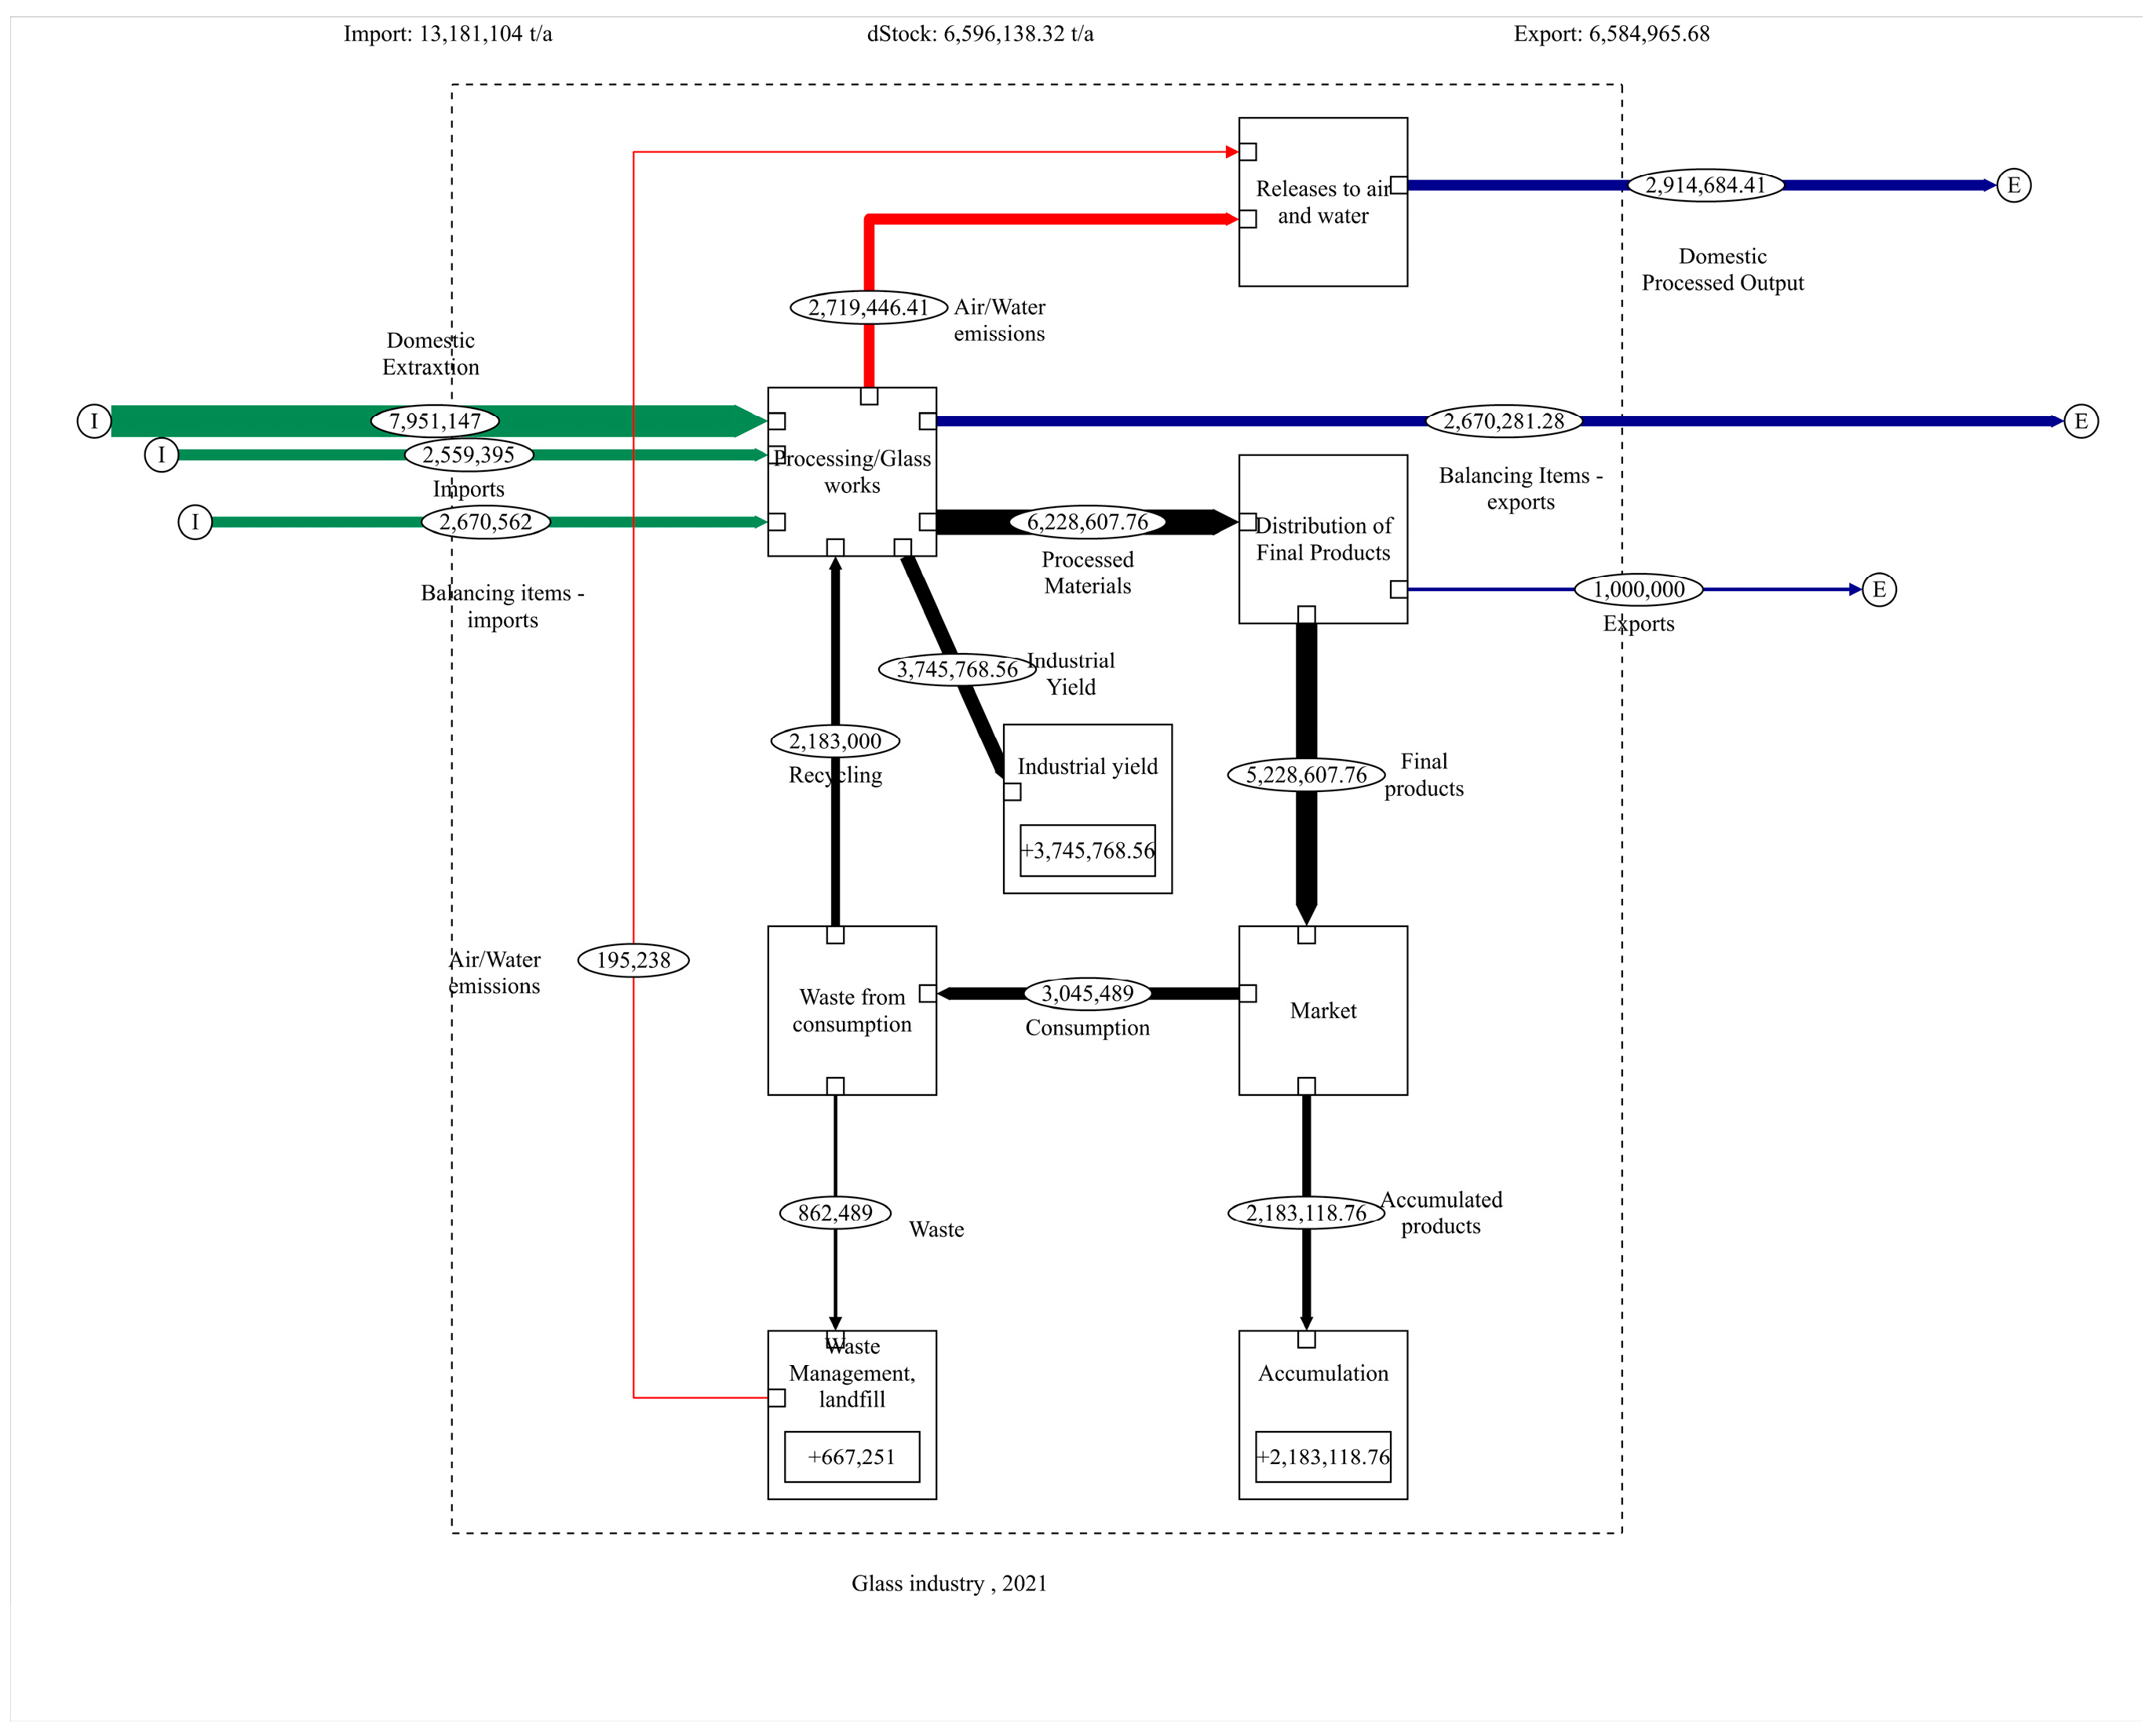
Final System flows (tonnes)
InputOutput
DE7,951,147.1DPO2,914,304.7
IM2,559,395.3EX1,000,000.0
BII2,670,561.9BIE2,670,561.9
Total13,181,104Total6,584,867
Net Addition to Stock NAS (tonnes)6,596,238
Final Indicators—CategoryIndicatorFormulaValue (tonnes)
InputDEU-7,951,147.1
DMIDEU + Imports10,510,542.3
OutputDPO-2,914,304.7
DMODPO + Exports3,914,304.7
ConsumptionDMCDMI − Exports9,510,542.3
BalanceNASDMI – DPO − Exports6,596,237.6
PTBImports − Exports1,559,395.3
ProductivityGDP/DMI$/tonnes201,165.6
Disclaimer/Publisher’s Note: The statements, opinions and data contained in all publications are solely those of the individual author(s) and contributor(s) and not of MDPI and/or the editor(s). MDPI and/or the editor(s) disclaim responsibility for any injury to people or property resulting from any ideas, methods, instructions or products referred to in the content.

