
Assessing Tractors’ Active Safety in Serbia: A Driving Simulator Study

 ,
,  , , and
Abstract
1. Introduction
2. Literature Review
2.1. The Role of Vehicle Visibility in the Context of Sustainable Transportation
2.2. Vehicle Visibility Equipment and Perceptual Factors in Traffic Safety
3. Materials and Methods
3.1. Experimental Design Overview
3.2. Stimuli and Experimental Conditions
3.3. Driving Simulator Setup
3.4. Experimental Protocol
3.5. Data Collection and Statistical Processing
4. Results
4.1. Demographic Data
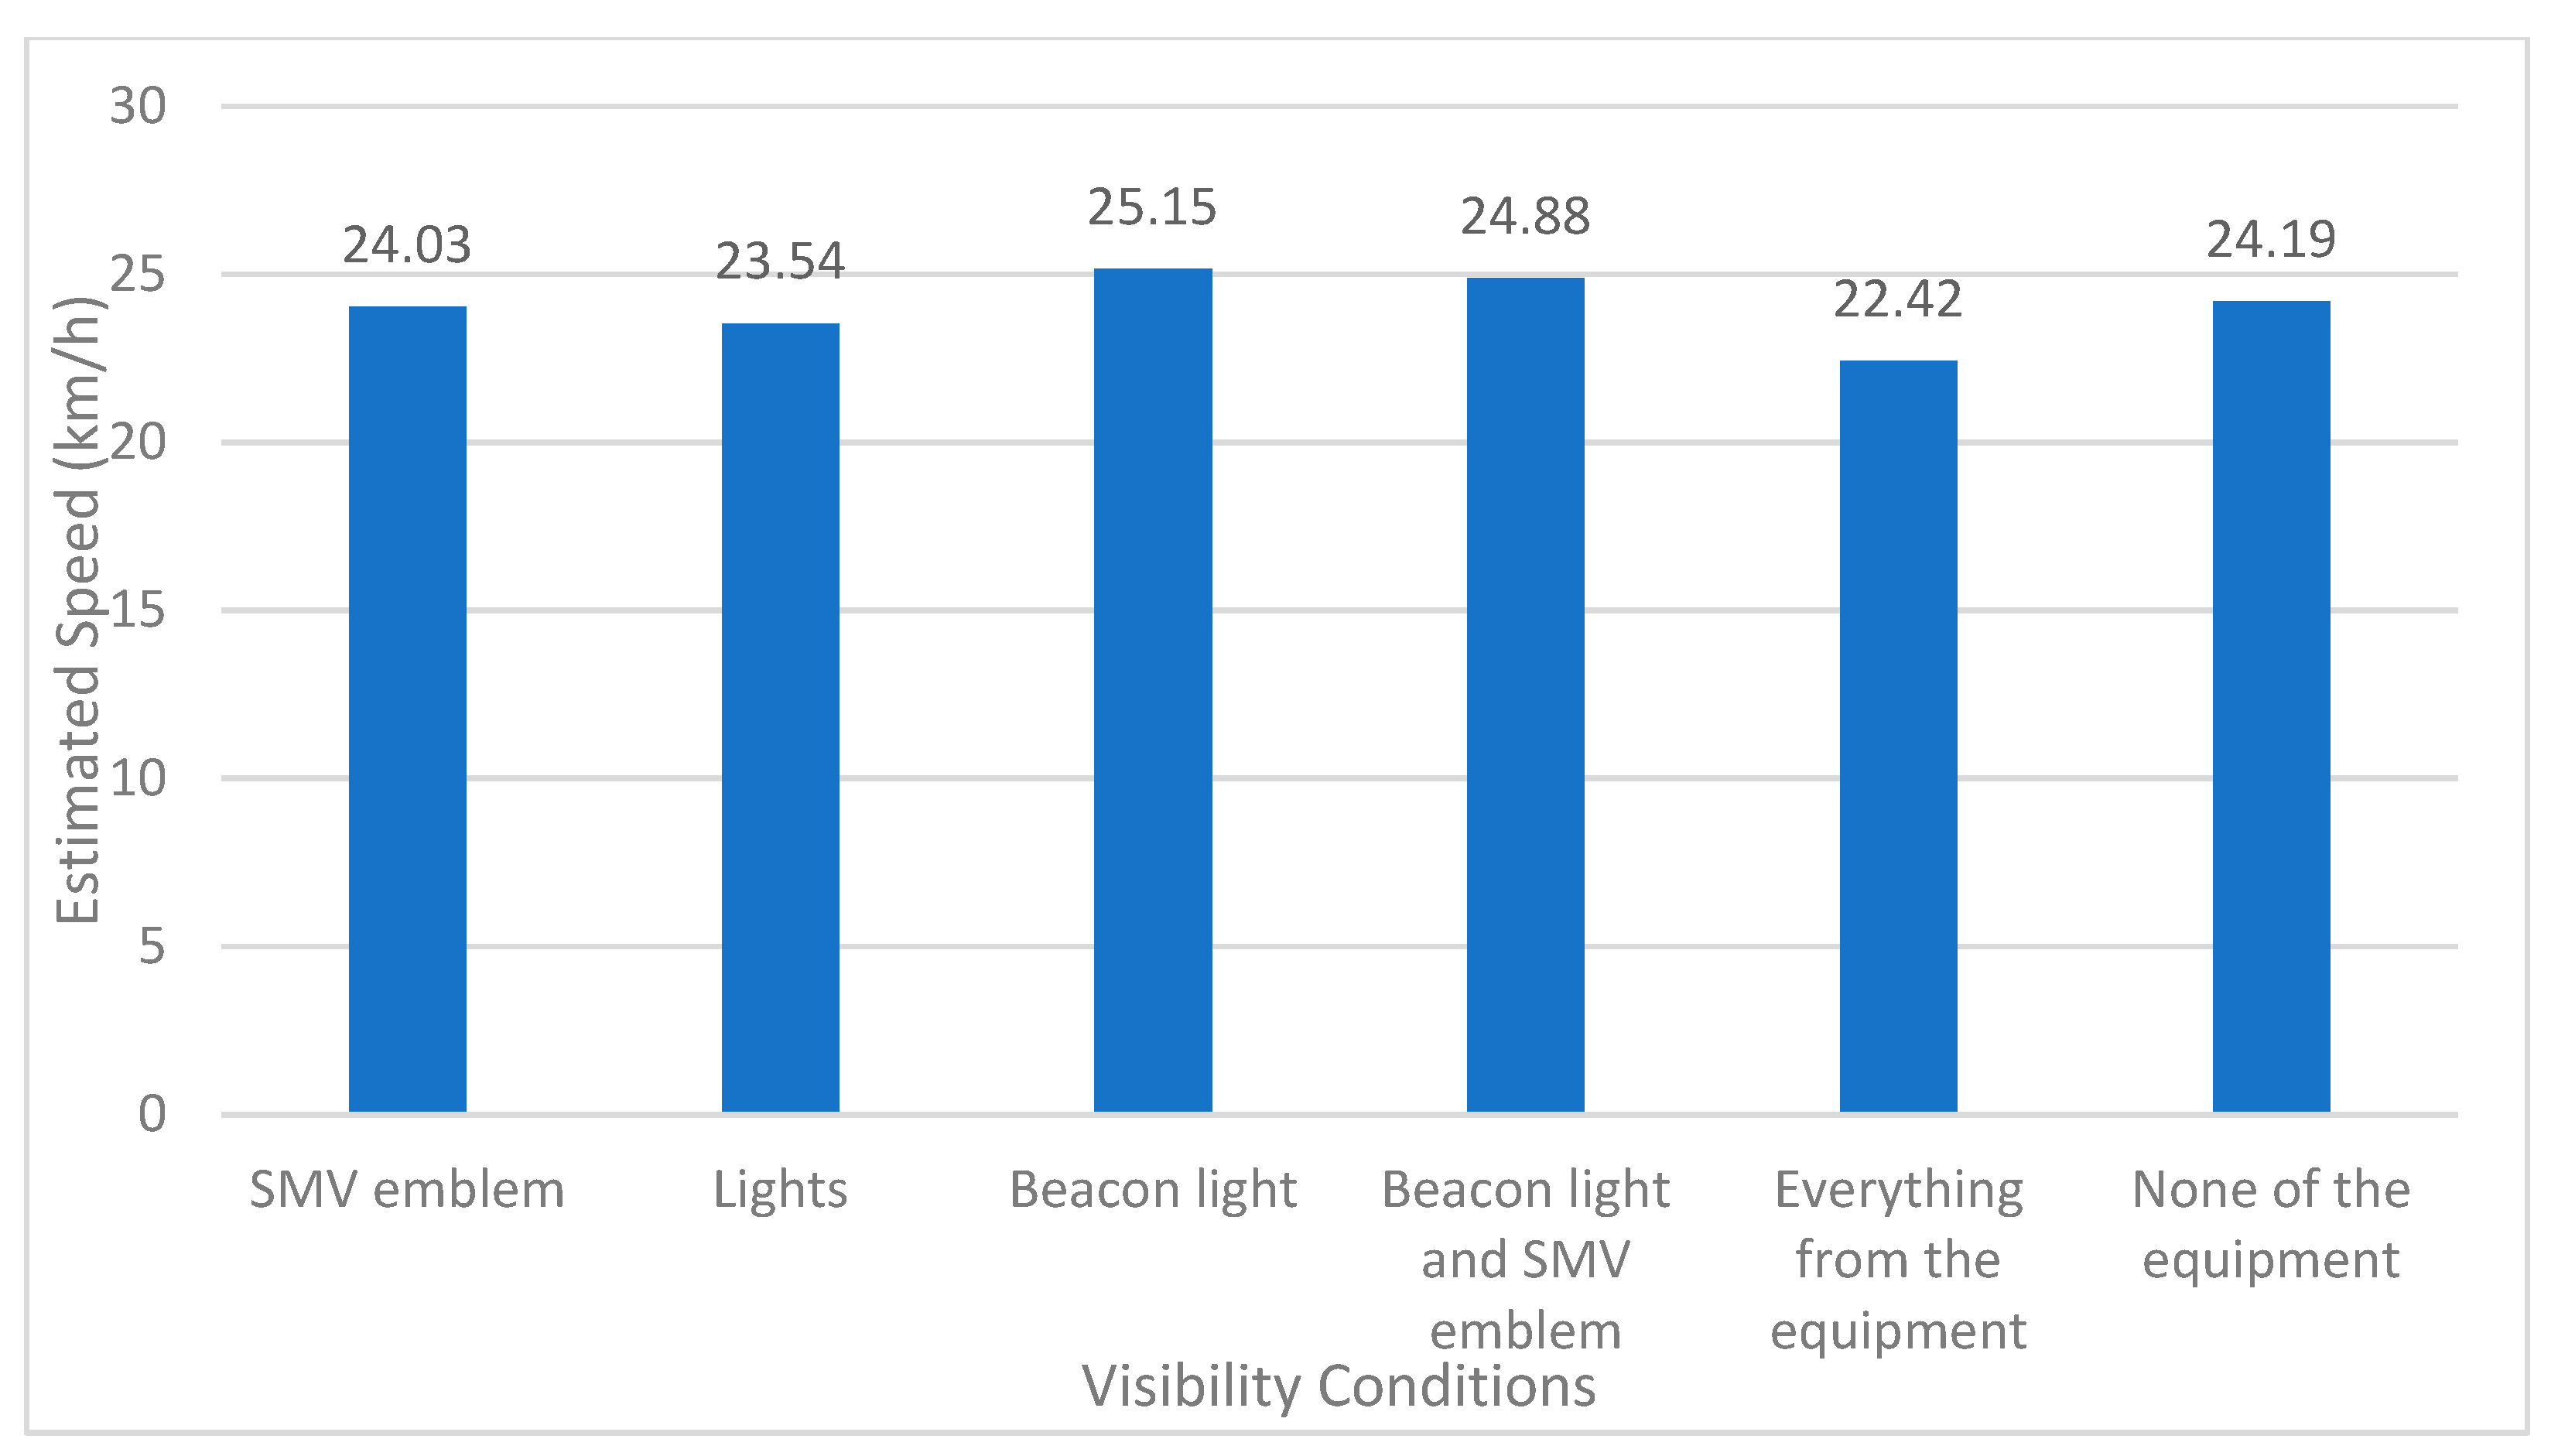
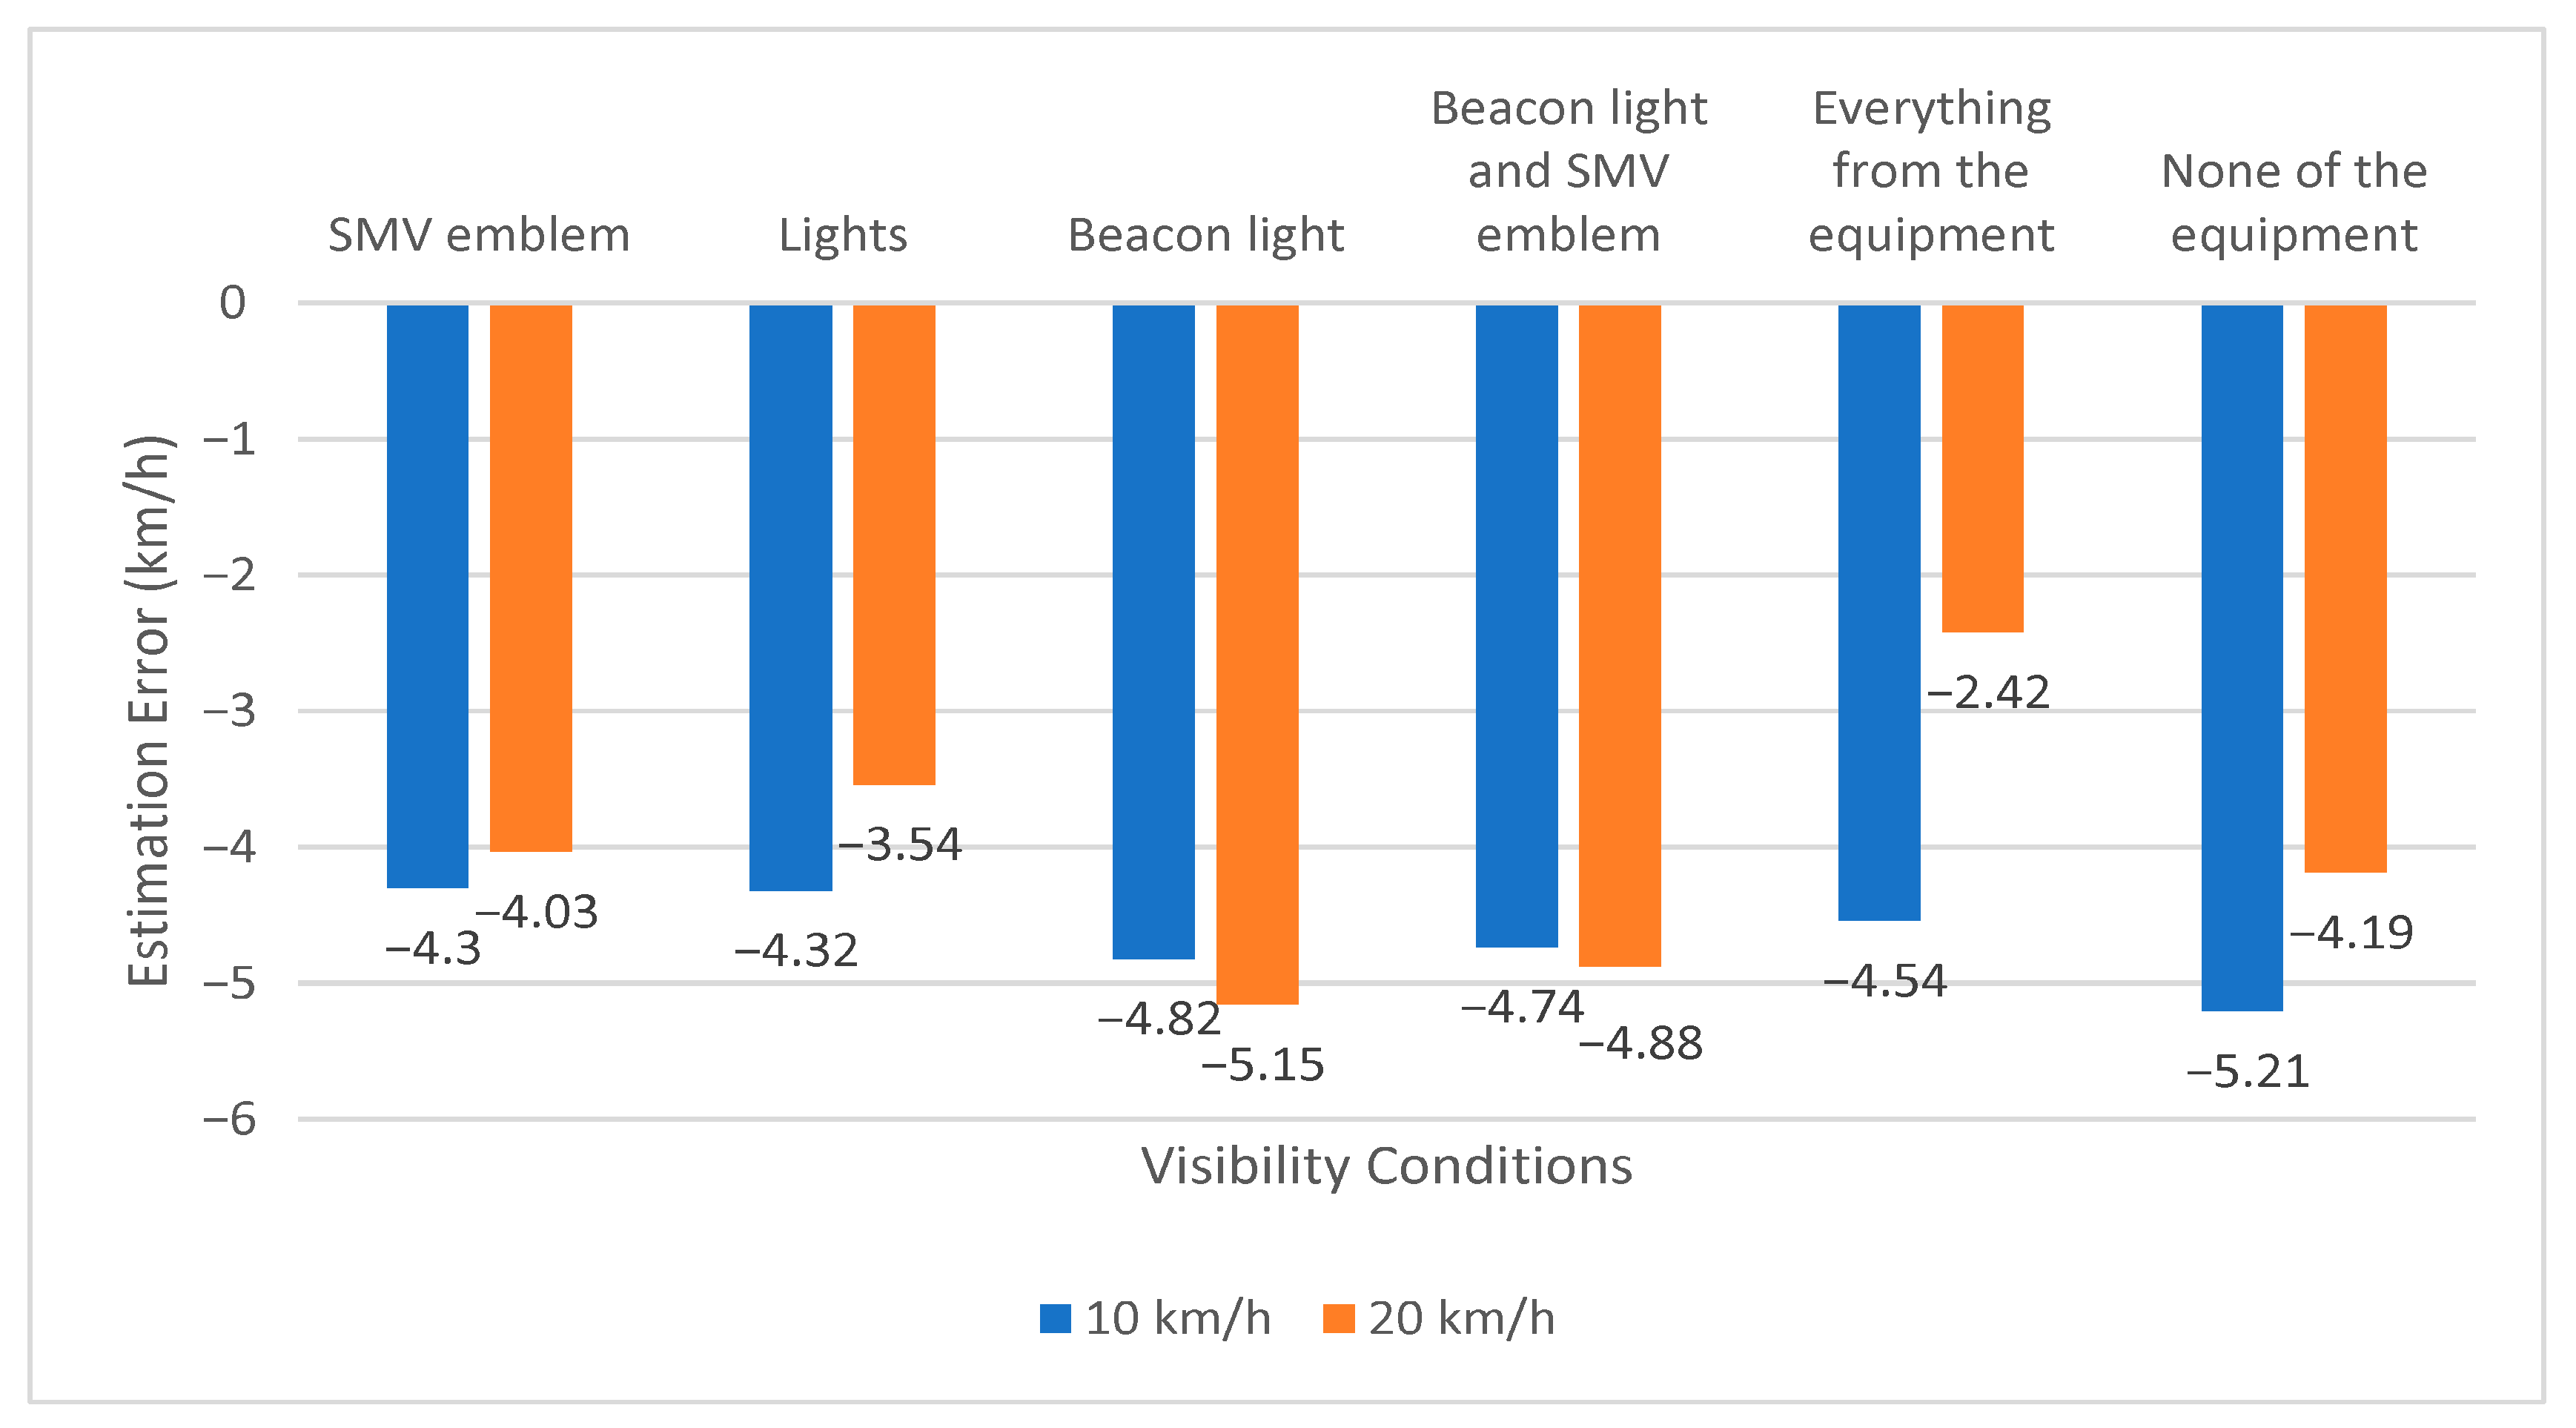
4.2. Tractor Speed Estimate
4.3. Gender Differences in Tractor Speed Estimation
4.4. The Respondent’s Place of Residence and Tractor Speed Estimation
4.5. Driving License Category and Tractor Speed Estimation
4.6. Years of Possession of the Driver’s License and Tractor Speed Estimation
4.7. Frequency of Driving a Motor Vehicle and Tractor Speed Estimation
4.8. Impact of Tractor Driving Experience on Tractor Speed Estimation
4.9. The Relationship Between Road Crashes and Tractor Speed Estimation
4.10. Cluster Analysis of Drivers Based on Speed Perception Patterns
5. Discussion
Limitations and Future Research
6. Conclusions
Author Contributions
Funding
Institutional Review Board Statement
Informed Consent Statement
Data Availability Statement
Conflicts of Interest
References
- Pitka, P.; Miličić, M.; Kovačević, T.; Majstorović, M. Development of information systems in road transportation. J. Road Traffic Eng. 2024, 70, 41–45. [Google Scholar] [CrossRef]
- Hasanov, R.I.; Giyasova, Z.; Azizova, R.; Huseynova, S.; Zemri, B.E. Long-Term Dynamics Between Human Development and Environmental Sustainability: An Empirical Analysis of CO2 Emissions in Azerbaijan. Chall. Sustain. 2024, 12, 273–280. [Google Scholar] [CrossRef]
- Trifunović, A.; Senić, A.; Čičević, S.; Ivanišević, T.; Vukšić, V.; Simović, S. Evaluating the Road Environment Through the Lens of Professional Drivers: A Traffic Safety Perspective. Mechatron. Intell. Transp. Syst. 2024, 3, 31–38. [Google Scholar] [CrossRef]
- Khan, D. A Functional Energy Minimization Framework for the Detection of Crash Stones on Road Surfaces in Intelligent Transportation Systems. Mechatron. Intell. Transp. Syst. 2025, 4, 81–91. [Google Scholar] [CrossRef]
- Integrated Database on Road Safety Features. Available online: https://bazaabs.abs.gov.rs/absPortal/ (accessed on 17 February 2025).
- Feroz Khan, A.B.; Ivan, P. Integrating Machine Learning and Deep Learning in Smart Cities for Enhanced Traffic Congestion Management: An Empirical Review. J. Urban Dev. Manag. 2023, 2, 211–221. [Google Scholar] [CrossRef]
- Hussein, A.M.; Osman, B.M. The Impact of Rapid Urbanization on Poverty Levels in the Context of Climate Change: Empirical Evidence from Somalia. Chall. Sustain. 2024, 12, 281–291. [Google Scholar] [CrossRef]
- Senić, A.; Dobrodolac, M.; Stojadinović, Z. Development of Risk Quantification Models in Road Infrastructure Projects. Sustainability 2024, 16, 7694. [Google Scholar] [CrossRef]
- Kalem, A.; Tadić, S.; Krstić, M.; Čabrić, N.; Medić, A.; Branković, N. Evaluation of Railway Infrastructure Managers’ Efficiency Using a Pearson’s Correlation-Based DEA Method Model. Oppor. Chall. Sustain. 2024, 3, 256–268. [Google Scholar] [CrossRef]
- Stević, Ž.; Subotić, M.; Softić, E.; Božić, B. Multi-Criteria Decision-Making Model for Evaluating Safety of Road Sections. J. Intell. Manag. Decis. 2022, 1, 78–87. [Google Scholar] [CrossRef]
- Liao, X.; Wu, G.; Yang, L.; Barth, M.J. A Real-World Data-Driven approach for estimating environmental impacts of traffic accidents. Transp. Res. Part. D Transp. Environ. 2023, 117, 103664. [Google Scholar] [CrossRef]
- Lankarani, K.B.; Heydari, S.T.; Aghabeigi, M.R.; Moafian, G.; Hoseinzadeh, A.; Vossoughi, M. The impact of environmental factors on traffic accidents in Iran. J. Inj. Violence Res. 2014, 6, 64. [Google Scholar] [CrossRef]
- Adshead, F.; Salman, R.A.-S.; Aumonier, S.; Collins, M.; Hood, K.; McNamara, C.; Moore, K.; Smith, R.; Sydes, M.R.; Williamson, P.R. A strategy to reduce the carbon footprint of clinical trials. Lancet 2021, 398, 281–282. [Google Scholar] [CrossRef]
- Ivanišević, T.; Trifunović, A.; Marković, N.; Simović, S. Analysis of the Influence of Vehicle Color on Speed Perception and Estimation. J. Road Traffic Eng. 2025, 71, 47–51. [Google Scholar] [CrossRef]
- Calsavara, F.; Kabbach Junior, F.I.; Larocca, A.P.C. Effects of Fog in a Brazilian Road Seg-ment Analyzed by a Driving Simulator for Sustainable Transport: Drivers’ Visual Profile. Sustainability 2021, 13, 9448. [Google Scholar] [CrossRef]
- Christoforou, Z.; Kallianiotis, A.; Farhi, N. Design, Development, and Validation of Driving Simulators for Enhancing the Safety and Sustainability of Electric Microvehicles. Sustainability 2025, 17, 3260. [Google Scholar] [CrossRef]
- D’Elia, A.; Newstead, S. Evaluation of the effectiveness of daytime running lights (DRLs). J. Saf. Res. 2023, 85, 95–100. [Google Scholar] [CrossRef] [PubMed]
- Knight, I.; Sexton, B.; Bartlett, R.; Barlow, T.; Latham, S.; McCrae, I. Daytime Running Lights (DRL): A Review of the Reports from the European Commission; TRL Limited: Wokingham, UK, 2006. [Google Scholar]
- Ivanišević, T.; Ivković, I.; Čičević, S.; Trifunović, A.; Pešić, D.; Vukšić, V.; Simović, S. The impact of daytime running (LED) lights on motorcycles speed estimation: A driving simulator study. Transp. Res. Part. F Traffic Psychol. Behav. 2022, 90, 47–57. [Google Scholar] [CrossRef]
- Ferreira, M.; d’Orey, P.M. On the impact of virtual traffic lights on carbon emissions mitigation. IEEE Trans. Intell. Transp. Syst. 2011, 13, 284–295. [Google Scholar] [CrossRef]
- Czech, S.; Shakeshaft, A.P.; Byrnes, J.M.; Doran, C.M. Comparing the cost of alcohol related traffic crashes in rural and urban environments. Accid. Anal. Prev. 2010, 42, 1195–1198. [Google Scholar] [CrossRef]
- Dhakal, B.; Al-Kaisy, A. An Empirical Evaluation of a New Heuristic Method for Identifying Safety Improvement Sites on Rural Highways: An Oregon Case Study. Sustainability 2024, 16, 2047. [Google Scholar] [CrossRef]
- Bridgelall, R. Spatial Analysis of Middle-Mile Transport for Advanced Air Mobility: A Case Study of Rural North Dakota. Sustainability 2024, 16, 8949. [Google Scholar] [CrossRef]
- Pešić, D.; Trifunović, A.; Ivković, I.; Čičević, S.; Žunjić, A. Evaluation of the effects of daytime running lights for passenger cars. Transp. Res. Part. F Traffic Psychol. Behav. 2019, 66, 252–261. [Google Scholar] [CrossRef]
- Cavallo, V.; Pinto, M. Are car daytime running lights detrimental to motorcycle conspicuity? Accid. Anal. Prev. 2012, 49, 78–85. [Google Scholar] [CrossRef] [PubMed]
- Peña-García, A.; de Oña Lopez, R.; Espín Estrella, A.; Aznar Dols, F.; Calvo Poyo, F.J.; Molero Mesa, E.; de Oña López, J. Influence of daytime running lamps on visual reaction time of pedestrians when detecting turn indicators. J. Saf. Res. 2010, 41, 385–389. [Google Scholar] [CrossRef]
- Road Safety Agency. Overview Report. Safety of Tractor Drivers in Traffic. 2022. Available online: https://www.abs.gov.rs/admin/upload/documents/20221107135715-bezbednost-traktorista-u-saobracaju_2019_2021.pdf (accessed on 17 February 2025).
- Pešić, A.; Stephens, A.N.; Newnam, S.; Čičević, S.; Pešić, D.; Trifunović, A. Youth Perceptions and Attitudes towards Road Safety in Serbia. Systems 2022, 10, 191. [Google Scholar] [CrossRef]
- Law on Traffic Safety on the Roads. In Official Gazette; Ministry of the Republic of Serbia: Belgrade, Serbia, 2021.
- Stanojević, P.; Jovanović, D.; Lajunen, T. Influence of Traffic Enforcement on the Attitudes and Behavior of Drivers. Accid. Anal. Prev. 2013, 52, 29–38. [Google Scholar] [CrossRef]
- Marković, N.; Ivanišević, T.; Petrović, T.; Vukšić, V. Analysis of the Causes of Traffic Accidents with the Participation of Tractors. In Proceedings of the 2nd Expert Seminar with International Participation “Traffic Safety in the Local Community”; Ministry of Transport and Communications of Republika Srpska; Republic of Srpska Traffic Safety Agency; Auto-Moto Association of Republika Srpska, Banja Luka, Bosnia and Herzegovina, 31 October–1 November 2013; pp. 205–213, ISBN 978-99938-615-3-9. [Google Scholar]
- Truelove, V.; Freeman, J.; Kaye, S.A.; Watson, B.; Mills, L.; Davey, J. A Unified Deterrence-Based Model of Legal and Non-Legal Factors That Influence Young Driver Speeding Behaviour. Accid. Anal. Prev. 2021, 160, 106327. [Google Scholar] [CrossRef]
- Soleymani Kermani, M.; Namazian Jam, A. Modifying PIARC’s Linear Model of Accident Severity Index to Identify Roads’ Accident Prone Spots to Rehabilitate Pavements Considering Nonlinear Effects of the Traffic Volume. J. Rehabil. Civ. Eng. 2016, 4, 45–51. [Google Scholar] [CrossRef]
- Trifunović, A.; Pešić, D.; Čičević, S.; Antić, B. The Importance of Spatial Orientation and Knowledge of Traffic Signs for Children’s Traffic Safety. Accid. Anal. Prev. 2017, 102, 81–92. [Google Scholar] [CrossRef]
- Orriols, L.; Salmi, L.R.; Philip, P.; Moore, N.; Delorme, B.; Castot, A.; Lagarde, E. The Impact of Medicinal Drugs on Traffic Safety: A Systematic Review of Epidemiological Studies. Pharmacoepidemiol. Drug Saf. 2009, 18, 647. [Google Scholar] [CrossRef]
- Gerberich, S.G.; Robertson, L.S.; Gibson, R.W.; Renier, C. An Epidemiological Study of Roadway Fatalities Related to Farm Vehicles: United States, 1988 to 1993. J. Occup. Environ. Med. 1996, 38, 1135–1140. [Google Scholar] [CrossRef]
- Sundet, J.M. Effects of Colour on Perceived Depth. Review of Experiments and Evaluation of Theories. Scand. J. Psychol. 1978, 19, 133–143. [Google Scholar] [CrossRef] [PubMed]
- Glavić, D.; Trpković, A.; Milenković, M.; Jevremović, S. The E-Scooter Potential to Change Urban Mobility—Belgrade Case Study. Sustainability 2021, 13, 5948. [Google Scholar] [CrossRef]
- Hussain, I. An Adaptive Multi-Stage Fuzzy Logic Framework for Accurate Detection and Structural Analysis of Road Cracks. Mechatron. Intell. Transp. Syst. 2024, 3, 190–202. [Google Scholar] [CrossRef]
- Lee, Y.M.; Sheppard, E. The effect of lighting conditions and use of headlights on drivers’ perception and appraisal of approaching vehicles at junctions. Ergonomics 2018, 61, 444–455. [Google Scholar] [CrossRef]
- Davoodi, S.R.; Hossayni, S.M. Role of Motorcycle Running Lights in Reducing Motorcycle Crashes during Daytime; A Review of the Current Literature. Bull. Emerg. Trauma 2015, 3, 73–78. [Google Scholar] [PubMed]
- Al-Awar Smither, J.; Torrez, L.I. Motorcycle conspicuity: Effects of age and daytime running lights. Human Factors 2010, 52, 355–369. [Google Scholar] [CrossRef]
- Koornstra, M.; Bijleveld, F.; Hagenzieker, M. The Safety Effects of Daytime Running Lights; SWOV Institute for Road Safety Research: Hague, The Netherlands, 1997. [Google Scholar]
- Elvik, R. A meta-analysis of studies concerning the safety effects of daytime running lights on cars. Accid. Anal. Prev. 1996, 28, 685–694. [Google Scholar] [CrossRef]
- Vankov, D.; Schroeter, R.; Twisk, D. Understanding the Predictors of Young Drivers’ Speeding Intention and Behaviour in a Three-Month Longitudinal Study. Accid. Anal. Prev. 2021, 151, 105859. [Google Scholar] [CrossRef]
- Elvik, R.; Høye, A.; Vaa, T.; Sørensen, M. The Handbook of Road Safety Measures; Emerald Publishing Limited: Leeds, UK, 2009. [Google Scholar] [CrossRef]
- Greenan, M.; Toussaint, M.; Peek-Asa, C.; Rohlman, D.; Ramirez, M.R. The Effects of Roadway Characteristics on Farm Equipment Crashes: A Geographic Information Systems Approach. Inj. Epidemiol. 2016, 3, 31. [Google Scholar] [CrossRef]
- Logan, E.; Kaye, S.A.; Lewis, I. The Influence of the Revised Reinforcement Sensitivity Theory on Risk Perception and Intentions to Speed in Young Male and Female Drivers. Accid. Anal. Prev. 2019, 132, 105291. [Google Scholar] [CrossRef] [PubMed]
- Himes, S.C.; Donnell, E.T.; Porter, R.J. Posted Speed Limit: To Include or Not to Include in Operating Speed Models. Transp. Res. Part. A Policy Pract. 2013, 52, 23–33. [Google Scholar] [CrossRef]
- van Schagen, I.; Commandeur, J.J.F.; Goldenbeld, C.; Stipdonk, H. Monitoring Speed before and during a Speed Publicity Campaign. Accid. Anal. Prev. 2016, 97, 326–334. [Google Scholar] [CrossRef]
- Lin, M.R.; Kraus, J.F. A Review of Risk Factors and Patterns of Motorcycle Injuries. Accid. Anal. Prev. 2009, 41, 710–722. [Google Scholar] [CrossRef] [PubMed]
- Chellappa, S.L.; Steiner, R.; Blattner, P.; Oelhafen, P.; Götz, T.; Cajochen, C. Non-Visual Effects of Light on Melatonin, Alertness and Cognitive Performance: Can Blue-Enriched Light Keep Us Alert? PLoS ONE 2011, 6, e16429. [Google Scholar] [CrossRef] [PubMed]
- Allen, M.J.; Clark, J.R. Automobile Running Lights—A Research Report. Clin. Exp. Optom. 2021, 47, 329–345. [Google Scholar] [CrossRef]
- Tofflemire, T.C.; Whitehead, P.C. An Evaluation of the Impact of Daytime Running Lights on Traffic Safety in Canada. J. Saf. Res. 1997, 28, 257–272. [Google Scholar] [CrossRef]
- Simović, S.; Ivanišević, T.; Trifunović, A.; Čičević, S.; Taranović, D. What affects the e-bicycle speed perception in the era of eco-sustainable mobility: A driving simulator study. Sustainability 2021, 13, 5252. [Google Scholar] [CrossRef]
- Geber, S.; Baumann, E.; Klimmt, C. Tailoring in Risk Communication by Linking Risk Profiles and Communication Preferences: The Case of Speeding of Young Car Drivers. Accid. Anal. Prev. 2016, 97, 315–325. [Google Scholar] [CrossRef]
- Fierro, I.; Gómez-Talegón, T.; Alvarez, F.J. The Spanish Pictogram on Medicines and Driving: The Population’s Comprehension of and Attitudes towards Its Use on Medication Packaging. Accid. Anal. Prev. 2013, 50, 1056–1061. [Google Scholar] [CrossRef]
- Bina, M.; Graziano, F.; Bonino, S. Risky Driving and Lifestyles in Adolescence. Accid. Anal. Prev. 2006, 38, 472–481. [Google Scholar] [CrossRef]
- Rezaee Arjroody, A.; Hosseini, S.a.; Akhbari, M.; Safa, E.; Asadpour, J. Accurate Estimation of Cost and Time Utilizing isk Analysis and Simulation (Case Study: Road Construction Projects in Iran). Int. J. Constr. Manag. 2024, 24, 19–30. [Google Scholar] [CrossRef]
- Hameed, H.; Faheem, S.; Paiva-Santos, A.C.; Sarwar, H.S.; Jamshaid, M. A Comprehensive Review of Hydrogel-Based Drug Delivery Systems: Classification, Properties, Recent Trends, and Applications. AAPS PharmSciTech 2024, 25, 64. [Google Scholar] [CrossRef] [PubMed]
- Kopeček, J. Hydrophilic Biomaterials: From Crosslinked and Self-Assembled Hydrogels to Polymer-Drug Conjugates and Drug-Free Macromolecular Therapeutics. J. Control. Release 2024, 373, 1–22. [Google Scholar] [CrossRef]
- Wu, H.; Eungpinichpong, W.; Ruan, H.; Zhang, X.; Dong, X. Relationship between Motor Fitness, Fundamental Movement Skills, and Quality of Movement Patterns in Primary School Children. PLoS ONE 2021, 16, e0237760. [Google Scholar] [CrossRef] [PubMed]
- Barzegar, A.; Ghadipasha, M.; Forouzesh, M.; Valiyari, S.; Khademi, A. Epidemiologic Study of Traffic Crash Mortality among Motorcycle Users in Iran (2011–2017). Chin. J. Traumatol. 2020, 23, 219–223. [Google Scholar] [CrossRef]
- Kapatsa, C.; Kavishe, N.; Maro, G.; Zulu, S. The Identification of Sustainability Assessment Indicators for Road Infrastructure Projects in Tanzania. Sustainability 2023, 15, 14840. [Google Scholar] [CrossRef]
- Pallant, J. SPSS Survival Manual, 3rd ed.; McGraw-Hill Open University Press: Maidenhead, UK, 2007. [Google Scholar]
- IBM Corporation. IBM SPSS Statistics 28 Brief Guide; IBM Corporation: Armonk, NY, USA, 2021. [Google Scholar]
- Singh, N.; Katiyar, S.K. Application of Geographical Information System (GIS) in Reducing Accident Blackspots and in Planning of a Safer Urban Road Network: A Review. Ecol. Inform. 2021, 66, 101436. [Google Scholar] [CrossRef]
- Kuo, Y.C.; Lu, S.T. Using Fuzzy Multiple Criteria Decision Making Approach to Enhance Risk Assessment for Metropolitan Construction Projects. Int. J. Proj. Manag. 2013, 31, 602–614. [Google Scholar] [CrossRef]
- Flyvbjerg, B.; Bester, D.W. The Cost-Benefit Fallacy: Why Cost-Benefit Analysis Is Broken and How to Fix It. J. Benefit-Cost. Anal. 2021, 12, 395–419. [Google Scholar] [CrossRef]
- Luttinen, R.T. Statistical Analysis of Vehicle Time Headways; Aalto University: Espoo, Finland, 1996. [Google Scholar]
- Merola, F.; Bernardeschi, C.; Lami, G. A Risk Assessment Framework Based on Fuzzy Logic for Automotive Systems. Safety 2024, 10, 41. [Google Scholar] [CrossRef]
- Love, P.E.D.; Ahiaga-Dagbui, D.D.; Irani, Z. Cost Overruns in Transportation Infrastructure Projects: Sowing the Seeds for a Probabilistic Theory of Causation. Transp. Res. Part. A Policy Pract. 2016, 92, 184–194. [Google Scholar] [CrossRef]
- Zhang, X.; Mohandes, S.R. Occupational Health and Safety in Green Building Construction Projects: A Holistic Z-Numbers-Based Risk Management Framework. J. Clean. Prod. 2020, 275, 122788. [Google Scholar] [CrossRef]
- Shahbodaghlou, F.; Samani, B.A. A Fuzzy Systematic Approach to Construction Risk Analysis. J. Risk Anal. Cris. Response 2012, 2, 275–284. [Google Scholar] [CrossRef]
- Han, S.H.; Kim, D.Y.; Kim, H.; Jang, W.S. A Web-Based Integrated System for International Project Risk Management. Autom. Constr. 2008, 17, 342–356. [Google Scholar] [CrossRef]
- Dikmen, I.; Birgonul, M.T.; Han, S. Using Fuzzy Risk Assessment to Rate Cost Overrun Risk in International Construction Projects. Int. J. Proj. Manag. 2007, 25, 494–505. [Google Scholar] [CrossRef]
- Kodepogu, K.; Manjeti, V.B.; Siriki, A.B. Machine Learning for Road Accident Severity Prediction. Mechatron. Intell. Transp. Syst. 2023, 2, 211–226. [Google Scholar] [CrossRef]
- Trifunović, A.; Cicevic, S.; Pesic, D.; Samčović, A.; Markovic, V. Surveying Disadvantaged Children’s Traffic Safety Education in a Comparison between Paper and Electronic Methods: A Case Example for the Expanded Use of Educational Technology. Transp. Res. Rec. 2023, 2677, 401–417. [Google Scholar] [CrossRef]
- Ali, R. Intelligent Road Crack Detection Using Fuzzy Logic and Multi-Scale Optimization. Inf. Dyn. Appl. 2025, 4, 1–11. [Google Scholar] [CrossRef]
- Badi, I.; Bouraima, M.B.; Kiptum, C.K. Integrating Cultural Norms and Behav-ioral Risk Factors into Traffic Accident Mitigation: A Hybrid MCDM Approach for Libya. Mechatron. Intell. Transp. Syst. 2025, 4, 41–48. [Google Scholar] [CrossRef]
- Li, Y.; Liu, B.; Zhang, W. Driving-Related Cognitive Abilities Prediction Based on Trans-former’s Multimodal Fusion Framework. Sensors 2025, 25, 174. [Google Scholar] [CrossRef]
- Trifunović, A.; Senić, A. Pyramid of Contribution Review: A Structured Model for Functional Literature Integration in Scientific Writing. Educ. Sci. Manag. 2025, 3, 40–56. [Google Scholar] [CrossRef]

| Authors and Year | Title | Methodology | Key Findings |
|---|---|---|---|
| Pešić et al. (2019) [24] | Evaluation of the effects of daytime running lights for passenger cars | Driving simulator experiment; comparison of DRL on/off conditions | DRLs significantly improve speed estimation accuracy, especially at higher speeds (70–90 km/h) |
| Ivanišević et al. (2022) [19] | The impact of daytime running (LED) lights on motorcycles speed estimation | Driving simulator; assessment of motorcycle speed with and without LED DRLs | LED DRLs enhance speed perception accuracy at higher speeds on both urban and rural roads |
| Cavallo & Pinto (2012) [25] | Are car daytime running lights detrimental to motorcycle conspicuity? | Laboratory-based experimental study | DRLs on cars can reduce motorcycle visibility, especially when both vehicles use DRLs |
| Peña-García et al. (2010) [26] | Influence of daytime running lamps on visual reaction time of pedestrians | Psychophysical tests with pedestrians in controlled environments | DRLs shorten pedestrian reaction time when detecting vehicle turn signals |
| Elvik (1996) [44] | A meta-analysis of studies concerning the safety effects of daytime running lights on cars | Meta-analysis of multiple studies | DRLs reduce fatalities by ~25%, injuries by ~20%, and daytime crashes by ~12% |
| Koornstra et al. (1997) [43] | The Safety Effects of Daytime Running Lights | Analytical study using international data | DRLs improve safety, particularly in frontal and side collisions |
| Speed | Conditions | Mean | Str. Deviation | t | p |
|---|---|---|---|---|---|
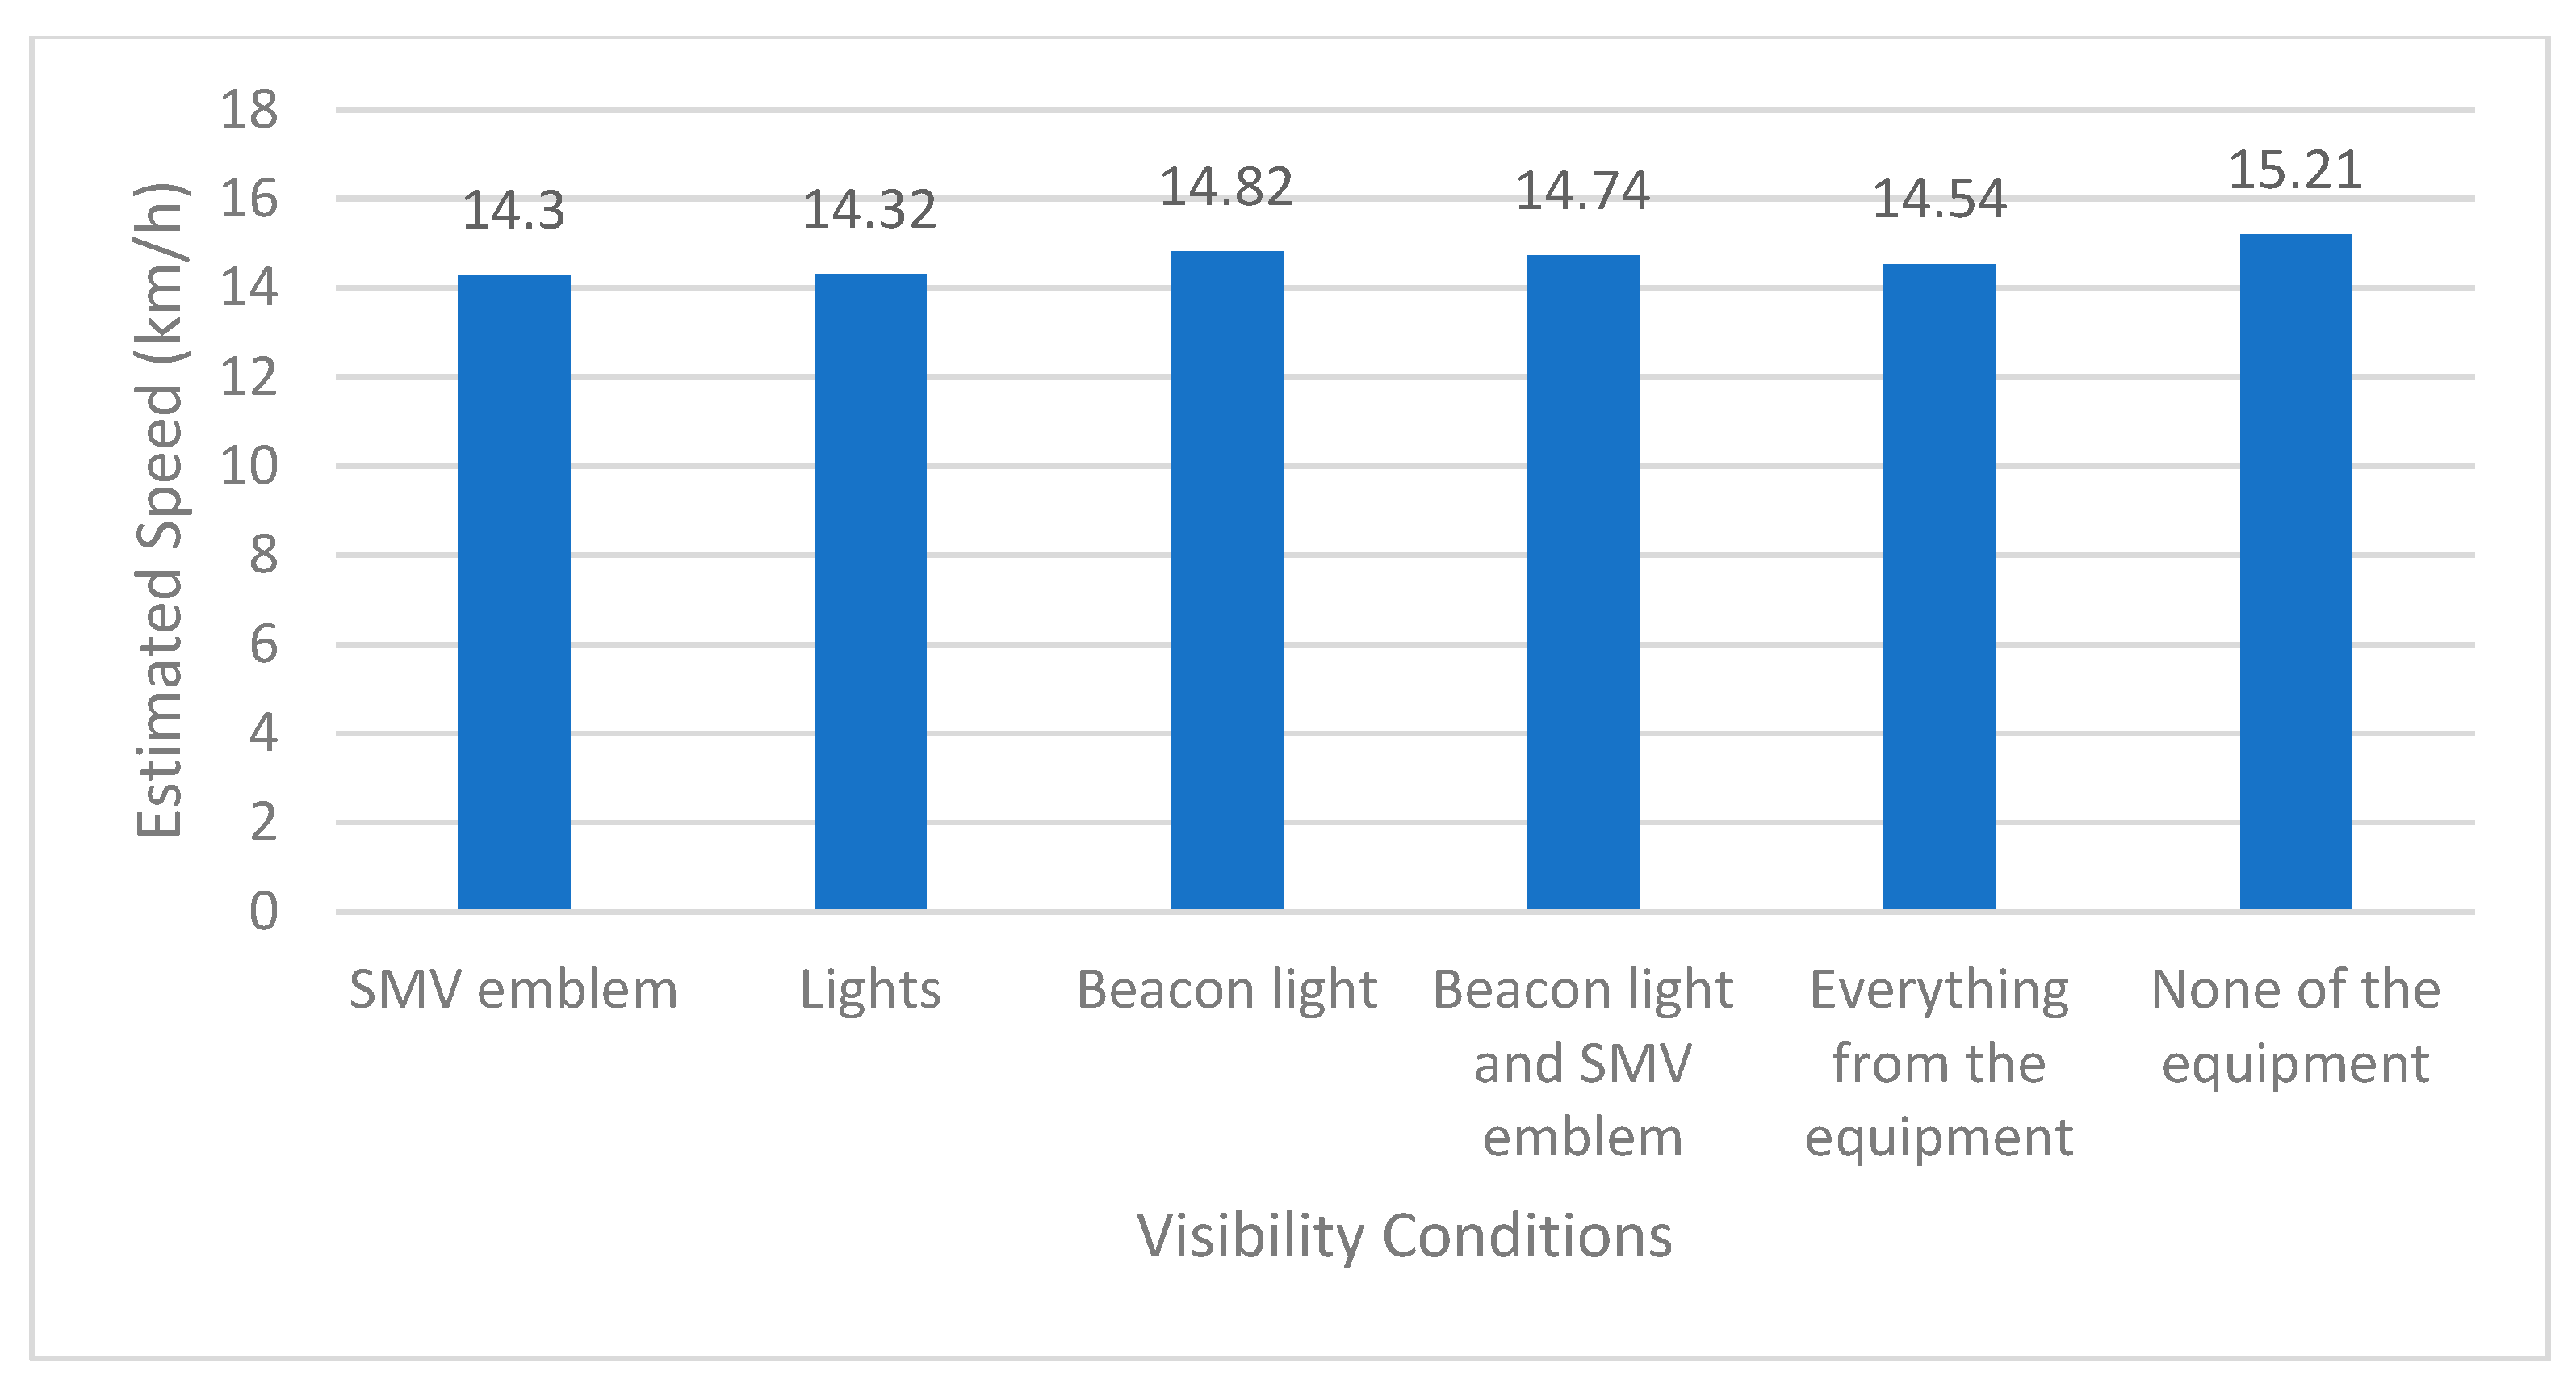
| 10 km/h | SMV emblem | 14.30 | 9.00 | 17.18 | 0.000 |
| Lights | 14.32 | 8.21 | 18.87 | 0.000 | |
| Beacon light | 14.82 | 9.47 | 16.92 | 0.000 | |
| Beacon light and SMV emblem | 14.74 | 10.11 | 15.77 | 0.000 | |
| Everything from the equipment | 14.54 | 10.41 | 15.10 | 0.000 | |
| None of the equipment | 15.21 | 10.08 | 16.32 | 0.000 | |
| 20 km/h | SMV emblem | 24.03 | 11.46 | 22.69 | 0.000 |
| Lights | 23.54 | 11.48 | 22.17 | 0.000 | |
| 20 km/h | Beacon light | 25.15 | 11.01 | 24.72 | 0.000 |
| Beacon light and SMV emblem | 24.88 | 10.34 | 26.04 | 0.000 | |
| Everything from the equipment | 22.42 | 10.22 | 23.74 | 0.000 | |
| None of the equipment | 24.19 | 11.52 | 22.72 | 0.000 |
| Speed | Conditions | Gender | Mean | Std. Deviation | t | p | Eta Square | Magnitude of Impacts |
|---|---|---|---|---|---|---|---|---|
| 10 km/h | SMV emblem Lights | Man | 11.687 | 5.721 | −3.525 | 0.001 | 0.097 | Large |
| Woman | 17.800 | 11.223 | ||||||
| Beacon light | Man | 11.701 | 5.681 | −3.980 | 0.000 | 0.121 | Large | |
| Woman | 17.820 | 9.701 | ||||||
| SMV emblem Lights | Man | 11.836 | 6.273 | −3.900 | 0.000 | 0.117 | Large | |
| Woman | 18.820 | 11.444 | ||||||
| Beacon light | Man | 12.030 | 8.730 | −3.407 | 0.001 | 0.091 | Large | |
| Woman | 18.360 | 10.757 | ||||||
| Everything from the equipment | Man | 11.761 | 7.768 | −3.284 | 0.002 | 0.086 | Large | |
| Woman | 18.260 | 12.279 | ||||||
| None of the equipment | Man | 12.687 | 7.097 | −3.024 | 0.003 | 0.074 | Moderate | |
| Woman | 18.580 | 12.342 | ||||||
| 20 km/h | SMV emblem Lights | Man | 21.537 | 8.418 | −2.622 | 0.011 | 0.056 | Moderate |
| Woman | 27.380 | 13.975 | ||||||
| Beacon light | Man | 21.104 | 9.154 | −2.584 | 0.012 | 0.054 | Moderate | |
| Woman | 26.800 | 13.430 | ||||||
| SMV emblem Lights | Man | 21.940 | 8.978 | −3.711 | 0.000 | 0.107 | Large | |
| Woman | 29.460 | 12.048 | ||||||
| Beacon light | Man | 21.896 | 7.945 | −3.617 | 0.001 | 0.102 | Large | |
| Woman | 28.880 | 11.804 | ||||||
| Everything from the equipment | Man | 19.851 | 8.576 | −3.152 | 0.002 | 0.079 | Moderate | |
| Woman | 25.860 | 11.265 | ||||||
| None of the equipment | Man | 21.731 | 9.398 | −2.615 | 0.011 | 0.056 | Moderate | |
| Woman | 27.480 | 13.253 |
Disclaimer/Publisher’s Note: The statements, opinions and data contained in all publications are solely those of the individual author(s) and contributor(s) and not of MDPI and/or the editor(s). MDPI and/or the editor(s) disclaim responsibility for any injury to people or property resulting from any ideas, methods, instructions or products referred to in the content. |
© 2025 by the authors. Licensee MDPI, Basel, Switzerland. This article is an open access article distributed under the terms and conditions of the Creative Commons Attribution (CC BY) license (https://creativecommons.org/licenses/by/4.0/).
Share and Cite
Simović, S.; Trifunović, A.; Ivanišević, T.; Lukoševičius, V.; Neduzha, L. Assessing Tractors’ Active Safety in Serbia: A Driving Simulator Study. Sustainability 2025, 17, 6144. https://doi.org/10.3390/su17136144
Simović S, Trifunović A, Ivanišević T, Lukoševičius V, Neduzha L. Assessing Tractors’ Active Safety in Serbia: A Driving Simulator Study. Sustainability. 2025; 17(13):6144. https://doi.org/10.3390/su17136144
Chicago/Turabian StyleSimović, Sreten, Aleksandar Trifunović, Tijana Ivanišević, Vaidas Lukoševičius, and Larysa Neduzha. 2025. "Assessing Tractors’ Active Safety in Serbia: A Driving Simulator Study" Sustainability 17, no. 13: 6144. https://doi.org/10.3390/su17136144
APA StyleSimović, S., Trifunović, A., Ivanišević, T., Lukoševičius, V., & Neduzha, L. (2025). Assessing Tractors’ Active Safety in Serbia: A Driving Simulator Study. Sustainability, 17(13), 6144. https://doi.org/10.3390/su17136144