Article

Spatiotemporal Evolution and Causality Analysis of the Coupling Coordination of Multiple Functions of Cultivated Land in the Yangtze River Economic Belt, China

1
College of Geographic Science, Qinghai Normal University, Xining 810008, China
2
Key Laboratory of Tibetan Plateau Land Surface Processes and Ecological Conservation (Ministry of Education), Qinghai Normal University, Xining 810008, China
3
Qinghai Province Key Laboratory of Physical Geography and Environmental Process, Qinghai Normal University, Xining 810008, China
4
School of Geographical Sciences, China West Normal University, Nanchong 637009, China
*
Author to whom correspondence should be addressed.
Sustainability 2025, 17(13), 6134; https://doi.org/10.3390/su17136134
Submission received: 28 May 2025 / Revised: 28 June 2025 / Accepted: 2 July 2025 / Published: 4 July 2025
(This article belongs to the Section Sustainability in Geographic Science)

Abstract

The evolutionary patterns and influencing factors of the coupling coordination among multiple functions of cultivated land serve as an important basis for emphasizing the value of cultivated land utilization and promoting coordinated regional development. The entropy weight TOPSIS model, coupling coordination degree (CCD) model, spatial autocorrelation analysis, and Geodetector were employed in this study along with panel data from 125 cities in the Yangtze River Economic Belt (YREB) for 2010, 2015, 2020, and 2022. Three key aspects in the region were investigated: the spatiotemporal evolution of cultivated land functions, characteristics of coupling coordination, and their underlying influencing factors. The results show the following: (1) The functions of cultivated land for food production, social support, and ecological maintenance are within the ranges of [0.023, 0.460], [0.071, 0.451], and [0.134, 0.836], respectively. The grain production function (GPF) shows a continuous increase, the social carrying function (SCF) first decreases and then increases, and the ecological maintenance function (EMF) first increases and then decreases. Spatially, these functions exhibit non-equilibrium characteristics: the grain production function is higher in the central and eastern regions and lower in the western region; the social support function is higher in the eastern and western regions and lower in the central region; and the ecological maintenance function is higher in the central and eastern regions and lower in the western region. (2) The coupling coordination degree of multiple functions of cultivated land is within the range of [0.158, 0.907], forming a spatial pattern where the eastern region takes the lead, the central region is rising, and the western region is catching up. (3) Moran’s I index increased from 0.376 in 2010 to 0.437 in 2022, indicating that the spatial agglomeration of the cultivated land multifunctionality coupling coordination degree has been continuously strengthening over time. (4) The spatial evolution of the coupling coordination of cultivated land multifunctionality is mainly influenced by the average elevation and average slope. However, the explanatory power of socioeconomic factors is continuously increasing. Interaction detection reveals characteristics of nonlinear enhancement or double-factor enhancement. The research results enrich the study of cultivated land multifunctionality and provide a decision-making basis for implementing the differentiated management of cultivated land resources and promoting mutual enhancement among different functions of cultivated land.

1. Introduction

Cultivated land is an essential agricultural production input and is key to ensuring food security and promoting economic development. It is also necessary for maintaining social stability and supporting ecological security [1,2,3,4,5]. However, global food security faces severe challenges with the development of the national economy and society and the advancement of industrialization and urbanization. These challenges are compounded by multiple factors, such as global political and economic instability and regional military conflicts [6,7,8]. Moreover, the utilization of global cultivated land resources currently involves many obstacles, including competition for cultivated land, the increasing marginalization of cultivated land, the continuous degradation of cultivated land ecosystems, and the increasing scarcity of cultivated land resources [9,10,11,12]. These issues severely hinder the sustainable development of society and the economy. The traditional and single-function management model of cultivated land production is not suitable for the current diversified utilization of cultivated land [1,2,13,14]. The multifunctional utilization of cultivated land has become a rational direction [5,15] with the additional objectives of promoting socioeconomic development, ensuring food security, and enhancing ecological stability [16,17,18]. Against this backdrop, exploring the coordinated development of cultivated land multifunctionality is not only in line with socioeconomic development, but is also an essential approach to resolving conflicts of multiple interests, strengthening food security, and consolidating cultivated land protection.
The study of the functions of cultivated land initially originated in the agricultural sector [19,20,21,22]. In 2001, the Organisation for Economic Co-operation and Development (OECD) defined the multifunctionality of agriculture as involving food production, landscape maintenance, ecological protection, and rural employment security, etc. [13,20]. The study of multifunctionality gradually expanded from the agricultural field to areas such as ecological assessment, landscape management [19,23], and land use change, and has given rise to concepts such as landscape multifunctionality and land multifunctionality. Cultivated land [24] gradually gained attention for its multifunctionality. In reviewing domestic and international research, foreign scholars primarily focused on assessing sustainability regarding land multifunctionality. The most representative example is the sustainability impact assessment tools (SIAT) model developed as part of the SENSOR project [24]. Research on cultivated land multifunctionality mainly concentrates on the connotation of cultivated land multifunctionality [25,26], the construction of indicator systems [27,28], and functional evaluation [29]. In the national context, Chinese scholars argue that the functions of cultivated land stem from the diversity of regional development goals, social demands, and land use suitability [1,3,4,30]. They also highlight that cultivated land serves multiple purposes, including economic contribution, food production, social security, and ecological services [31]. Regarding research content, scholars have different understandings of the functions of cultivated land. However, the leading research focuses include classifying cultivated land functions [2,32], household utilization of cultivated land [33], and the trade-offs and synergies among cultivated land functions. Additionally, scholars constructed indicator systems to quantify and evaluate these functions at different levels. Research-scale studies have primarily been conducted at the national [15,22], provincial [34], and typical regional levels [11,12]. Regarding research methods, there has been a shift from early theoretical and qualitative analyses to a combination of qualitative and quantitative approaches. Evaluation methods include entropy-based comprehensive evaluation [35] and the permutation polygon method [34]. Spatial analysis methods for exploring the relationships between cultivated land functions mainly involve spatial autocorrelation [36] and triangular coordinate diagram analysis [14]. Differentiated management policies have been proposed based on these findings.
Admittedly, the existing research achievements are quite substantial and laid a solid foundation for a comprehensive understanding of the multifunctionality of cultivated land. However, aspects of this field still urgently need further exploration. On the one hand, in terms of research content, current studies mainly focus on the spatiotemporal differentiation characteristics and trade-offs/synergies of cultivated land multifunctionality. The research conclusions also show distinct regional features. There is a lack of studies on the coupling coordination and influencing factors of cultivated land multifunctionality in national strategic regions. In particular, there is a need for the quantitative identification of spatiotemporal changes in the coupling coordination of cultivated land multifunctionality, qualitative classification of these changes, and diagnosis of key areas for future improvement. On the other hand, in terms of research scale, studies are primarily concentrated in the national, provincial, or economically developed regions, while related research in national key population-bearing areas and industrial agglomeration zones is relatively lacking. The innovation of this study lies in the selection of 125 cities in the Yangtze River Economic Belt as the study area. This work offers a more representative and unique geographical perspective than most domestic studies on small regions or provinces or foreign studies on national or specific river basin scales. It offers a better analysis of regional differences among cities in national key strategic areas. Furthermore, the evaluation index system developed in this study based on farmland endowment characteristics and encompassing food production, social support, and ecological functions, along with exploratory spatial analysis tools, is rare in similar studies. It provides a solid scientific basis for targeted policymaking. This enriches the cultivated land function assessment and provides new ideas and a basis for cultivated land evaluation in other fields.
The YREB spans East, Central, and Western China, covering 11 provinces and municipalities, accounting for 21.4% of the nation’s area and over 40% and 45% of the national population and economic output, respectively. As a key driver of high-quality economic development, it plays a crucial linking role in building a new development pattern. It has notable socioeconomic features, such as a large population, rapid urbanization, diverse industries, and close regional cooperation. These factors have a profound and unique impact on the multifunctional coupling and coordination of farmland. On the one hand, urbanization reduces the area of cropland and high-quality farmland, thereby weakening its economic production function. On the other hand, the dense population increases the demand for farmland’s ecological service function. Farmland also serves the social and cultural function of preserving and passing on farming culture. These three aspects are interwoven, forming a complex coupling and coordination relationship. In light of this, an evaluation index system for cultivated land multifunctionality was developed in this study from a three-dimensional perspective of “grain production–social support–ecological maintenance.” The multifunctionality of cultivated land was empirically explored in this work by utilizing panel data from 125 cities in the YREB from 2010 to 2022. The development levels of individual functions of cultivated land were quantitatively assessed, their spatiotemporal evolution characteristics were revealed, the types and spatial agglomeration characteristics of the coupling coordination of cultivated land multifunctionality were identified, and the factors influencing spatial differentiation were examined. This study can offer a basis for formulating precise farmland resource management policies in the region. The policy recommendations would help balance economic development needs with the maintenance of farmland’s ecological and sociocultural functions, promoting sustainable regional development. The research results also provide an important reference for other similar areas.

2. Materials and Methods
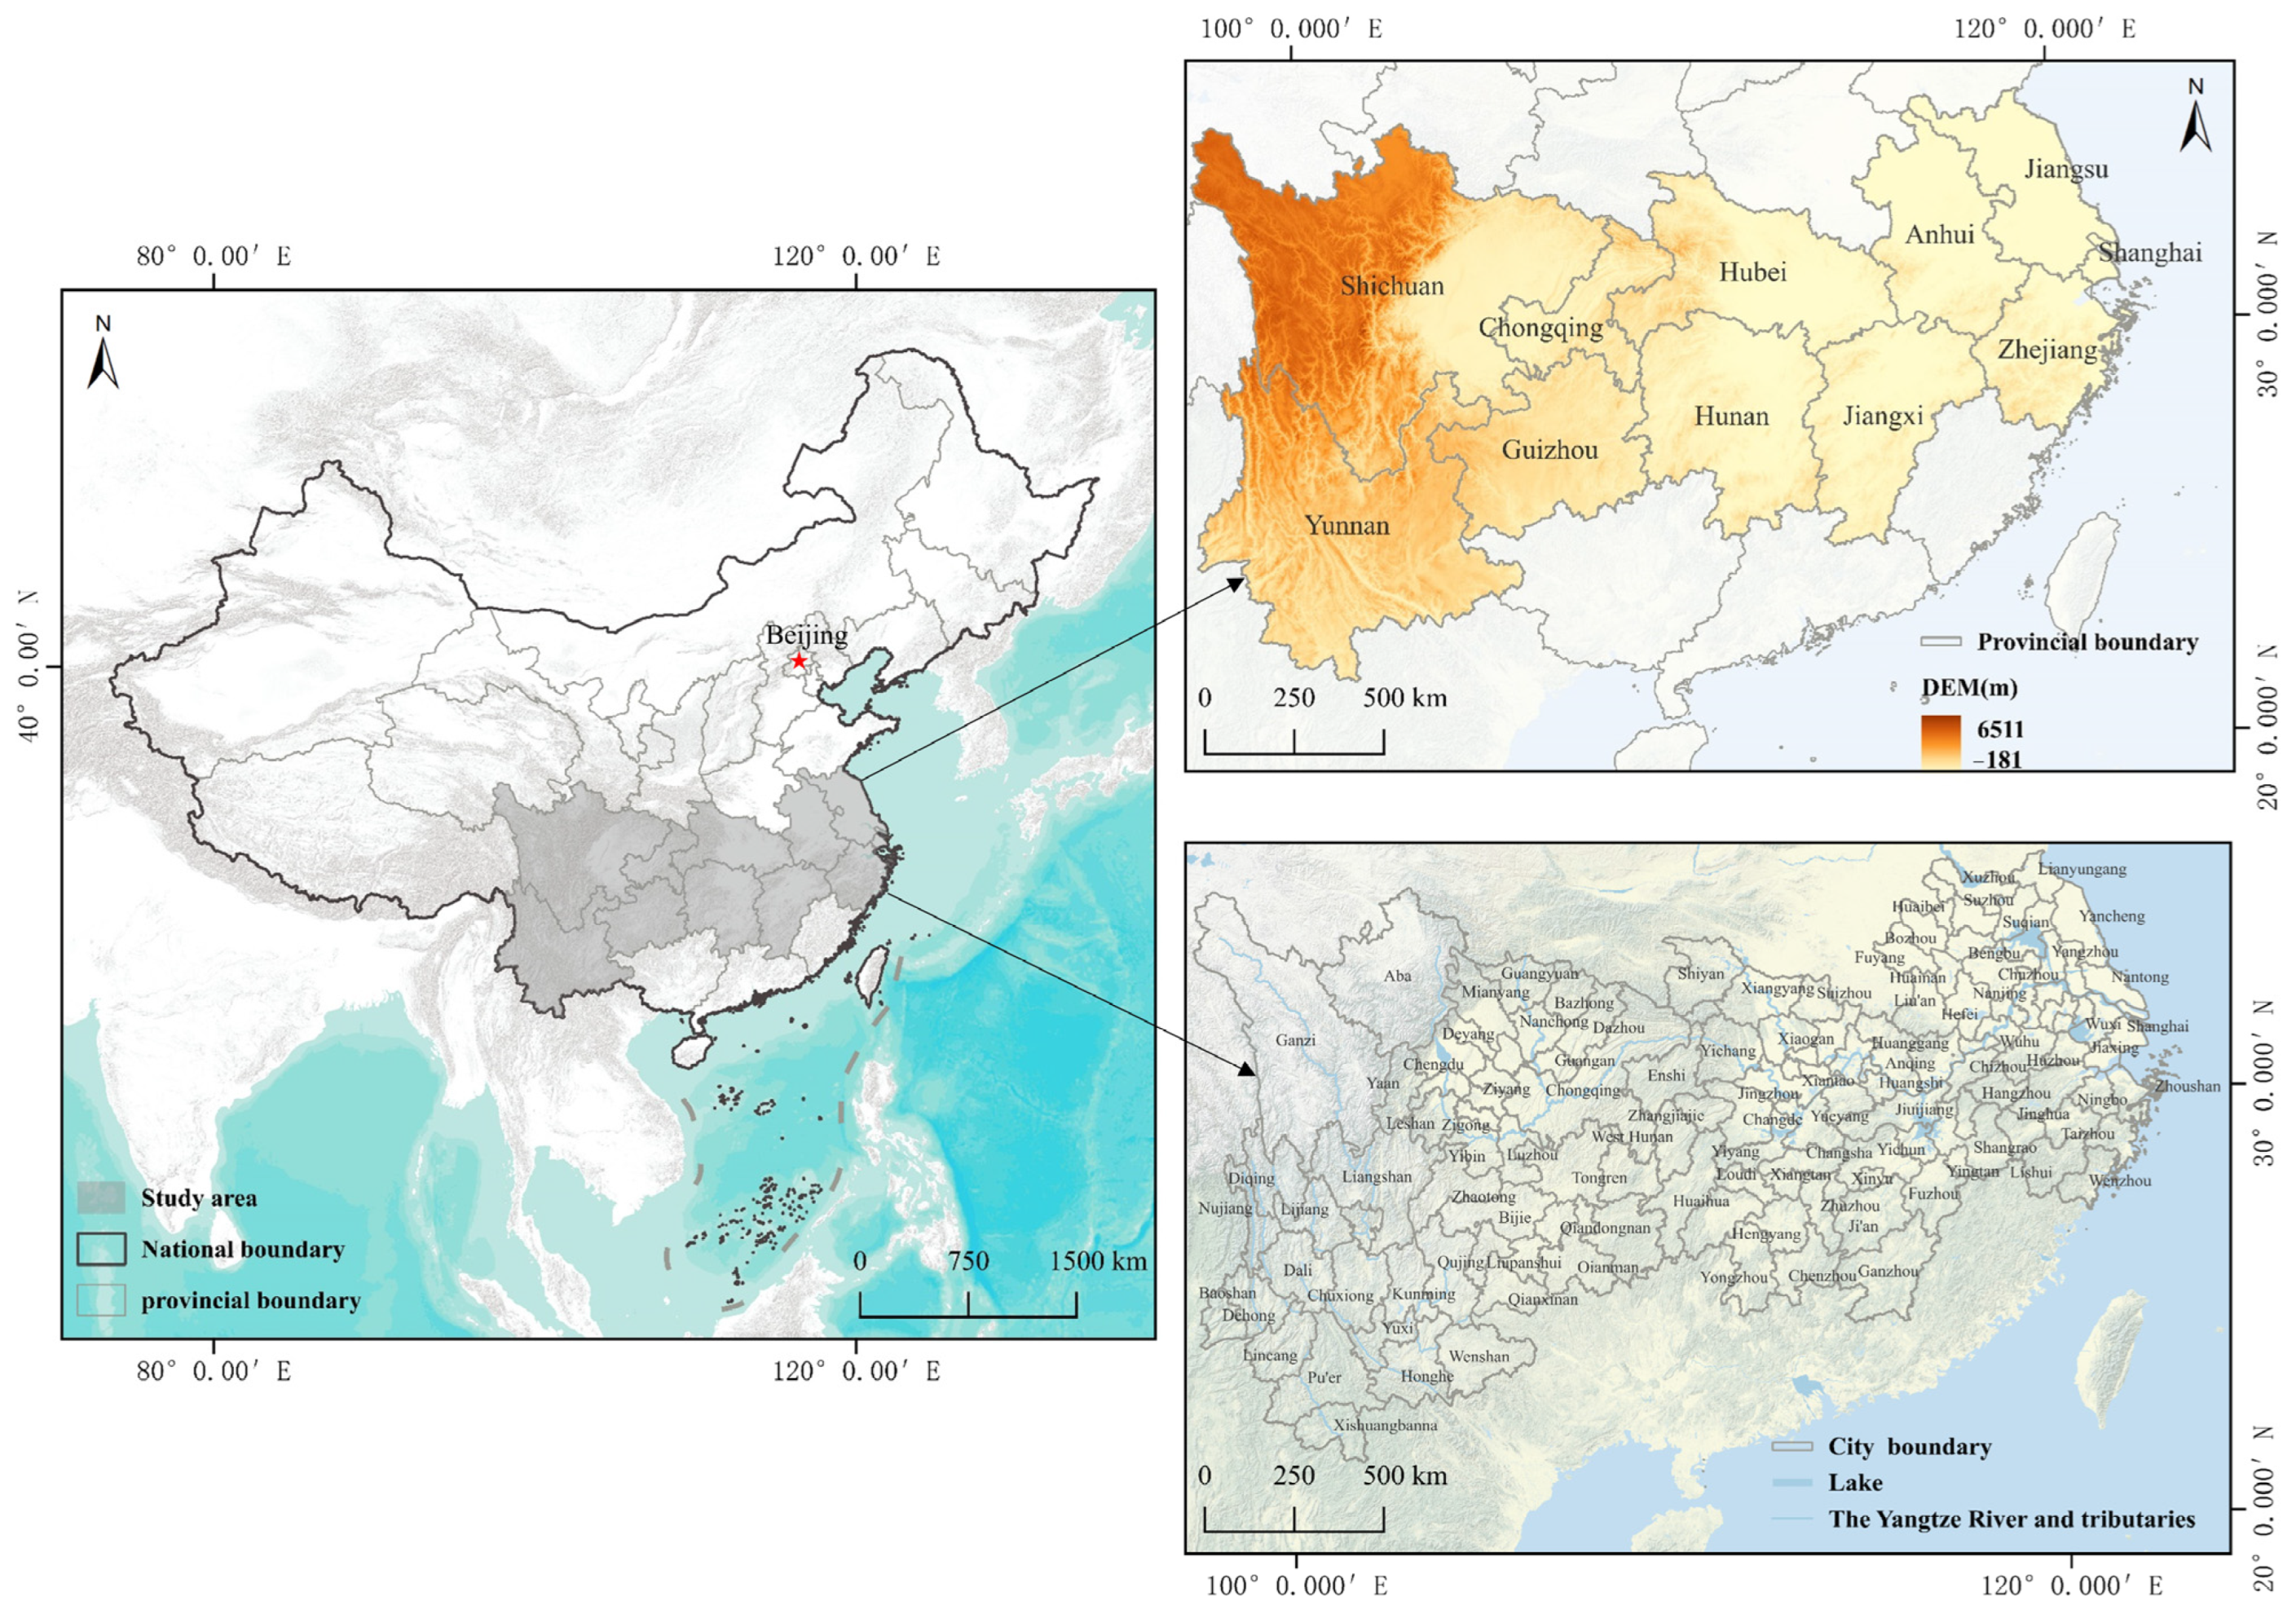
2.1. Study Area

The YREB spans Eastern, Central, and Western China. The Yangtze River Basin’s upper reaches include four provincial-level regions: Yunnan Province, Guizhou Province, Sichuan Province, and Chongqing Municipality. The middle reaches comprise Hunan Province, Hubei Province, and Jiangxi Province. The lower reaches consist of Shanghai Municipality, Zhejiang Province, Jiangsu Province, and Anhui Province (Figure 1). Agriculture is a vital pillar of the YREB. It plays a crucial role in ensuring China’s food security and is an important region for population concentration and industrial agglomeration. The region’s total land area is 205.23 km2, accounting for 21.4% of China’s land area. By the end of 2022, the cultivated land area in the region was 37.15 km2, representing 29.11% of China’s total cultivated land area. Despite having less than one-third of the country’s cultivated land, the region supports 43.72% of China’s permanent resident population, highlighting a significant contradiction between population and land resources. However, with the advancement of urbanization and industrialization, total grain output in the region decreased, and the scarcity of arable land resources has become more pronounced. In this context, maximizing the various functions of cultivated land is increasingly urgent.

2.2. Data Resource

The data used in this study mainly include socioeconomic, land use, natural environment, and geographical spatial data. Among these, the socioeconomic data are derived from the statistical yearbooks of the 125 cities in the Yangtze River Economic Belt, the statistical yearbooks of each city, the statistical bulletins on the national economic and social development of each city, and the China Rural Statistical Yearbook (http://www.tjcn.org/tjnj/23sc/, accessed on 27 May 2025). The data on arable land and construction land are sourced from the National Land Survey Sharing and Application Platform (https://gtdc.mnr.gov.cn/Share#/, accessed on 27 May 2025). The DEM data are sourced from the Geo-Spatial Data Cloud Platform (http://www.gscloud.cn/, accessed on 27 May 2025) and have a spatial resolution of 30 m. Both the mean slope and mean elevation were processed using ArcGIS 10.8. The data on provincial boundaries, the administrative boundaries of cities, and other rivers and lakes in the Yangtze River Economic Belt are sourced from the National Geomatics Center of China (http://www.gscloud.cn/). The annual average temperature and precipitation data are from the United States National Climatic Data Center (https://www.noaa.gov/, accessed on 27 May 2025). It should be noted that the Yangtze River Economic Belt covers a total of 130 cities (including two municipalities directly under the central government). However, the study units did not include the five regions of Enshi, Xiantao, Qianjiang, Tianmen City, and Shennongjia in Hubei Province due to significant data shortages. The study cities are also based on the administrative boundaries as of 2022; Chao Lake City of Anhui Province was divided into one district and four counties in 2011, which were assigned to the cities of Hefei, Wuhu, and Maanshan. Therefore, the relevant data for Chao Lake City were merged with the data for Hefei, Wuhu, and Maanshan based on the land area of the assigned administrative regions to ensure the unity of the research units.

2.3. Research Framework

The spatiotemporal characteristics, coupling coordination, and influencing factors of the multiple functions of cultivated land in 125 cities in the YREB were explored in this study using panel data for 2010, 2015, 2020, and 2022. The research framework is as follows (Figure 2):
(1) A database of elements, including socioeconomic, cultivated land, construction land, natural environment, and geographical space, was constructed.
(2) Using the entropy weight TOPSIS model, the functional levels of cultivated land in terms of grain production, social support, and ecological maintenance were calculated from a three-dimensional perspective. The spatiotemporal evolution characteristics of these functions were then analyzed.
(3) The spatiotemporal evolution characteristics of the coupling and coordinated development of cultivated land multifunctionality were explored using the coupling coordination degree model. The trends in the coupling and coordinated development of cultivated land multifunctionality in different cities were classified based on the development levels.
(4) The spatial agglomeration characteristics of the coupling coordination degree of cultivated land multifunctionality in the Yangtze River Economic Belt were identified by combining exploratory spatial analysis tools.
(5) Using the Geodetector method, the spatial differentiation of the coupling coordination degree of cultivated land multifunctionality and its influencing factors were explored.

2.4. Research Methods

2.4.1. Construction of the Indicator System

Cultivated land directly and indirectly provides products to humans and has multiple functions, including supporting socioeconomic development and maintaining ecological balance [4]. The functions of cultivated land were categorized into GPF, SCF, and EMF (Table 1) in this study by drawing on existing studies [1,2,3,6] and considering the actual situation of the YREB. The classification in this study aligns with the core functions of the OECD framework, where the GPF corresponds to “food provisioning,” the SCF corresponds to “rural employment security,” and the EMF corresponds to “ecosystem conservation.” Meanwhile, the framework of the Food and Agriculture Organization of the United Nations (FAO) demonstrates a high degree of consistency with this study, encompassing three critical dimensions: food production, social carrying capacity, and ecological sustainability. The GPF of cultivated land is primarily measured from the perspectives of food output levels, agricultural production intensity, and cultivated land utilization intensity. Five indicators were selected for this purpose: the yield of grain, vegetables, and oil crops; cropping index; and land reclamation rate. Among them, the crop yield directly reflects the output level of arable land key to basic living requirements in these areas. The multiple cropping index demonstrates the intensity of cultivated land use over time. A higher multiple cropping index means that arable land can produce a variety of crops more efficiently. The land reclamation rate reflects the degree of development of cultivated land resources. The higher the reclamation rate, the more arable land resources are available in a region, which can macroscopically indicate the region’s potential to support grain production. The SCF of cultivated land is mainly measured from the perspectives of ensuring the basic living needs of urban and rural residents, the capacity to absorb surplus rural labor, the income gap between urban and rural areas, and the contribution of cultivated land to economic development. Four indicators were selected for this purpose: per capita grain security rate, per capita cultivated land area, urban–rural per capita disposable income ratio, and the proportion of total agricultural output value. The per capita grain security rate directly reflects the degree to which cultivated land meets people’s basic food needs. The per capita cultivated land area determines the average amount of land resources allocated to each resident. When cultivated land is relatively abundant, it can better accommodate surplus rural labor and ensure that residents’ basic living needs are met. Comparing urban and rural incomes reveals the distinct roles of arable land in urban and rural economies as well as its contribution to the incomes of rural residents. The proportion of agricultural output value reflects the contribution of arable land-based agriculture to economic growth and its role in supporting employment and rural stability, indirectly showing the social security function of arable land. The EMF of cultivated land is reflected in its role in climate regulation, water source conservation, and soil and water retention. To measure this, four indexes were chosen: the degree of ecological advantage of cultivated land, the proportion of ecological land use, cultivated land fragmentation, and the chemical load on cultivated land. Cultivated land fragmentation shows the distribution of arable land. Highly concentrated and contiguous land is better for ecological services. The ecological dominance of cultivated land reveals its role in biodiversity and climate regulation, which facilitates the assessment of its ecological quality. The chemical load on cultivated land indicates the chemical pollution pressure during agricultural production and reflects the health of the ecological environment. An appropriate proportion of ecological land use can create a good ecological environment for cultivated land, maintaining its ecological balance and stability. The data on per capita grain security rate, which involve the grain yield and total population, are derived from the statistical yearbooks of various cities. Cultivated land fragmentation is based on cultivated land patch data extracted via ArcGIS from the 2020 land cover dataset provided by Wuhan University (https://doi.org/10.5281/zenodo.5816591) and total area of cultivated land data sourced from the National Land Survey Results Sharing Platform (https://gtdc.mnr.gov.cn/Share#/, accessed on 27 May 2025).

2.4.2. Entropy Weight TOPSIS Model

The entropy weight TOPSIS model, a multi-index decision-making analysis approach, integrates the entropy weight method and the TOPSIS method. It determines the weight of each index using the entropy weight method. Then, it employs TOPSIS to identify the optimal solution. The entropy weight method, based on information entropy, measures information uncertainty and randomness to evaluate the importance of indices. TOPSIS, a multi-index decision-making analysis tool, identifies the optimal and worst solutions from a normalized data matrix. It calculates the distance of each evaluation object to these solutions, assessing superiority based on their relative closeness to the optimal solution. A relative closeness near one indicates near optimality, while a relative closeness near zero suggests a near worst status; greater relative closeness means better evaluation results [37,38,39]. The functional levels of cultivated land in various cities along the YREB were empirically evaluated using the TOPSIS model [40,41,42,43,44] to calculate the indices of the GPF, SCF, and EMF of cultivated land.
Due to the inconsistent units of the raw data, the raw data were standardized using the range transformation method. The formulas are as follows:
Positive indicator processing:
x i j = x i j M I N x i j M A X x i j M I N x i j + 0.01 .
Negative indicator processing:
x i j = M A X x i j x i j M A X x i j M I N i j + 0.01 .
In the formula, x i j represents the normalized values of each indicator. The normalized indicator matrix X is obtained for the j indicator of the i evaluation object; that is, X = ( x i j ) m × n .
The information entropy Ej was calculated for each indicator.
E j = 1 l n n i = 1 n p i j × l n p i j
The characteristic proportion of the i evaluation object under the j indicator was calculated.
P i j = x i j i = 1 n x i j
The weight of the j indicator was determined.
w j = 1 E j i = 1 n ( 1 E j )
The weights of various indexes for each evaluation year were obtained through the above steps. Following the practice of previous scholars, the average value was calculated in this study by summing the weights of each index across all years, thus obtaining the index weights required. The weight matrix is W = ([w1, w2, …, wm]1T), …, ([w1, w2, …, wm]mT)nm.
The weighted decision matrix was constructed.
O = X × W = ( R i j ) n m
The positive ideal solution C + and the negative ideal solution C were constructed. Let the j attribute value of the positive ideal solution C + be C j + , and the jth attribute value of the negative ideal solution C be C j . The formulas are as follows:
Let the j attribute value of the positive ideal solution C + be C j + , and the j attribute value of the negative ideal solution C be C j .
C j + = M A X R i j 1 n n , j = 1 , 2 , m
C j = M I N R i j 1 n n , j = 1 , 2 , m
The Euclidean distances between each evaluation object and both the positive and negative ideal solutions were calculated.
U j + = j = 1 m ( R i j C j + ) 2 , i = 1 , 2 , n
U j = j = 1 m ( R i j C j ) 2 , i = 1 , 2 , n
The degree of closeness of each evaluation object to the ideal solution was calculated.
f i = U j U j + + U j , i = 1 , 2 , n
In the formula, f i represents the evaluation index of each function of the cultivated land, i = x, y, z; f x is the index of the GPF of the cultivated land; f y is the index of the SCF of the cultivated land; and f z is the index of the EMF of the cultivated land. The value range is [0, 1]. The closer the value is to 1, the higher the level of that function; the closer the value is to 0, the lower the level of that function.

2.4.3. CCD Model

In physics, coupling refers to the interdependence of two or more systems, with the coupling degree indicating the strength of their interaction. The coordination degree, on the other hand, describes the harmony of their activities. The coupling coordination degree model is a useful tool for analyzing the interplay among two or more systems. It reveals the extent of their interaction and reflects whether they are developing in harmony [1,45,46,47,48]. The entropy weight TOPSIS method calculates the indices of the GPF, SCF, and EMF of cultivated land. These indices are then empirically applied to evaluate the coordinated development level among the three systems. The formulas are as follows:
D = α f x + β f y + γ f z × f x × f y × f z f x + f y + f z 3 3 3   .
In the formula, D represents the coupling coordination degree of cultivated land multifunctionality; f(x) is the index of the GPF; and f(y) is the index of the SCF, and f(z) is the index of the EMF. The coefficients α, β, and λ are undetermined parameters, determined based on the entropy weight method. In this study, α = 0.54, β = 0.27, and λ = 0.19. In accordance with existing research [1,2,3], the coupling coordination degree was divided into the following standards (Table 2) to analyze the coordinated development of cultivated land multifunctionality.

2.4.4. Spatial Autocorrelation Model

Moran’s I index was employed to examine the spatial autocorrelation of element distribution. It can be used to identify clustered regions [49,50,51,52] and accurately reflect whether the spatial distribution of a particular attribute within a regional scope is correlated with its neighboring areas and the degree of such correlation [53,54]. The Global Moran’s I, based on ArcGIS 10.8 and GeoDA 1.22 software, was employed in this study to explore whether agglomeration or dispersion occurs in the coupling and coordinated development of cultivated land multifunctionality in the Yangtze River Economic Belt. The formula is as follows:
I g = n × i = 1 n j = 1 n ω i j ( x i x ¯ ) ( x j x ¯ ) i = 1 n j = 1 n ω i j i = 1 n ( x i x ¯ ) 2 .
In the formula, n is the number of cities in the study area; x i and x j are the observed values of the i and j units, respectively; x ¯ is the average value of all cities and states in the study area; and ω i j is the spatial weight matrix of the study units (the data basis of this study is the CCD of cultivated land multifunctionality in each city of the YREB, so the spatial weight matrix was constructed based on geographical adjacency). The range of I g is [−1, 1]. I g > 0, I g < 0, and I g = 0 indicate a positive correlation, negative correlation, and dispersed distribution, respectively.
The Global Moran’s I primarily reveals the distribution characteristics of the coupling and coordinated development of cultivated land multifunctionality in various cities along the Yangtze River Economic Belt. However, it does not demonstrate local spatial agglomeration or spatial differences. Therefore, it is necessary to utilize the local Moran’s I further to determine the spatial clustering characteristics of the high and low values of the coupling and coordinated development of cultivated land multifunctionality and clarify the regional spatial differences. The formula is as follows:
I l = ( x i x ¯ ) j = 1 n ω i j ( x j x ¯ ) 1 n × i = 1 n ( x i x ) 2 .
I l > 0 indicates that the i city or prefecture is slightly different from its surrounding neighboring regions, showing stronger homogeneity and agglomeration. Conversely, when I l < 0, the difference is more significant, and the homogeneity and agglomeration are weaker.

2.4.5. Geodetector

The multifunctionality of cultivated land, a result of the combined effects of natural geographical conditions and socioeconomic development, is a complex area of study. A comprehensive approach was taken in this study by identifying the main factors influencing the spatiotemporal evolution of the coupling coordination degree of cultivated land multifunctionality in the cities along the YREB. This approach is significant for achieving the optimal utilization and adequate protection of cultivated land. Building on existing studies [3,4,14,25,34], influencing factors from three dimensions were selected in this study: natural conditions, economic level, and social development (Table 3). Natural conditions serve as the prerequisites and foundation for the use of cultivated land, with four influencing factors selected: average slope (X1), average altitude (X2), annual average precipitation (X3), and annual average temperature (X4), for each city in the study area. The economic level drives the functionality of cultivated land, with three influencing factors chosen: per capita GDP (X5), the proportion of the added value of the primary industry in GDP (X6), and rural residents’ disposable income (X7). Social development ensures the effective functioning of cultivated land, with three influencing factors selected: agricultural comparative benefits (X8), the urbanization rate (X9), and total mechanical power per unit area of cultivated land (X10).
Geodetector comprises a set of statistical methods for detecting spatial differences and uncovering their driving forces [51,52]. We applied it in this study to analyze the spatial differentiation characteristics of the multi-functional coupling and coordination degree (dependent variable Y) of cities in the Yangtze River Economic Belt, with influencing factors as independent variable X. The q-statistic in factor detection quantifies the explanatory power of X on Y. The formula is as follows:
q = 1 1 n σ 2 d k n d σ d 2 .
In the formula, q ranges from [0 to 1]. A larger q indicates a stronger explanatory power of X over Y. d denotes the stratification of factor X and Y, where d = 1, 2, …, n d , and n represents the number of units in the study. σ d 2   and σ 2 are the variances in Y values in stratum d and the entire study area, respectively.
The interaction detector can assess the interaction between influencing factors by comparing the q-value of two combined factors with those of the original individual factors. This helps identify the type and strength of interactions between different influencing factors, which can be categorized into five types (Table 4).

3. Analysis of Results

3.1. Multifunctional Cultivated Land Evaluation

We obtained the single-function indices of cultivated land from 2010 to 2022 by employing the entropy weight TOPSIS model and analyzed their temporal change trends. Using the natural breaks method, we categorized these indices into four levels (lowest, lower, higher, and highest) for 2010, 2015, 2020, and 2022 to illustrate the evolution of spatial patterns.

3.1.1. GPF Evaluation

From 2010 to 2022, the FPF of cultivated land in the Yangtze River Economic Belt rose steadily, with its average annual value climbing from 0.190 in 2010 to 0.215 in 2022. Despite this progress, there is still room for a 78.5% improvement. This primarily stems from national and local-level agricultural subsidy policies, including direct grain subsidies, comprehensive agrarian production and materials subsidies, and subsidies for farm machinery purchases. These policies increased farmers’ enthusiasm for grain growing, reduced agricultural production costs, improved grain production efficiency, and thereby enhanced the GPF. The standard deviation and coefficient of variation for this function across cities changed from 0.070 and 0.369 in 2010 to 0.079 and 0.366 in 2022. This suggests the absolute disparity in the GPF index among cities expanded, while the relative gap shrank.
In the YREB, the GPF of cultivated land ranged from [0.023 to 0.460] during the study period. Higher and highest-level areas were concentrated in the northern part of the lower Yangtze River and gradually extended to the Jianghan and Chengdu Plains. Lower-level regions transitioned from a scattered distribution to a concentration in Yunnan Province and the western Sichuan Plateau, forming a “high in the central and eastern regions, low in the west” spatial pattern (Figure 3). In 2010, areas with higher and highest levels of farmland FPF were primarily found in eastern Jiangsu Province and northern Anhui Province. This concentration resulted from the flat terrain, ample water supply, and well-developed agricultural infrastructure that supports farming. From 2015 to 2022, the number of cities with the low and lowest levels of this function decreased, while those with high and relatively high levels increased. Areas with high and relatively high levels gradually became growth poles in the Huang-Huai-Hai Plain region of eastern Jiangsu Province and northern Anhui Province, the Jianghan Plain, and the Chengdu Plain. In contrast, low-level areas were situated in Yunnan Province and the western Sichuan Plateau, where poor farming conditions and severe farmland fragmentation limited the GPF.

3.1.2. SCF Evaluation

From 2010 to 2022, the SCF of cultivated land in the Yangtze River Economic Belt first declined and then rose. Its average annual value decreased from 0.271 in 2010 to 0.264 in 2020, then slightly increased to 0.265 in 2022. This is mainly due to the rural revitalization strategy. Greater financial support for rural areas improved infrastructure and public services, thereby boosting the rural economy and farmers’ incomes and enhancing the SCF. During this period, the standard deviation and coefficient of variation both decreased, from 0.071 and 0.263 in 2010 to 0.060 and 0.226 in 2022, indicating that the disparities in the social security function index of farmland among cities narrowed.
In the YREB, the SCF of cultivated land ranged from [0.071 to 0.451] during the study period. High-level and relatively high-level areas created a “W”-shaped contiguous distribution in the region, gradually extending to the east and west. Relatively low-level areas concentrated in the middle Yangtze River region resulted in an overall spatial imbalance pattern of “high in the east and west, low in the center” (Figure 4). In 2010, high-level and relatively high-level SCF farmland areas were scattered and concentrated, forming a “W”-shaped contiguous distribution. From 2015 to 2022, these areas expanded into the western Sichuan Plateau, the Yunnan–Guizhou Plateau, western Hunan, and the lower reaches of the Yangtze River. This expansion was primarily due to the implementation of national poverty alleviation and rural revitalization strategies, which spurred the rapid development of rural poverty alleviation industries, increased the benefits of cash crop cultivation in western regions, and enhanced the contribution of agricultural output to GDP, thereby improving the social carrying function of farmland. Additionally, the high social and economic development level, along with a strong agricultural foundation in the eastern regions, contributed to the SCF of their farmland. In contrast, relatively low-level areas clustered in the central regions of the study area, including the provinces of Jiangxi, Hunan, Hubei, and Anhui. These major grain-producing areas significantly contribute to stable grain production and supply. However, the advancement of urbanization and industrialization led to adjustments in industrial structure and a decrease in per capita arable land area, hindering the improvement of farmland’s SCF.

3.1.3. EMF Evaluation

From 2010 to 2022, the EMF of cultivated land in the YREB first increased and then decreased, with the average annual value declining from 0.479 in 2010 to 0.457 in 2022. As agricultural production becomes increasingly large-scale and intensive, the use of agricultural chemicals, such as fertilizers and pesticides, has risen. Their non-point source pollution increasingly harms farmland ecosystems. Meanwhile, rapid urbanization and urban expansion consumed a large amount of ecological land, indirectly weakening the EMF. During this period, both the standard deviation and coefficient of variation increased, rising from 0.134 and 0.279 in 2010 to 0.135 and 0.295 in 2022. This indicates that the disparities in the ecological maintenance function index of farmland among cities widened.
In the YREB, the EMF of cultivated land ranged from 0.134 to 0.836 during the study period. High-level and relatively high-level areas were consistently concentrated in the middle and lower reaches of the Yangtze River Plain. In contrast, low-level and relatively low-level areas were found in regions such as the western Sichuan Plateau and the Yunnan–Guizhou Plateau, creating a general spatial pattern of “high in the central and eastern regions, low in the west” (Figure 5). From 2010 to 2022, the number of cities with low and relatively low levels of farmland EMF in the YREB increased, while areas with high and relatively high levels decreased. The high-level and relatively high-level regions were concentrated in the middle and lower reaches of the Yangtze River, where the terrain is flat, cultivated land is contiguous, and paddy and dry land distribution is relatively even, supporting the ecological functions of paddy fields. After 2015, the low-level areas became concentrated in the western Sichuan and Yunnan–Guizhou Plateaus. This is primarily due to the cultivated land structure in these regions being dominated by dry land, with limited paddy areas, resulting in low ecological advantages for cultivated land types. Furthermore, the region’s rugged terrain, steep slopes, and severe stone desertification led to fragmented farmland, which hinders the ecological functions of cultivated land.

3.2. Temporal and Spatial Characteristics of Cultivated Land Multifunctional CCD

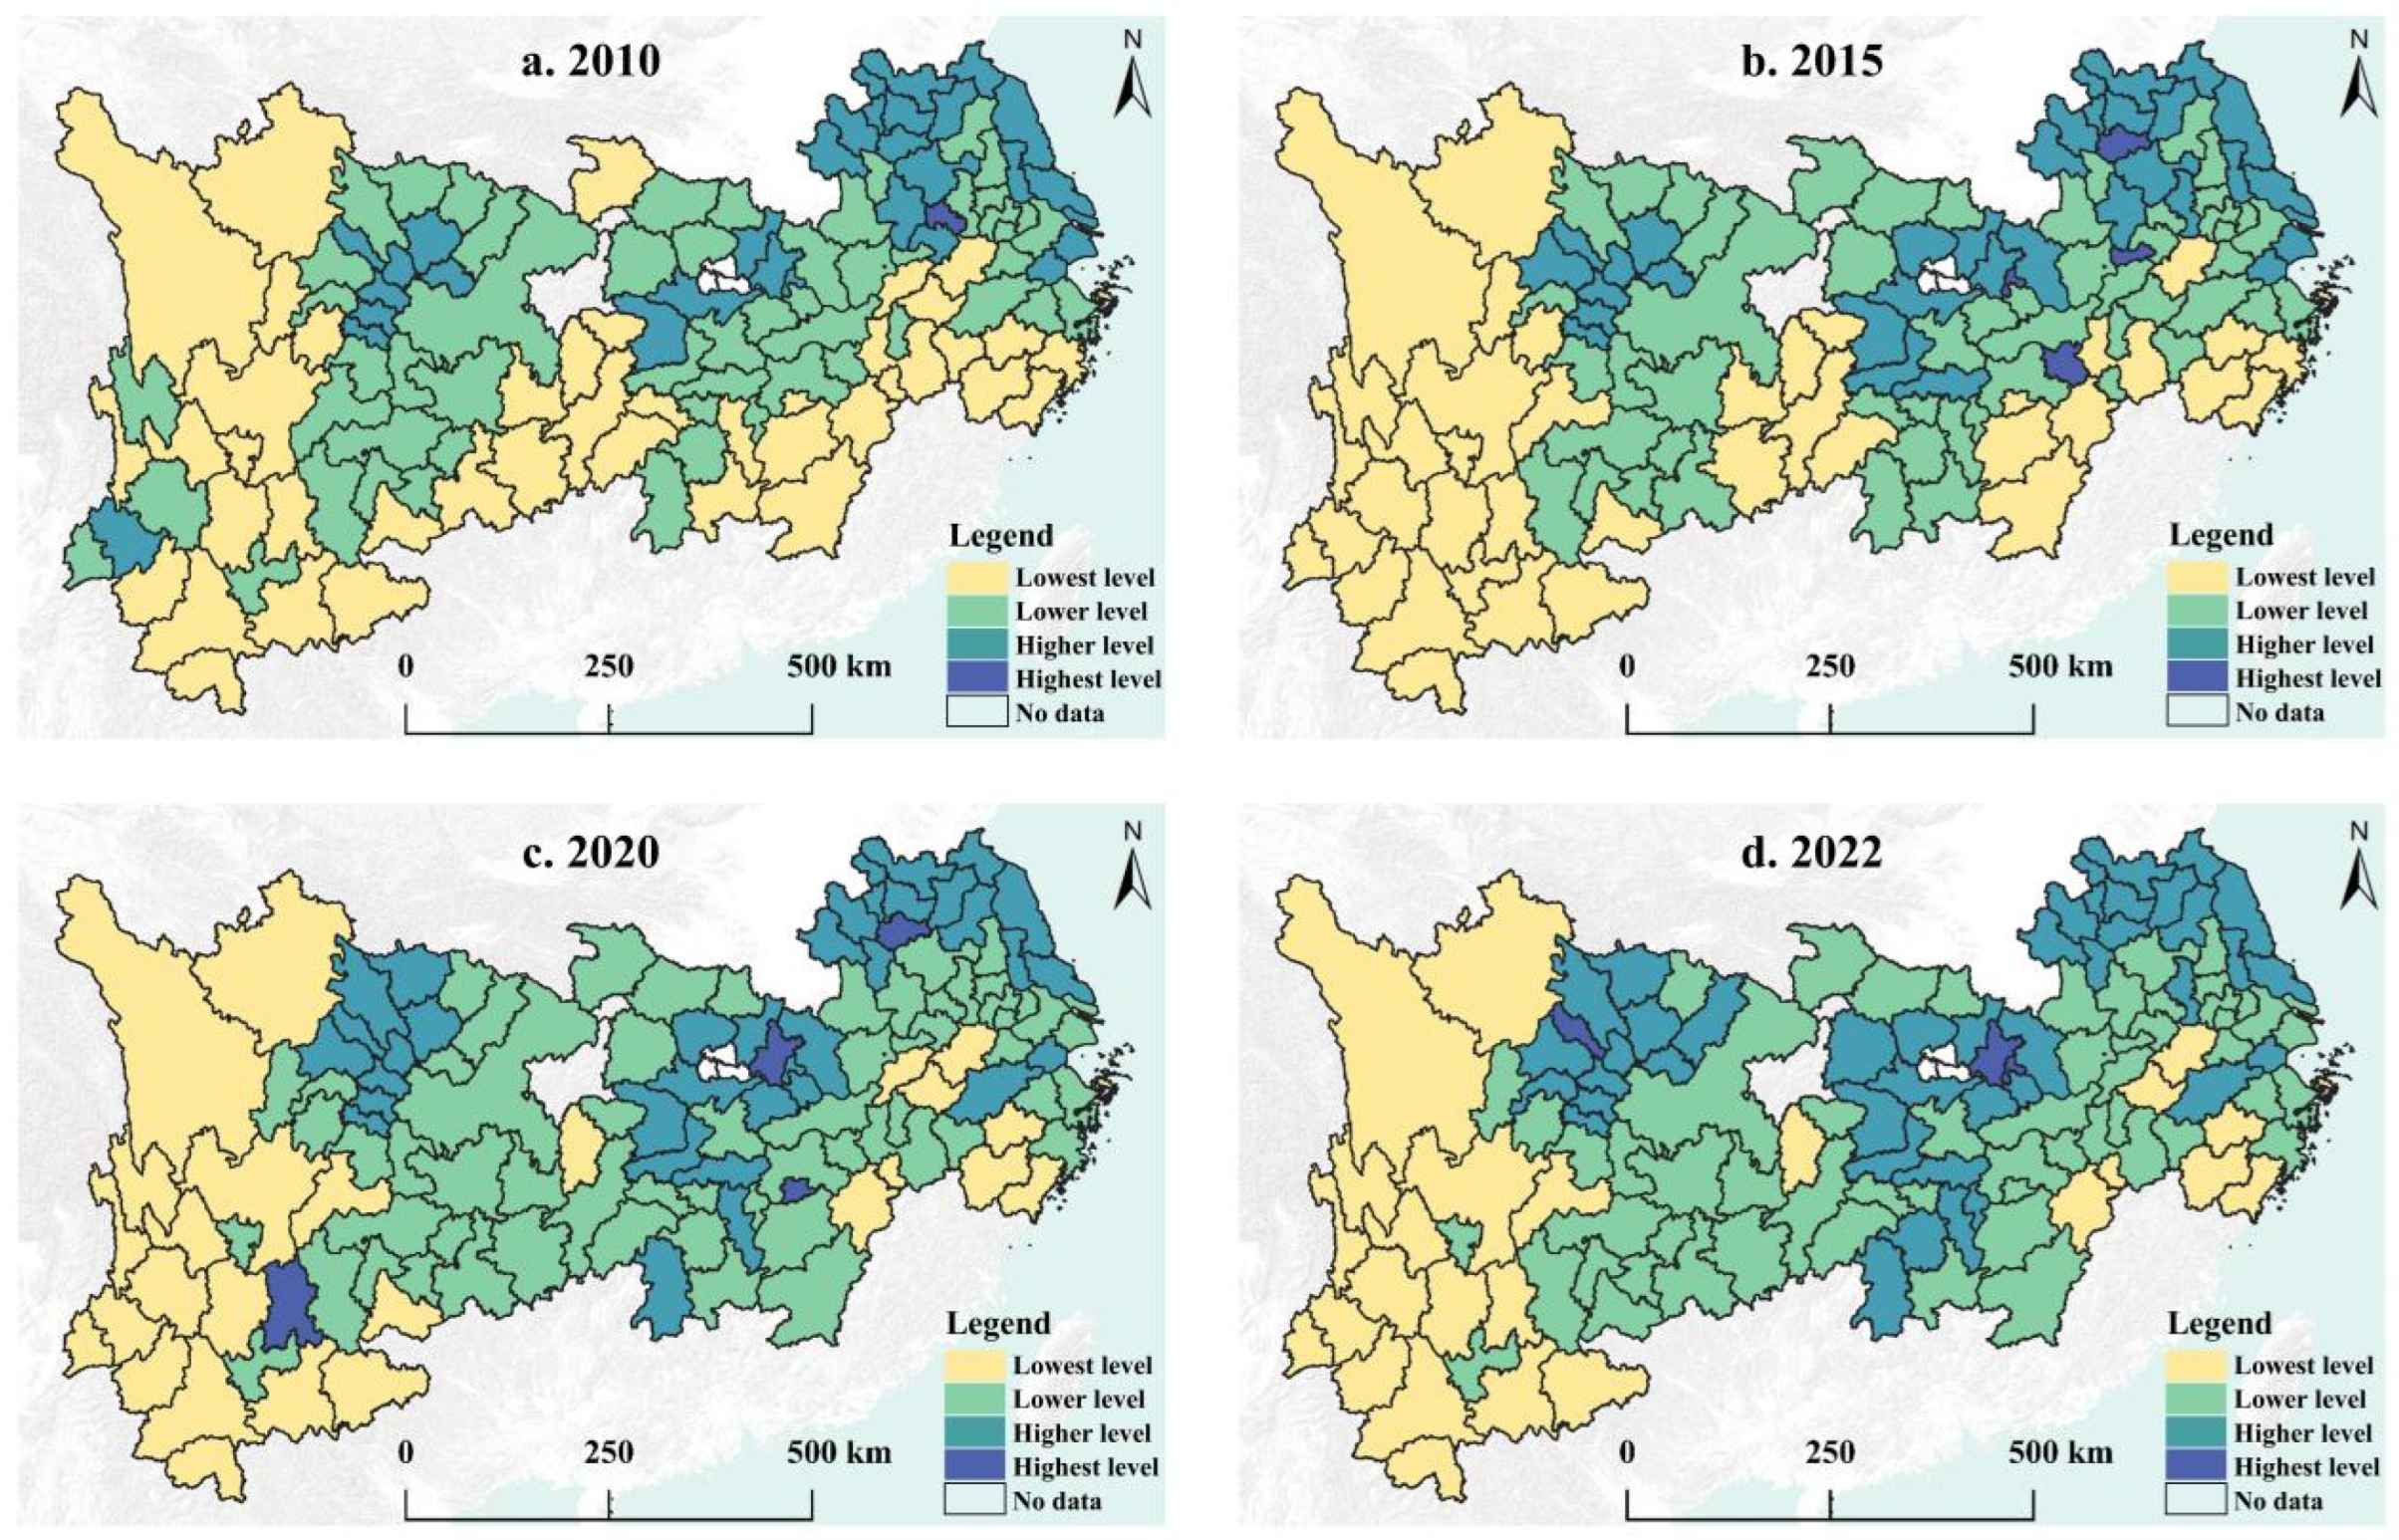
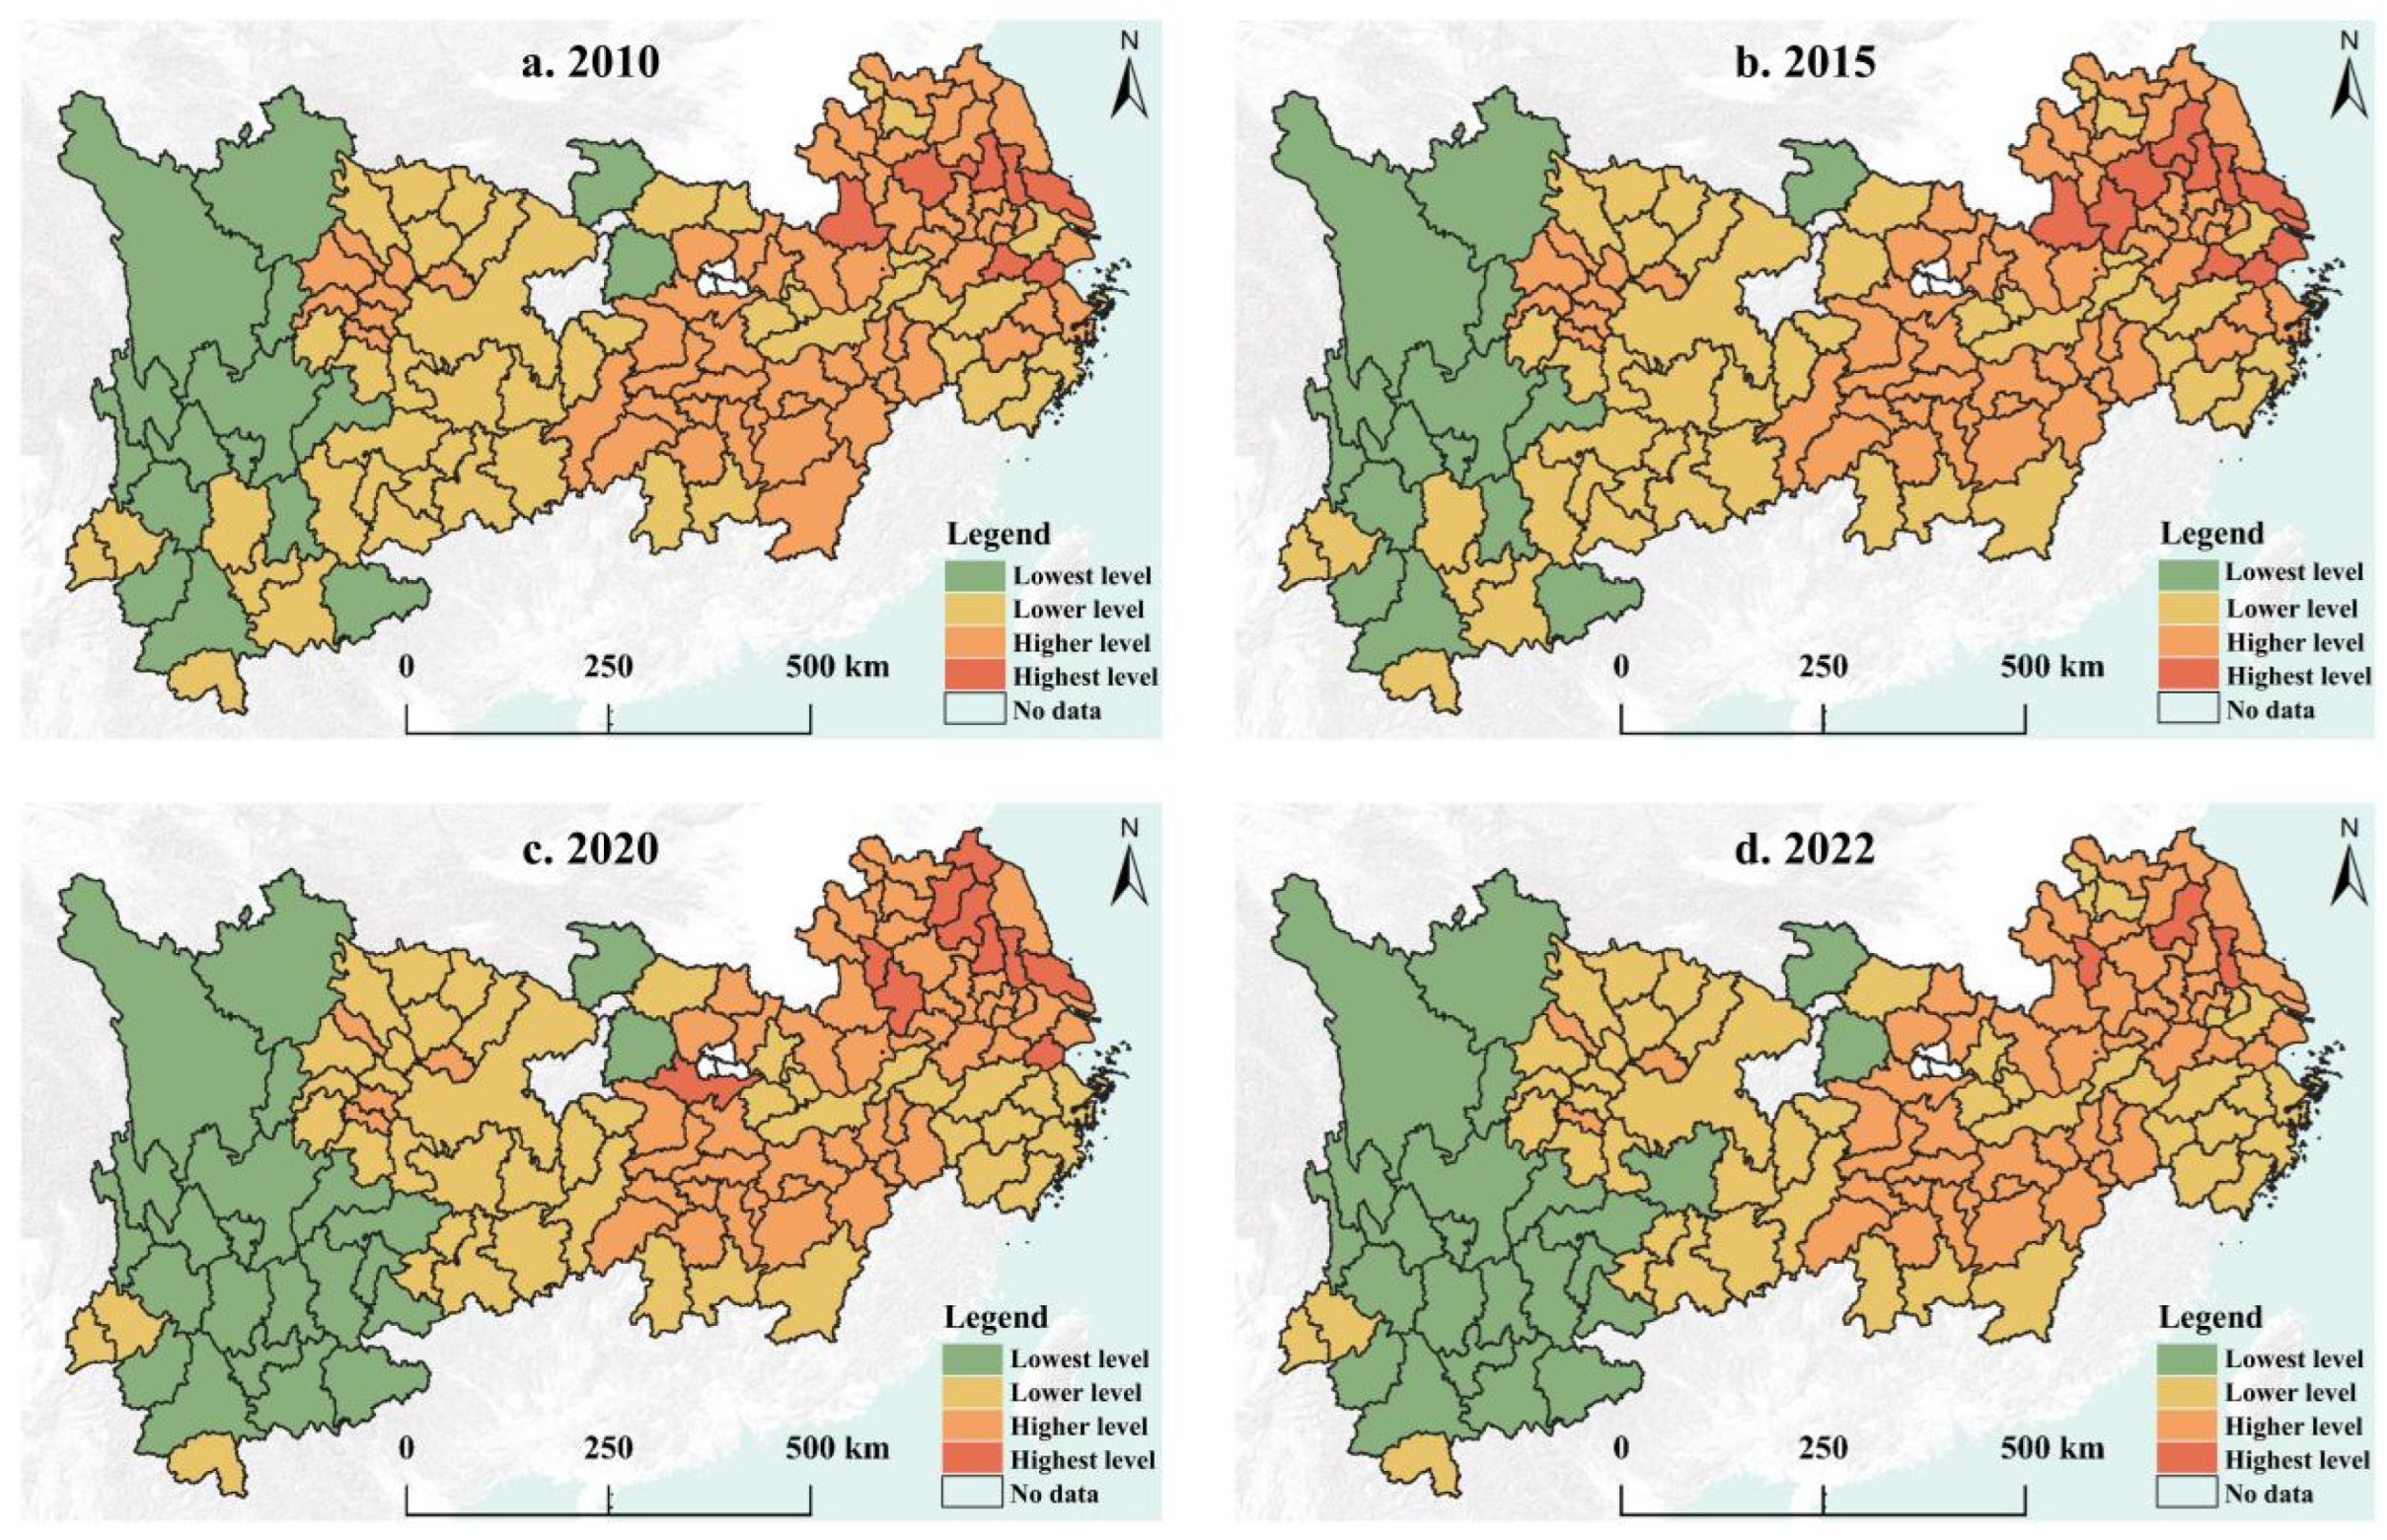
3.2.1. Temporal and Spatial Variation Characteristics of CCD

Between 2010 and 2022, the CCD of multiple functions of cultivated land in the YREB was generally low, with a mean value of only 0.624 in 2022, indicating that it was in the primary coordination stage. This suggests that there is still significant room for improvement in the coordinated development of multiple functions of cultivated land in the YREB. From a chronological perspective, the CCD of multiple functions of cultivated land in the YREB showed a sustained growth trend between 2010 and 2022. The mean value increased from 0.613 in 2010 to 0.624 in 2022, a rise of 1.88%. The standard deviation and coefficient of variation decreased from 0.120 and 0.195 in 2010 to 0.115 and 0.184, respectively, indicating that the differences in the coordinated development of multiple functions of cultivated land among cities were gradually diminishing.
From a spatial perspective, during the study period, the CCD of multiple functions of cultivated land in the YREB exhibited significant spatial disparities. The high-coordination cities were still concentrated in the Chengdu Plain, Jianghan Plain, and northern Anhui and Jiangsu Provinces. A “multi-core” growth pole was formed, featuring Ziyang (a city with good coordination), Wuhan, Bozhou, and Xuzhou (cities with intermediate coordination). This growth pole radiated and drove the increase in primary-coordinated cities. As a result, in the central and eastern regions of the study area, an inverted “U”-shaped pattern was formed by the primary and intermediate coordination cities (Figure 6). By contrast, the western region of the study area, with its complex terrain, single-industrial structure, and relatively backward socioeconomic system, did not form a positive interaction in the coupling coordination of multiple functions of cultivated land, remaining in a lagging stage. As a result, a spatial pattern of “the eastern region leading, the central region rising, and the western region catching up” has taken shape within the study area.
In terms of the spatial evolution of the CCD, compared to 2010, the CCD of multiple functions of cultivated land increased in 68 cities of the YREB, accounting for 54.4%, and 37 cities achieved a skip-level increase. The data were categorized into four types in this study (Figure 7). (1) Skip-level increase type (37): Most cities (16, 43.24%) increased from barely coordinated to primary coordination, such as Huaihua and Ningbo. Eight cities (21.62%), including Chengdu and Changsha, moved from primary to intermediate coordination. The largest leap was seen in the Garze Tibetan Autonomous Prefecture (from severe to mild imbalance), Nanchang (from mild imbalance to barely coordinated), and Pingxiang, Huainan, and Taizhou (from barely coordinated to intermediate coordination). (2) Peer-level promotion type (32): In Sichuan Province, nine cities (prefectures) achieved peer-level promotion in the coupling coordination index of multiple functions of cultivated land. Hunan Province followed with six cities, Jiangsu Province with five, and Zhejiang Province with four. The rest were sporadically distributed in Guizhou, Yunnan, and other regions. (3) Skip-level decline type (27): Eastern cities such as Shanghai, Taizhou, and Nantong (six cities) dropped from intermediate to primary coordination. Diqing Tibetan Autonomous Prefecture (Yunnan) had the largest decline (from mild to severe imbalance). Baoshan and Ma’anshan fell from intermediate coordination to elementary coordination. (4) Peer-level decline type (29): Hubei had six cities with peer-level decline in coordination indexes. Jiangsu and Jiangxi followed with five each. Anhui, Yunnan, Sichuan, and Guizhou also saw some peer-level decline.

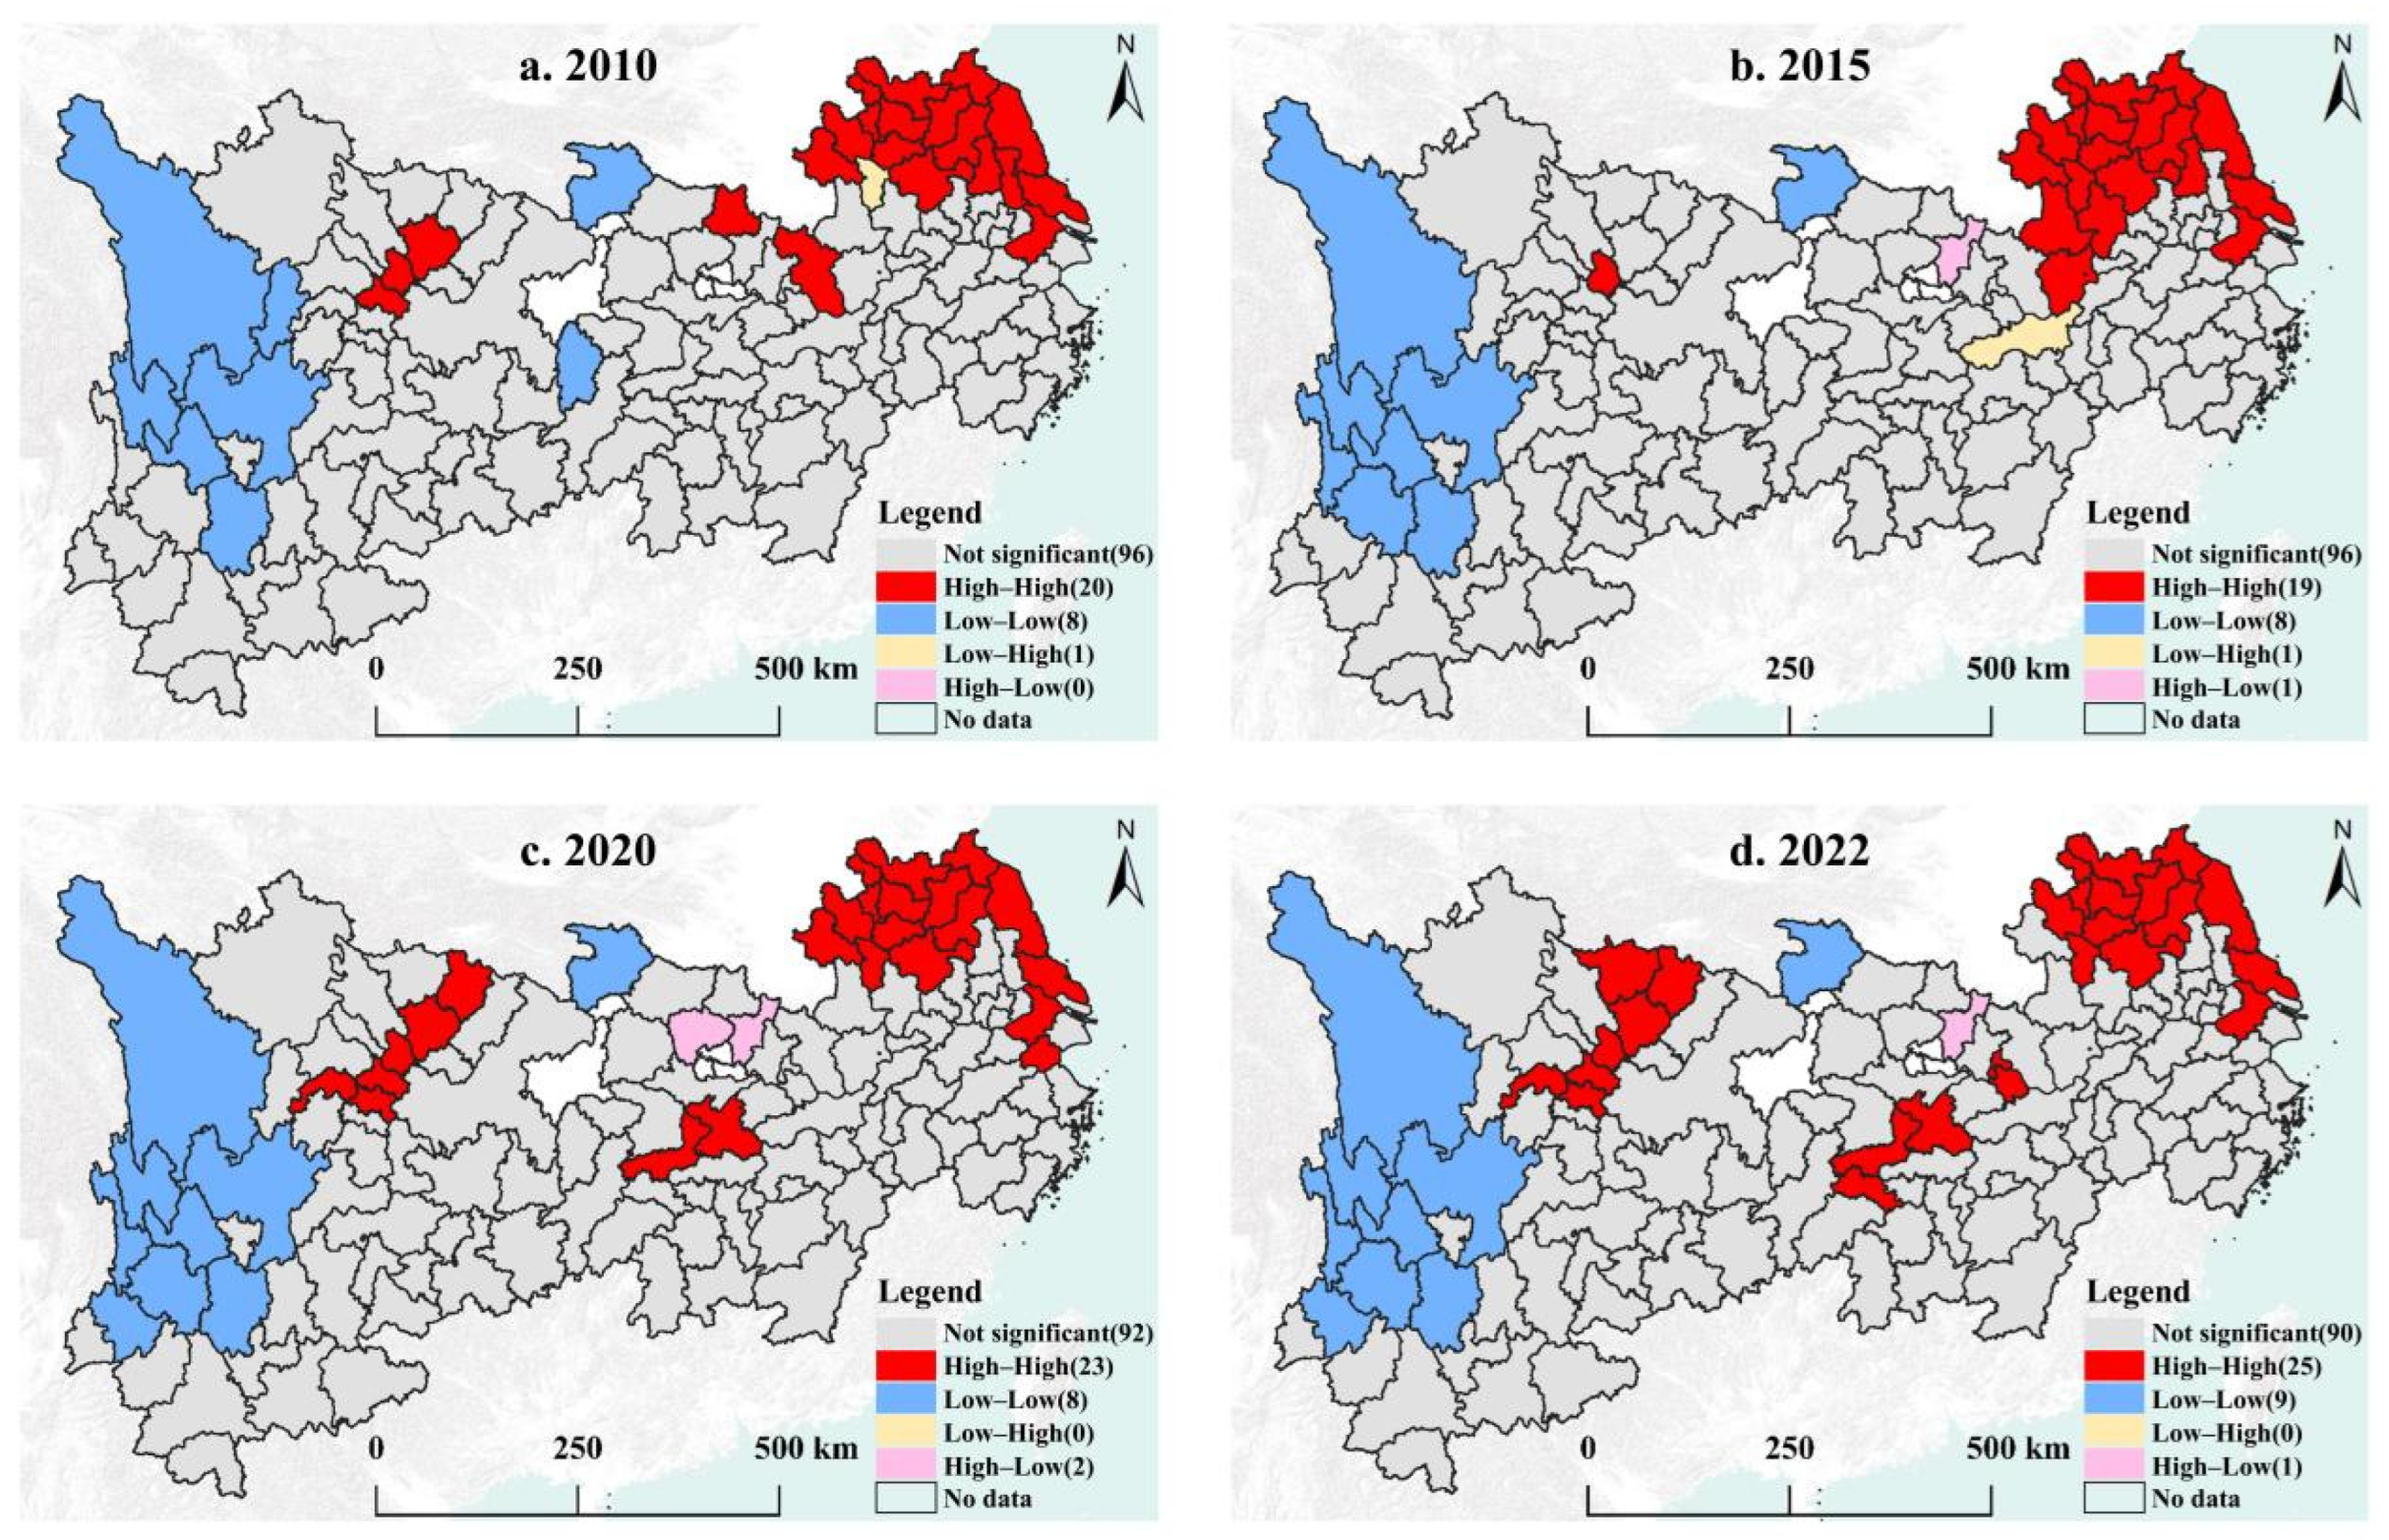
3.2.2. The Spatial Agglomeration Characteristics of the CCD

During the study period, the global Moran’s I index was positive. It surpassed the 1% significance test, indicating strong spatial clustering of the CCD of multiple functions of cultivated land in the YREB. Regarding the changing trend, the global Moran’s I index increased from 0.376 in 2010 to 0.437 in 2022, as illustrated in Figure 8. Overall, the spatial clustering of the CCD of multiple functions of cultivated land in the YREB intensified over time.
The LISA clustering was mapped based on the local Moran’s I each year to explore the specific distribution areas of the CCD of multiple functions of cultivated land in the YREB. High–high agglomeration is mainly concentrated in the northern region of the Yangtze River Basin downstream, the Chengdu Plain, and the Dongting Lake Plain. Low–low agglomeration mainly occurs in western regions such as western Sichuan and Yunnan. The high–high agglomeration zone of the CCD of multiple functions of cultivated land in the YREB is mostly in the north of the Yangtze River Basin downstream, such as the Huanghuaihai Plain. Sichuan and Hunan are in the Chengdu Plain and the Dongting Lake Plain, respectively. These areas have strong agricultural infrastructure and favorable conditions, resulting in a more pronounced spatial spillover effect of the coupling coordination degree. Cities such as Meishan, Yueyang, Suqian, and Huaibei have long been in the high–high agglomeration zone. They enhance the coupling coordination degree of surrounding cities through radiation and trickle-down effects. The low–low agglomeration areas of the CCD of multiple functions of cultivated land in the YREB are mainly in underdeveloped regions such as Garze Tibetan Autonomous Prefecture and Chuxiong Yi Autonomous Prefecture. These regions have relatively disadvantaged development endowments, leaving them in a backward state of coupling coordination. They are prone to a “Matthew effect,” where the strong and the weak become weaker. These areas are key for improving the CCD in the future (Figure 9). From 2010 to 2022, the number of cities with high–high and low–low agglomeration of the CCD of multiple functions of cultivated land in the YREB increased from 20 and 11 in 2010 to 25 and 13 in 2022. The growth in the number of high–high agglomeration cities was greater than that of low–low agglomeration cities. This indicates that the spillover effect of the leading cities on surrounding underdeveloped areas was stronger than the polarization effect, and their radiation-driven role increased. During this period, few cities were involved in “low–high” and “high–low” agglomeration, and their distribution was limited.

3.3. Causation Analysis

3.3.1. Single-Factor Detection Results

Based on the principle of geographical detection [51,52], ArcGIS software and the Jenks natural breaks method were used in this study to discretize variables into quintiles. The coupling coordination degree of agricultural multifunctionality in each city serves as the dependent variable. A geographical detector was then employed to measure the explanatory power (q value) of each independent variable regarding the spatial differentiation of this degree, and the results are presented in Table 5. Among natural conditions, in 2010, the average slope (X1), average elevation (X2), and annual average temperature (X4) were the top three influencing factors, with q-values of 0.57, 0.42, and 0.32, respectively. In 2022, the q-values of the average slope (X1) and annual average temperature (X4) decreased but remained high. From 2010 to 2022, the q-value of per capita GDP (X5) stayed low, indicating weak explanatory power over the spatial differentiation of the coupling coordination degree. However, the q-values of the proportion of the added value of the primary industry in GDP (X6) and rural residents’ disposable income (X7) rose, showing their growing influence on spatial differentiation. The q-value of agricultural comparative benefits (X8) has been declining from the perspective of social development impact factors, while that of the urbanization rate (X9) and total mechanical power per unit of cultivated land area (X10) has risen sharply. This indicates that social development, urbanization, and mechanization levels affect the degree of coupling and coordination of multiple functions of cultivated land. Overall, natural conditions significantly impacted the spatial differentiation of the CCD of multiple functions of cultivated land in the YREB during the study period. However, with social and economic development, the differences in influence among various factors narrowed, indicating a trend toward more diversified influencing factors.

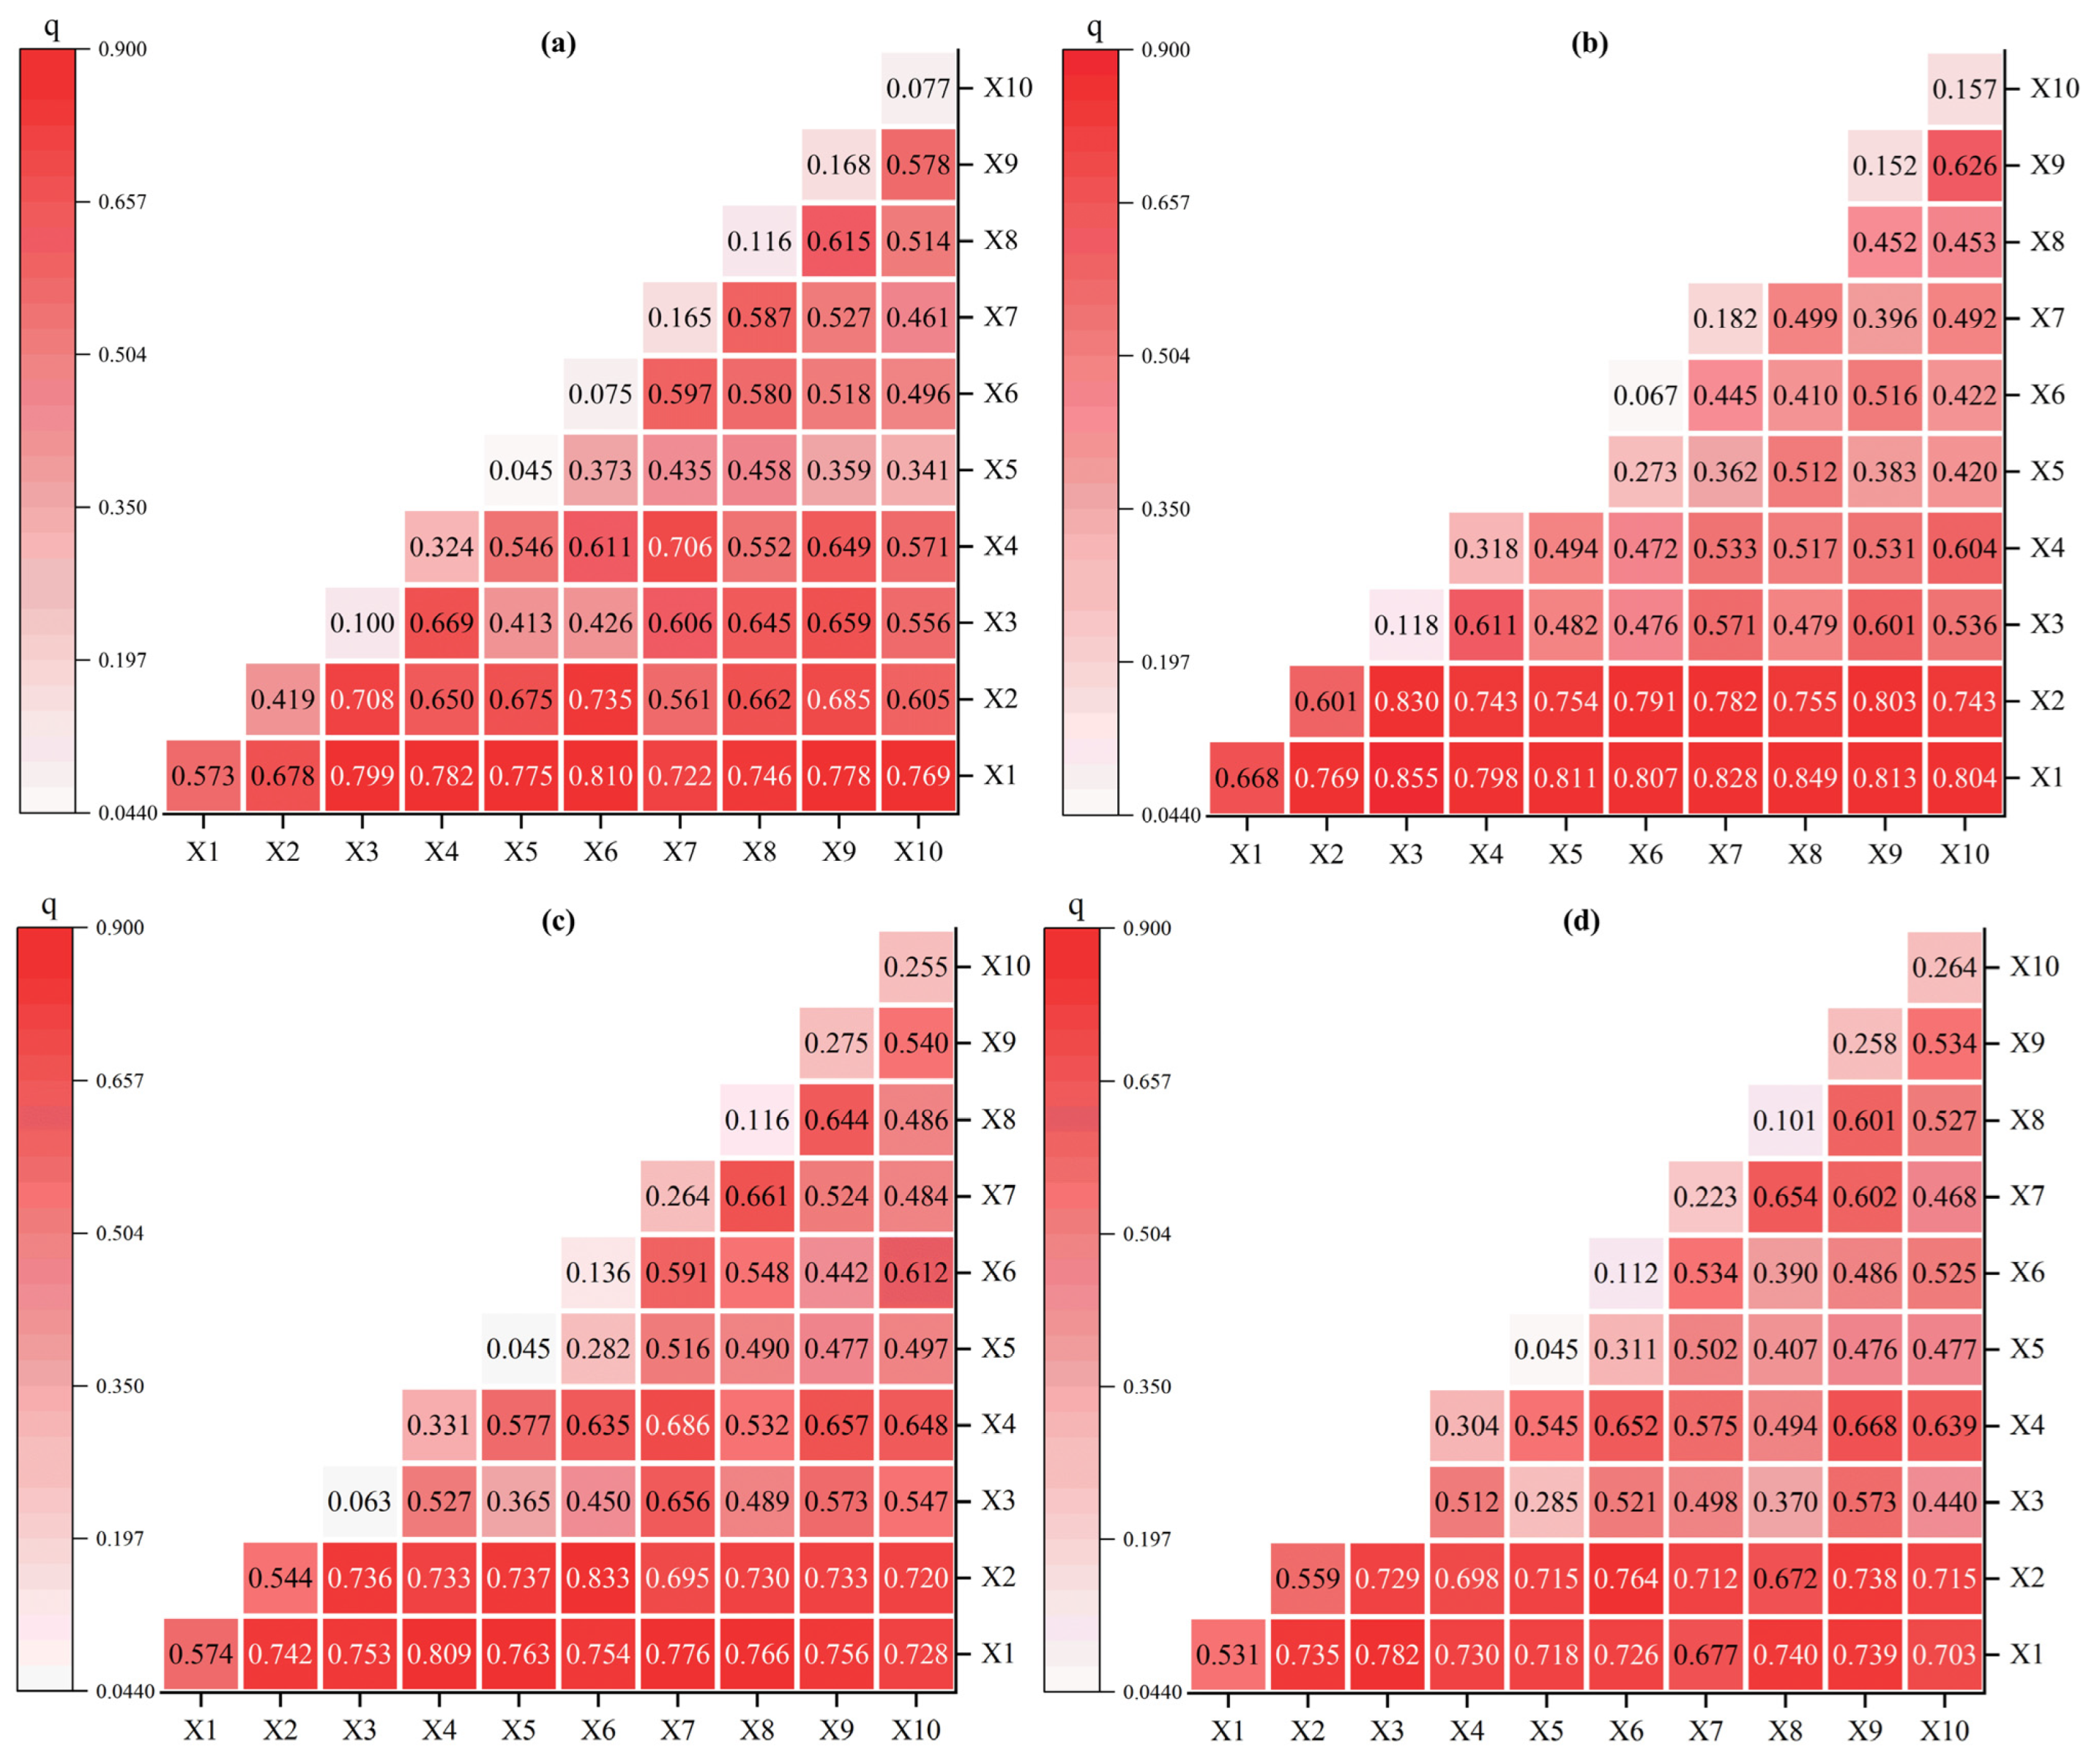
3.3.2. Interaction Factor Detection Results

The interaction detection results show that the interaction between any two factors influencing the coupling coordination degree of multiple functions of cultivated land in the Yangtze River Economic Belt exhibited nonlinear or double-factor enhancement during the study period. This indicates that the interaction of factors strengthens the explanation of the spatial differentiation of the CCD (Figure 10). In 2010, the interaction influence q-value of the average slope (X1) with any factor influencing the CCD of multiple functions of cultivated land in the YREB was above 0.67. The interaction influence q-value with the proportion of the added value of the primary industry in GDP (X6) was the highest at 0.810. This further highlights the significant impact of natural conditions on the CCD of multiple functions of cultivated land. In 2015, interactions among factors influencing the CCD of multiple functions of cultivated land in the YREB strengthened. The interaction influenced the q-value of the average slope (X1) with any economic and social development factor that exceeded 0.8, especially reaching 0.849 with agricultural comparative benefits (X8). Between 2020 and 2022, compared to 2010 and 2015, the high interaction influence q-value of factors affecting the CCD of multiple functions of cultivated land in the YREB weakened. However, this period saw a more diversified range of influencing factors. Their interactions also enhanced the explanatory power of the spatial differentiation of the CCD.

4. Discussion

4.1. Interpretation of the Findings

In this study, the development levels of individual cultivated land functions in 125 cities in the YREB were quantified. The spatiotemporal characteristics of the coupling coordination of multiple cultivated land functions were identified. These characteristics were classified, and the influencing factors of the spatial differentiation of this coupling coordination were detected. The study reveals that from 2010 to 2022, in the YREB, the GPF of cultivated land continued to rise, while the SCF initially declined and then increased. The EMF initially improved but then dropped. This aligns with the research of An Yue [10], Zhang Yue [15], and Yu Sen [55]. Spatially, the GPF is higher in the central and eastern regions and lower in the western region, which is consistent with the findings of Xiong Changsheng [3] and Xiang Hui [56]. This spatial difference is closely related to regional economic development and natural endowments. The SCF of cultivated land in the YREB shows a pattern of being higher in the east and west and lower in the middle, while the EMF presents a pattern of being higher in the central and eastern regions and lower in the west. The SCF index focuses on the rural population that cultivated land can support and its contribution to the socioeconomic system. Eastern areas have strong socioeconomic foundations, flat terrain, and good land endowment conditions. In western regions, poverty alleviation efforts and rural strategies increased financial support, leading to more large-scale planting of cash crops. Additionally, increased population outflow resulted in a stronger SCF of cultivated land. The EMF index emphasizes the inherent endowments of cultivated land, such as fragmentation, the ecological advantages of land types, and land resource endowments. In the middle and eastern regions of the Yangtze River Basin, the terrain is flat, there are abundant land resources, and the distribution of land-type structures is relatively even. Therefore, the EMF is higher than in western regions. In contrast, western areas such as Yunnan, Guizhou, Chongqing, and Sichuan have rugged terrains, steep slopes, and severe stone desertification. Their land use structure is mainly dry land-based, which significantly impairs cultivated land’s intrinsic EMF.
Using the CCD model, the spatiotemporal characteristics of the coupling coordination of multiple cultivated land functions in the YREB were explored in this study. It was found that the spatial clustering of the multi-functional coupling and coordination degree of farmland in the Yangtze River Economic Belt has become more pronounced over time. This finding is consistent with those of Fan Yeting [13], Pang Xiaofei [57], Lu Chang [58], and others. The coupling coordination development status of cities was innovatively categorized into four types in this study: skip-level increase, peer-level promotion, skip-level decline, and peer-level decline. This classification helps local governments better identify the weak areas and development status of coupling coordination in their regions. In the YREB, the coupling coordination of cultivated land functions forms a spatial pattern of “the eastern region leading, the central region rising, and the western region catching up.” The middle and eastern regions have areas such as the Dongting Lake Plain and the Jianghan Plain, which are key commercial grain production bases in China. These regions have superior land endowments and strong intrinsic motivation for grain production and ecological maintenance. In contrast, western regions, such as Yunnan, Guizhou, Chongqing, and Sichuan, have rugged terrains, steep slopes, and severe stone desertification. Their land use structure is mainly dry land-based, which significantly impairs cultivated land’s intrinsic ecological maintenance function. In recent years, the central No. 1 document emphasized strengthening farmland protection. The “YREB Territorial Space Plan” also sets goals such as solidifying national food security and ecological security, which helps improve the coordinated development of the GPF, SCF, and EMF in the YREB. Moreover, the governments in the central and eastern regions rigorously enforce cultivated land protection policies. They implement land use controls to curb cultivated land “non-agriculturalization” and “non-organization,” ensuring cultivated land quantity and quality. This lays a foundation for the multifunctional integration of cultivated land. Meanwhile, the central and eastern regions have high levels of agricultural mechanization. Their extensive plains and centralized farmland layouts are ideal for large-scale agrarian machinery, which boosts production efficiency, reduces costs, and enables farmers to balance food production, ecological protection, and social development. This fosters farmland multifunctional coordinated development. However, the western region’s complex terrain and scattered plots limit agricultural mechanization, hindering agricultural productivity and multifunctional integration. Recently, with the improvement in farm infrastructure and advancing mechanization, the gap between the central and eastern regions is narrowing. In the future, under the guidance of the Yangtze River Economic Belt National Land Space Plan and national development strategies, the eastern regions, with strong economic foundations, superior natural endowments, and policy support, are expected to enhance farmland multifunctional coordination steadily. Central areas, which are key commodity grain production bases with good farmland endowments (e.g., the Dongting Lake and Jianghan plains), will experience significant improvements in coordination as agricultural mechanization and infrastructure development advance. Although western regions have complex terrain and scattered plots, poverty alleviation, rural revitalization, and improved farm infrastructure and mechanization will boost farmland social carrying functions, gradually increasing coordination and narrowing the gap between central and eastern regions. Thus, a trend of “steady improvement in the east and west and an accelerated rise in the central region” is likely to emerge.
Geodetector was used in this study to explore the spatial differentiation factors of the coupling coordination of multiple cultivated land functions in the YREB. Given the region’s diverse topography across China’s three major zones, the average elevation and slope were key factors in single-factor detection. However, with socioeconomic development and urbanization, factors such as urbanization and mechanization levels have become more influential, narrowing the gaps among various factors and indicating a trend toward more the diversified factors influencing the spatial differentiation of coupling coordination. This is in line with the research conclusions of Zhang Yongdong [59], Chen Xingyu [16], and others. From the interaction detection perspective, the interaction between natural conditions and any influencing factors related to social development or the economic level was enhanced at the beginning of the study period. However, this trend somewhat diminished with the development of the national economy and society. This is mainly due to the advancement of science and technology across society and the implementation of ecological civilization concepts, which help cities leverage the functions of cultivated land in a location-specific manner. Thus, this study complements existing research by revealing the characteristics and influencing factors of farmland multi-functional coupling and coordinated development. It also offers theoretical and practical insights for enhancing land use policies and advancing sustainable practices.

4.2. Policy Recommendations

(1) Implement regional development strategies and strengthen functional zoning management.
In terms of the implementation path, focus on creating cross-provincial farmland ecological compensation mechanisms. Based on environmental maintenance function indicators, central and eastern ecological beneficiary areas should compensate for western ecological fragile regions. This will boost the latter’s enthusiasm for environmental protection and promote differential development policies. Central and eastern regions should focus on developing high-standard farmland and promoting advanced technologies while practicing crop rotation to strike a balance between food production and ecological protection. Western areas should focus on environmental restoration, returning farmland to forest, and exploring specialty and eco-agriculture to enhance social carrying capacity.
In terms of safeguard measures, include the multifunctional synergy degree of farmland in the local government performance evaluation system to strengthen policy implementation constraints. Build a cross-provincial collaboration platform for joint farmland protection planning, resource allocation, and experience sharing.
Regarding cost considerations, ensure sustainable ecological compensation funds via central fiscal transfers, provincial matching funds, and market financing. Use cost–benefit analysis tools to enhance fund allocation efficiency. Prioritize investment in subsidence and ecologically fragile areas to strike a balance between fiscal feasibility and policy effectiveness.
(2) Boost efficiency in a location-specific manner and promote coordinated functional development.
Regarding the implementation path, first, build a scientific and comprehensive evaluation system for farmland functions. Refine the quantitative evaluation standards for ecological sustainability, food production, and social carrying capacity functions based on regional differences. Conduct dynamic monitoring and the classified management of coupled coordination collapse areas and clarify phased goals and task lists through “one area–one policy” special enhancement programs. This will deepen the building of cross-provincial collaborative networks. Relying on inter-provincial liaison meetings and technical exchange platforms, form mechanisms for mutual learning and joint capacity building. Systematically enhance the multi-functional governance capacity of local governments and grassroots entities. For reference, the Han Plain adopts a “government-led, enterprise, farmer-assisted” model, achieving a positive interaction between farmland ecological protection and economic development.
In terms of safeguard mechanisms, innovate a “policy incentive + market-driven” dual-track model—leveraging policy tools such as fiscal subsidies and land transfer income sharing to attract social capital for farmland function optimization. Additionally, establish a “whole-process” supervision and evaluation framework. Use annual performance audits and third-party assessments to facilitate dynamic policy adjustments.
Regarding cost considerations, adhere to the “demand priority + precise policy-making” principle. Design a policy implementation priority matrix scientifically, focusing fiscal and technical resource allocation on areas of coordination collapse and ecologically sensitive zones. Explore ecological and financial products to diversify funding sources, achieving enhanced fund allocation efficiency and policy coverage breadth through dynamic cost–benefit ratio calculations.
(3) Focus on agricultural technology frontiers to break through functional development bottlenecks.
In terms of implementation pathways, the strategy should be technology-enabled, emphasizing increased investment in R&D for the coordinated development of multi-functional croplands. Key areas include the interaction mechanisms between natural conditions and socioeconomic factors, as well as the application of ecological farming technologies. Drawing on the “technology-driven + systematic governance” model of the Chengdu Plain, regional agricultural technology transformation centers should be established to accelerate mature practices, such as smart upgrades to farmland water conservancy infrastructure, remote sensing monitoring, and big-data-driven dynamic supervision technologies, for cropland resources and ecological agriculture techniques (e.g., integrated pest management and circular farming systems). Simultaneously, targeted “theoretical + practical” training programs should be implemented. Leveraging high-standard cropland demonstration bases, scenario-based training on the operation of intelligent agricultural machinery and precision fertilization techniques will enhance farmers’ technological proficiency, driving the intensive and sustainable utilization of cropland resources.
In terms of safeguard mechanisms, build a “government–university–enterprise” collaborative innovation network. Establish special research funds for the development of multifunctional farmland. Encourage breakthroughs with “revenue sharing for conversion” and “priority patent purchase” policies. Additionally, establish a closed-loop management mechanism of “research–promotion–feedback.”
Regarding cost considerations, adopt a “government-funded, financing” model. Utilize dynamic cost–benefit analysis to prioritize high-return technology R&D. Expand market-based financing through green bonds and financial products related to farmland ecological compensation. This forms a sustainable investment system of “government guidance and social capital following,” overcoming technical and financial bottlenecks in farmland function optimization.

4.3. Research Perspectives

This study reveals the spatiotemporal evolution of the coupling coordination of multiple functions of cultivated land in the YREB from 2010 to 2022, pinpoints underperforming areas, and explores factors behind spatial differences. It aids in the coordinated development of cultivated land’s multiple functions and their location-specific utilization. However, with numerous cities involved, only four phases beyond the Second National Land Survey were considered in this study. Thus, each year’s cultivated land function levels from 2010 to 2022 were not precisely measured. Additionally, the influence factor construction did not account for individual farmers’ impacts on functional coordination. Future research will focus on longer continuous years and combine field surveys to capture farmers’ opinions, supporting rational cultivated land management and high-quality regional development.

5. Conclusions

The spatiotemporal evolution of the coupling coordination of multiple functions of cultivated land in the YREB from 2010 to 2022 across 125 cities was examined in this study. Using the entropy weight TOPSIS model, CCD model, spatial autocorrelation, and Geodetector, individual function levels were assessed, revealing patterns and clusters of coupling coordination and influencing factors. The findings support farmland protection in the Yangtze River Economic Belt. The key conclusions are as follows:
(1) From 2010 to 2022, the GPF of cultivated land in the YREB steadily rose; the SCF first declined and then climbed, and the EMF increased and then dropped. Spatially, these functions generally showed an uneven pattern of being higher in the central and eastern regions and lower in the west, or higher in the east and west and lower in the middle.
(2) From 2010 to 2022, the coupling coordination of cultivated land functions in the YREB showed a continuous growth trend. It was divided into four types: skip-level increase, peer-level promotion, skip-level decline, and peer-level decline. Spatially, the study area shows a pattern of “the eastern region leading, the central region rising, and the western region catching up” across the study area.
(3) The spatiotemporal pattern of the coupling coordination of multiple functions of cultivated land in the YREB from 2010 to 2022 shows that the CCD is high in the east and low in the west. High–high agglomeration areas are mainly north of the Yangtze River Basin downstream, the Chengdu Plain, and the Dongting Lake Plain. Low–low agglomeration areas are primarily in western regions such as Sichuan and Yunnan.
(4) The spatial differences in the coupling coordination of cultivated land functions in the YREB are mainly affected by natural conditions. However, socioeconomic factors such as the urbanization rate and total mechanical power per unit of cultivated land area are becoming more influential. The interaction between any two influencing factors shows nonlinear enhancement or double-factor enhancement.

Author Contributions

N.Z. designed the experiments and drafted the manuscript. Data processing and visualization were performed by X.X. and G.J., K.Z. revised the manuscript. All authors have read and agreed to the published version of the manuscript.

Funding

The work was supported by the Second Tibetan Plateau Scientific Expedition and Research (2019QZKK0603), and the National Natural Science Foundation of China (42201027, 42192581).

Institutional Review Board Statement

Not applicable.

Informed Consent Statement

Not applicable.

Data Availability Statement

Publicly available datasets were analyzed in this study. This data can be found here: https://gtdc.mnr.gov.cn/Share#/ (accessed on 15 November 2024), http://www.gscloud.cn/ (accessed on 15 November 2024), http://www.ngcc.cn/ (accessed on 10 December 2024), https://www.noaa.gov/ (accessed on 8 March 2025).

Conflicts of Interest

The authors declare no conflicts of interest.

Abbreviations

The following abbreviations are used in this manuscript:
YREBYangtze River Economic Belt
GPFgrain production function
SCFsocial carrying function
EMFecological maintenance function
CCDcoupling coordination degree

References

  1. Liu, Y.; Liu, Y.; Chen, Y. Territorial Multi-functionality Evaluation and Decision-making Mechanismat County Scale in China. Acta Geogr. Sin. 2011, 66, 1379–1389. [Google Scholar]
  2. Song, X.; Li, X. Theoretical explanation and case study of regional cultivated land use function transition. Acta Geogr. Sin. 2019, 74, 992–1010. [Google Scholar]
  3. Xiong, C.; Zhang, Y.; Wang, Y.; Luan, Q.; Liu, X. Multi-function Evaluation and Zoning Control of Cultivated Land in China. China Land Sci. 2021, 35, 104–114. [Google Scholar]
  4. Zou, L.; Li, Y.; Liu, Y.; Wang, J. Theory building and empirical research of production-living-ecological function of cultivated land based on the elements. Geogr. Res.-Aust. 2021, 40, 839–855. [Google Scholar]
  5. Wang, Z.; Yang, H.; Hu, Y.; Peng, Y.; Liu, L.; Su, S.; Wang, W.; Wu, J. Multifunctional trade-off/synergy relationship of cultivated land in Guangdong: A long time series analysis from 2010 to 2030. Ecol. Indic. 2023, 154, 110700. [Google Scholar] [CrossRef]
  6. Wang, M.; Huang, X. Inhibit or promote: Spatial impacts of multifunctional farmland use transition on grain production from the perspective of major function-oriented zoning. Habitat. Int. 2024, 152, 103172. [Google Scholar] [CrossRef]
  7. Tang, C.; Xie, X.; Wei, G.; Pan, L.; Qi, Z. Exploring the Evolutionary Characteristics of Food Security in China and the United States from a Multidimensional Perspective. Foods 2024, 13, 2272. [Google Scholar] [CrossRef]
  8. Chan, F.K.S.; Chen, J.; Li, P.; Wang, J.; Wang, J.; Zhu, Y. The cross-boundary of land degradation in Mongolia and China and achieving its neutrality-challenges and opportunities. Ecol. Indic. 2023, 151, 110311. [Google Scholar] [CrossRef]
  9. Song, X.; Wu, Z.; Ou, Y. Changes of cultivated land function in China since 1949. Acta Geogr. Sin. 2014, 69, 435–447. [Google Scholar]
  10. An, Y.; Tan, X.; Li, Y.; Zhou, Z.; Yu, H.; Ren, H. Spatio-temporal evolution characteristics and influencing factors of cultivated land function in the Dongting Lake aera. Sci. Geogr. Sin. 2022, 42, 1272–1282. [Google Scholar]
  11. Zhang, Y.; Cai, H.; Zhang, X.; Chen, L.; He, Q. Multi-Functional Spatiotemporal Evolution of Cultivated Land and Its Driving Mechanisms in Poyang Lake Plain. Bull. Soil. Water Conserv. 2023, 43, 245–253. [Google Scholar]
  12. Zhang, L.; Lu, R.; Ma, G.; Ma, D. Multifunctional Utilization and Optimization Strategy of Cultivated Land in Guangxi Section of Pearl River-Xijiang River Economic Belt. Res. Soil. Water Conserv. 2024, 31, 276–286. [Google Scholar]
  13. Fan, Y.; Jin, X.; Xiang, X.; Yang, X.; Liu, J.; Zhou, Y. Evaluation and spatial characteristics of arable land multifunction in southern Jiangsu. Resour. Sci. 2018, 40, 980–992. [Google Scholar]
  14. Gu, G.; Shi, L.; Wen, Q.; Niu, S. Coupling and coordination of the multifunction and value of arable land at the regional scale from the perspective of rural hollowing governance. Prog. Geogr. 2024, 43, 587–602. [Google Scholar]
  15. Zhang, Y.; Dai, Y.; Chen, Y.; Ke, X. Spatial-temporal evolution and driving factors of cultivated land multifunctional coupling coordination development in China. Trans. Chin. Soc. Agric. Eng. 2023, 39, 244–255. [Google Scholar]
  16. Chen, X.; Wang, F.; Li, C. Spatial Differences and Influencing Factors of Arable Land Multi-functions in Pearl River Delta. Areal Res. Dev. 2017, 36, 130–136. [Google Scholar]
  17. Zhu, Q.; Hu, W.; Zhao, Z. Dynamic Analysis on Spatial-Temporal Pattern of Trade-Offs and Synergies of Multifunctional Cultivated Land-Evidence from Hubei Province. Econ. Geogr. 2018, 38, 143–153. [Google Scholar]
  18. Gao, N.; Liang, W.; Gou, F.; Liu, Y.; Fu, B.; Lu, Y. Assessing the impact of agriculture, coal mining, and ecological restoration on water sustainability in the Mu Us Sandyland. Sci. Total Environ. 2024, 929, 172513. [Google Scholar] [CrossRef]
  19. Nahuelhual, L.; Vergara, X.; Kusch, A.; Campos, G.; Droguett, D. Mapping ecosystem services for marine spatial planning: Recreation opportunities in Sub-Antarctic Chile. Mar. Policy 2017, 81, 211–218. [Google Scholar] [CrossRef]
  20. Xu, D.; Pu, L.; Huang, S.; Nie, M.; Qie, L.; Zhu, M. Spatial and Temporal Dynamic Analysis of Cultivated Land Multifunction in Jiangsu Province and Its Response to Cultivated Land Change. Resour. Environ. Yangtze Basin 2022, 31, 575–587. [Google Scholar]
  21. Zhang, Y.; Long, H.; Chen, S.; Ma, L.; Gan, M. The development of multifunctional agriculture in farming regions of China: Convergence or divergence? Land Use Policy 2023, 127, 106576. [Google Scholar] [CrossRef]
  22. Wu, Z.; Hao, J.; Chen, H.; Tan, Y. Multifunctional evaluation and key trade-offs and synergy relationships of cultivated land in Hebei province of China. Trans. Chin. Soc. Agric. Eng. 2024, 40, 199–209. [Google Scholar]
  23. Wolff, S.; Schulp, C.J.E.; Verburg, P.H. Mapping ecosystem services demand: A review of current research and future perspectives. Ecol. Indic. 2015, 55, 159–171. [Google Scholar] [CrossRef]
  24. Du, H.; Wang, Z.; Li, H.; Zhang, C. Analysis of Spatial and Temporal Pattern Evolution and Decoupling Relationships of Land Use Functions Based on Ecological Protection and High-Quality Development: A Case Study of the Yellow River Basin, China. Land 2024, 13, 862. [Google Scholar] [CrossRef]
  25. Zhu, Y.; Luo, P.; Zhang, S.; Sun, B. Spatiotemporal Analysis of Hydrological Variations and Their Impacts on Vegetation in Semiarid Areas from Multiple Satellite Data. Remote Sens. 2020, 12, 4177. [Google Scholar] [CrossRef]
  26. Vereijken, P.H. Transition to multifunctional land use and agriculture. NJAS—Wagening. J. Life Sci. 2003, 50, 171–179. [Google Scholar] [CrossRef]
  27. Fleskens, L.; Duarte, F.; Eicher, I. A conceptual framework for the assessment of multiple functions of agro-ecosystems: A case study of Trás-os-Montes olive groves. J. Rural. Stud. 2009, 25, 141–155. [Google Scholar] [CrossRef]
  28. Gómez Sal, A.; González García, A. A comprehensive assessment of multifunctional agricultural land-use systems in Spain using a multi-dimensional evaluative model. Agric. Ecosyst. Environ. 2007, 120, 82–91. [Google Scholar] [CrossRef]
  29. Helming, K.; Diehl, K.; Kuhlman, T.; Jansson, T.; Verburg, P.H.; Bakker, M.M.; Pérez-Soba, M.; Jones, L.; Verkerk, P.J.; Tabbush, P.M.; et al. Ex ante impact assessment of policies affecting land use, Part B: Application of the analytical framework. Ecol. Soc. 2011, 16, 29. [Google Scholar] [CrossRef]
  30. Lv, L.; Han, X.; Long, H.; Zhou, B.; Zang, Y.; Wang, J.; Fan, Y. Research progress and prospects on supply and demand matching offarmland multifunctions. Resour. Sci. 2023, 45, 1351–1365. [Google Scholar]
  31. Cai, Y. The Mechanisms of Cropland Conservation in Chinese Rura Transformation. Geogr. Sci. 2001, 21, 1–6. [Google Scholar]
  32. Xu, L.; Hu, H.; Yin, S.; Yang, J.; Ma, L. Spatiotemporal Evolution and Subarea of Cultivated Land Function Supply-Demand Transition in Hebei Province. Res. Soil. Water Conserv. 2023, 30, 403–412. [Google Scholar]
  33. Cai, Y.; Wang, Y.; Zhu, L. The Effect of Farmer Households’ Farmland Use Function on Their Land Rental Decision in Urban Fringe-A Case Study of 1022 Farmer Households in Suzhou, Chengdu and Wuhan. J. Nat. Resour. 2016, 31, 1648–1661. [Google Scholar]
  34. Ma, C.; Jin, Y.; Ke, X.; Ma, Y. Study on the Typical Modes of Farmland Multi-functional Intensity and Coordination in Hubei Province based on the Entire-array polygon Indicator Method. China Land Sci. 2018, 32, 51–58. [Google Scholar]
  35. Li, Y.; Fang, B.; Li, Y.; Qu, L.; Li, D. Trade-off and synergy evolution of farmland functions and its dynamic mechanism in the process of urbanization. Trans. Chin. Soc. Agric. Eng. 2022, 38, 244–254. [Google Scholar]
  36. Jang, Y.; Yang, C.; Nie, Y.; Wang, R.; Wu, Y. Spatio-Temporal Evolution of Multi-Functions of Farmland on a County Scale in Hubei Province, China and Their Coupling Coordination Analysis. Mt. Res. 2021, 39, 891–900. [Google Scholar]
  37. Huang, D.; Ye, Y.; Yao, X.; Liu, X. Evaluation and Obstacle Factors of Rural Industrial Revitalization Level in Huaihe River Ecological Economic Belt. Resour. Environ. Yangtze Basin 2024, 33, 1412–1423. [Google Scholar]
  38. Chen, Z.; Yang, G. County-level agricultural productivity and spatial characteristics in hilly and mountainous areas of Fujian Province: An empirical study based on entropy weighted Topsls modeling. J. China Agric. Univ. 2024, 29, 297–310. [Google Scholar]
  39. Gao, Y.; Zhang, X.; Fang, Y.; Zhang, X.; Guo, J. Landscape fragmentation and wetland restoration priority in Zoige County of Sichuan Province of China. J. China Agric. Univ. 2019, 24, 145–158. [Google Scholar]
  40. Ilieva, G. Extension of Interval-Valued Hesitant Fermatean Fuzzy TOPSIS for Evaluating and Benchmarking of Generative AI Chatbots. Electronics 2025, 14, 555. [Google Scholar] [CrossRef]
  41. Al-Abadi, A.M.; Handhal, A.M.; Abdulhasan, M.A.; Ali, W.L.; Hassan, J.J.; Al Aboodi, A.H. Optimal siting of large photovoltaic solar farms at Basrah governorate, Southern Iraq using hybrid GIS- based Entropy-TOPSIS and AHP-TOPSIS models. Renew. Energ. 2025, 241, 122308. [Google Scholar] [CrossRef]
  42. Kong, D.; Yang, W. Research on site selection of emergency material reserve based on set pair analysis and TOPSIS integration method: A case study of Hebei Province, China. J. Supercomput. 2025, 81, 351. [Google Scholar] [CrossRef]
  43. Zare Banadkouki, M.R. Selection of strategies to improve energy efficiency in industry: A hybrid approach using entropy weight method and fuzzy TOPSIS. Energy 2023, 279, 128070. [Google Scholar] [CrossRef]
  44. Le Roux, D.; Olivès, R.; Neveu, P. Combining entropy weight and TOPSIS method for selection of tank geometry and filler material of a packed-bed thermal energy storage system. J. Clean. Prod. 2023, 414, 137588. [Google Scholar] [CrossRef]
  45. Li, X.; Zhao, M.; Yang, G.; Xu, X.; Fan, P. An Analysis of the Spatial-Temporal Evolution and Influencing Factors of the Coupling Coordination Degree Between the Digital and Real Economies in China. Sustainability 2025, 17, 3384. [Google Scholar] [CrossRef]
  46. Meng, Q.; Chen, X.; Wang, H.; Shen, W.; Duan, P.; Liu, X. Spatiotemporal evolution and driving factors of the synergistic effects of pollution control and carbon reduction in China. Ecol. Indic. 2025, 170, 113103. [Google Scholar] [CrossRef]
  47. Jiang, L.; Wu, Y.; He, X.; Fu, Q.; Wang, Z.; Jiang, Q. Dynamic simulation and coupling coordination evaluation of water footprint sustainability system in Heilongjiang province, China: A combined system dynamics and coupled coordination degree model. J. Clean. Prod. 2022, 380, 135044. [Google Scholar] [CrossRef]
  48. Chen, X.; Huang, X.; Yu, T.; Zhang, Y.; Cui, X. From Imbalance to Synergy: The Coupling Coordination of Digital Inclusive Finance and Urban Ecological Resilience in the Yangtze River Economic Belt. Land 2024, 13, 1617. [Google Scholar] [CrossRef]
  49. Zhang, Z.; Li, Z.; Song, Y. On ignoring the heterogeneity in spatial autocorrelation: Consequences and solutions. Int. J. Geogr. Inf. Sci. 2024, 38, 2545–2571. [Google Scholar] [CrossRef]
  50. Jemeljanova, M.; Kmoch, A.; Uuemaa, E. Adapting machine learning for environmental spatial data—A review. Ecol. Inform. 2024, 81, 102634. [Google Scholar] [CrossRef]
  51. Yang, J.; Liu, Q.; Deng, M. Spatial hotspot detection in the presence of global spatial autocorrelation. Int. J. Geogr. Inf. Sci. 2023, 37, 1787–1817. [Google Scholar] [CrossRef]
  52. Joo, M.M.; Bolte, B.; Huynh, N.; Mukherjee, B. Bayesian Spatial Split-Population Survival Model with Applications to Democratic Regime Failure and Civil War Recurrence. Mathematics 2023, 11, 1886. [Google Scholar] [CrossRef]
  53. Wang, J.F.; Li, X.H.; Christakos, G.; Liao, Y.L.; Zhang, T.; Gu, X.; Zheng, X.Y. Geographical Detectors-Based Health Risk Assessment and its Application in the Neural Tube Defects Study of the Heshun Region, China. Int. J. Geogr. Inf. Sci. 2010, 24, 107–127. [Google Scholar] [CrossRef]
  54. Tillé, Y.; Dickson, M.M.; Espa, G.; Giuliani, D. Measuring the spatial balance of a sample: A new measure based on the Moran’s I index. Spat. Stat. 2018, 23, 182–192. [Google Scholar] [CrossRef]
  55. Sen, Y.; Ma, E.; Ji, Y.; Ye, W.; Cai, J. Multifunctional spatiotemporal evolution and its inter-regional coupling of cultivated land in a typical transect in Northern China. J. Nat. Resour. 2025, 40, 514–533. [Google Scholar]
  56. Xiang, H.; Zhou, C.; Peng, B.; Fu, D. The spatiotemporal evolution of cultivated land’s multi-functions and its zoning optimization in Wuling Mountain Area of Hunan Province. J. Hunan Agric. Univ. (Nat. Sci.) 2023, 49, 714–722. [Google Scholar]
  57. Pang, X.; Lu, R.; Li, S.; Zhang, L.; Pang, Y. Analysis of Multi-Functional Temporal and Spatial Differentiation Pattern and Agglomeration Characteristics of Cultivated Land in Guangxi Border Areas. Chin. J. Agric. Resour. Reg. Plan. 2023, 44, 49–59. [Google Scholar]
  58. Lu, C.; Geng, H.; Liu, R.; Lv, Y. Spatial-temporal Pattern Analysis of Cultivated Land Multi-functiona Coupling Coordination Degree in Shandong Province. Trans. Chin. Soc. Agric. Mach. 2021, 52, 265–274. [Google Scholar]
  59. Zhang, Y.; Yang, Z.; Yang, R.; Liu, F.; Yimei, H. Spatiotemporal Evolution and Influencing Factors of Multifunctional Cultivated Land in Southwestern Mountainous Areas under the Background of Sustainable Agricultural Development. J. Resour. Ecol. 2025, 16, 786–801. [Google Scholar]
Figure 1. Geographic distribution map of research area.
Sustainability 17 06134 g001
Figure 2. Research framework.
Sustainability 17 06134 g002
Figure 3. Temporal and spatial evolution of GPF. (a), (b), (c), and (d) represent the years 2010, 2015, 2020, and 2022, respectively.
Sustainability 17 06134 g003
Figure 4. Temporal and spatial evolution of SCF. (a), (b), (c), and (d) represent the years 2010, 2015, 2020, and 2022, respectively.
Sustainability 17 06134 g004
Figure 5. Temporal and spatial evolution of EMF. (a), (b), (c), and (d) represent the years 2010, 2015, 2020, and 2022, respectively.
Sustainability 17 06134 g005
Figure 6. Temporal and spatial evolution of CCD multifunctionality of cultivated land. (a), (b), (c), and (d) represent the years 2010, 2015, 2020, and 2022, respectively.
Sustainability 17 06134 g006
Figure 7. Changes in the degree types (a) and proportion (b) of CCD multifunctionality of cultivated land.
Sustainability 17 06134 g007
Figure 8. Scatter plots of the degree of CCD of cultivated land multifunctionality. (a), (b), (c), and (d) represent the years 2010, 2015, 2020, and 2022, respectively.
Sustainability 17 06134 g008
Figure 9. Spatial pattern of the degree of cultivated land multifunctionality CCD. (a), (b), (c), and (d) represent the years 2010, 2015, 2020, and 2022, respectively.
Sustainability 17 06134 g009
Figure 10. Interaction factor detection results, with (a), (b), (c), and (d) representing 2010, 2015, 2020, and 2022, respectively.
Sustainability 17 06134 g010
Table 1. Construction of the evaluation indicator system for cultivated land multifunctionality.
DimensionIndicatorsUnitDescription of IndicatorsAttributesWeight
GPFGrain yield per unit area of cultivated landkg/hmGrain yield/total area of cultivated land+0.012
Vegetable yield per unit area of cultivated landkg/hmVegetable yield/total area of cultivated land+0.004
Oil crop yield per unit area of cultivated landkg/hmOil crop yield/total area of cultivated land+0.005
Cropping index%Total sown area of crops/total area of cultivated land+0.080
Land reclamation rate%Cultivated land/total area+0.104
SCFPer capita grain security rate%Grain yield/(total population × 400 kg) × 100%+0.147
Per capita cultivated land areaPer/hmCultivated land/rural permanent resident population+0.104
Urban–rural per capita disposable income ratio%Urban disposable income/rural disposable income0.086
The proportion of total agricultural output value%Agricultural total output value/GDP+0.090
EMFCultivated land fragmentationCultivated land patches/total area of cultivated land0.095
Ecological dominance of cultivated land types%Paddy field area/total area of cultivated land+0.097
Chemical load of cultivated landkg/hmSafe standard of fertilizer application/(fertilizer application (pure amount)/cultivated land area)0.076
Proportion of ecological land use%Cultivated land/(total area—construction land)+0.100
Table 2. Classification of CCD of cultivated land multifunctionality.
The Value Range of the CCD The Degree of Coupling Coordination
[0.0~0.1)Extremely imbalanced
[0.1~0.2)Severely imbalanced
[0.2~0.3)Moderately imbalanced
[0.3~0.4)Mildly imbalanced
[0.4~0.5)Borderline imbalanced
[0.5~0.6)Barely coordinated
[0.6~0.7)Primary coordination
[0.7~0.8)Intermediate coordination
[0.8~0.9)Good coordination
[0.9~1.0]High-quality coordination
Table 3. Index system of factors influencing the coupling coordination of cultivated land multifunctionality.
Influencing FactorsIndicatorsVariable Code
Natural conditionsAverage slopeX1
Average altitudeX2
Annual average precipitationX3
Annual average temperatureX4
Economic levelPer capita GDPX5
Proportion of the added value of the primary industry in GDPX6
Rural residents’ disposable incomeX7
Social developmentAgricultural comparative benefitsX8
Urbanization rateX9
Total mechanical power per unit area of cultivated landX10
Table 4. Types of factor interaction.
StandardType
q(x1∩x2) < Min[q(x1),q(x2)]Nonlinear weakening
Min[q(x1), q(x2)] < q(x1∩x2) < Max[q(x1), q(x2)]One-factor nonlinear weakening
q(x1∩x2) > Min[q(x1), q(x2)]Bilateral factor enhancement
q(x1∩x2) = q(x1) + q(x2)Independence
q(x1∩x2) > q(x1) + q(x2)Nonlinear enhancement
Table 5. Influencing factor detection results of CCD for multiple functions of cultivated land in the YREB from 2010 to 2022.
2010201520202022
FactorqFactorqFactorqFactorq
X10.57X10.67 X10.57 X10.53
X20.42 X20.60 X20.54 X20.56
X30.10 X30.12 X30.06 X30.04
X40.32 X40.32 X40.33 X40.30
X50.05 X50.04 X50.05 X50.04
X60.08 X60.07 X60.14 X60.11
X70.17 X70.18 X70.26 X70.22
X80.12 X80.01 X80.12 X80.10
X90.17 X90.15 X90.27 X90.26
X100.08 X100.16 X100.25 X100.26
Disclaimer/Publisher’s Note: The statements, opinions and data contained in all publications are solely those of the individual author(s) and contributor(s) and not of MDPI and/or the editor(s). MDPI and/or the editor(s) disclaim responsibility for any injury to people or property resulting from any ideas, methods, instructions or products referred to in the content.

