1. Introduction
Urban green spaces play a vital role in enhancing the quality of life in cities by improving air quality, reducing urban heat, and providing recreational areas for residents. They contribute significantly to environmental sustainability and urban resilience, particularly in dry regions where green spaces are scarce [
1]. Research shows that the expansion of urban greenery can mitigate climate impacts and improve public well-being, making it a major key to sustainable urban development initiatives.
The “Green Riyadh” initiative [
2] is a transformative project, launched in 2019, aimed to enhance the sustainability of Riyadh City, the capital city of Saudi Arabia. As part of the Kingdom’s Vision 2030, this initiative focuses on expanding green spaces, improving air and water quality, and fostering a more ecologically balanced urban environment for residents. Specifically, it aims to increase the city’s green cover by planting 7.5 million trees in diverse locations, including 3330 neighborhood gardens, parks, streets, schools, mosques, and healthcare facilities [
3].
However, accurately assessing and monitoring green areas remains a critical challenge. Current and traditional techniques for assessing green spaces and quantifying tree density often lack the accuracy and consistency needed for efficient monitoring and strategic planning [
4,
5]. To address these challenges, this paper aims to fill this gap by utilizing state-of-the-art techniques, including live satellite imagery retrieval and advanced image detection techniques, to assist decision-makers in assessing the condition of green spaces. Satellite imagery enables fast and large-scale analysis of green zones compared to traditional methods, while advanced image detection algorithms identify specific patterns in tree and plant distributions, allowing precise quantification of tree numbers and green area density. This novel approach generates reliable data for evaluating the progress of the “Green Riyadh” project and supports data-driven decision-making processes for future planning [
6].
In particular, we develop a dual pipeline methodology integrating Sentinel-2 NDVI analysis for green area coverage and deep learning techniques for precise tree counting. This novel methodology provides a macro (percentage of green areas) and micro (individual tree counts) view of urban greenery, enabling a comprehensive assessment of Riyadh’s greenery and green initiatives like the “Green Riyadh initiative”. Specifically, our work gathers a unique dataset using high-resolution imagery from Google Earth Maxar Technologies and Sentinel-2 satellites. Through augmentation, we expanded 732 high-resolution images to 6647, enhancing model robustness. This diverse dataset supports precise tree detection and broad-scale green area analysis across Riyadh’s urban landscape. Moreover, we investigate several state-of-the-art object detection models, including YOLOv7 [
7], YOLOv8 [
8], YOLOv11 [
9], and RT-DERT [
10]. Our chosen model for the methodology, YOLOv11, demonstrates exceptional performance metrics compared to the others, achieving a mean Average Precision (mAP@50) of 95.4%, precision of 94.6%, and recall of 90.2%. These results underscore its superior accuracy and efficiency in object detection tasks. By leveraging high-resolution satellite imagery, we fill the gap in the literature, offering a robust solution for detailed urban tree monitoring to support sustainable planning.
The implementation of our methodology not only enhances the “Green Riyadh” initiative’s ability to achieve its sustainability goals but also establishes a model for smart city development worldwide. Leveraging a similar methodology in urban centers globally can significantly contribute to achieving sustainable development goals (SDGs) by improving urban greenery and promoting environmental resilience. This paper explores the integration of satellite imagery and advanced image recognition in the “Green Riyadh” initiative. It emphasizes how this technological synergy addresses the critical challenges of measuring green coverage and greenery areas, ensuring more informed decision-making for a sustainable urban future. This paper contributes to the field of urban sustainability by introducing a replicable model for green space assessment, ultimately promoting a sustainable future for urban areas globally.
The main contributions of this paper can be summarized in three key aspects:
First, we collected a comprehensive dataset for Riyadh City using imagery from two different satellites, specifically aimed at evaluating green areas and estimating tree counts. This dataset provides a valuable resource for urban environmental studies.
Second, we developed a unique dual pipeline that operates in parallel and explored multiple state-of-the-art models, resulting in highly accurate results, with a precision rate of 94.6%. This innovative approach enhances the reliability of our analyses.
Third, our findings have been applied in a real-world scenario and are displayed on a user-friendly dashboard, facilitating accessibility for stakeholders and decision-makers interested in urban planning and environmental management.
The remainder of this paper is organized as follows:
Section 2 reviews the related work, highlighting key studies and methodologies that inform our research. In
Section 3, we present our methodology, detailing the processes of data collection and data preprocessing that support our analysis.
Section 4 discusses the results of our study, addressing both the findings and their limitations. Finally,
Section 5 provides a conclusion, summarizing the key insights and suggesting directions for future research.
2. Related Work
Satellite imagery has proven to be an invaluable tool in a wide range of applications such as urban planning, environmental monitoring, disaster management, and humanitarian aid. Studies in this domain focus on enhancing image quality, improving detection accuracy, and addressing challenges such as shadows and classification complexities. In this section, we provide a comprehensive overview of the existing research relevant to this study based on leveraging satellite imagery and advanced image recognition and classification techniques.
2.1. Satellite Imagery Across Different Domains
Satellite imagery has revolutionized research across numerous disciplines by providing a unique, close, and temporal view of the Earth’s surface. Dare [
11] addresses the challenge of shadows in high-resolution satellite imagery, specifically in urban areas. The research explores methods like thresholding and radiometric enhancement for shadow detection, demonstrating how effective shadow removal can enhance the clarity of urban imagery. The study, conducted using Melbourne, Australia, as a case study, highlights the varying efficacy of removal methods based on imaging conditions. In addition, Asokan et al. [
12] focused on satellite image processing techniques for classifying historical maps, emphasizing the dynamic nature of land boundaries. The study reviews methods like feature extraction, segmentation, and classification, stressing the importance of selecting the right techniques for accurate historical map analysis. Another work by Verbesselt et al. [
13] proposed a time-series-based approach for near real-time disturbance detection using satellite imagery. The study, applied to both simulated and real-world data (MODIS NDVI composites of Somalia), demonstrated the method’s robustness in identifying disturbances such as droughts without relying on specific thresholds or time series gap filling. This technique showcases the potential for global-scale monitoring of ecological disturbances.
Moreover, Gadamsetty et al. [
14] introduced a deep learning approach combining YOLOv3 and SHA-256 hashing to detect ships in satellite imagery. Their method, tested on a Kaggle dataset, ensured secure and accurate ship detection, improving performance under adverse weather conditions and securing sensitive maritime surveillance data. On the other hand, Yarlagadda et al. [
15] used Generative Adversarial Networks (GANs) and a one-class Support Vector Machine (SVM) to detect and localize forgeries in satellite images. The algorithm effectively identified forged areas, offering a significant advancement in satellite image forensics by ensuring the authenticity of the images.
Recently, Siok et al. [
16] proposed a new methodology for creating higher-quality remote sensing images by simulating a special high-resolution band from combined aerial and satellite data, which resulted in pan-sharpened images with significantly less spectral distortion than traditional methods. On the other hand, Bai et al. [
17] proposed a deep learning framework called MANET, which improved weather and cloud classification by fusing satellite image data with meteorological information like the season, date, and geographic location.
2.2. Image Recognition and Object Detection Across Different Domains
Image recognition and object detection are powerful computer vision technologies that have broad applications across many areas of the literature. For example, Iglovikov et al. [
18] achieved third place in the DSTL Satellite Imagery Feature Detection Kaggle competition by adapting a U-Net architecture for multispectral data. Their work significantly improved semantic segmentation quality by integrating data fusion strategies and training for specific classes, making their approach scalable for automated satellite feature labeling. Also, Al-Ghrairi et al. [
19] proposed a classification approach using color moments features and K-means clustering to categorize land cover in Baghdad, Iraq. Their method achieved an impressive 92.12% classification accuracy, improving land cover classification for urban environments by focusing on moment features like the mean, standard deviation, and skewness. Moreover, Sladojevic et al. [
20] developed a deep convolutional neural network (CNN) model for plant disease recognition using leaf images. With a dataset of 33,469 images, the model demonstrated an impressive classification accuracy of 96.3%, offering valuable insights for automated agricultural disease diagnosis.
Moreover, Sibiya and Sumbwanyambe [
21] utilized CNNs to identify maize leaf diseases, achieving high accuracy in distinguishing between different diseases. Their approach demonstrated the potential of deep learning in agricultural disease recognition, offering a robust solution for plant health monitoring. Also, He et al. [
22] explored the use of deep learning for forest tree species classification using Sentinel-2 satellite imagery on the Google Earth Engine. Their CNN-based method achieved over 90% accuracy, providing an effective and scalable approach for biodiversity monitoring. On the other hand, Sun et al. [
23] and Huixian [
24] also investigated the use of deep learning for plant species identification. Sun’s team achieved a 91.78% recognition rate with a 26-layer deep learning model applied to a large dataset of 10,000 plant images, while Huixian’s research highlighted the superior performance of deep learning over traditional methods for plant recognition.
Furthermore, Bodhwani et al. [
25] employed deep residual networks to classify tree species from the LeafSnap dataset, achieving a 93.09% recognition rate. Their work demonstrates the power of deep residual networks in botanical species classification, significantly advancing identification accuracy. Additionally, Kanda et al. [
26] focused on using fine-tuned residual neural networks for recognizing tomato leaf diseases. Their study achieved a remarkable 99.5% F1-score, showcasing the efficiency and robustness of their deep learning model for plant disease identification.
Recently, transformer-based models have gained significant attention in object detection tasks. These models, particularly those based on the Real-Time Detection Transformer (RT-DETR) architecture, have demonstrated strong performance in identifying and localizing objects with high precision and efficiency. For instance, RT-DETR has been utilized in various detection tasks, such as tomato fruit detection [
27,
28], emergency vehicle detection [
29], and forest smoke detection [
30].
3. Methodology
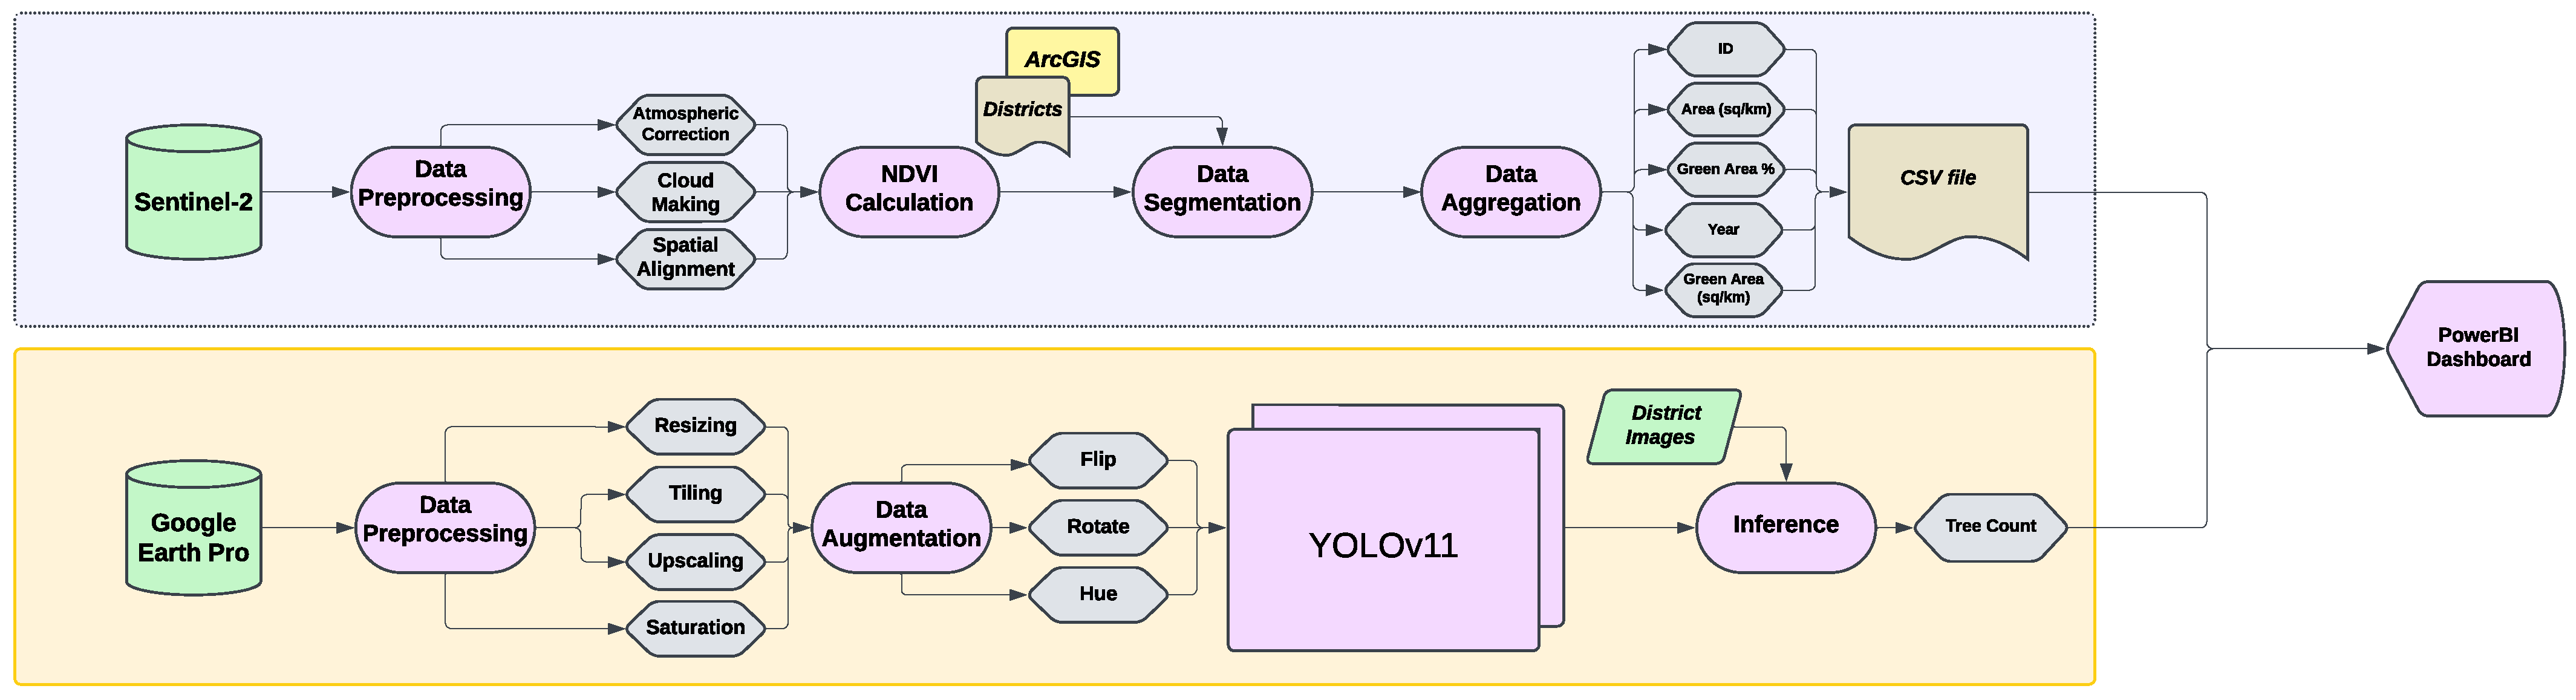
Our methodology for evaluating green areas and measuring tree density consists of two main pipelines, as shown in
Figure 1, where both pipelines complement each other. The first pipeline focuses on the extent of greenery (i.e., green area percentage and coverage) using the NDVI technique, while the second pipeline quantifies the number of trees in each district of Riyadh City using YOLOv11. The integrated results are then visualized in a unified dashboard, enabling stakeholders to comprehensively assess Riyadh’s urban greenery. This novel methodology supports sustainable urban planning initiatives like the “Green Riyadh” project by providing actionable insights for enhancing green spaces. The following sections illustrate each part extensively.
3.1. Data Collection
After reviewing potential data sources, we have chosen to utilize Google Earth and Sentinel-2 for our satellite imagery needs. This decision was based on their ability to provide the highest resolution imagery available with free access, which is crucial for detailed vegetation analysis in urban settings like the city of Riyadh. Additionally, Google Earth offers the capability to access historical satellite images across different time periods. This feature is particularly valuable as it enables us to track changes over time and assess the effectiveness of the "Green Riyadh" initiative in enhancing urban green spaces.
Table 1 presents a comparison of different satellite data sources based on three criteria: image resolution, accessibility, and update frequency.
In particular, we have collected two datasets that complement each other from two different satellite imagery sources, as follows:
Sentinel-2: (
eos.com) Sentinel-2 provides multispectral imagery across 13 bands with a spatial resolution of 10–60 m. Sentinel-2 is widely used for vegetation monitoring and NDVI computation due to its free accessibility and high-quality data [
31]. With a resolution of 10–20 m, Sentinel-2 provides us with data to calculate the Normalized Difference Vegetation Index (NDVI) [
32], which measures vegetation density and health. By calculating NDVI, we can estimate how much of each district is covered in green spaces, including trees, grass, and other vegetation.
Google Earth Maxar Technologies: (
maxar.com) The dataset for our tree detection pipeline consisted of high-resolution, orthorectified imagery acquired from the Google Earth Pro platform. These visual data originate from Maxar Technologies’ WorldView-3 and WorldView-4 sensing platforms [
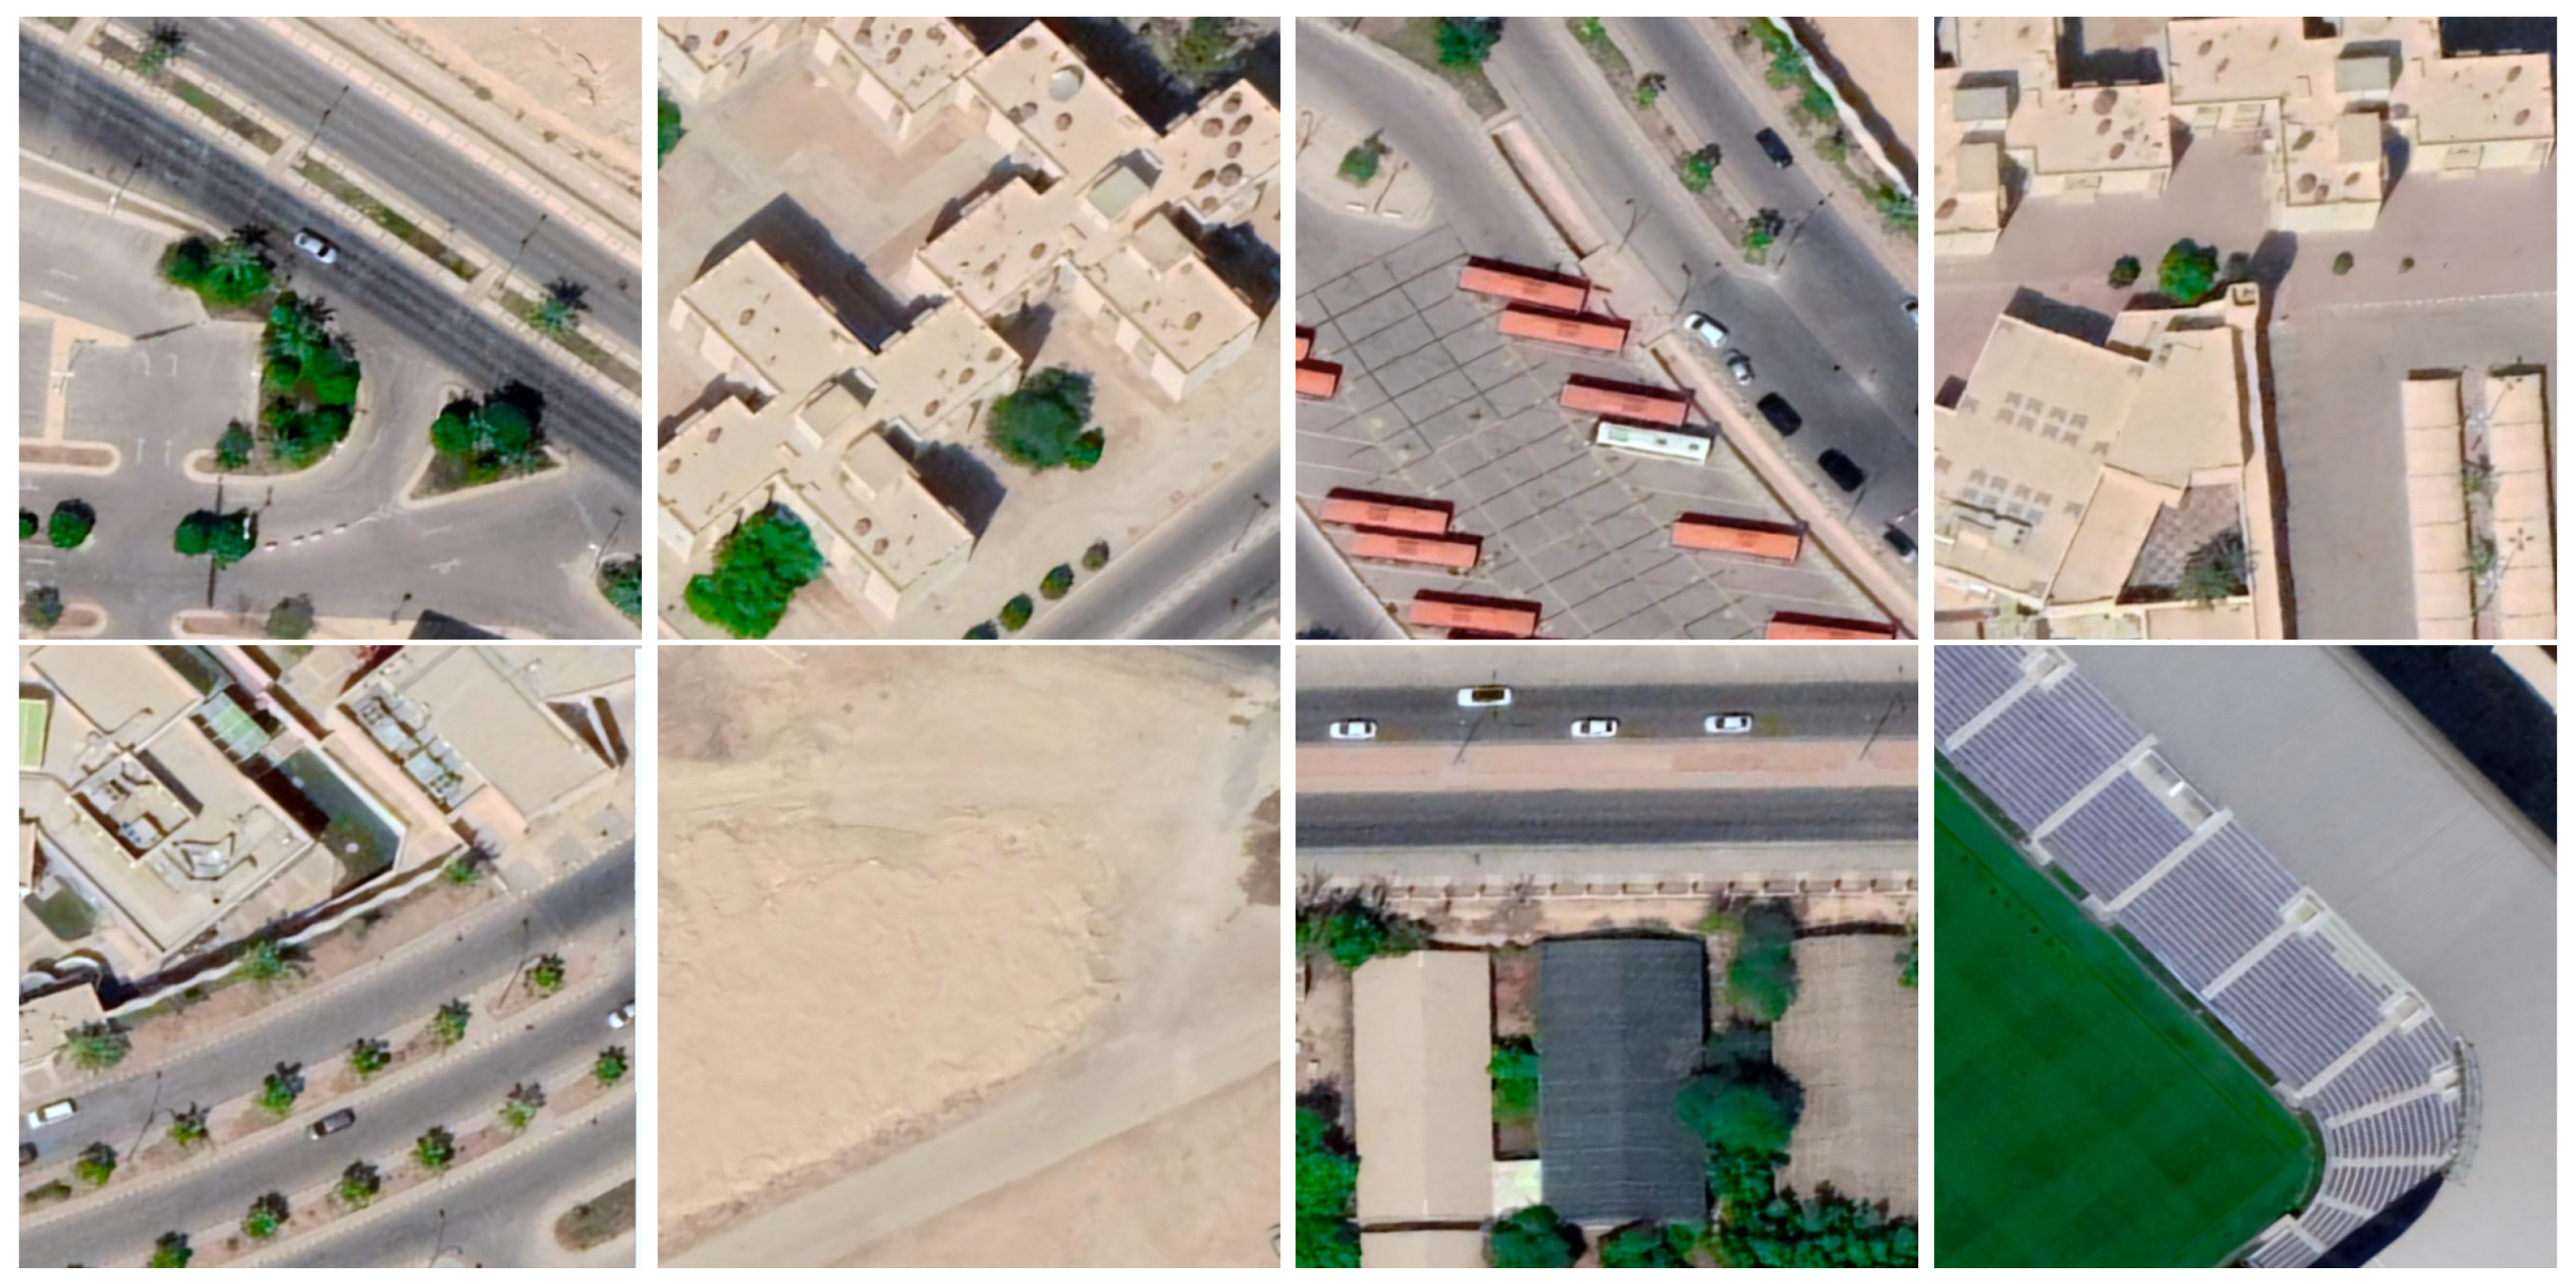
33]. The imagery utilized is a vendor-processed product. The data accessible via Google Earth has undergone significant preprocessing, including radiometric and geometric corrections, and is delivered as a pan-sharpened composite. This data fusion technique merges the high spatial resolution of the satellite’s panchromatic sensor, which provides a resolution of 0.31 m, with the spectral information from its lower-resolution multispectral bands (with a resolution of 1.24 m). The result is a single raster dataset with high spatial detail and natural color representation. We downloaded 61 images captured in August 2022 covering the urban extent of Riyadh. Each image covers an area of 367 m × 141.5 m, with an altitude of 318 m. We then tiled each one of them into 12 smaller images, resulting in a total of 732 images. These very high-resolution images (30 cm × 30 cm) per pixel are suitable for tree detection, allowing us to pinpoint individual trees, even in densely built urban areas. This level of detail is crucial for accurately counting trees in Riyadh, as it helps us detect small clusters of trees or isolated green spaces that might otherwise be missed. Initial labeling identified 6200 trees across the images. Through data augmentation techniques, we expanded the dataset to 6647 images, enhancing the reliability and comprehensiveness of our urban tree mapping analysis. Moreover, we took into consideration gathering images from various districts across Riyadh. This diversity in geographic data allowed the model to adapt to varying tree densities, levels of urbanization, and types of vegetation found throughout the city, improving its ability to generalize across different areas. A sample of this dataset is shown in
Figure 2.
3.2. Data Preprocessing
After collecting our two datasets designated for different pipelines, several preprocessing steps were carried out on both Sentinel-2 and Google Earth Maxar Technologies data to ensure that the imagery was clean, consistent, and ready for further analysis. More details are provided in the following subsections.
3.2.1. Data Preprocessing for Sentinel-2 Imagery
The images collected from Sentinel-2 for evaluating green areas in the first pipeline underwent three key preprocessing stages, as follows:
Atmospheric Correction: This step removes atmospheric effects to enhance the clarity of the imagery, ensuring that the data accurately reflects the land surface.
Cloud Masking: Clouds can significantly distort measurements; therefore, this process filters out cloud cover, allowing for more accurate assessments of greenery.
Spatial Alignment: To facilitate accurate comparisons and analyses, the satellite images are aligned to a consistent spatial grid, ensuring that different images can be accurately overlaid and analyzed together.
These preprocessing steps are crucial for obtaining reliable data for further analysis of urban greenery.
3.2.2. Data Preprocessing for Google Earth Imagery
On the other hand, the images collected from Google Earth for the purpose of counting the number of trees in the second pipeline underwent multiple preprocessing stages, as follows:
Resizing and Tiling: This step involved standardizing image dimensions and splitting large images into smaller, manageable tiles. This approach facilitates easier processing and analysis of specific areas.
Adjusting Brightness and Contrast: The high-resolution images underwent processing to enhance the visibility of trees and green areas. Image enhancement techniques were employed to adjust brightness and contrast, making trees stand out clearly against the urban background. This adjustment was crucial for facilitating easier tree detection. The tool used for this image processing was Darktable [
34], which allowed for precise modifications, improving the clarity and accuracy of tree identification in the urban landscape.
Upscaling: We applied an upscaling method using Ultramix Balanced [
35], which enhanced the resolution of the images while preserving a natural appearance. This step improved the model’s ability to detect smaller trees or clusters that may have been less noticeable in lower-resolution images. It was particularly important in urban areas where tree coverage is often sparse or fragmented.
Saturation Adjustment: To further enhance the model’s ability to detect trees, we increased the saturation of each image by 50%. This adjustment made the green areas, such as tree canopies, more vibrant and easily distinguishable. The higher saturation was especially useful for analyzing urban environments with mixed vegetation, helping the model differentiate between vegetation and surrounding urban features, thus improving detection accuracy.
Data Augmentation: To enhance the robustness of our tree detection model, especially in areas with sparse tree coverage, we implemented various data augmentation techniques, including the following:
- -
Rotation: We rotated the images at 90-degree and 15-degree angles to simulate different orientations of tree canopies. This helped the model learn to recognize trees from various angles, improving its detection capabilities regardless of the trees’ orientation in the image.
- -
Flipping: This technique exposed the model to different perspectives, aiding its ability to detect trees from both left and right orientations.
- -
Hue Adjustment: We applied a 15% increase and decrease in hue to simulate changes in lighting and environmental conditions. This variation helped the model generalize better to different seasonal changes, weather conditions, and time-of-day lighting, thereby increasing its ability to detect trees under varying circumstances.
These preprocessing steps were essential in preparing the dataset for effective tree detection, ultimately enhancing the accuracy and reliability of the analysis in urban settings.
3.3. Greenery Assessment Process
Vegetation indices play a critical role in quantifying green spaces and assessing vegetation health. In this study, the Normalized Difference Vegetation Index (NDVI) [
32] is used to evaluate the distribution and irrigation status of vegetation using the images taken from Sentinel-2 in our first pipeline. NDVI is calculated using the reflectance values from the near-infrared (NIR) and visible red bands of satellite imagery, which correspond to Band 8 (NIR) and Band 4 (RED) in most satellite sensors, such as Sentinel and Landsat. It is expressed as
NDVI values range from −1 to +1, where higher values indicate healthier vegetation. This index is particularly effective in distinguishing greenery areas, which is essential for tracking the progress of urban greening projects in arid regions like Riyadh. An NDVI threshold of 0.1 was set for green area detection. This value was deliberately selected to accurately reflect the unique environmental context of the study area. Since Riyadh is largely a desert region with limited natural vegetation, this threshold was chosen to identify even sparse vegetation. A lower threshold is crucial for capturing areas with low-density green cover—such as scattered trees or nascent greening projects—that a higher threshold might otherwise exclude. This inclusive methodology is essential for effectively tracking the progress of urban greening projects in arid regions like Riyadh. By ensuring that all forms of vegetation are detected, this approach allows for a more comprehensive and realistic assessment of initiatives like the “Green Riyadh Project”.
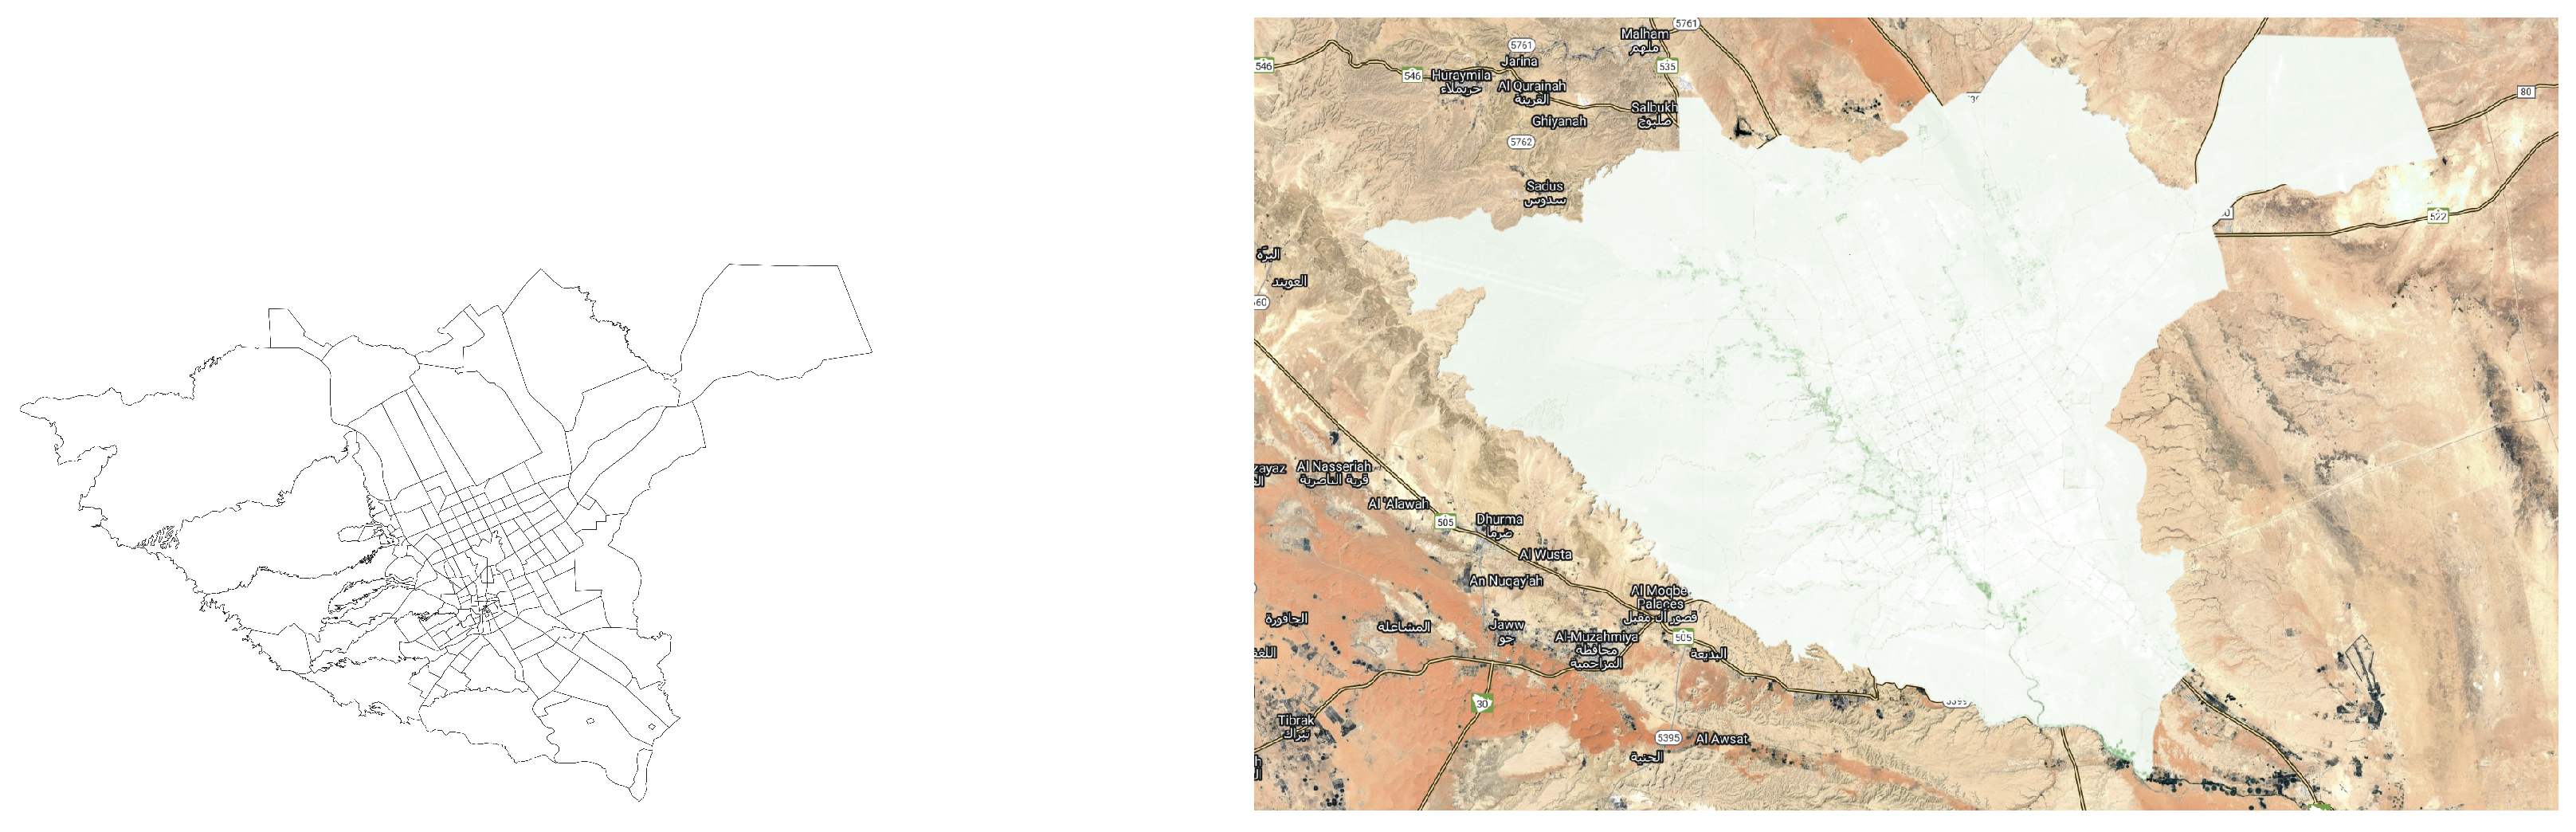
In particular, the mean NDVI was computed for each year from 2016 to 2024 to capture annual variations in green areas. This allowed the assessment of trends in vegetation over time and the determination of how green spaces had expanded or decreased across different districts of Riyadh. After calculating the mean NDVI for each year, a layout, using ArcGIS, was applied to the city of Riyadh, where it is segmented into districts. Therefore, we calculate the NDVI for each district in Riyadh. By averaging the NDVI values within the district boundaries, the data reflected the specific green area within each district, giving a more localized understanding of vegetation distribution. Specifically, we calculated the total area in km2, the green area in km2, and the percentage of green area for each district to show them later on a user-friendly dashboard.
3.4. Tress Counting Process
Accurately counting trees presents a significant challenge, yet it plays a crucial role in supporting urban planners and decision-makers in the strategic distribution of greenery across cities. Therefore, we adopt a transfer learning approach using the YOLOv11 model. Prior to fine-tuning the model, we partitioned our collected dataset into three subsets—training, validation, and testing—to ensure a robust and unbiased evaluation of model performance:
Training (70%): This subset was used to train the model to recognize trees by showing it a variety of images from different districts.
Validation (10%): During training, we used this data to monitor the model’s performance and adjusted the hyperparameters to prevent overfitting and for early-stopping training.
Testing (20%): After training, we evaluated the model’s performance on this unseen data to assess how well it generalized to new images.
Object detection is a core component of this study, employed to identify and count trees within satellite imagery. The YOLOv11 [
9] algorithm, an advanced version of the YOLO (You Only Look Once) series [
36], is adopted for its high accuracy and efficiency in detecting objects in real time. YOLOv11 processes satellite images by predicting bounding boxes and class probabilities in a single step, ensuring the precise detection of small and densely packed objects, such as trees. This capability makes YOLOv11 an ideal choice for monitoring urban green spaces, where vegetation distribution is often non-uniform.
3.5. Evaluation Metrics
The primary objective of the evaluation metrics is to ensure that our methodology produces reliable and accurate results. To achieve this, we used the following key metrics:
Precision: The precision of a model is calculated to assess how many of the predicted trees were actually true positives (correct detections). The formula for precision is given by
Recall: The recall of a model is used to measure how many of the true trees in the dataset were correctly detected by the model. The formula for the recall is
F1-Score: The F1-score combines precision and recall into a single metric, balancing the trade-off between the two. The formula for the F1-score is
mAP@k: The mean Average Precision (mAP) at an Intersection over Union (IoU) threshold of k is defined as
4. Results and Analysis
To evaluate the effectiveness of our work and the proposed dual pipeline approach, we seek to address three key research questions:
RQ1:To what extent can our methodology accurately assess the rate of greenery evolution across different districts in Riyadh?
RQ2: Can our proposed methodology reliably quantify the number of trees within various districts?
RQ3: Can the results generated by the dual pipeline be effectively visualized in a user-friendly dashboard to support decision-making processes?
The following subsections address these research questions.
4.1. RQ1: Rate of Greenery Evolution in Riyadh
The first pipeline in our methodology aims to evaluate an area’s greenery evolution. The NDVI analysis, which is shown in
Figure 3, revealed that the rate of greenery evolution in Riyadh is not uniform across districts. While some districts, such as Al Dubiyah, showed a significant increase in green coverage (+6.9% from 2016 to 2024), the overall city experienced a slight decrease in greenery by 0.67% during the same period. This suggests that, despite some areas showing improvement, many districts have seen a decline in green coverage, with 144 out of 193 neighborhoods reporting decreases in greenery. Before the launch of the “Green Riyadh” initiative in 2018, the decline in greenery was even more pronounced, at 0.86% from 2016 to 2018. However, the initiative’s announcement in 2019 appears to have had a positive effect, with a 0.45% increase in greenery from 2018 to 2020. These findings demonstrate that the rate of greenery evolution in Riyadh is influenced by both urban expansion and urban greening policies, such as the “Green Riyadh” initiative, which has had a mixed but generally positive impact on the city’s green cover.
While urban expansion is often associated with a reduction in green spaces, the results from this study suggest that some neighborhoods in Riyadh have managed to increase green coverage despite rapid urban growth. Specifically, neighborhoods in the northern part of the city, such as the AlMalqa, AlYasmeen, and AnNarjis districts, demonstrated notable increases in greenery from 2016 to 2024. For example, AlMalqa district experienced a 2.68% increase in green coverage, and AlYasmeen district saw a 0.57% increase in green coverage, while AnNarjis had a 0.73% increase in green coverage. These findings suggest that, contrary to the typical expectation of green space loss with urban expansion, some districts have successfully integrated greenery into urban development. This partially validates the hypothesis, indicating that urban expansion can be managed in such a way that it not only preserves but also enhances green areas, provided that strategic urban planning and green space initiatives are prioritized.
4.2. RQ2: Number of Trees in Riyadh
The second pipeline in our methodology focuses on accurately counting the number of trees within a designated area. To achieve this, we fine-tuned several object detection models, including YOLOv7 [
7], YOLOv8 [
8], YOLOv11 [
9], and RT-DERT [
10]. The performance results presented in
Table 2 illustrate the effectiveness of these models, with YOLOv11 achieving a mean Average Precision (mAP@50) of 95.4%, a mAP@50-95 of 71.7%, a precision of 94.6%, and a recall of 90.2%. While RT-DERT delivers competitive results comparable to YOLOv11, its significantly slower processing time makes YOLOv11 the superior choice. These findings provide valuable insights into the effectiveness of our model selection for tree detection.
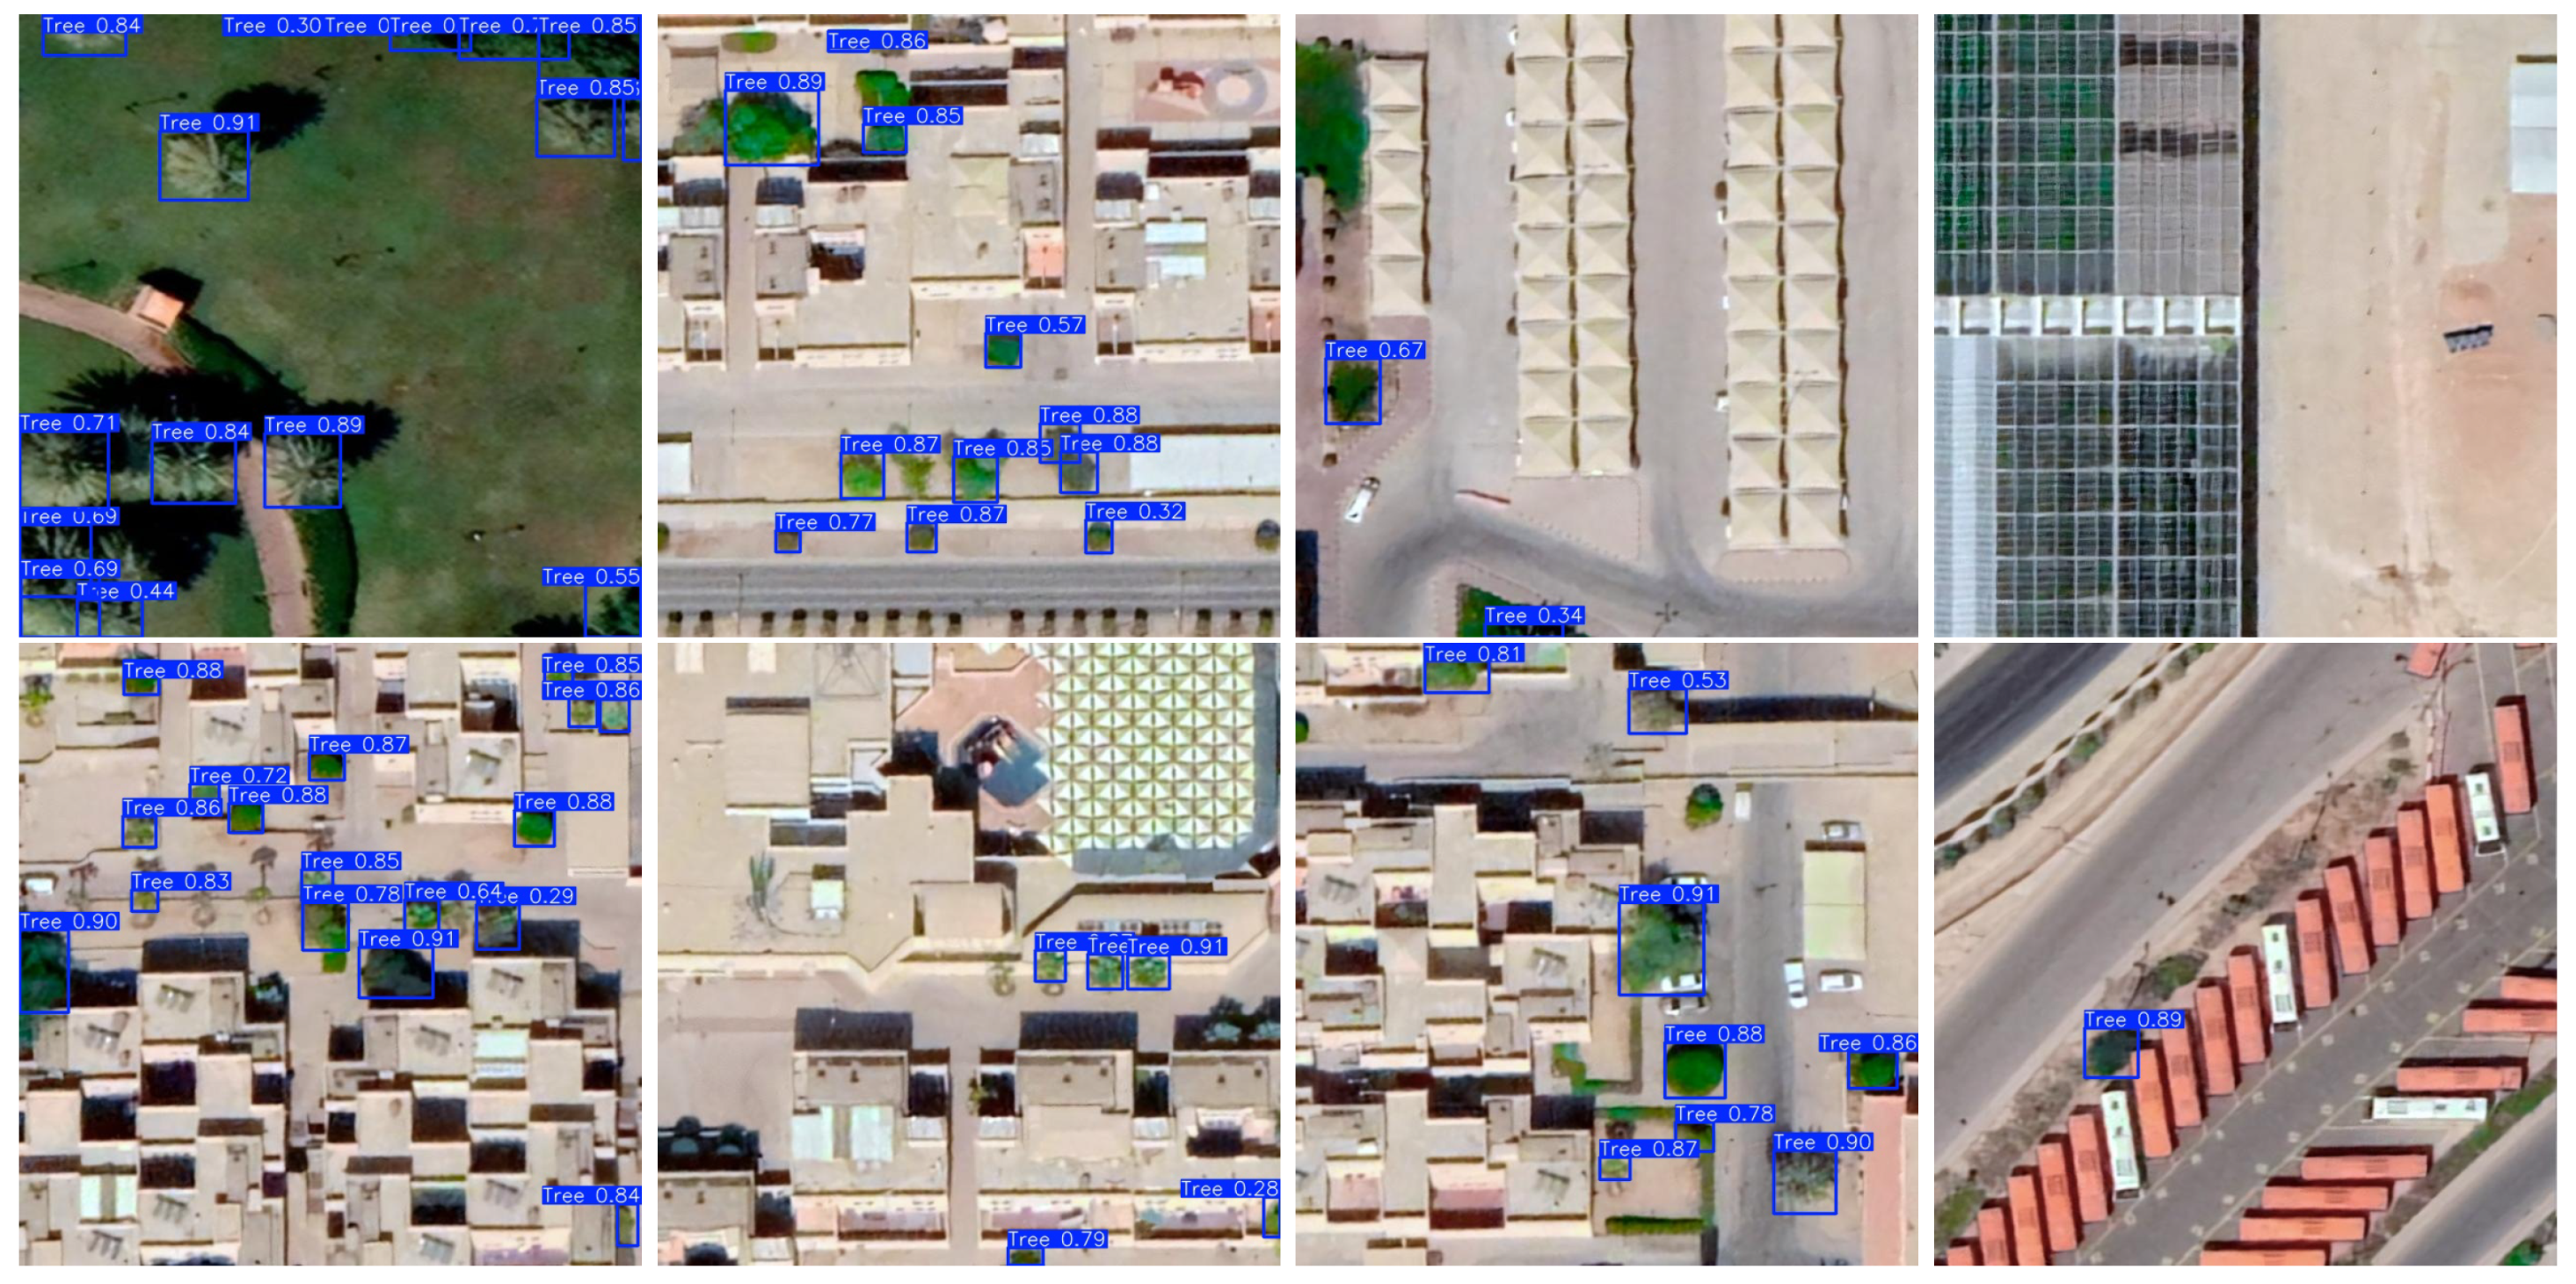
For instance, in the AlSalam district, our model detects a total of 1651 trees in this area. The images from this district showcased the model’s ability to identify trees in a relatively less urbanized environment, with varying tree densities and sizes. In another example from King Saud University (KSU) district, a much larger number of trees were detected, with 10,104 trees identified. This higher count can be attributed to the larger area covered by the university, which includes extensive green spaces, campuses, and surrounding landscapes, providing a higher tree density compared to other districts. Sample results from the model detection are shown in
Figure 4.
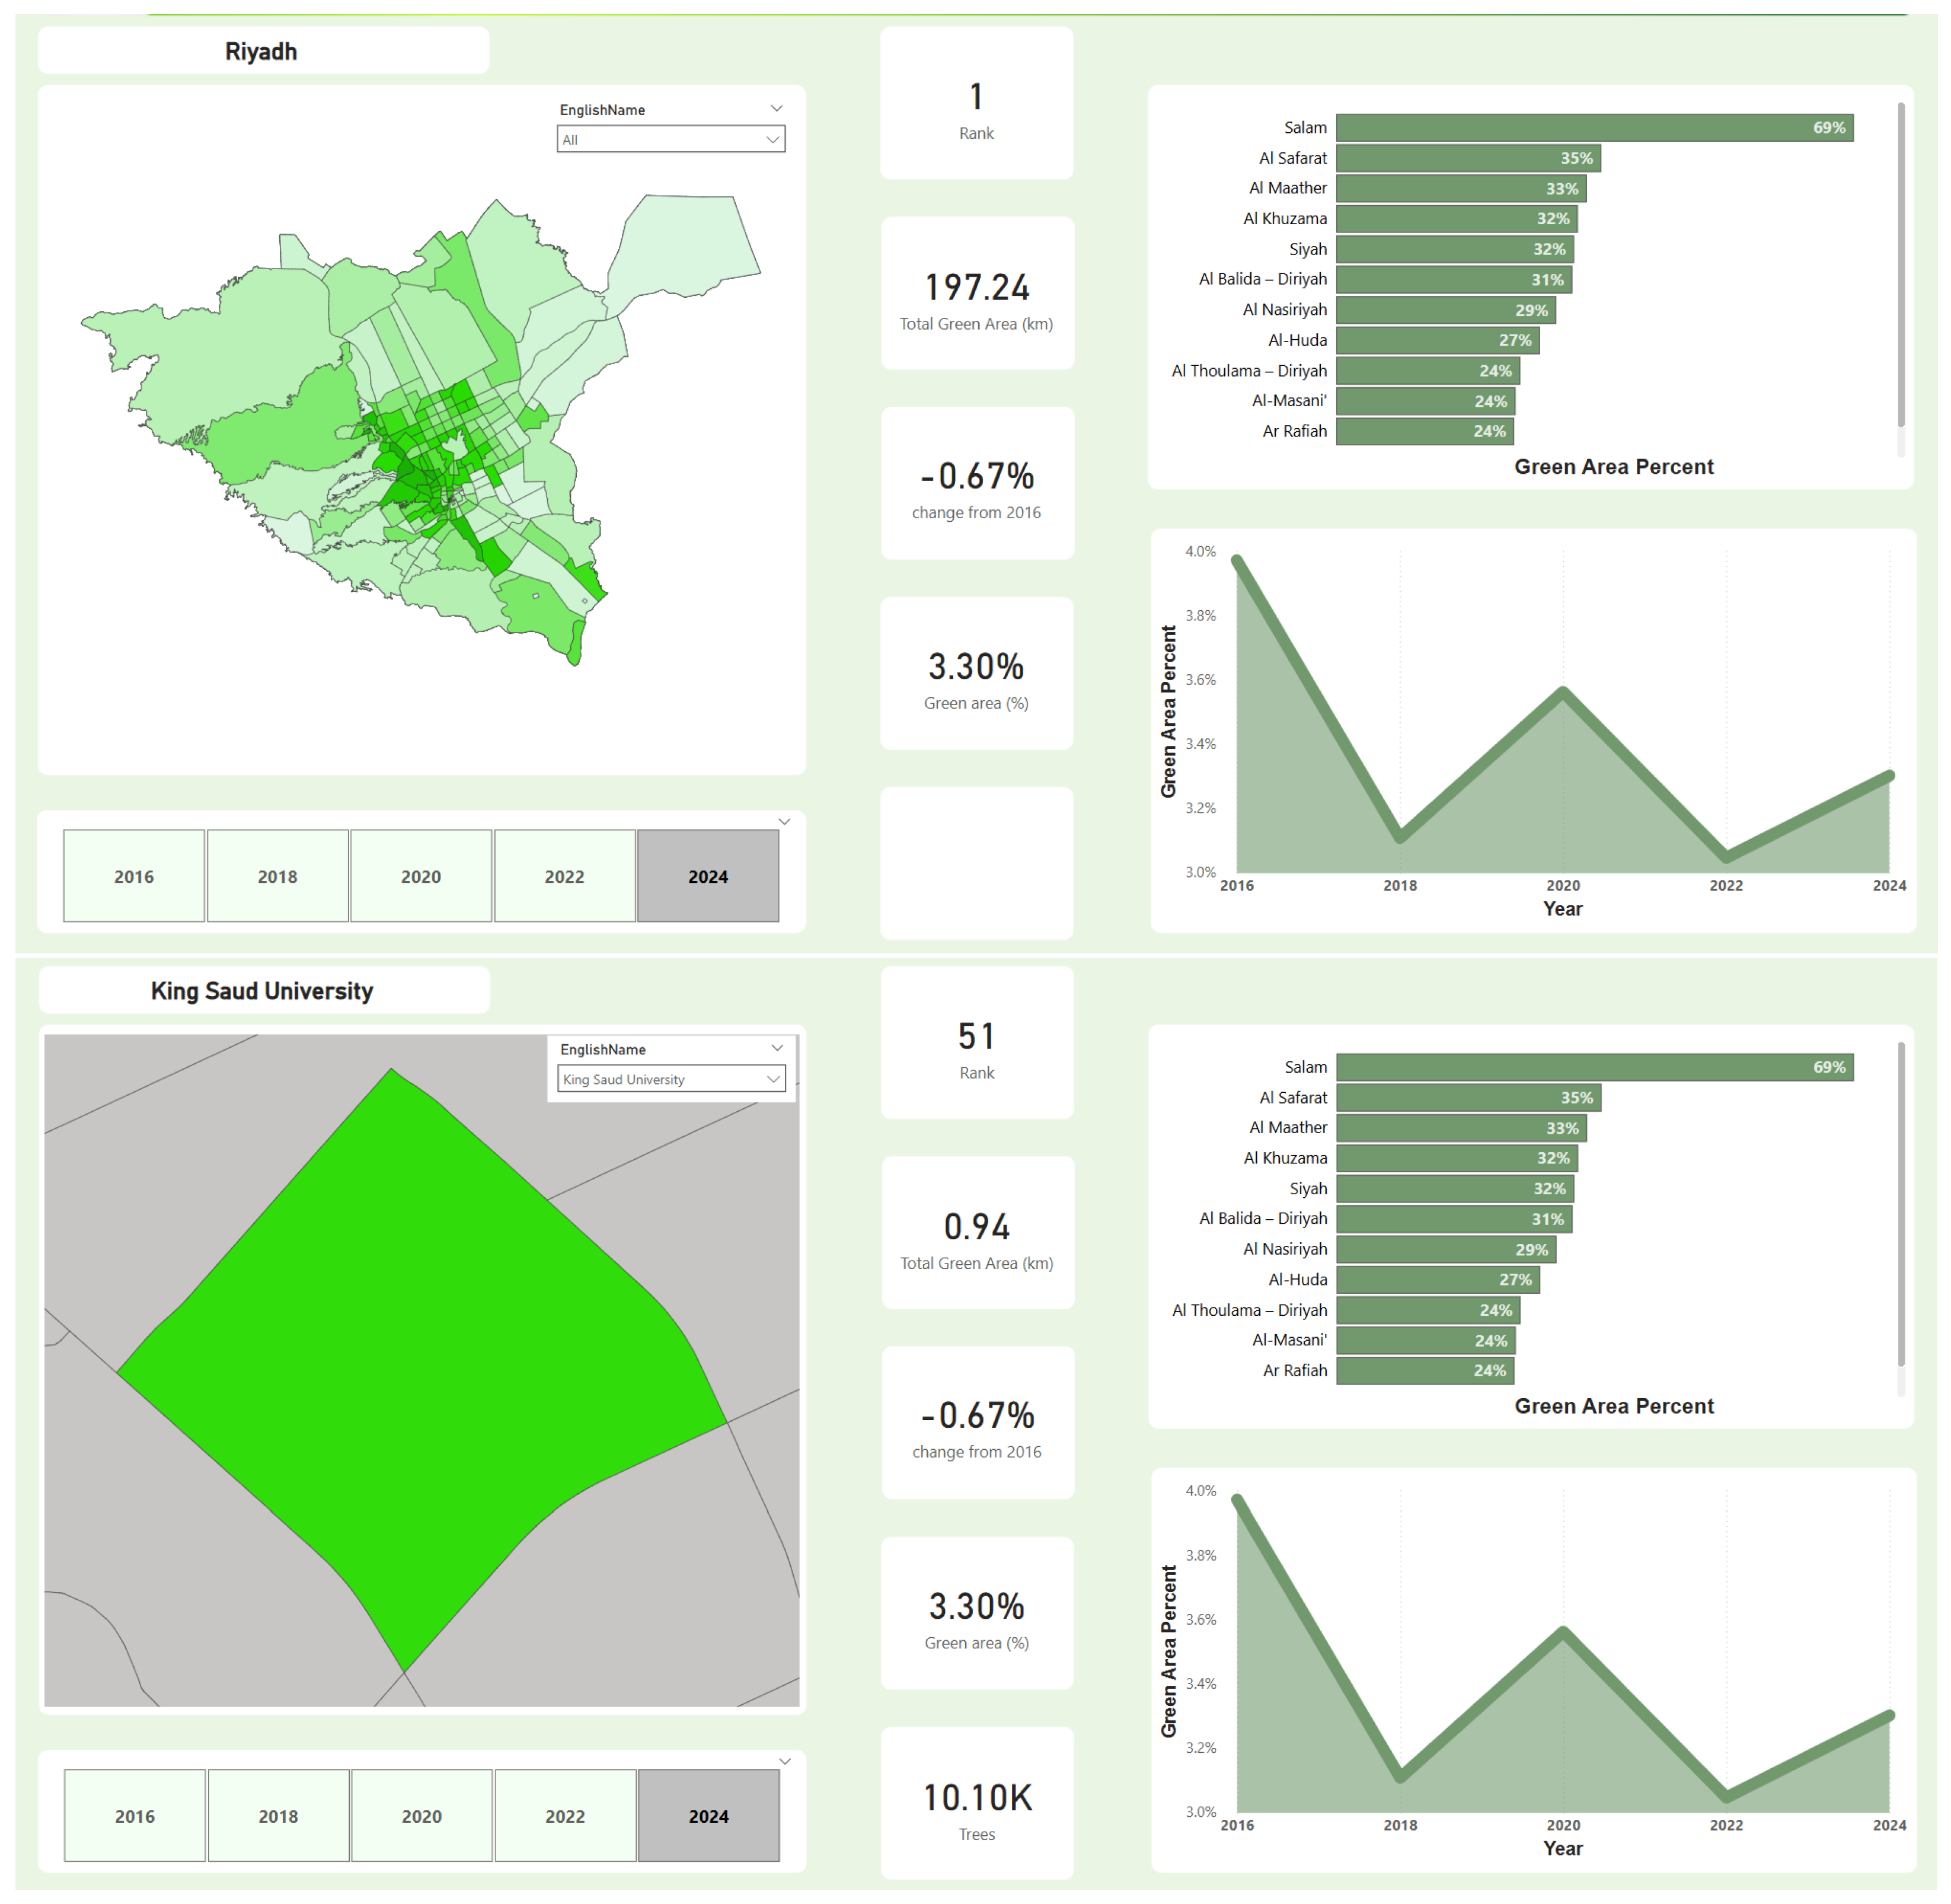
4.3. RQ3: Designing User-Friendly Dashboard
Our findings are not just theoretical—we have applied them to a real-world scenario and made them accessible.
Figure 5 displays samples of the results on a user-friendly dashboard, making it easy for urban planners and environmental managers to obtain the insights they need.
To ensure the results of our analysis are accessible and actionable for stakeholders, we developed an interactive dashboard using Power BI. This dashboard serves as a decision support tool, translating the complex data from our dual pipeline methodology into clear and intuitive visualizations. The dashboard is designed to be highly interactive, allowing users such as urban planners and environmental managers to perform spatio-temporal analysis by filtering the data based on specific districts and years. This functionality enables the dynamic visualization of key metrics, including the total green area, the percentage of green coverage, and the quantified number of trees, which update in response to user selections. The system’s architecture populates the dashboard with data processed through our analytical pipelines. Green area coverage is calculated via NDVI analysis on Sentinel-2 imagery, a process conducted on the Google Earth Engine platform. Concurrently, tree counts are quantified from high-resolution Google Earth Maxar Technologies imagery using our custom-trained YOLOv11 model. The resulting aggregated data is then loaded into Power BI for visualization. While the current implementation operates on periodically updated offline data, the modular nature of the pipeline is designed to be extensible and could be adapted in the future to ingest live data feeds for near real-time monitoring. This approach makes our findings readily available and empowers data-driven decision-making for urban greening initiatives.
5. Conclusions
This study introduces a novel and practical approach for assessing urban green spaces by integrating high-resolution satellite imagery with the YOLOv11 object detection model, significantly enhancing green space evaluation’s accuracy, scalability, and reliability compared to traditional methods. Applied within the context of the “Green Riyadh” initiative, the proposed methodology effectively quantifies vegetation density and identifies tree counts and distributions, serving as a critical tool for environmental monitoring and data-driven urban planning. The findings highlight the potential of the proposed dual pipeline to support large-scale ecological initiatives through continuous and objective progress tracking toward sustainability goals. Designed to be both adaptable and transferable, the methodology offers a robust framework applicable to cities worldwide facing similar urban sustainability challenges.
Despite the use of advanced object detection models, not all trees were successfully identified in the satellite imagery. Several factors contribute to this limitation. First, visibility challenges—such as trees appearing semi-transparent or being partially obscured by buildings, shadows, or other vegetation—can hinder accurate detection. Second, smaller trees, particularly saplings or shrubs, may fall below the model’s detection threshold due to their limited size and lower visual prominence.
A key direction for future work is acquiring very high-resolution (VHR) satellite imagery to enhance tree detection accuracy. VHR images, with resolutions finer than 30 cm, will provide more detailed data, allowing for better identification of trees, especially in densely built urban areas. This will improve the model’s ability to detect smaller or obscured trees and refine our understanding of urban greenery.
Author Contributions
Conceptualization, M.A.; methodology, M.A.; software, A.A. (Abdullah Alahmad), A.A. (Abdalrahman Alalwan), and F.A.; validation, M.A., A.A. (Abdullah Alahmad), and A.A. (Abdalrahman Alalwan); formal analysis, A.A. (Abdullah Alahmad) and A.A. (Abdalrahman Alalwan); investigation, M.A.; resources, M.A.; data curation, A.A. (Abdullah Alahmad) and A.A. (Abdalrahman Alalwan); writing—original draft preparation, M.A.; writing—review and editing, A.A. (Abdullah Alahmad), A.A. (Abdalrahman Alalwan), and F.A.; visualization, A.A. (Abdullah Alahmad).; supervision, M.A.; project administration, M.A.; funding acquisition, M.A. All authors have read and agreed to the published version of the manuscript.
Funding
This research is funded by the Ongoing Research Funding Program (ORF-2025-1225), King Saud University, Riyadh, Saudi Arabia.
Data Availability Statement
The data presented in this study is available on request from the corresponding author.
Acknowledgments
The authors extend their appreciation to King Saud University for funding this research through the Ongoing Research Funding Program (ORF-2025-1225), King Saud University, Riyadh, Saudi Arabia.
Conflicts of Interest
The authors declare no conflicts of interest.
References
- Paudel, S.; States, S.L. Urban green spaces and sustainability: Exploring the ecosystem services and disservices of grassy lawns versus floral meadows. Urban For. Urban Green. 2023, 84, 127932. [Google Scholar] [CrossRef]
- Saudi Vision 2030. Green Riyadh. Available online: https://www.vision2030.gov.sa/en/explore/projects/green-riyadh (accessed on 12 January 2025).
- Riyadh Development Authority. Green Riyadh Initiative. Available online: https://www.rcrc.gov.sa/en/projects/green-riyadh-project (accessed on 12 January 2025).
- Ajaz, A.; Karimi, P.; Cai, X.; De Fraiture, C.; Akhter, M.S. Statistical data collection methodologies of irrigated areas and their limitations: A review. Irrig. Drain. 2019, 68, 702–713. [Google Scholar] [CrossRef]
- Ahmed, Z.; Gui, D.; Murtaza, G.; Yunfei, L.; Ali, S. An overview of smart irrigation management for improving water productivity under climate change in drylands. Agronomy 2023, 13, 2113. [Google Scholar] [CrossRef]
- Amir, A. Counting Trees Using Satellite Images. GitHub Repository. 2021. Available online: https://github.com/A2Amir/Counting-Trees-using-Satellite-Images (accessed on 1 May 2025).
- Wang, C.Y.; Bochkovskiy, A.; Liao, H.Y.M. YOLOv7: Trainable bag-of-freebies sets new state-of-the-art for real-time object detectors. In Proceedings of the IEEE/CVF Conference on Computer Vision and Pattern Recognition, Vancouver, BC, Canada, 17–24 June 2023; pp. 7464–7475. [Google Scholar]
- Varghese, R.; Sambath, M. Yolov8: A novel object detection algorithm with enhanced performance and robustness. In Proceedings of the 2024 International Conference on Advances in Data Engineering and Intelligent Computing Systems (ADICS), Chennai, India, 18–19 April 2024; pp. 1–6. [Google Scholar]
- Khanam, R.; Hussain, M. Yolov11: An overview of the key architectural enhancements. arXiv 2024, arXiv:2410.17725. [Google Scholar]
- Zhao, Y.; Lv, W.; Xu, S.; Wei, J.; Wang, G.; Dang, Q.; Liu, Y.; Chen, J. Detrs beat yolos on real-time object detection. In Proceedings of the IEEE/CVF Conference on Computer Vision and Pattern Recognition, Seattle, WA, USA, 16–22 June 2024; pp. 16965–16974. [Google Scholar]
- Dare, P.M. Shadow analysis in high-resolution satellite imagery of urban areas. Photogramm. Eng. Remote Sens. 2005, 71, 169–177. [Google Scholar] [CrossRef]
- Asokan, A.; Anitha, J.; Ciobanu, M.; Gabor, A.; Naaji, A.; Hemanth, D.J. Image processing techniques for analysis of satellite images for historical maps classification—An overview. Appl. Sci. 2020, 10, 4207. [Google Scholar] [CrossRef]
- Verbesselt, J.; Zeileis, A.; Herold, M. Near real-time disturbance detection using satellite image time series. Remote Sens. Environ. 2012, 123, 98–108. [Google Scholar] [CrossRef]
- Gadamsetty, S.; Ch, R.; Ch, A.; Iwendi, C.; Gadekallu, T.R. Hash-based deep learning approach for remote sensing satellite imagery detection. Water 2022, 14, 707. [Google Scholar] [CrossRef]
- Yarlagadda, S.K.; Güera, D.; Bestagini, P.; Zhu, F.M.; Tubaro, S.; Delp, E.J. Satellite image forgery detection and localization using gan and one-class classifier. arXiv 2018, arXiv:1802.04881. [Google Scholar] [CrossRef]
- Siok, K.; Ewiak, I.; Jenerowicz, A. Multi-sensor fusion: A simulation approach to pansharpening aerial and satellite images. Sensors 2020, 20, 7100. [Google Scholar] [CrossRef]
- Bai, C.; Zhao, D.; Zhang, M.; Zhang, J. Multimodal information fusion for weather systems and clouds identification from satellite images. IEEE J. Sel. Top. Appl. Earth Obs. Remote Sens. 2022, 15, 7333–7345. [Google Scholar] [CrossRef]
- Iglovikov, V.; Mushinskiy, S.; Osin, V. Satellite imagery feature detection using deep convolutional neural network: A kaggle competition. arXiv 2017, arXiv:1706.06169. [Google Scholar]
- Al-Ghrairi, A.H.T.; Abed, Z.H.; Fadhil, F.H.; Naser, F.K. Classification of satellite images based on color features using remote sensing. Int. J. Comput. IJC 2018, 31, 42–52. [Google Scholar]
- Sladojevic, S.; Arsenovic, M.; Anderla, A.; Culibrk, D.; Stefanovic, D. Deep neural networks based recognition of plant diseases by leaf image classification. Comput. Intell. Neurosci. 2016, 2016, 3289801. [Google Scholar] [CrossRef]
- Sibiya, M.; Sumbwanyambe, M. A computational procedure for the recognition and classification of maize leaf diseases out of healthy leaves using convolutional neural networks. AgriEngineering 2019, 1, 119–131. [Google Scholar] [CrossRef]
- He, T.; Zhou, H.; Xu, C.; Hu, J.; Xue, X.; Xu, L.; Lou, X.; Zeng, K.; Wang, Q. Deep learning in forest tree species classification using sentinel-2 on google earth engine: A case study of Qingyuan County. Sustainability 2023, 15, 2741. [Google Scholar] [CrossRef]
- Sun, Y.; Liu, Y.; Wang, G.; Zhang, H. Deep learning for plant identification in natural environment. Comput. Intell. Neurosci. 2017, 2017, 7361042. [Google Scholar] [CrossRef]
- Huixian, J. The analysis of plants image recognition based on deep learning and artificial neural network. IEEE Access 2020, 8, 68828–68841. [Google Scholar] [CrossRef]
- Bodhwani, V.; Acharjya, D.P.; Bodhwani, U. Deep residual networks for plant identification. Procedia Comput. Sci. 2019, 152, 186–194. [Google Scholar] [CrossRef]
- Kanda, P.S.; Xia, K.; Kyslytysna, A.; Owoola, E.O. Tomato leaf disease recognition on leaf images based on fine-tuned residual neural networks. Plants 2022, 11, 2935. [Google Scholar] [CrossRef]
- Zhao, Z.; Chen, S.; Ge, Y.; Yang, P.; Wang, Y.; Song, Y. Rt-detr-tomato: Tomato target detection algorithm based on improved rt-detr for agricultural safety production. Appl. Sci. 2024, 14, 6287. [Google Scholar] [CrossRef]
- Wang, S.; Jiang, H.; Yang, J.; Ma, X.; Chen, J.; Li, Z.; Tang, X. Lightweight tomato ripeness detection algorithm based on the improved RT-DETR. Front. Plant Sci. 2024, 15, 1415297. [Google Scholar] [CrossRef] [PubMed]
- Hu, J.; Zheng, J.; Wan, W.; Zhou, Y.; Huang, Z. RT-DETR-EVD: An Emergency Vehicle Detection Method Based on Improved RT-DETR. Sensors 2025, 25, 3327. [Google Scholar] [CrossRef]
- Wang, Z.; Lei, L.; Li, T.; Zu, X.; Shi, P. RT-DETR-Smoke: A Real-Time Transformer for Forest Smoke Detection. Fire 2025, 8, 170. [Google Scholar] [CrossRef]
- Phiri, D.; Simwanda, M.; Salekin, S.; Nyirenda, V.R.; Murayama, Y.; Ranagalage, M. Sentinel-2 data for land cover/use mapping: A review. Remote Sens. 2020, 12, 2291. [Google Scholar] [CrossRef]
- Bhandari, A.K.; Kumar, A.; Singh, G.K. Feature extraction using Normalized Difference Vegetation Index (NDVI): A case study of Jabalpur city. Procedia Technol. 2012, 6, 612–621. [Google Scholar] [CrossRef]
- Maxar Technologies, WorldView-3: Next-Generation High-Resolution Commercial Satellite Imagery. Available online: https://resources.maxar.com/data-sheets/worldview-3 (accessed on 1 May 2025).
- Darktable. Darktable Main Repository. Available online: https://www.darktable.org/ (accessed on 1 May 2025).
- Upscayl. Upscayl GitHub Repository. Available online: https://github.com/upscayl/upscayl (accessed on 1 May 2025).
- Redmon, J.; Divvala, S.; Girshick, R.; Farhadi, A. You only look once: Unified, real-time object detection. In Proceedings of the IEEE Conference on Computer Vision and Pattern Recognition, Las Vegas, NV, USA, 27–30 June 2016; pp. 779–788. [Google Scholar]
| Disclaimer/Publisher’s Note: The statements, opinions and data contained in all publications are solely those of the individual author(s) and contributor(s) and not of MDPI and/or the editor(s). MDPI and/or the editor(s) disclaim responsibility for any injury to people or property resulting from any ideas, methods, instructions or products referred to in the content. |
© 2025 by the authors. Licensee MDPI, Basel, Switzerland. This article is an open access article distributed under the terms and conditions of the Creative Commons Attribution (CC BY) license (https://creativecommons.org/licenses/by/4.0/).


