Article

Enhancing Sustainability and Functionality with Recycled Materials in Multi-Material Additive Manufacturing

1
Faculty of Technology, University of Sunderland, Sunderland SR1 3SD, UK
2
Faculty of Engineering and Environment, Northumbria University, Newcastle NE1 8ST, UK
3
Department of Mechanical and Mechatronics Engineering, Dhofar University, Salalah 211, Oman
4
School of Mechanical Engineering, Shri Mata Vaishno Devi University, Katra 182320, India
*
Author to whom correspondence should be addressed.
Sustainability 2025, 17(13), 6105; https://doi.org/10.3390/su17136105
Submission received: 10 May 2025 / Revised: 17 June 2025 / Accepted: 26 June 2025 / Published: 3 July 2025
(This article belongs to the Special Issue 3D Printing for Multifunctional Applications and Sustainability)

Abstract

This study presents a novel multi-material additive manufacturing (MMAM) strategy by combining virgin polylactic acid (vPLA) with recycled polylactic acid (rPLA) in a layered configuration to improve both performance and sustainability. Specimens were produced using fused deposition modelling (FDM) with various vPLA: rPLA ratios (33:67, 50:50, and 67:33) and two distinct layering approaches: one with vPLA forming the external layers and rPLA as the core, and a second using the reversed arrangement. Mechanical testing revealed that when vPLA is used as the exterior, printed components exhibit tensile strength and elongation improvements of 10–25% over conventional single-material prints, while the tensile modulus is largely influenced by the distribution of the two materials. Thermal analysis shows that both vPLA and rPLA begin to degrade at approximately 330 °C; however, rPLA demonstrates a higher end-of-degradation temperature (461.7 °C) and increased residue at elevated temperatures, suggesting improved thermal stability due to enhanced crystallinity. Full-field strain mapping, corroborated by digital microscopy (DM) and scanning electron microscopy (SEM), revealed that vPLA-rich regions display more uniform interlayer adhesion with minimal voids or microcracks, whereas rPLA-dominated areas exhibit greater porosity and a higher propensity for brittle failure. These findings highlight the role of optimal material placement in mitigating the inherent deficiencies of recycled polymers. The integrated approach of combining microstructural assessments with full-field strain mapping provides a comprehensive view of interlayer bonding and underlying failure mechanisms. Statistical analysis using analysis of variance (ANOVA) confirmed that both layer placement and material ratio have a significant influence on performance, with high effect sizes highlighting the sensitivity of mechanical properties to these parameters. In addition to demonstrating improvements in mechanical and thermal properties, this work addresses a significant gap in the literature by evaluating the combined effect of vPLA and rPLA in a multi-material configuration. The results emphasise that strategic material distribution can effectively counteract some of the limitations typically associated with recycled polymers, while also contributing to reduced dependence on virgin materials. These outcomes support broader sustainability objectives by enhancing energy efficiency and promoting a circular economy within additive manufacturing (AM). Overall, the study establishes a robust foundation for industrial-scale implementations, paving the way for future innovations in eco-efficient FDM processes.

1. Introduction

Additive manufacturing (AM) by FDM has transformed rapid prototyping and custom part production. Yet, ensuring high mechanical performance in FDM-printed parts remains a persistent challenge [1,2]. PLA, a biodegradable thermoplastic derived from renewable resources, is one of the most popular FDM feedstocks due to its ease of printing and decent strength [3,4]. However, FDM-printed PLA components frequently exhibit lower strength and pronounced anisotropic behaviour compared to conventionally manufactured plastics [5,6]. This is largely due to the inherent layer-by-layer fabrication process, which can lead to internal porosity and imperfect interfacial bonding between layers [7].
Increasing environmental concerns and the need to reduce plastic waste have stimulated interest in using rPLA as an alternative feedstock [8]. Recycling PLA not only extends the useful life of the polymer but also supports circular economy principles by transforming industrial scrap into feedstock [9]. Despite these advantages, rPLA typically suffers from reduced mechanical performance due to degradation from repeated thermal cycles, resulting in polymer chain scission and alterations in crystallinity [10,11].
In addition to material challenges, conventional FDM is usually limited to printing with a single material at a time. This approach can restrict the range of achievable material properties, as many engineering applications require components with combined characteristics, such as strength, flexibility, and thermal conductivity, that no single material can provide. This limitation has led to the research and development of MMAM, which integrates two or more distinct materials within a single build. MMAM enables the creation of spatially graded or hybrid structures, where distinct regions can be tailored to deliver specific mechanical, thermal, or functional properties [12,13].
For instance, by combining a stiff material with a ductile one, a printed component can achieve improved impact resistance, better energy absorption, and improved heat dissipation compared to a homogeneous structure. Moreover, MMAM allows for the consolidation of multiple functions into one manufacturing step, effectively eliminating the need for assembly [13]. This integration not only streamlines production but also reduces material and labour costs.
However, MMAM is accompanied by significant technical challenges. A primary issue is material compatibility [12,13]. Dissimilar polymers often exhibit different melting temperatures, viscosities, and thermal expansion coefficients, which can result in poor interfacial bonding, delamination, or the development of residual stresses [12,13,14]. For example, if the outer-layer material cools and solidifies at a different rate than the inner core, the resultant weak interface can lead to premature failure under load. Furthermore, managing multiple extruders or feed systems requires careful management. Even slight misalignments may cause irregular deposition that degrades both the dimensional accuracy and mechanical performance of the final part [15].
Thermal behaviour discrepancies between materials further complicate MMAM. Variations in cooling rates and thermal conductivities create internal thermal gradients that can lead to warping, stress buildup, or cracking at layer interfaces. In FDM-based MMAM, the low thermal mass of each deposited layer exacerbates these issues, particularly in recycled materials that have undergone prior thermal processing (e.g., recycling). Such challenges highlight the need for careful selection of material combinations and optimising of process parameters to ensure strong interfacial adhesion and overall part integrity. Table 1 summarises key advantages of MMAM alongside the corresponding challenges.
A critical step toward achieving higher performance in FDM-printed PLA parts is a thorough understanding of how process parameters influence mechanical properties. Previous studies have identified key parameters, such as layer thickness, nozzle temperature, infill density, raster orientation, print speed, and build orientation, that significantly affect tensile strength, stiffness, and impact resistance [20,21]. For instance, finer layer thickness generally improves interlayer bonding by increasing the contact area, while optimal nozzle temperatures facilitate sufficient polymer interdiffusion. Conversely, deviations from these optimal settings can result in void formation and poor layer adhesion. Table 2 outlines the effects of key FDM parameters on PLA part performance.
As shown in Table 2, using a finer layer thickness and higher infill improves tensile strength by increasing the bonded area between layers. Nozzle temperature has an optimal range that ensures sufficient polymer interdiffusion. Too low results in weak adhesion with many voids, while too high may cause thermal degradation. Infill density correlates nearly linearly with strength, higher infill yields stronger, stiffer parts, and is often cited as the dominant factor influencing FDM PLA tensile strength. While some studies report that decreasing layer height increases strength by improving interlayer cohesion, others find its effect less pronounced compared to infill or orientation. Raster, infill, and build orientation are also crucial. Aligning rasters with the load direction and printing parts flat (so that the load is applied along continuous filaments) dramatically improve strength compared to upright prints, where the load crosses weaker layer bonds. Additionally, optimising print speed and cooling allows more polymer diffusion at interfaces, reducing porosity and improving layer fusion, although excessive slowing or insufficient cooling can lead to thermal buildup and distortion. Overall, optimised parameters can significantly improve PLA part performance, sometimes approaching theoretical limits, whereas non-optimised settings result in underperforming, delaminated parts. While vPLA generally exhibits higher strength and stiffness than rPLA due to thermal degradation during reprocessing, under optimised conditions, recycled material can achieve comparable or even improved properties.
As Table 3 indicates, the mechanical performance of rPLA can vary widely depending on material history and processing. In many cases, rPLA filaments tend to show slightly reduced tensile strength relative to virgin material, on the order of 5–15% lower, due to degradation of polymer chains during successive thermal cycles [10]. For example, one study noted an approximate 11% decrease in tensile strength for FDM-printed specimens using rPLA, which was attributed to the degradation of polymer chains. Interestingly, a slight improvement in shear strength was observed, possibly due to modified interlayer morphology [24]. Similar moderate declines in tensile, flexural, and impact properties have been reported for injection-moulded rPLA components [10].
However, recent investigations have shown that, under optimal processing conditions, rPLA can perform comparably to or even exceed vPLA. In certain cases, a filament blend with 75% recycled content demonstrated up to a 19% increase in tensile strength over pure vPLA [25]. This improvement is likely due to a finer microstructure with reduced voids and improved interlayer adhesion, as the reprocessing can promote increased crystallinity and improved polymer chain orientation. Moreover, systematic process optimisation, using methodologies such as Taguchi design and response surface analysis, has shown that fine-tuning parameters like layer thickness, nozzle temperature, and infill density can mitigate the adverse effects of thermal degradation [1]. Optimised conditions promote enhanced polymer interdiffusion and stronger interlayer bonding, enabling rPLA parts to approach or match the mechanical performance of virgin material.
These findings suggest that, with careful control of processing parameters, the altered microstructure of rPLA, marked by a balance between chain scission and increased crystallite formation, can be harnessed to create high-performance components without significant loss in quality. In other words, even though rPLA inherently undergoes some degradation during reprocessing, optimised conditions can mitigate these effects and deliver mechanical properties comparable to those of vPLA.
Equally important is the sustainability aspect. PLA, a bio-based and industrially compostable polymer derived from renewable sources such as corn starch or sugarcane, inherently offers a lower life-cycle impact than conventional polymers like ABS [3]. Reprocessing PLA waste from failed prints, support structures, and end-of-life products into new filament not only extends the material’s useful life but also reduces waste. This approach exemplifies circular economy principles, as materials are continuously reused rather than discarded, thereby alleviating landfill burdens and reducing the demand for vPLA production. For example, plastic polymers account for roughly 58% of municipal solid waste in the UK, highlighting the urgency for improved recycling strategies [10]. Additionally, recycled plastics typically require about 30% less energy to process compared to new polymers, resulting in a lower carbon footprint for printed parts [28]. Thus, a printed part made from recycled PLA embodies a smaller carbon footprint and addresses waste reduction simultaneously. Table 4 summarises these sustainability considerations, including waste reduction, resource conservation, and the promotion of circular economy models.
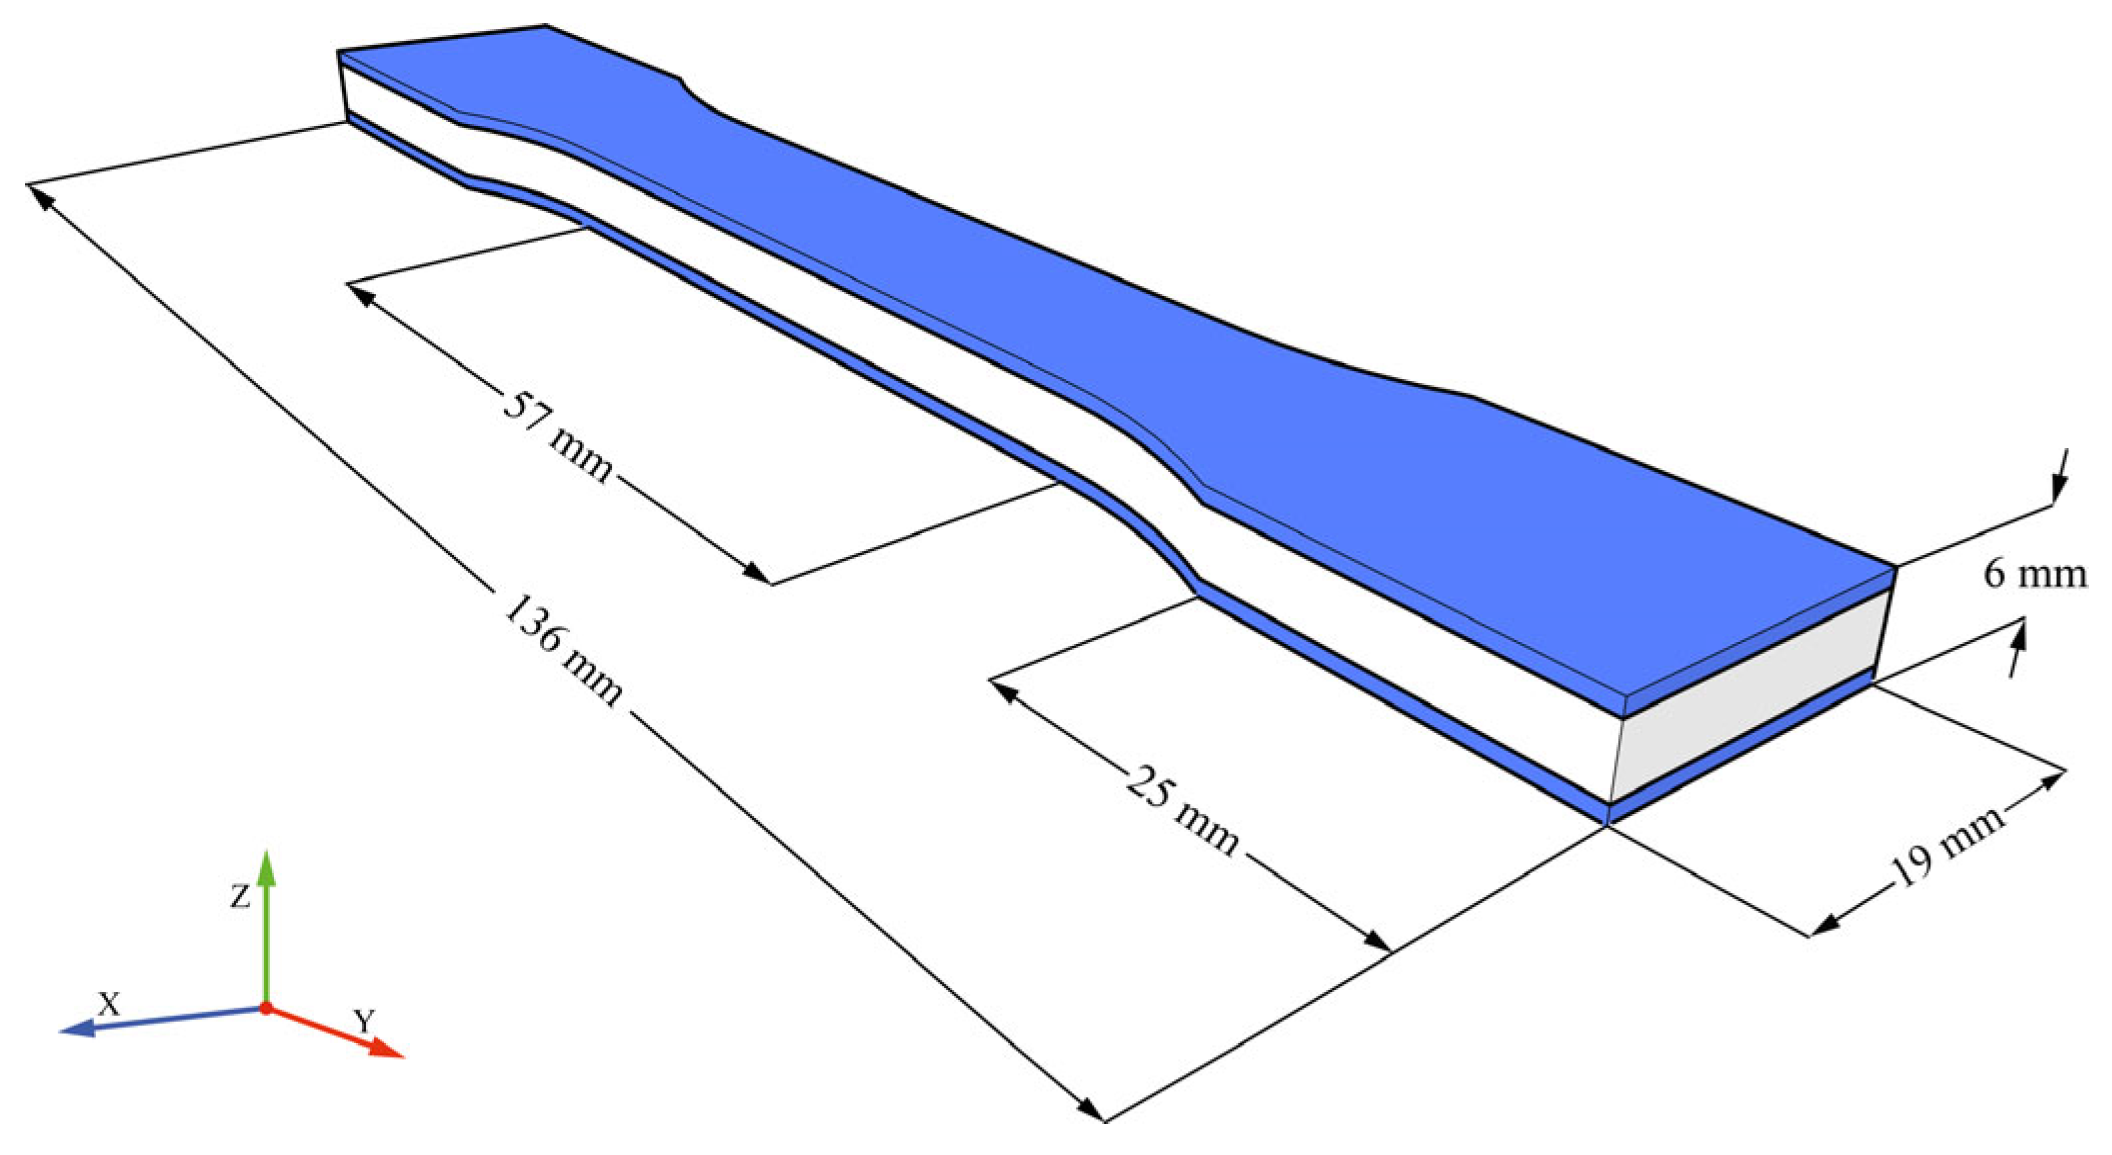
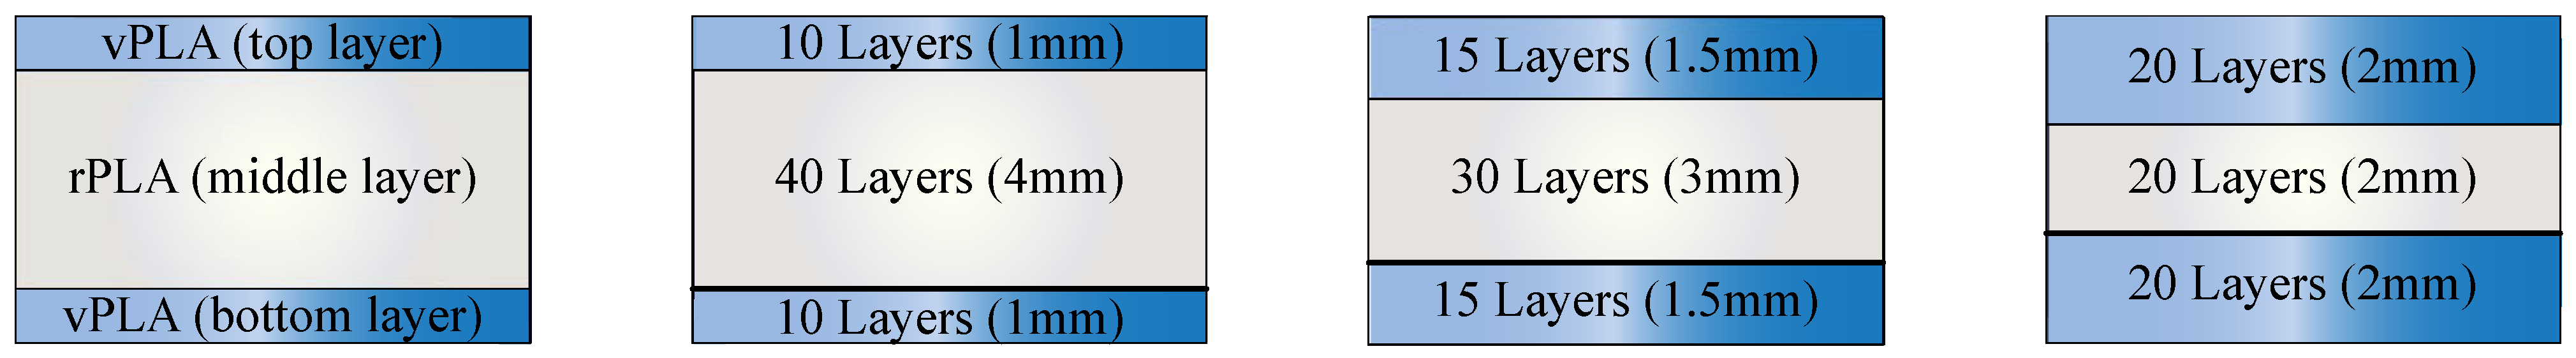
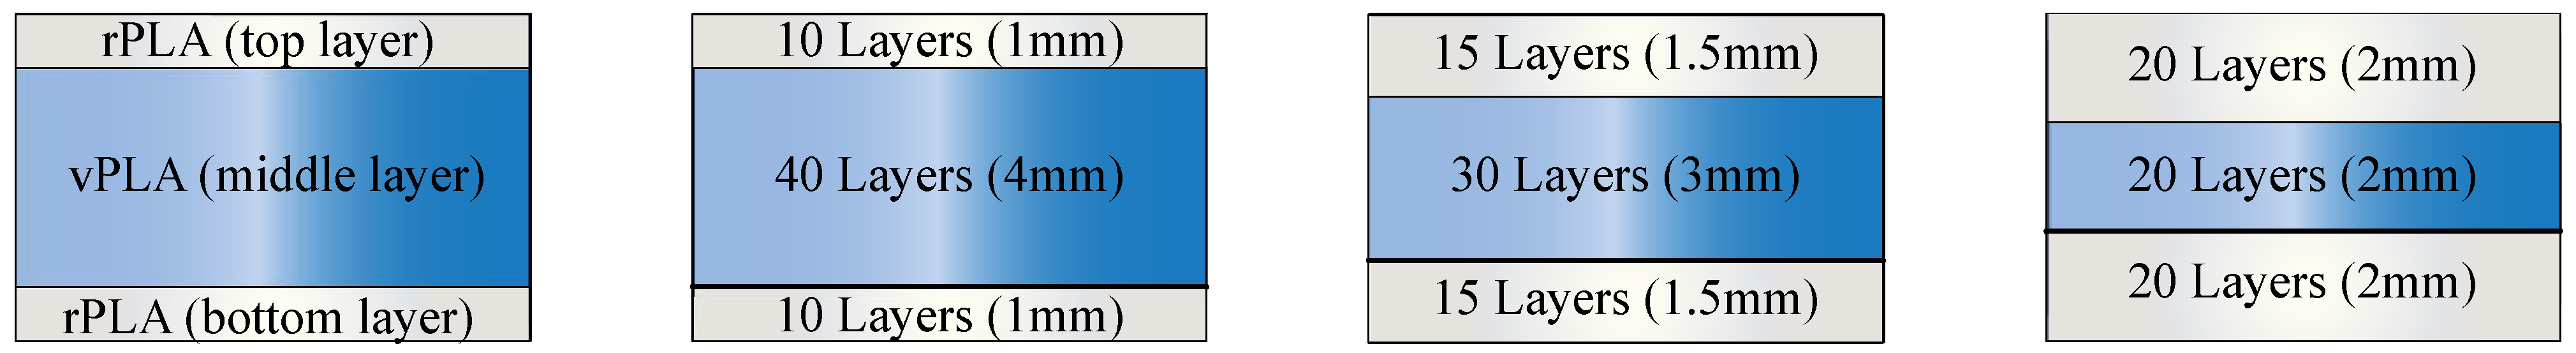
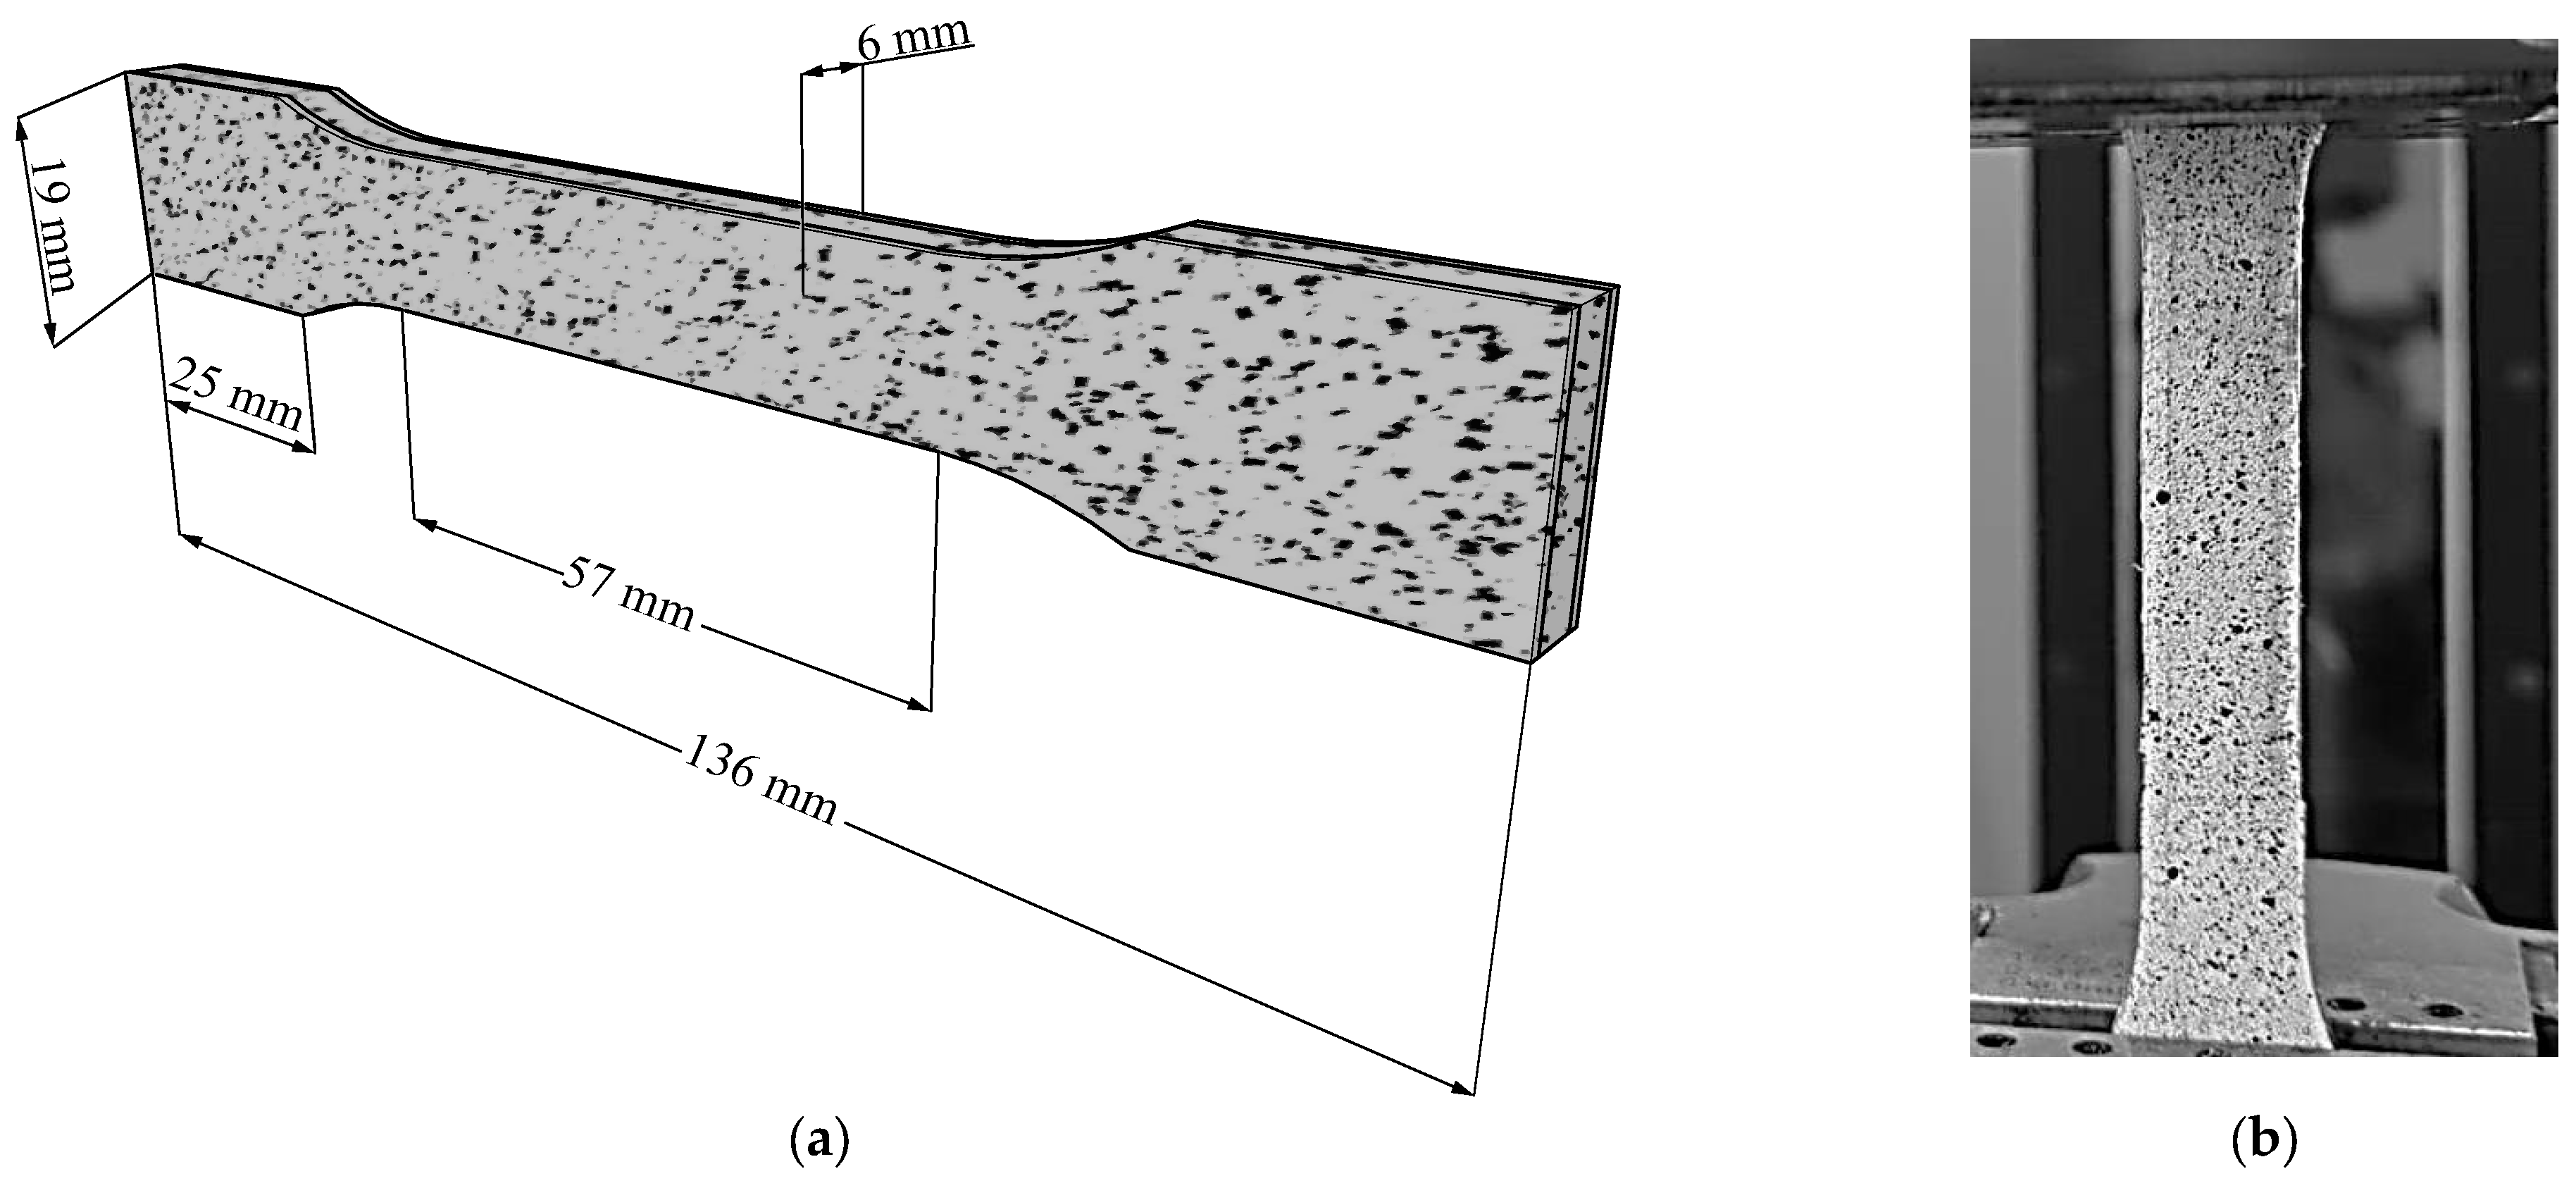
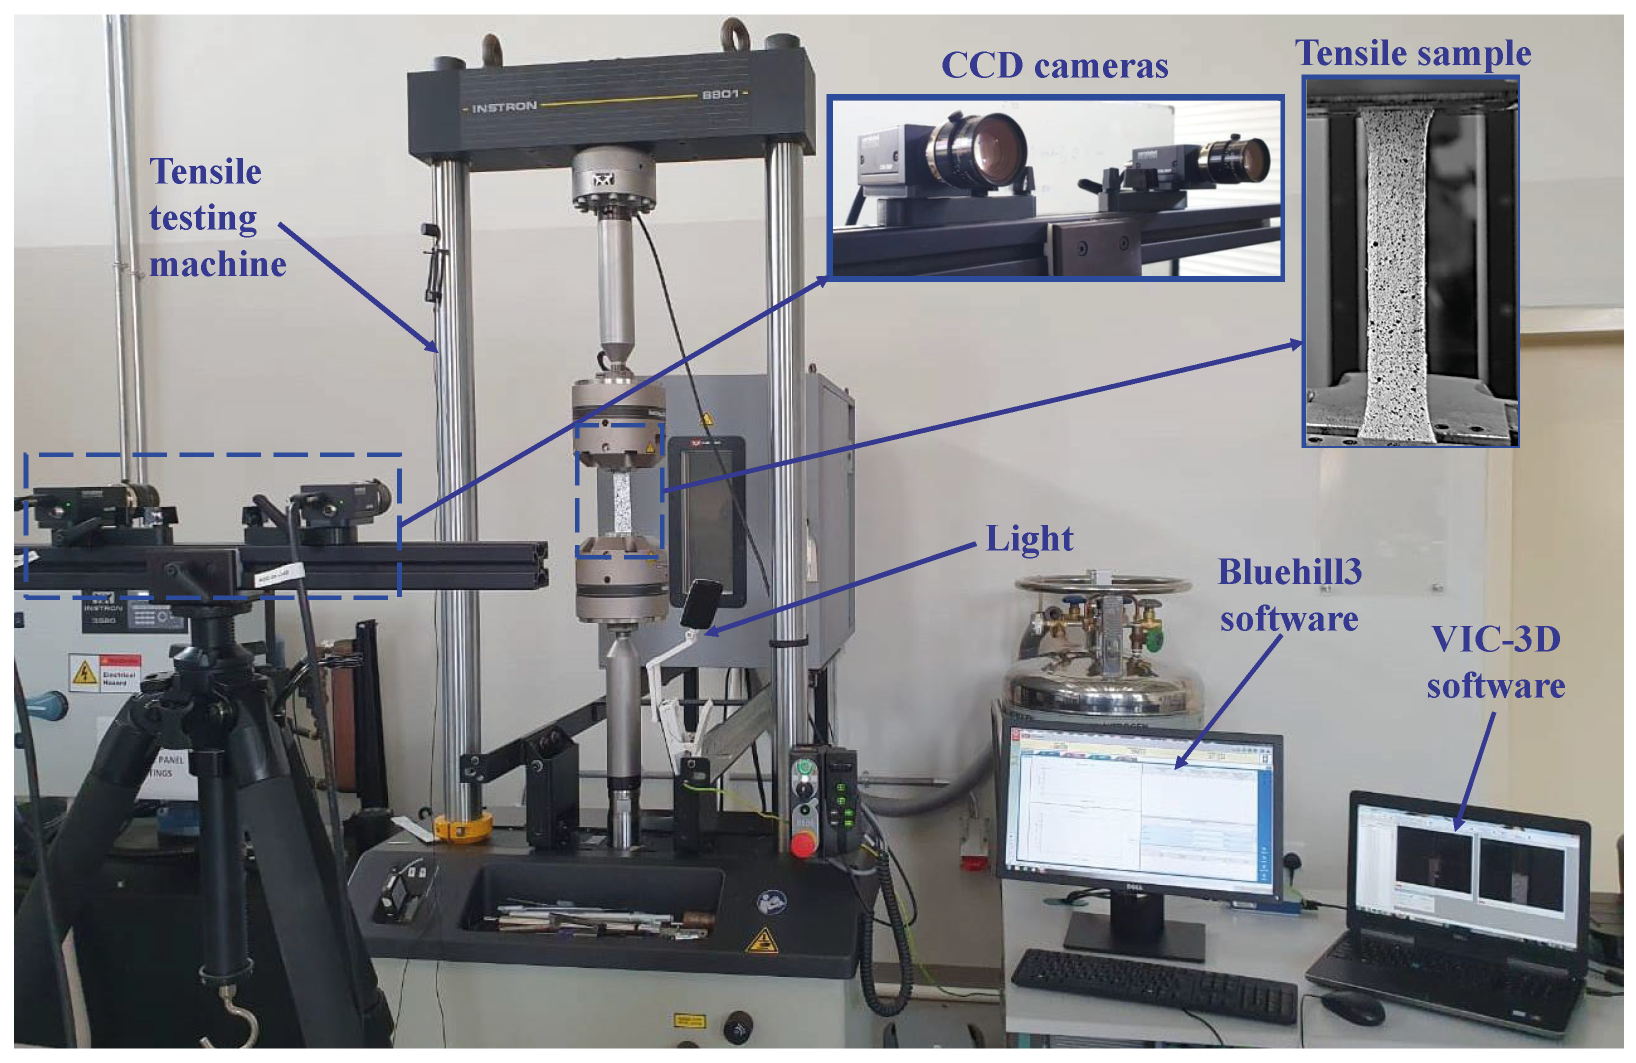
The present study investigates the feasibility of fabricating MMAM samples using FDM to combine vPLA with rPLA. The investigation focuses on how variations in the percentage of rPLA and its layer placement affect the mechanical and thermal properties of printed specimens. To address these issues, the study employs a range of experimental methods including tensile testing, microstructural, morphological, and thermal analyses, complemented by variance analysis for statistical validation, with the overarching aim of identifying the optimal configuration that enhances performance while promoting sustainability.
By addressing challenges related to material degradation inherent to recycling processes and the complexities of multi-material printing, the anticipated outcomes are expected to provide critical insights for designers and engineers seeking to implement environmentally friendly production practices without compromising the essential functional requirements of high-performance components.
In summary, the work introduces an innovative MMAM strategy that integrates rPLA with vPLA to optimise the mechanical properties of printed parts, thereby reducing the environmental impact of the manufacturing process while driving forward both technological innovation and sustainable industrial practices.

2. Methodology

This study was designed to evaluate the impact of material composition and stacking sequence on the mechanical and thermal properties of FDM-MMAM-printed samples made from vPLA and rPLA. The approach integrates pre-characterisation, controlled fabrication, mechanical and thermal testing, and statistical analysis to establish relationships between processing variables and material performance.

2.1. Sample Preparation and 3D Printing

Both vPLA and rPLA were sourced from Ultimaker. Filament diameter, nominally 2.85 mm, was confirmed using a calibrated digital calliper (±0.02 mm). Multi-material specimens were fabricated using an Ultimaker S5 3D printer. The printer underwent calibration, including bed levelling, extruder alignment, and filament diameter verification, with all calibration logs recorded to ensure reproducibility. The printing environment was maintained at 22 ± 1 °C and 45 ± 5% relative humidity to reduce environmental variability. Figure 1 provides a schematic diagram of the FDM process.
Ultimaker Cura was used to control material distribution. The multi-material functionality allowed assignment of vPLA and rPLA to designated regions of the digital model. Settings including individual layer thicknesses, flow rates, and extrusion multipliers were adjusted and verified via the software preview function to ensure that the intended stacking sequence was accurately implemented.
Specimens were modelled in SOLIDWORKS according to ASTM D638, with overall dimensions of 136.6 mm in length, 19 mm in width, and 6 mm in thickness. The reduced gauge section measured 57 mm. The printing orientations for the specimens were along the x- and y-axes, corresponding to the width and length of the specimen, respectively, while the z-axis represented the thickness (Figure 2). Three replicates were fabricated for each configuration, and control specimens (composed entirely of vPLA and entirely of rPLA) were produced under identical conditions. The baseline pre-characterisation data were directly correlated with the final performance of the printed parts so that any differences could be attributed solely to variations in material composition and stacking sequence.
Variations in MMAM configurations are summarised in Table 5. These configurations vary both the material ratio and the stacking sequence to isolate their individual and combined effects as shown in Figure 3 (vPLA: rPLA) and Figure 4 (rPLA: vPLA).
Process parameters for FDM were chosen based on the literature and preliminary optimisation and are provided in Table 6. These settings were held constant across all builds to ensure that any performance differences arose solely from material composition and stacking sequence variations.

2.2. Mechanical Testing

2.2.1. Uniaxial Tensile Testing

Tensile properties were evaluated in accordance with ASTM D638 using a universal testing machine equipped with a 10 kN load cell. Specimens were extracted, ensuring that the gauge sections remained defect-free, and were mounted using specialised grips to reduce slippage and stress concentrations. Prior to testing, each specimen was visually inspected and measured to confirm dimensional consistency. The crosshead speed was maintained at 5 mm/min to ensure a uniform stress application. Data acquisition was performed using the Xpert2 version 2.x desktop software, with the system calibrated before each session to ensure accuracy. For each configuration, including multi-material specimens and vPLA: rPLA controls, three replicates were tested.

2.2.2. Full-Field Strain and Fracture Testing

Full-field strain and deformation patterns were characterised using a 3D-DIC technique to capture local deformation and fracture behaviour during tensile loading. The specimens underwent preparation by applying a high-contrast speckle pattern uniformly across their surfaces (Figure 5) for accurate spatial correlation of sequential images taken throughout mechanical testing.
Two high-resolution charge-coupled device (CCD) cameras were arranged in a stereoscopic configuration and calibrated for 3D strain measurement (Figure 6). The stereo-vision system allowed reconstruction of surface geometry, enabling detailed mapping of localised strain evolution during incremental loading. Specimens were incrementally loaded using a universal testing machine at a consistent crosshead speed of 5 mm/min, with image acquisition synchronised at defined load increments for high-resolution capture of deformation events from initial loading through final fracture.
The recorded images were subsequently analysed with DIC software (VIC-3D), generating full-field displacement and strain maps. The analysis focused on identifying strain localisation areas, determining initiation sites for fracture, and capturing the progression of damage. High-strain regions indicating potential crack initiation points were highlighted and tracked until complete failure.

2.3. ANOVA of Tensile Properties

The tensile test data were analysed, and an ANOVA was performed using IBM SPSS Statistics 29.0 to assess the significance of Layer Placement and Material Percentage on key mechanical properties, including tensile strength, modulus, and elongation at break. A significance threshold of p < 0.05 was applied to determine statistical relevance, and partial eta squared values were calculated to quantify effect sizes. The estimated marginal means were derived from the two-way ANOVA and reflect adjusted group means that account for other factors in the model, enhancing comparability across groups. The model included interaction terms to explore whether the influence of material composition varied based on layer arrangement.

2.4. Thermal Testing

2.4.1. TGA Testing

For TGA, samples of approximately 10 mg were placed in a 100 µL aluminium pan and heated from ambient temperature to 600 °C at a constant rate of 10 °C/min under a continuous flow of nitrogen to prevent oxidation. This protocol allowed for the measurement of key thermal parameters, including the onset of degradation (5 wt% loss), 50 wt% mass loss, the end-of-degradation temperature, the maximum rate of decomposition, and the residue at 600 °C. Table 7 summarises the TGA conditions.

2.4.2. DSC Testing

DSC was performed on compression-moulded films to determine the glass transition (Tg), melting temperature (Tm), and crystallisation temperature. Samples underwent heating and cooling cycles at 10 °C/min in a nitrogen atmosphere. The DSC thermograms provided insights into endothermic and exothermic transitions, which were used to assess how recycling affects the phase behaviour of PLA. Table 8 summarises the DSC parameters.

2.5. Microstructural and Morphological Testing

To examine the internal structure of the specimens and analyse the interface between both materials, DM and SEM were conducted. These techniques facilitate the evaluation of the morphological features that are important for understanding the performance of the printed parts.
Initially, DM was performed using a Keyence Digital Microscope VHX-X1 series at 20× and 80× magnifications. This low-magnification imaging provided an overview of the layered deposition characteristic of the FDM process. The images allowed the study to quantify individual layer thicknesses and evaluate the overall stratified structure.
High-resolution SEM analysis was then performed on the fracture surfaces of representative specimens using Semplor NANOS tabletop SEM. Images were acquired at magnifications ranging from 150× to 300× to examine the fracture surface morphology of the samples providing high-resolution details of interlayer bonding, crack propagation, and surface texture, enabling clear distinction between material behaviours and failure mechanisms that are not visible through DM.

3. Results and Analysis

3.1. Mechanical Properties Results

3.1.1. Uniaxial Tensile Analysis

The uniaxial tensile performance of the specimens was evaluated using three different vPLA: rPLA ratios (33:67, 50:50, and 67:33) and two distinct stacking sequences. In the first configuration (set 1), vPLA was used for the top and bottom layers while rPLA comprised the core. In the second configuration (set 2), this arrangement was reversed. Stress–strain curves (Figure 7) and the summarised tensile properties in Table 9 illustrate clear trends in how material composition and stacking sequence affect mechanical behaviour.
For example, in the 33:67 configuration, set 1 specimens exhibited a tensile modulus of 416.6 MPa, a tensile strength of 33.50 MPa, and an elongation at break of 7.20%. In contrast, when rPLA was placed on the exterior (set 2), the tensile modulus increased to 609.8 MPa, while tensile strength and elongation decreased to 17.73 MPa and 4.37%, respectively. In the 67:33 configuration, set 1 specimens achieved a tensile strength of 45.19 MPa and an elongation of 7.39%, outperforming the set 2 samples (38.97 MPa and 6.29%). In the 50:50 configuration, set 1 specimens exhibited a tensile modulus of 451.81 MPa, a tensile strength of 40.08 MPa, and an elongation at break of 6.84%, which is similar to that of set 2 in the same configuration. Baseline measurements indicate that vPLA exhibits a modulus of 343.3 MPa, tensile strength of 44.24 MPa, and elongation of 5.53%, whereas rPLA shows a modulus of 900.2 MPa, tensile strength of 24.57 MPa, and elongation of 6.06%.
The differences observed among the configurations were quantified using SPSS. Table 10 presents the statistical results, which confirm that both layer placement and material ratio, as well as their interaction, yield p-values below 0.001. The partial eta squared values, 0.952 for layer placement, 0.988 for material ratio, and 0.947 for their interaction, demonstrate that these factors account for nearly all the variance in tensile strength.
Figure 8a,b further illustrate the primary effects of the independent variables. Figure 8a illustrates the main effect of layer placement on tensile strength, clearly showing that specimens with vPLA as the outer layers (set 1) achieve higher tensile strength. Figure 8b depicts the main effect of the material ratio, with data indicating that a 67:33 ratio correlates with increased tensile strength. However, it does not take layer placement into account. Therefore, two-way interaction plots are important for understanding the relationship between layer placement and material ratio.
Moreover, the interaction plots in Figure 9a,b illustrate the relationship between layer placement and material ratio. In Figure 9a, the interaction effect shows that the improvement in tensile strength associated with using vPLA as the outer layer is most pronounced at higher vPLA ratios. Figure 9b reinforces this observation by demonstrating that the effect of material ratio on tensile strength is strongly dependent on the stacking sequence. The crossing of the interaction lines confirms that these parameters do not act independently.
Comparison with previous findings further supports the current data. Studies have reported an approximate 10–11% reduction in tensile strength for rPLA compared to vPLA, primarily attributed to polymer chain scission during reprocessing, which lowers molecular weight and reduces mechanical strength [10,11,24]. This trend is reflected in configurations where rPLA forms the outer layer (set 2), resulting in lower tensile strength. However, thermal degradation also leads to shorter polymer chains, which can enhance molecular packing and increase crystallinity—factors known to improve tensile modulus, albeit often reducing ductility [10,11,27]. Set 2 specimens illustrate this trade-off, showing significantly higher modulus values but reduced tensile strength and elongation. Notably, placing vPLA on the outer layers (set 1) appears to mitigate the effects of chain scission, producing tensile strengths comparable to or exceeding those of pure vPLA; for example, the 67:33 set 1 specimens achieved a tensile strength of 45.19 MPa, surpassing the 44.24 MPa observed for vPLA. When vPLA is used on the exterior, its longer chains facilitate improved interlayer bonding and better polymer interdiffusion, which improve overall tensile strength and ductility [27]. These phenomena can be assumed using micromechanical models, such as the rule-of-mixtures, which predict that the effective modulus of a layered composite is a weighted average of its constituents, while tensile strength is highly sensitive to the quality of the interfacial bonds [27,29].
Furthermore, the statistical significance and high effect sizes emphasise the influence of both individual parameters and their interactions. This quantitative validation strengthens the findings and demonstrates that even modest adjustments in material composition and layer placement can have pronounced effects on mechanical performance.
Importantly, the multi-material approach not only optimises mechanical performance but also advances sustainability. By integrating rPLA into a design that maintains or improves tensile strength through specific layering, this approach contributes to reducing reliance on virgin polymers. The data therefore indicates that the optimal mechanical performance in multi-material FDM parts is achieved when vPLA is used for the outer layers and rPLA is incorporated in the core, particularly at a 67:33 ratio, highlighting the potential for leveraging multi-material strategies to balance performance and sustainability in advanced manufacturing.

3.1.2. Full-Field Strain Analysis and Fracture Mechanisms via DIC

The application of 3D-DIC enabled an imagining of the full-field strain distributions and fracture mechanisms in samples under tensile loading. Figure 10 and Figure 11 illustrate strain maps during stages of loading, showing how strain localisation and crack propagation vary with changes in material ratios and layer configurations.
In set 1 samples, a clear dependency of strain localisation and fracture initiation site on the vPLA/rPLA ratio was observed. Specifically, samples with higher recycled material content (33:67 and 50:50 ratios) exhibited early strain concentration at the bottom region, evolving into complex, non-linear crack propagation paths. This irregular fracture behaviour can be attributed to the heterogeneous microstructure and differing mechanical properties between the vPLA and rPLA layers, a trend that has been similarly observed in rPLA, where void formation and interlayer heterogeneity were found to reduce overall mechanical performance [1].
Conversely, in specimens with a higher proportion of vPLA (67:33%), strain concentration began in the top region and then spread horizontally. This suggests that when vPLA known for its higher ductility and toughness predominates, it influences the initial failure behaviour and overall fracture pattern. Previous work, which compared vPLA and rPLA, demonstrated that rPLA suffers from reduced tensile strength and increased brittleness [10,11,27]. Thus, when the vPLA ratio is more prevalent, its improved mechanical properties tend to govern the fracture behaviour, leading to a more controlled and delayed failure mode [10]. Therefore, an increased ratio of vPLA leads to a distinct strain evolution profile, consistent with the trends observed in the uniaxial tensile test results.
Set 2 samples exhibited distinctly different fracture behaviour, as shown in Figure 11. With outer layers comprised primarily of recycled material, the samples demonstrated more immediate and widespread strain concentration that initiated centrally and spread horizontally, particularly in the 33:67 and 50:50 configurations. These observations are consistent with previous findings on the embrittlement of rPLA, which has been attributed to both increased porosity and decreased ductility [1,10].
Strain evolution is presented in Figure 12. For example, the set 1 (33:67) sample showed a pronounced increase in strain localisation in areas of initial porosity and material heterogeneity near the lower region, with fracture initiating at approximately 7.77% strain and culminating at 7.88% strain. These patterns highlight how porosity and non-homogeneity act as primary failure initiators, similar to findings reported in other work [1].
Overall, the 3D-DIC analysis not only demonstrates the mechanical behaviour and localised strain development but also highlights the importance of strategic material placement (specific ratio control) in MMAM. By comparing the findings with other studies, it is clear that the relationship between recycled and virgin materials consistently leads to variations in fracture behaviour. Future optimisation strategies for MMAM should therefore focus on reducing interlayer heterogeneity and porosity to improve the predictability and reliability of fracture behaviour.

3.2. Thermal Properties Results

3.2.1. TGA Analysis

In the TGA experiments, samples (≈10 mg) were heated from ambient temperature to 600 °C at 10 °C/min under a nitrogen atmosphere. The TGA curves are presented in Figure 13. At first glance, the thermal decomposition profiles of vPLA and rPLA appear similar. Both materials exhibit a comparable onset of degradation, with a 5 wt% mass loss occurring at approximately 330 °C (Table 11). Furthermore, the derivative thermogravimetric (DTG) curves for both samples (Figure 14) show a maximum decomposition rate at an identical temperature of approximately 365 °C. However, a more detailed analysis reveals significant differences in their high-temperature behaviour. A key distinction is the end-of-degradation temperature, which marks the completion of the primary decomposition stage. For vPLA, this occurs at 391.67 °C, whereas for rPLA, degradation extends to a significantly higher temperature of 461.67 °C. This 70 °C increase in thermal endurance is a critical indicator of modified stability. Concurrently, the mass of the char residue remaining at 600 °C was substantially higher for rPLA (0.99 wt%) compared to vPLA (0.58 wt%). The formation of a more substantial, stable char can act as a thermal barrier, protecting the underlying material and slowing further degradation. To understand the origin of this behaviour, it is necessary to consider the interplay between chain scission and crystallinity, a known dual effect of polymer recycling. It is well-established that recycling can induce chain scission, which typically reduces a polymer’s thermal stability. While this may seem contradictory to these TGA results, the DSC analysis provides further clarification.

3.2.2. DSC Analysis

DSC analysis (Figure 15) was performed at 10 °C/min on compression-moulded films. During the first heating cycle, vPLA displays a clear glass transition at 60–65 °C, an exothermic cold crystallisation peak around 101.63 °C, and a melting peak near 151.20 °C. In the second heating cycle, the reduced intensity of these transitions indicates that prior thermal exposure stabilises the material’s structure. The repeatability of these transition temperatures confirms that the observed thermal behaviour is intrinsic to the materials. Table 12 presents a comparison of key thermal properties for vPLA and rPLA, derived from the DSC plots.
The DSC results (Table 12) show that the cold crystallisation temperature of rPLA during the second heating cycle (110.63 °C) is notably higher than that of vPLA during the first heating cycle (101.63 °C). This suggests that the shorter polymer chains present in rPLA, resulting from chain scission, act as effective nucleating agents. This enhanced nucleation facilitates a more rapid and organised arrangement of polymer chains into a homogeneous crystalline structure. The sharper DTG peak observed for rPLA (Figure 13b) supports this interpretation, indicating a more uniform degradation process characteristic of a well-ordered material. Therefore, it attributes the enhanced high-temperature performance of rPLA to its improved crystalline structure. While the integrity of individual chains may be slightly reduced by recycling (as suggested by the minor decrease in melting temperature), the collective structural order of the bulk material is enhanced. This greater degree of crystallinity requires higher thermal energy for complete decomposition.
It is important to acknowledge the limitations of TGA and DSC. For example, the rapid heating rates used in these analyses can mask subtle variations in crystallite size or distribution, and sample heterogeneity may influence the measured thermal parameters. Complementary techniques such as SEM provide further insights into the microstructural changes accompanying recycling, thereby offering a more complete picture of the crystallinity improvements.
From a process optimisation perspective, the higher end-of-degradation temperature of rPLA indicates that FDM printing parameters could be adjusted to improve polymer interdiffusion and interlayer adhesion in multi-material builds. However, these adjustments must be carefully balanced to prevent excessive chain degradation. Optimising process parameters is essential to take advantage of the thermal benefits of rPLA while maintaining or even improving its mechanical performance.
In summary, the thermal analysis confirms that reprocessing improves the stability of PLA through increased crystallinity while also supporting the sustainability and functionality goals of this study. These results provide a basis for optimising processing parameters in MMAM, thereby promoting the integration of recycled materials into high-performance, sustainable production practices.

3.3. Microstructural and Morphological Results

3.3.1. DM Analysis

DM was used to examine the fracture surfaces of the printed specimen from set 1 (PLA: rPLA: PLA, 67:33 ratio) using a Keyence Digital Microscope VHX-X1 series at 20× and 80× magnifications. Figure 16a captures the entire sample width, clearly illustrating the inherent layer-by-layer structure typical of the FDM process, with uniform layer thickness that confirms the control of deposition parameters. The image distinctly differentiates the two materials; vPLA appears in blue and rPLA in white, with vertical measurement lines providing accurate assessments of layer dimensions.
Closer inspection of the material interface in Figure 16b,c shows a rough interface that, while indicative of some degree of adhesion, also highlights potential weaknesses in bonding. Observation shows the presence of voids and cavities along the interlayer boundaries, likely resulting from incomplete fusion or air entrapment during printing. These potential defects vary in size and distribution and are recognised in the literature as contributors to reduced mechanical performance and an increased likelihood of brittle fracture, particularly in configurations where rPLA is susceptible to chain scission and modified crystallinity [30].
Although the uniform layer thickness demonstrates effective process control, the identified voids highlight the necessity for further optimisation to improve interlayer adhesion. These DM observations provide evidence of microstructural imperfections that merit additional investigation using higher-resolution techniques such as SEM.

3.3.2. SEM Analysis

To provide greater detail and to expand upon the initial observations from the DM analysis, high-resolution SEM was used to further examine the fracture surfaces of specimens shown in Figure 17a. The images provide insights into interlayer bonding, void formation, and other microstructural characteristics that influence the overall mechanical performance of the printed specimens. In Figure 17b, at a 150× magnification, the characteristic layered morphology of the FDM process is clearly observable. In regions predominantly composed of vPLA, the fracture surface exhibits a rough, plate-like structure with interconnected crack networks and lamellar features. These characteristics provide evidence of plastic deformation prior to failure, indicative of a cohesive failure mode, wherein the bulk material deforms significantly before fracturing and absorbs more energy during crack propagation. In contrast, the rPLA-dominated regions display markedly smoother fracture surfaces. These areas are characterised by well defined, vertically aligned rod-like structures separated by smooth shear zones, indicating a brittle, adhesive failure mode caused by insufficient polymer interdiffusion and weaker interlayer bonding.
At 300× magnification, Figure 17c provides a detailed view of the transitional zone between rPLA and vPLA showing a distinct boundary region where variations in material morphology can be observed. The transitional interface appears heterogeneous, characterised by irregular intermixing of the two materials and areas where the interfacial adhesion is compromised. This image highlights the inherent challenges of achieving a seamless bond in FDM-MMAM parts and provides a likely explanation for the reductions in tensile strength.
Further validation of these findings is evident when correlating the SEM analysis with the previously reported mechanical performance data. Tensile testing showed that specimens with a higher proportion of rPLA exhibit a pronounced decrease in tensile strength. The microstructural defects observed, particularly an increased density of voids and interfacial gaps in rPLA-rich regions function as stress concentrators that accelerate crack initiation and propagation. This behaviour is further substantiated by 3D-DIC analyses, which showed strain localisation in the areas corresponding to these defects.
The literature indicates that previous studies have predominantly focused on technical challenges, such as differences in thermal properties, viscosity mismatches, and cooling rate variations, affecting interlayer adhesion in FDM [4]. However, relatively few have systematically correlated specific processing parameters with the quality of the interfacial bond [13]. In this context, the present study fills a critical research gap. It demonstrates that even small adjustments in printing parameters can improve polymer interdiffusion and interlayer adhesion, thereby mitigating mechanical limitations typically observed in recycled material regions.
In summary, the SEM analysis illustrates that specimens with a higher proportion of vPLA display interlayer fusion and predominantly cohesive failure, while those with greater rPLA content exhibit significant interfacial voids, rod-like morphologies, and a transitional zone that correlates with reduced tensile strength and impact resistance. This integrated analysis of microstructural features, mechanical testing, and 3D-DIC strain mapping highlights the importance of optimising processing conditions for FDM-MMAM parts.

3.4. Sustainability and Practical Implications

The integration of rPLA within an MMAM framework not only enhances component functionality but also delivers significant sustainability benefits. By strategically positioning rPLA as the core material shielded by an outer layer of vPLA, the process exploits the thermal resistance of rPLA while mitigating its mechanical shortcomings due to chain degradation. This design approach preserves the overall tensile performance of the parts and extends their operational temperature range, thereby addressing key performance limitations associated with rPLA.
From a sustainability perspective, the adoption of rPLA is a critical step toward advancing circular economy practices. By repurposing post-consumer and post-industrial PLA waste, this method reduces the demand for virgin polymers, leading to lower energy consumption and diminished greenhouse gas emissions during material production. The selective use of recycled material in regions of the component subjected to lower mechanical loads further optimises resource utilisation, ensuring that performance is maintained without unnecessary material expenditure [31,32]. Ultimately, this strategy not only reduces waste but also promotes energy and resource efficiency across the production cycle.
The practical implications of this study extend beyond environmental considerations. The reduced reliance on virgin polymers can translate into notable cost savings, a factor that is likely to stimulate further industrial interest and adoption of MMAM techniques. Moreover, the improved thermal stability achieved through the incorporation of rPLA opens the door to applications in more demanding, high-temperature environments where vPLA might fail. This dual advantage of economic viability and broadened application potential positions the proposed MMAM strategy as a transformative approach in the field.
In addition to the technical and economic benefits, the broader societal implications of adopting a recycled-material strategy are significant. Adopting such methods supports local recycling initiatives and aligns with increasing regulatory and consumer demands for environmentally responsible production processes [33]. As industries face mounting pressure to reduce their environmental footprint, the demonstrated ability to maintain high-performance standards while integrating recycled materials provides a compelling case for widespread adoption. Future research should focus on detailed life-cycle assessments and the development of predictive models to further refine material ratios and process parameters, thereby enhancing both the environmental and functional performance of manufactured components.
Overall, this study lays a robust foundation for the advancement of sustainable AM. By addressing both the technical challenges and the broader environmental and economic impacts, the work represents a meaningful step toward realising high-performance, eco-friendly production methods that are scalable for industrial applications.

4. Key Findings

This study investigated the effect of multi-material configurations on the performance of FDM-printed specimens using vPLA and rPLA. By varying the material ratios (33:67, 50:50, and 67:33) and layer placements (set 1: vPLA as the outer layers, rPLA as the core; set 2: reversed arrangement), several key trends were observed:

4.1. Mechanical Performance

  • In the 33:67 configuration, set 1 (vPLA exterior) exhibited a tensile modulus of 416.6 MPa, tensile strength of 33.50 MPa, and elongation at break of 7.20%, while set 2 samples (rPLA exterior) showed a higher modulus (609.8 MPa) but reduced strength (17.73 MPa) and elongation (4.37%).
  • For the 67:33 configuration, the set 1 sample achieved improved tensile strength (45.19 MPa) and elongation (7.39%) compared to set 2 (38.97 MPa and 6.29%, respectively).
  • Baseline measurements indicate that vPLA tends to exhibit lower stiffness but higher strength (e.g., modulus of 343.3 MPa, strength 44.24 MPa, and elongation at break of 5.5%), whereas rPLA exhibits higher stiffness (900.2 MPa), along with lower strength (24.6 MPa) and moderate elongation (6.06%).

4.2. Full-Field Strain and Fracture Mechanisms Analysis

  • Full-field strain mapping identified that strain localisation and crack initiation occur predominantly at microstructural defects such as voids and weak interlayer interfaces.
  • Defects are especially pronounced when rPLA forms the outer layer, directly correlating with reduced mechanical performance. These findings reinforce the optimal use of vPLA as the exterior material.

4.3. Thermal Analysis

  • TGA showed that both vPLA and rPLA begin to lose 5% of their mass near 330 °C; however, rPLA demonstrated a superior end-of-degradation temperature (461.7 °C) and a higher residue at 600 °C (0.99 wt% vs. 0.58 wt%), suggesting enhanced stability at elevated temperatures.

4.4. Statistical Analysis

  • ANOVA confirms that both layer placement and material composition are highly significant (p < 0.001) in determining mechanical properties.
  • Effect sizes are remarkably high, with partial eta squared values of 0.952 for layer placement, 0.988 for material ratio, and 0.947 for their interaction, highlighting the influence of process parameters.

4.5. Microstructure and Morphological Analysis

  • DM demonstrates that vPLA regions exhibit uniform layer bonding with minimal porosity, whereas rPLA regions show more frequent voids and cavities, likely due to incomplete fusion or entrapped air during printing.
  • SEM reveals distinct fracture characteristics. vPLA-dominated areas tend to show smoother, ductile fracture surfaces, while rPLA regions display more jagged, brittle failure features with evident microcracking.
  • Combined DM and SEM analyses confirm that these morphological differences, in interlayer adhesion and defect prevalence directly influence the mechanical performance, thereby supporting the use of vPLA as the exterior layer in FDM-MMAM.

4.6. Sustainability Implications

  • The strategic incorporation of rPLA reduces the reliance on virgin materials, decreasing energy consumption and greenhouse gas emissions during production.
  • Multi-material designs that leverage the enhanced thermal properties of rPLA broaden the application potential of FDM prints while supporting circular economy principles through improved waste utilisation.
This study also addresses several notable gaps in the current literature. Whereas previous research predominantly focused on the use of PLA, whether virgin or recycled, in isolated single-material systems, this work provides a comparative analysis of multi-material configurations. By evaluating the combined effect between vPLA and rPLA in a layered approach, the study reports the lack of comprehensive investigations into how material distribution can counteract the inherent deficiencies of recycled polymers. In addition, the integration of microstructural assessments with full-field strain mapping offers a more holistic understanding of the underlying failure mechanisms and interlayer phenomena, which have not been as thoroughly explored in earlier studies. This approach not only expands the knowledge base of interfacial bonding in multi-material prints but also offers practical insights into achieving consistent part quality.
Beyond the technical performance, the incorporation of rPLA, when combined with vPLA, not only reduces dependence on virgin polymers but also aligns with broader circular economy principles by lowering energy consumption and decreasing overall material waste. This dual benefit of enhanced performance and sustainability represents an important step toward eco-efficient manufacturing practices.
Looking forward, further research should be aimed at integrating real-time process monitoring and predictive control systems, which could maintain optimal printing conditions across production batches and further improve consistency. In addition, extensive life-cycle assessments and economic evaluations will be instrumental in quantifying the long-term benefits of adopting such multi-material strategies at an industrial scale. Future explorations into complementary reinforcement strategies, such as the incorporation of additives, compatibilizers, or natural fibres, could further extend the application range and performance of rPLA.

5. Conclusions

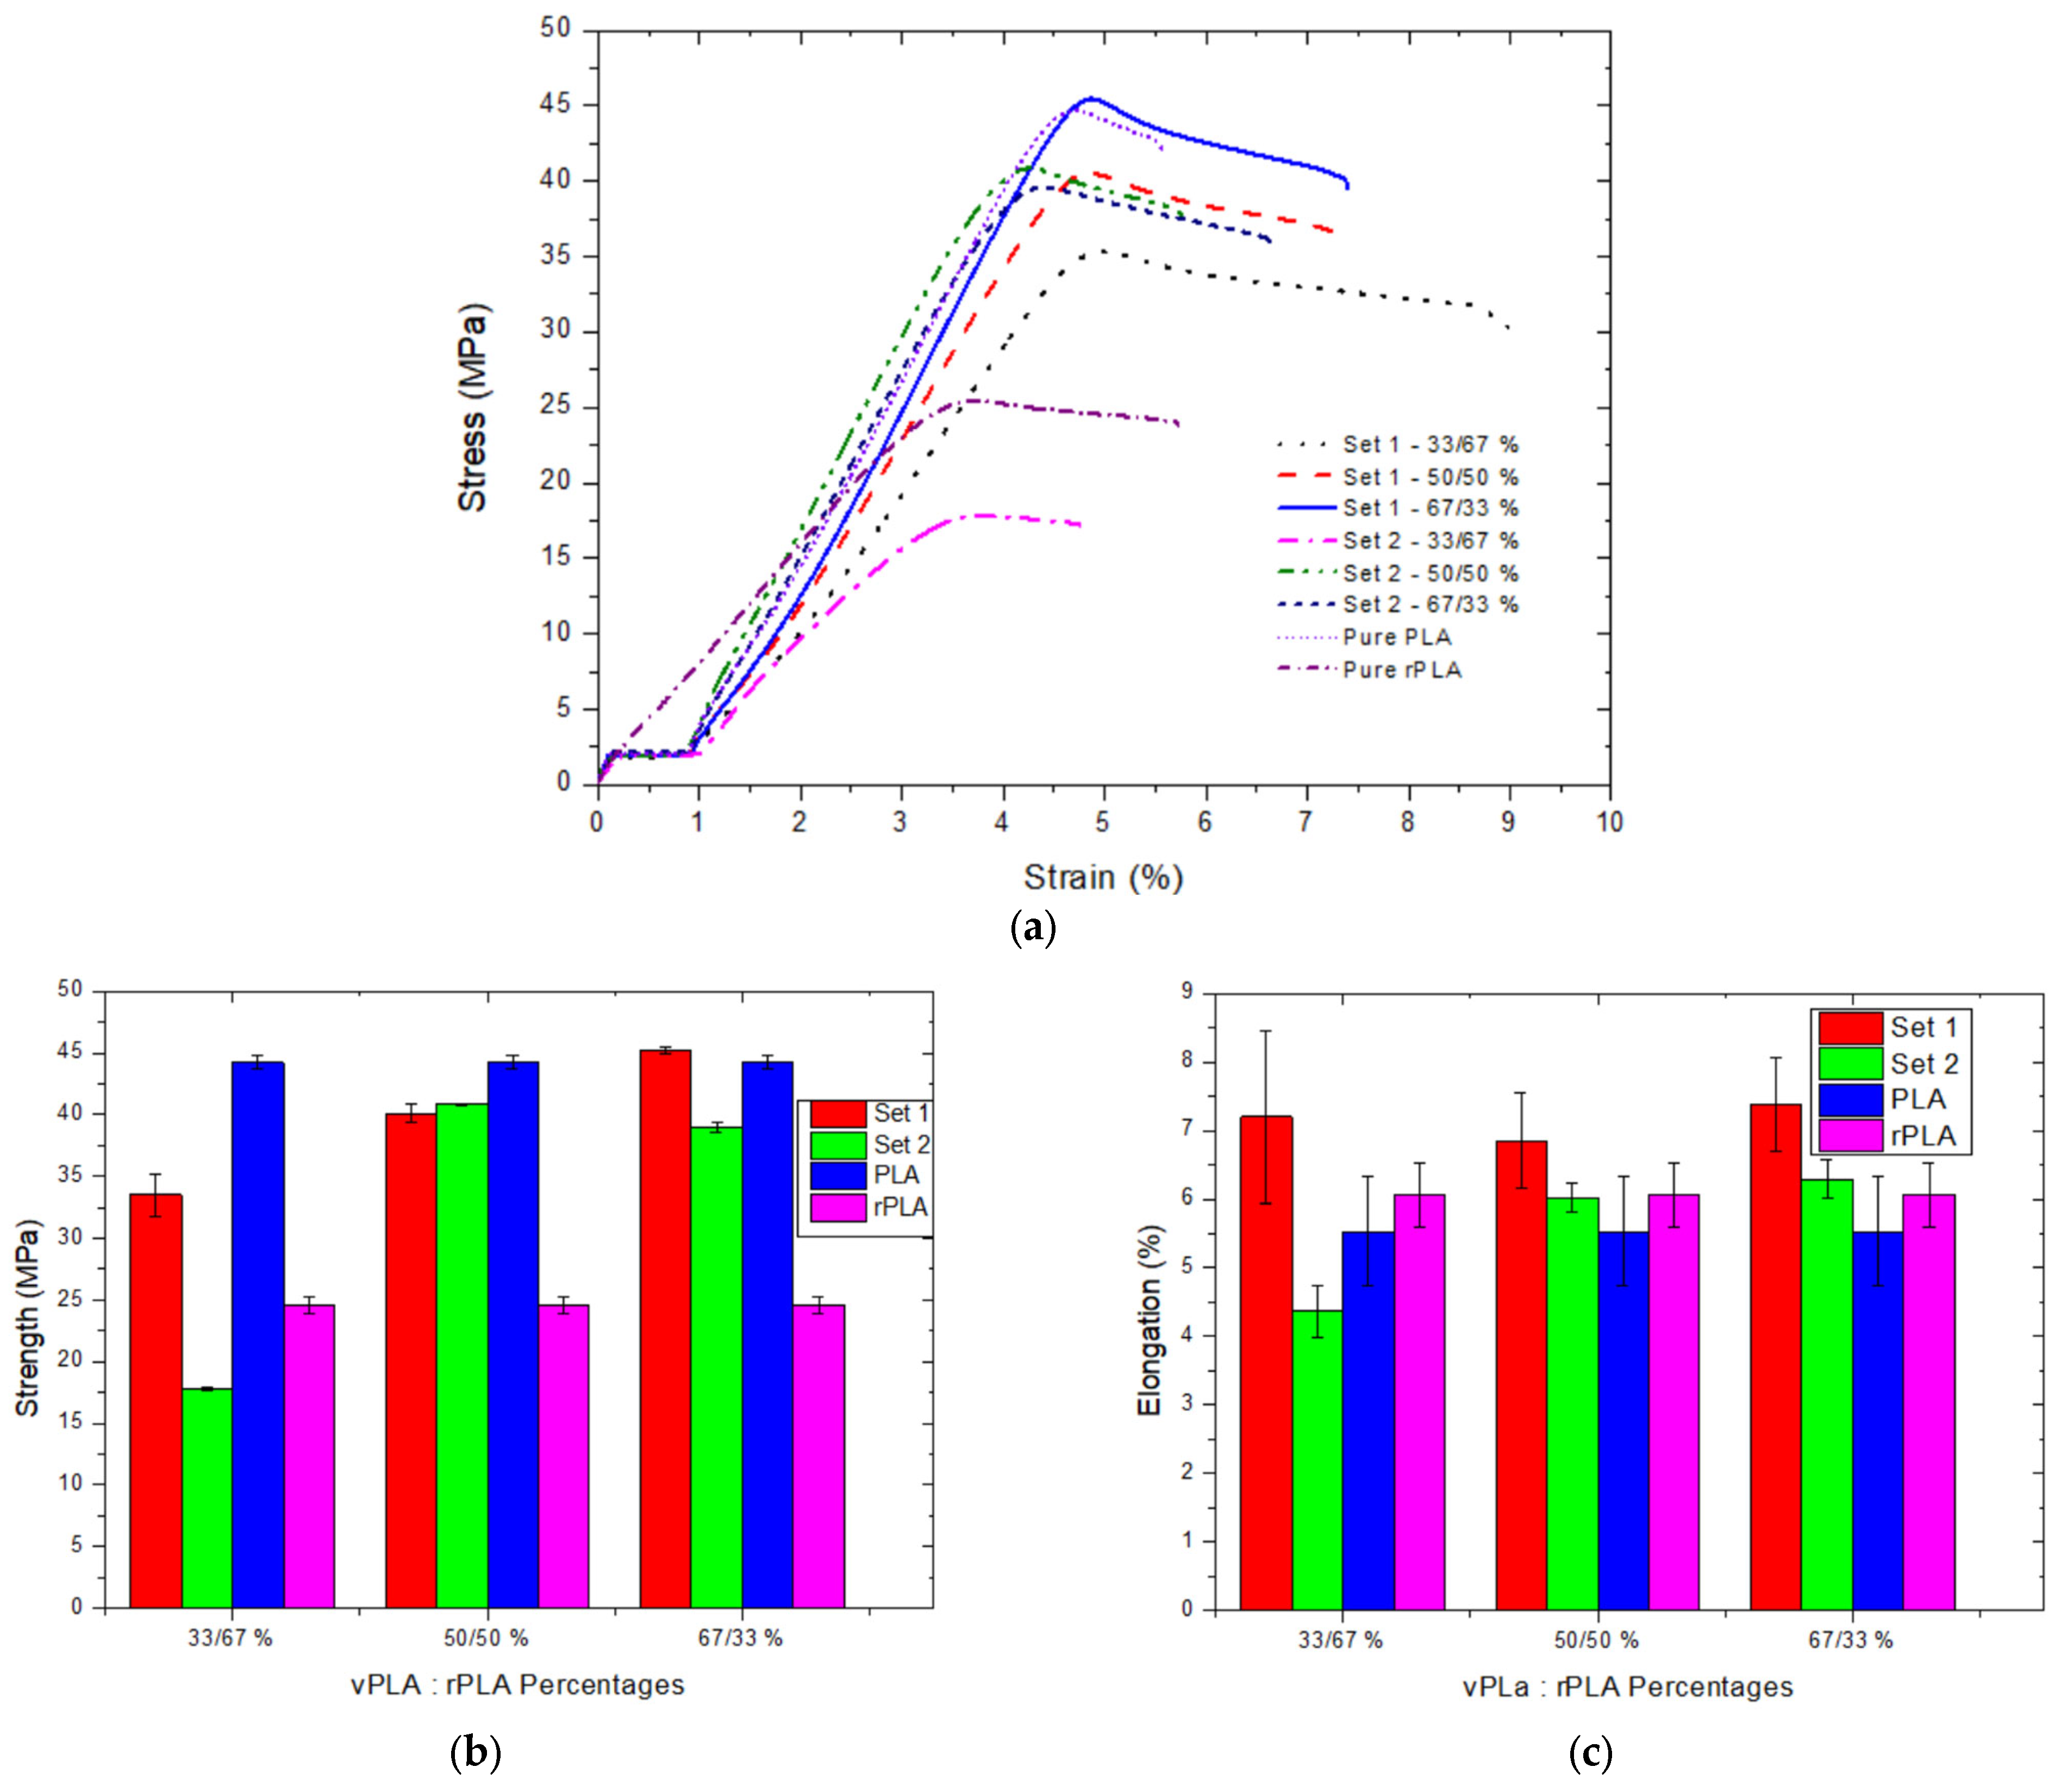
These findings of the current study demonstrate that an FDM-MMAM strategy, where vPLA is used as the external layer and rPLA is used for the core, yields significant enhancements in the mechanical and thermal performance of printed components. The experimental evaluation indicates that, on average, optimising the material ratios and layer placements, tensile properties such as strength and elongation can be improved by 10–25% compared to conventional single-material prints, while the tensile modulus is strongly dependent on the strategic placement of vPLA.
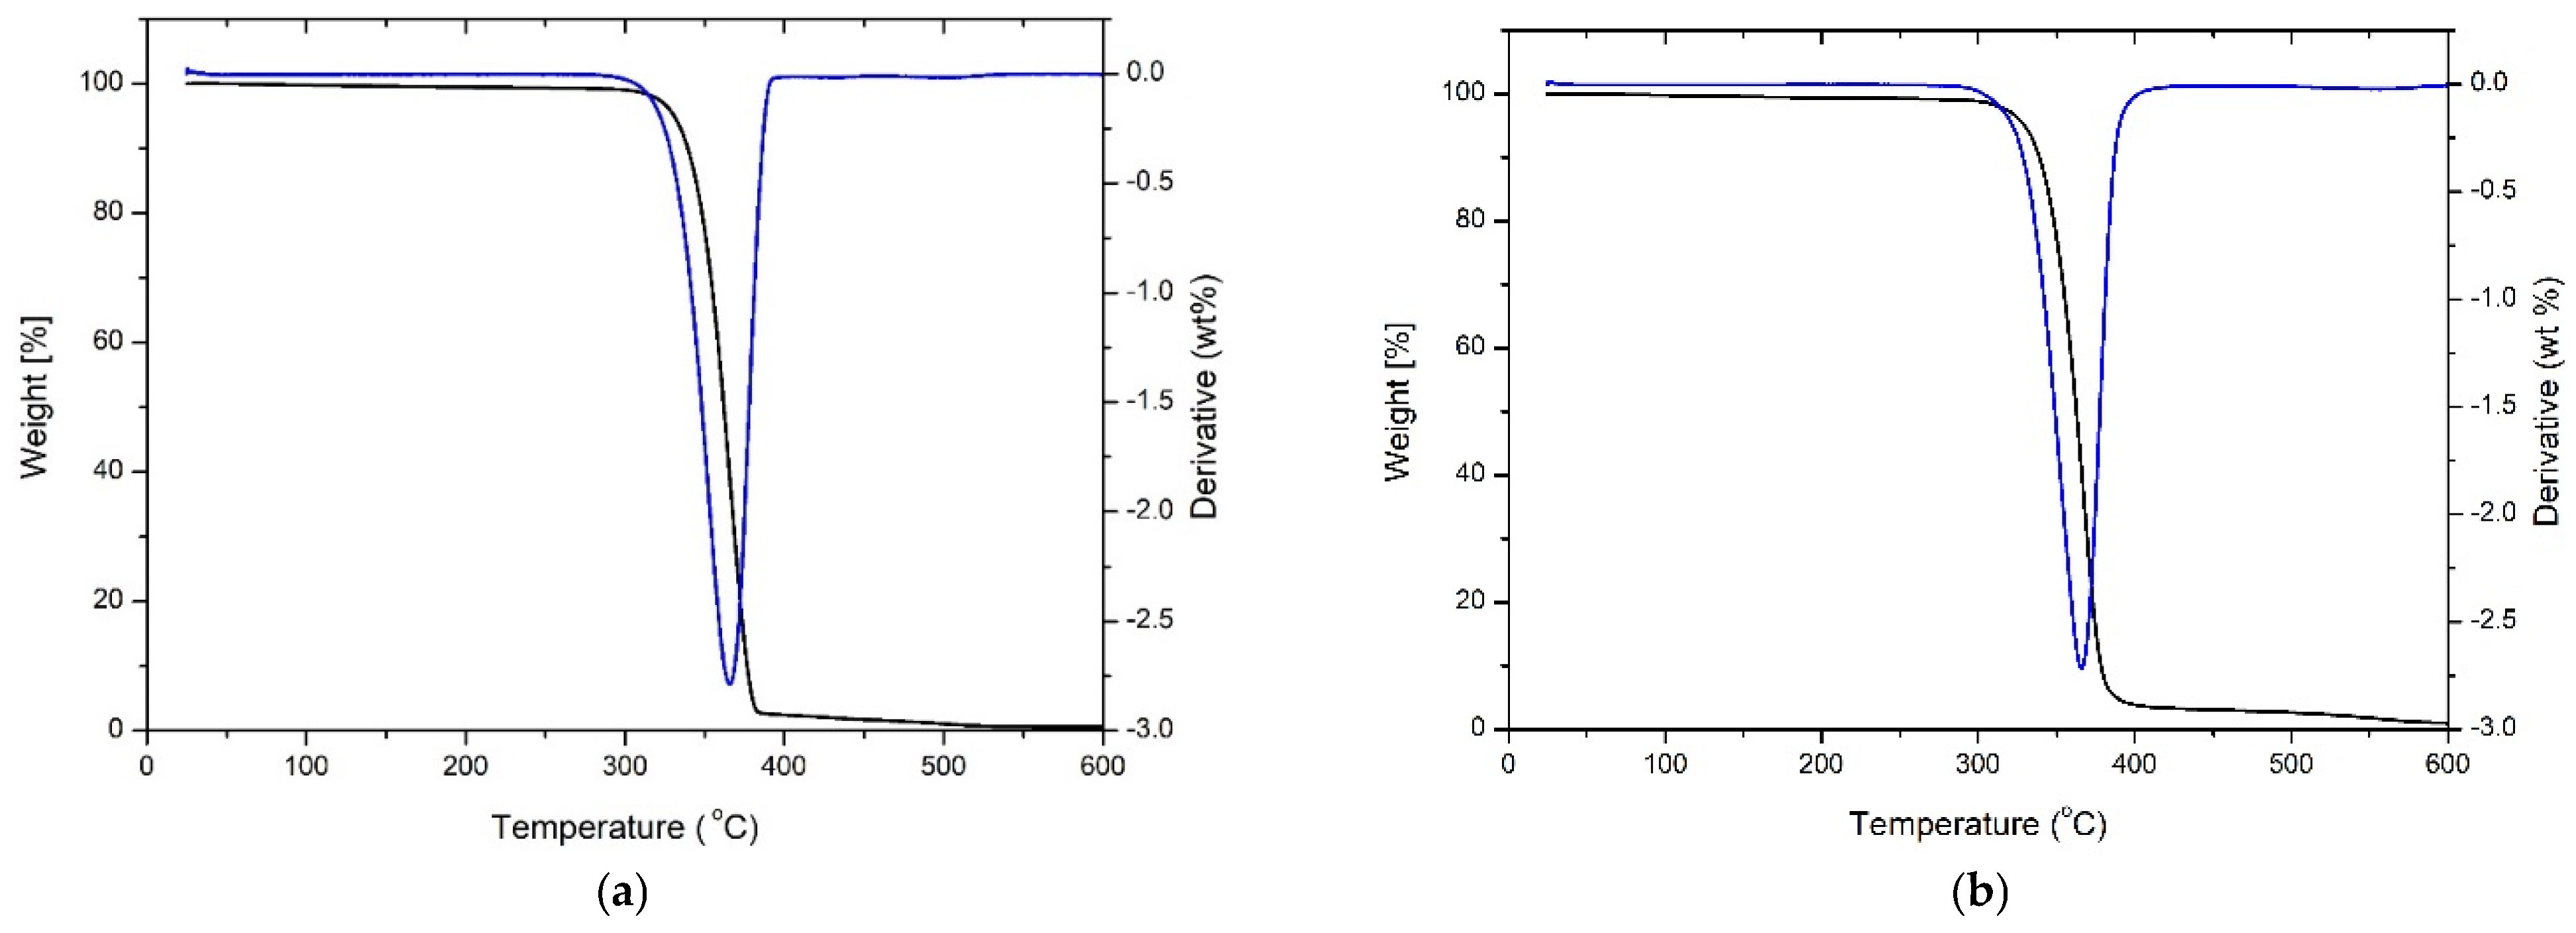
Thermal analyses show that both vPLA and rPLA begin to degrade at 330 °C; however, rPLA attains a higher end-of-degradation temperature (461.7 °C) and exhibits a higher residual mass at 600 °C. These findings suggest that despite rPLA’s generally lower tensile strength, its enhanced crystallinity results in superior thermal stability, a factor that can extend the operational range of the printed parts. The combination of these thermal benefits with improved mechanical performance highlights the potential of multi-material FDM to overcome the limitations typically associated with recycled polymers.
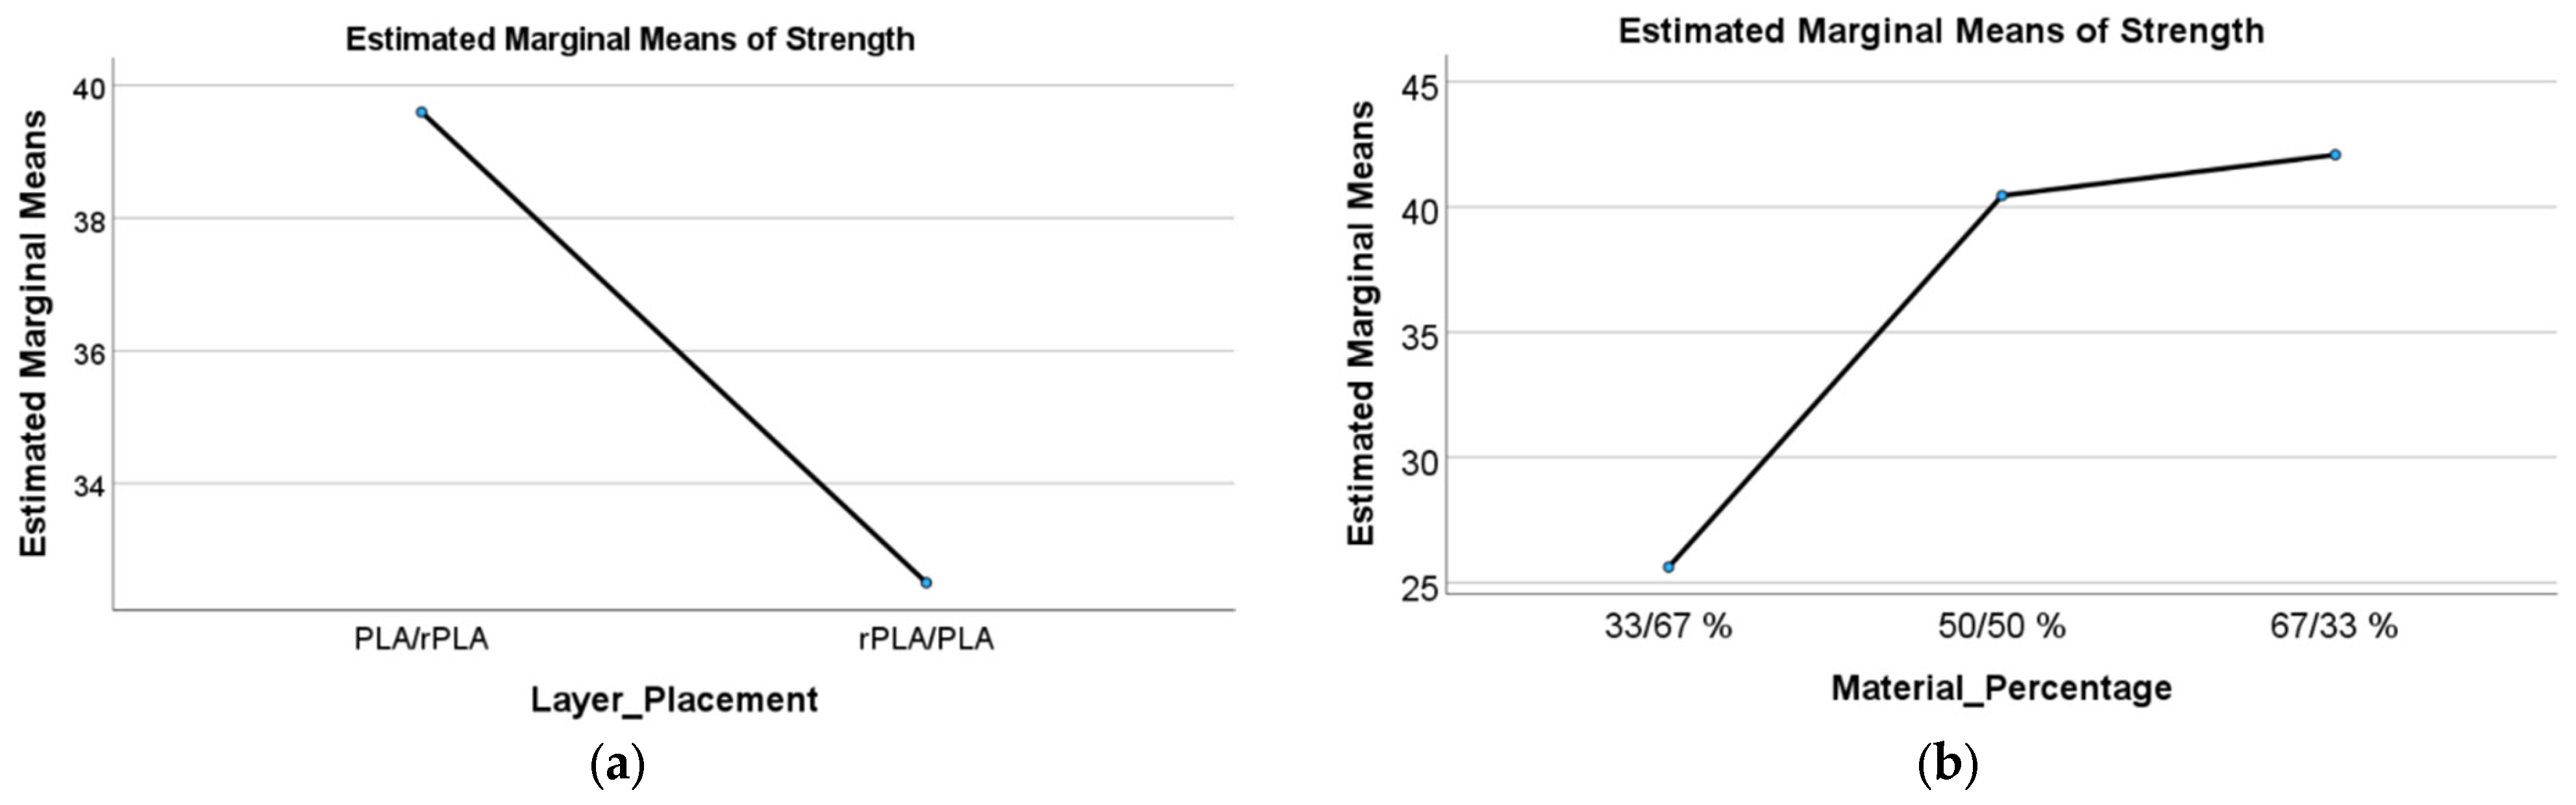
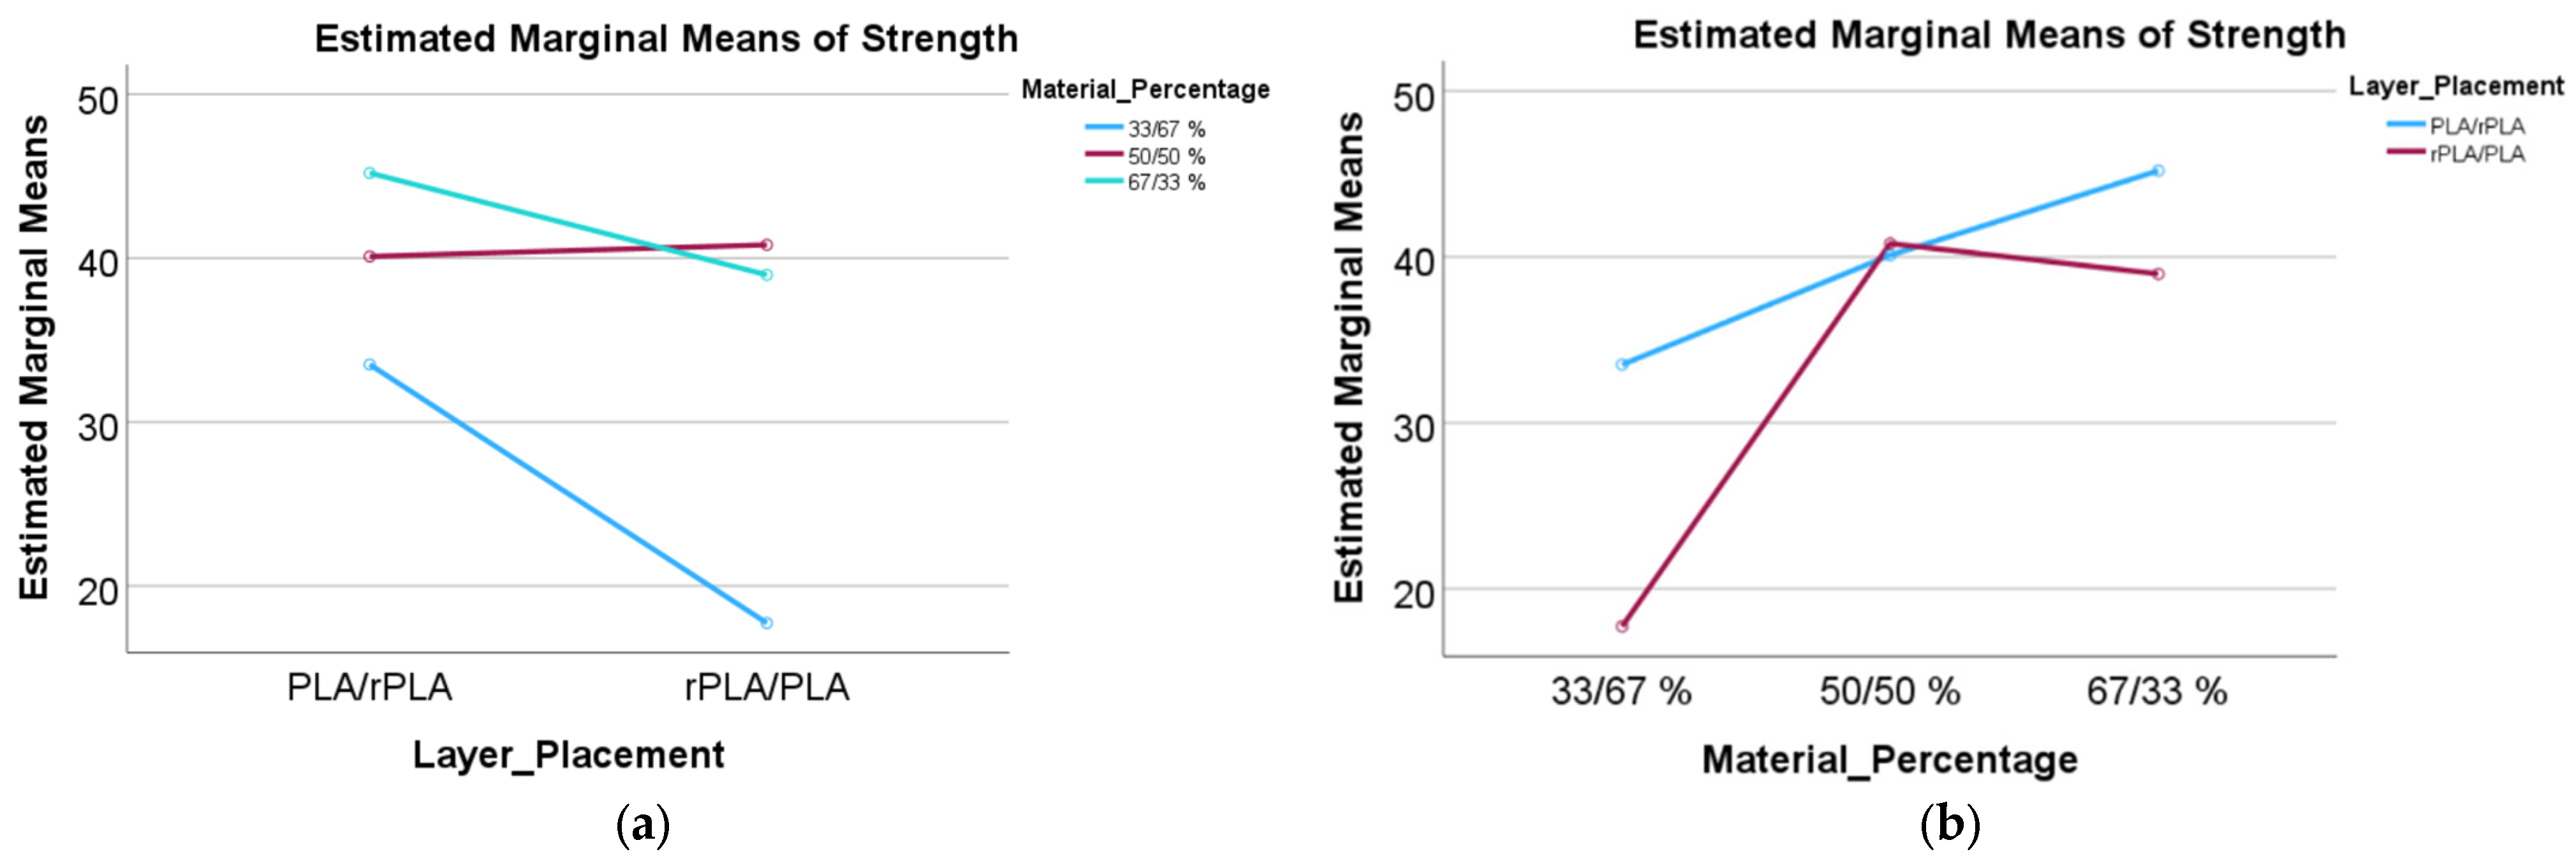
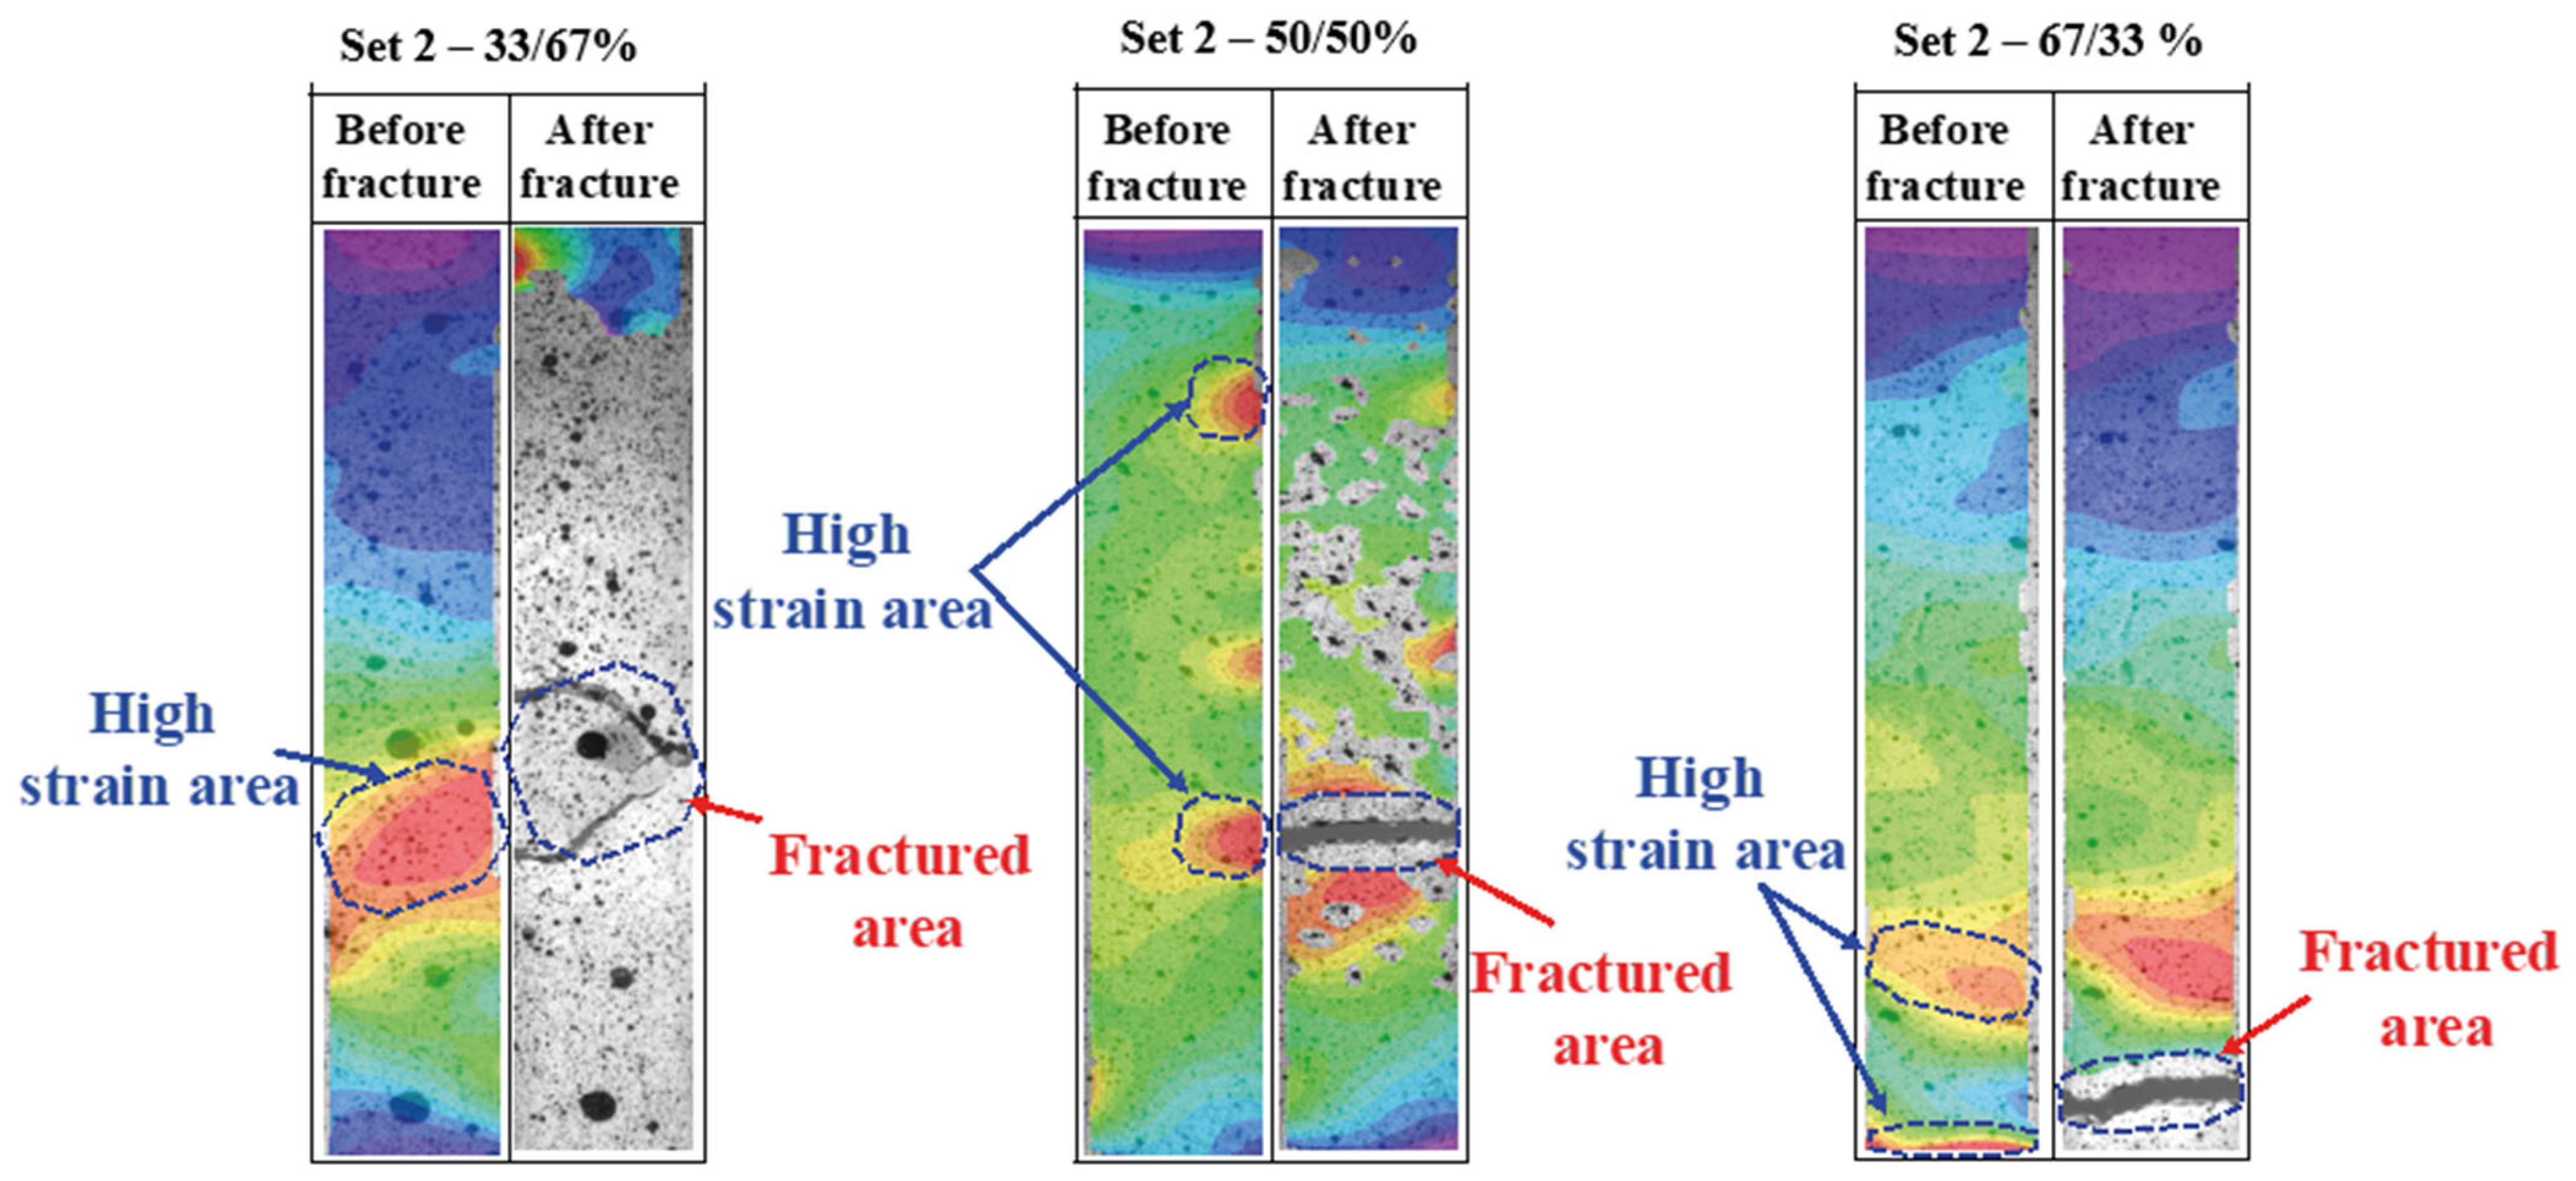
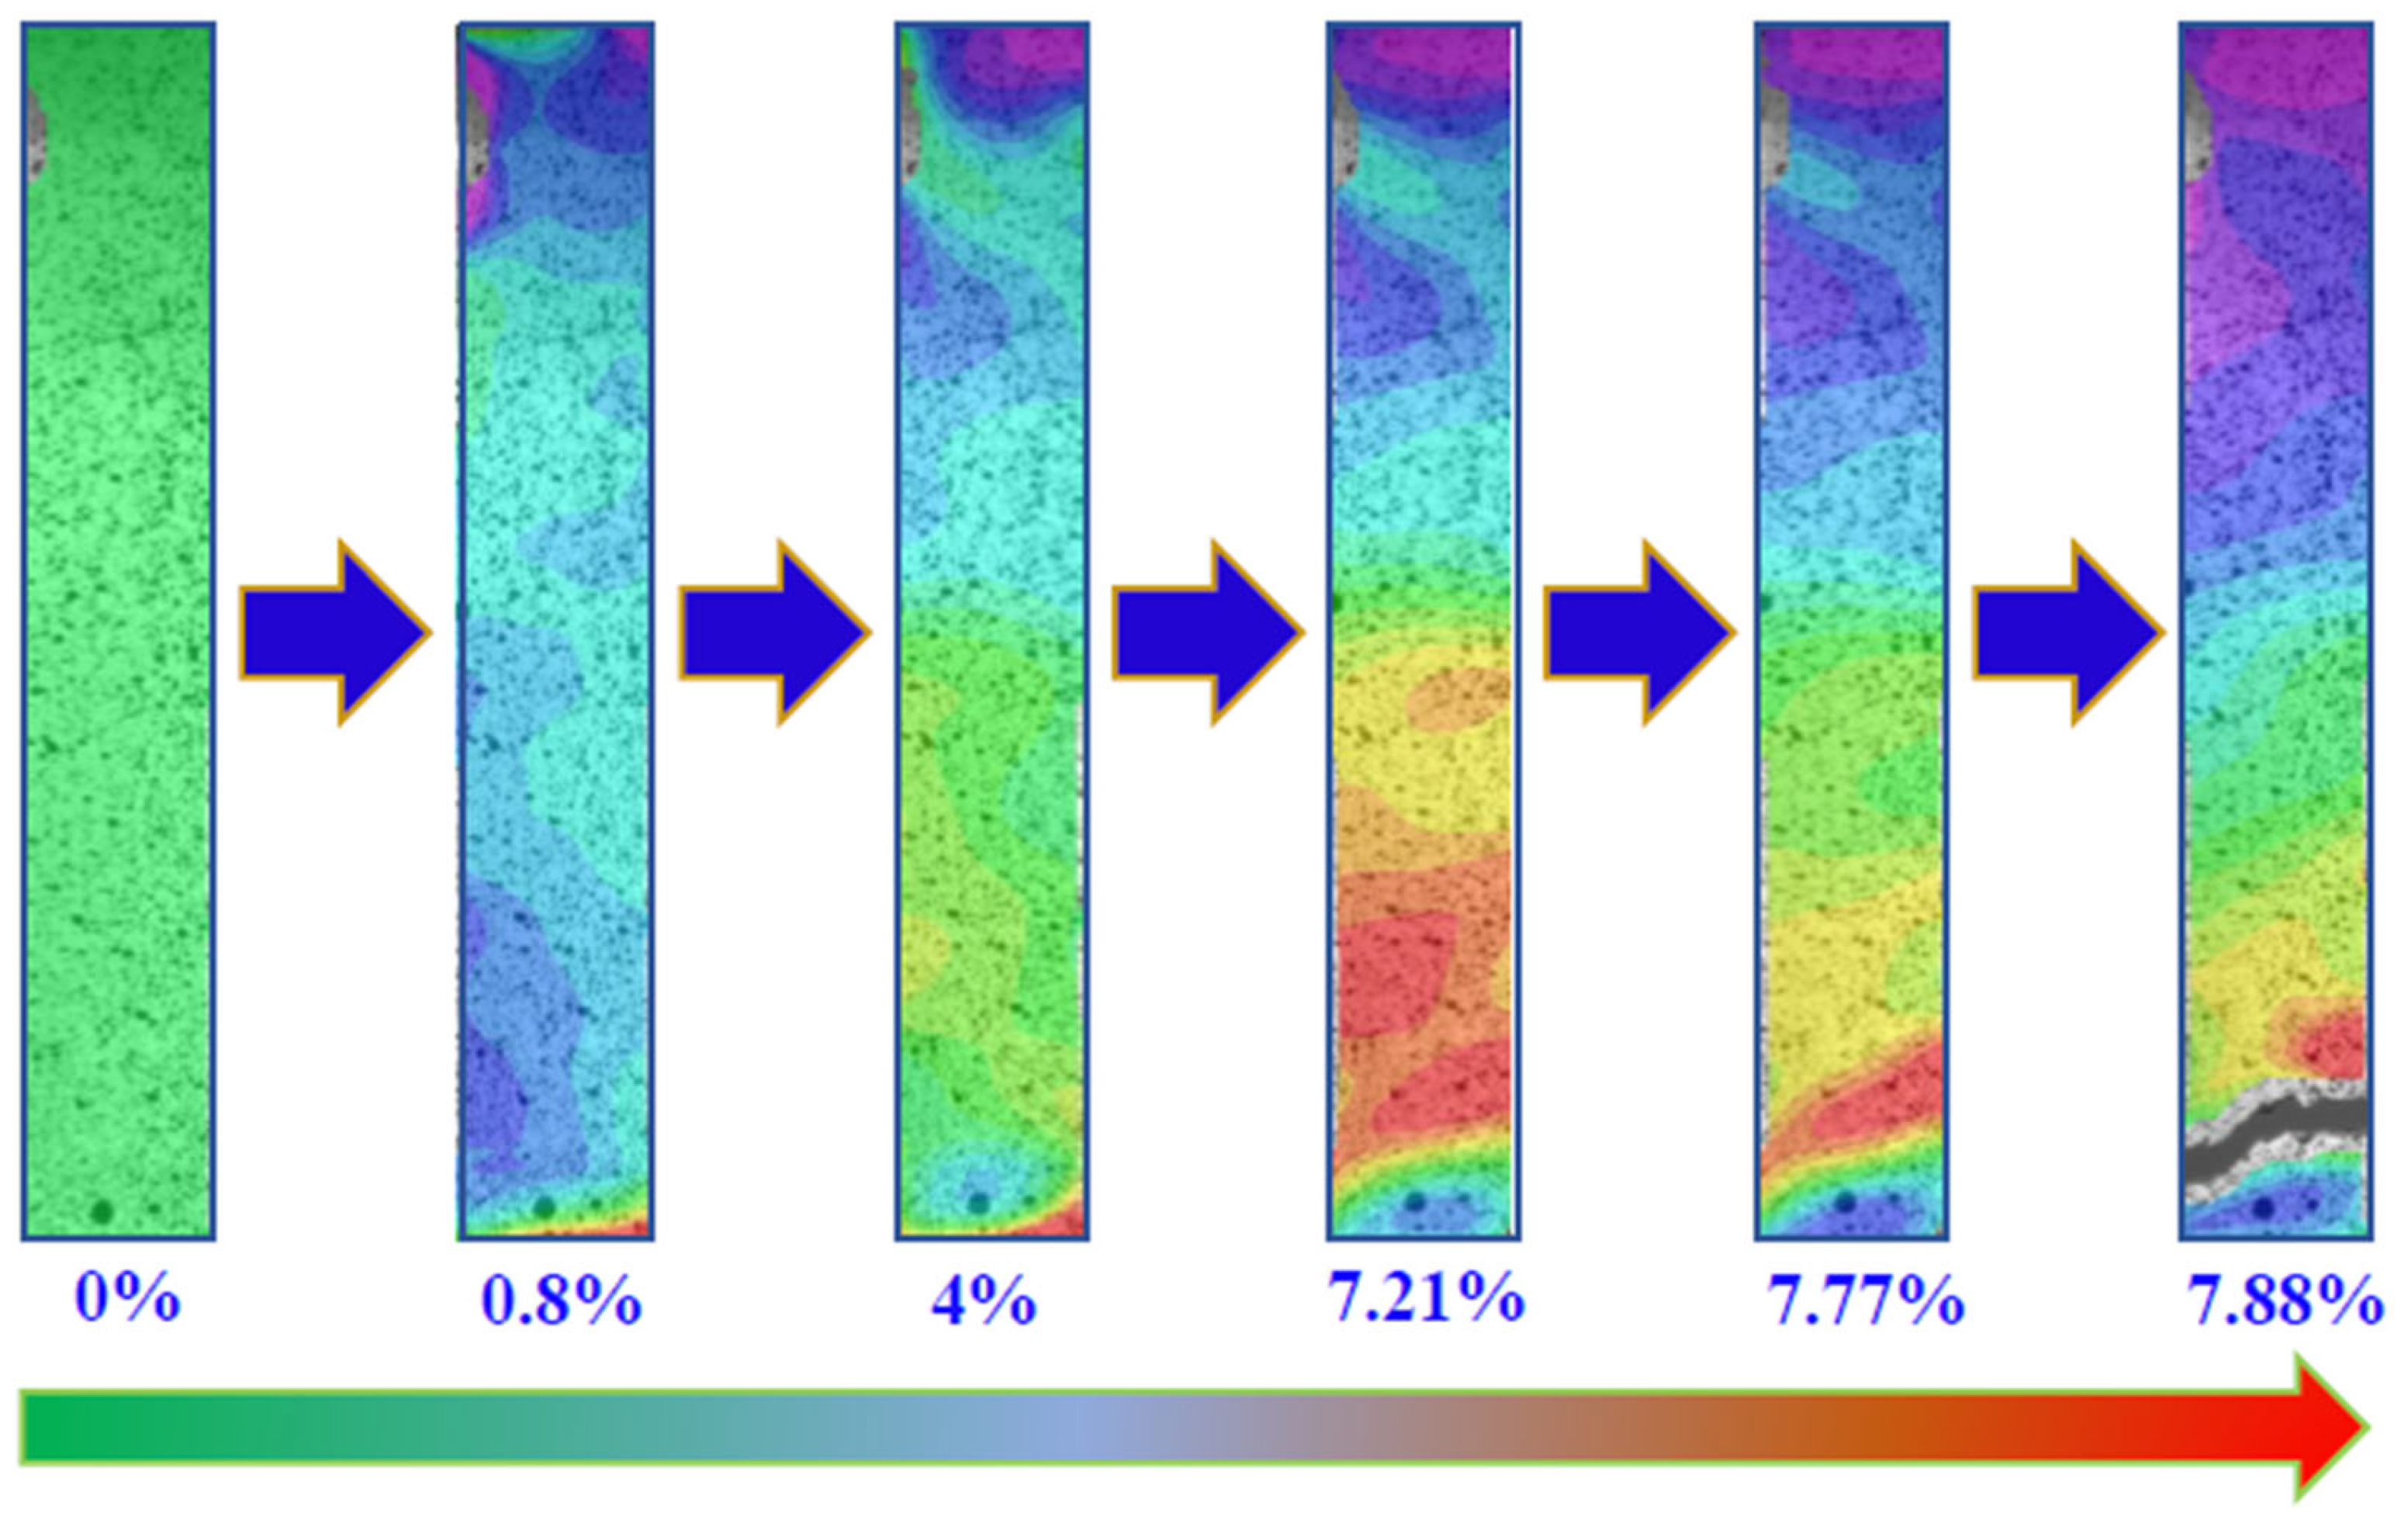
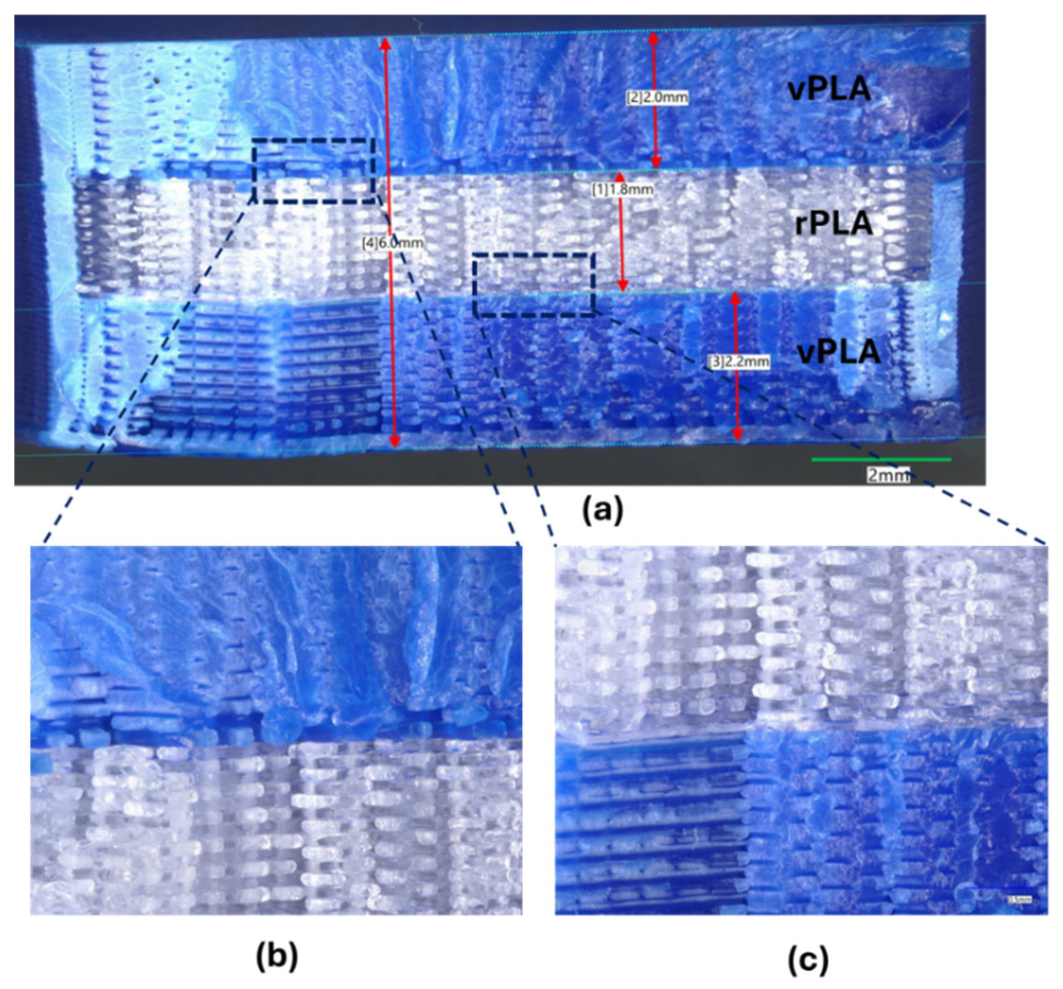
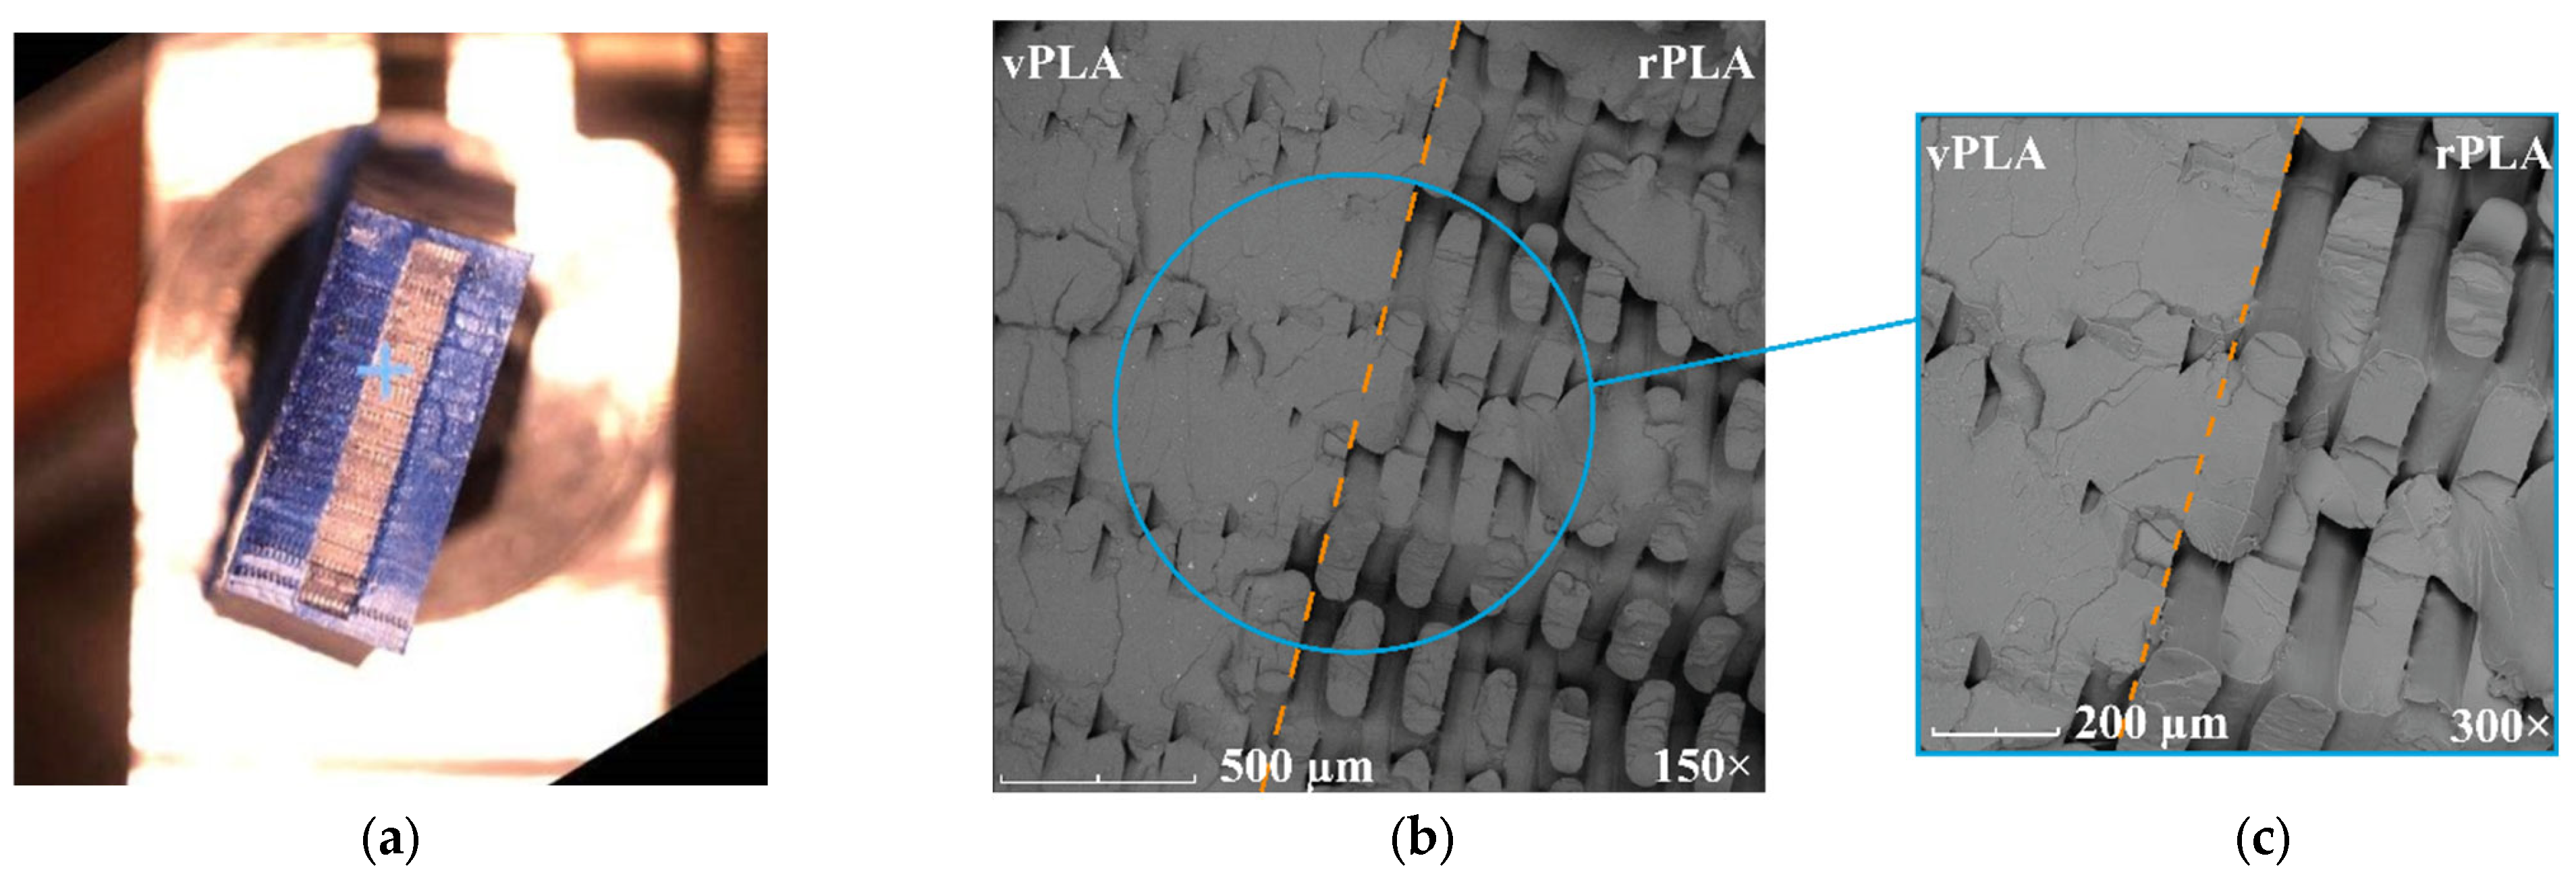
Furthermore, full-field strain mapping combined with DM and SEM analyses confirms that vPLA-dominant regions exhibit more uniform interlayer adhesion and fewer defects such as voids and microcracks, when compared with regions where rPLA is used as the external layer. This relationship between microstructural integrity and macroscopic performance has been established through statistical evaluation. ANOVA results reveal that both the material composition and layer placement significantly affect the performance, with high effect sizes (partial eta squared values of 0.952 for layer placement, 0.988 for material ratio, and 0.947 for their interaction) highlighting the sensitivity of the process to these parameters.
Overall, this work not only establishes a foundation for the industrial application of FDM-MMAM but also advances the understanding of material interactions in recycled polymer systems. By addressing critical gaps, ranging from microstructural characterisation to sustainability considerations, it offers a comprehensive framework for future innovations in high-performance, environmentally responsible additive manufacturing.

Author Contributions

Conceptualization, N.N.; Methodology, N.N.; Software, M.N.A.; Formal analysis, N.N. and M.N.A.; Investigation, F.A.; Data curation, N.N., M.N.A. and F.A.; Writing—original draft, N.N.; Writing—review & editing, M.A., M.I.U.H. and G.R. All authors have read and agreed to the published version of the manuscript.

Funding

This research received no external funding.

Institutional Review Board Statement

Not applicable.

Informed Consent Statement

Not applicable.

Data Availability Statement

All data are available from the corresponding author upon reasonable request.

Acknowledgments

We sincerely thank David Winter for developing the multi-material tensile samples at the University of Sunderland. Our appreciation also goes to Trevor Groves for his support with the SEM images and to Harvey Tew for his assistance with digital imaging. We would like to thank Spyros Fakiridis for his support with the TGA measurements and the University of Sunderland for funding this research.

Conflicts of Interest

The authors declare no conflict of interest.

References

  1. Hasan, M.R.; Davies, I.J.; Pramanik, A.; John, M.; Biswas, W.K. Impact of process parameters on improving the performance of 3D printed recycled polylactic acid (rPLA) components. Int. J. Adv. Manuf. Technol. 2024, 131, 3751–3779. [Google Scholar] [CrossRef]
  2. Woern, A.L.; Byard, D.J.; Oakley, R.B.; Fiedler, M.J.; Snabes, S.L.; Pearce, J.M. Fused particle fabrication 3-D printing: Recycled materials’ optimization and mechanical properties. Materials 2018, 11, 1413. [Google Scholar] [CrossRef]
  3. Tănase, M.; Portoacă, A.I.; Diniță, A.; Brănoiu, G.; Zamfir, F.; Sirbu, E.E.; Călin, C. Optimizing Mechanical Properties of Recycled 3D-Printed PLA Parts for Sustainable Packaging Solutions Using Experimental Analysis and Machine Learning. Polymers 2024, 16, 3268. [Google Scholar] [CrossRef]
  4. Naveed, N. Investigate the effects of process parameters on material properties and microstructural changes of 3D-printed specimens using fused deposition modelling (FDM). Mater. Technol. 2021, 36, 317–330. [Google Scholar] [CrossRef]
  5. Syrlybayev, D.; Zharylkassyn, B.; Seisekulova, A.; Akhmetov, M.; Perveen, A.; Talamona, D. Optimisation of strength properties of FDM printed parts—A critical review. Polymers 2021, 13, 1587. [Google Scholar] [CrossRef]
  6. Marșavina, L.; Vălean, C.; Mărghitaș, M.; Linul, E.; Razavi, N.; Berto, F.; Brighenti, R. Effect of the manufacturing parameters on the tensile and fracture properties of FDM 3D-printed PLA specimens. Eng. Fract. Mech. 2022, 274, 108766. [Google Scholar] [CrossRef]
  7. Plamadiala, I.; Croitoru, C.; Pop, M.A.; Roata, I.C. Enhancing Polylactic Acid (PLA) Performance: A Review of Additives in Fused Deposition Modelling (FDM) Filaments. Polymers 2025, 17, 191. [Google Scholar] [CrossRef]
  8. Babagowda, R.S. Kadadevara Math, R.; Goutham, K.R. Srinivas Prasad, Study of Effects on Mechanical Properties of PLA Filament which is blended with Recycled PLA Materials. IOP Conf. Ser. Mater. Sci. Eng. 2018, 310, 012103. [Google Scholar] [CrossRef]
  9. Hasan, M.R.; Davies, I.J.; Pramanik, A.; John, M.; Biswas, W.K. Potential of recycled PLA in 3D printing: A review. Sustain. Manuf. Serv. Econ. 2024, 3, 100020. [Google Scholar] [CrossRef]
  10. Budin, S.; Maideen, N.C.; Koay, M.H.; Ibrahim, D.; Yusoff, H. A comparison study on mechanical properties of virgin and recycled polylactic acid (PLA). J. Phys. Conf. Ser. 2019, 1349, 012002. [Google Scholar] [CrossRef]
  11. Zenkiewicz, M.; Richert, J.; Rytlewski, P.; Moraczewski, K.; Stepczyńska, M.; Karasiewicz, T. Characterisation of multi-extruded poly(lactic acid). Polym. Test. 2009, 28, 412–418. [Google Scholar] [CrossRef]
  12. Hasanov, S.; Alkunte, S.; Rajeshirke, M.; Gupta, A.; Huseynov, O.; Fidan, I.; Alifui-Segbaya, F.; Rennie, A. Review on additive manufacturing of multi-material parts: Progress and challenges. J. Manuf. Mater. Process. 2022, 6, 4. [Google Scholar] [CrossRef]
  13. Nazir, A.; Gokcekaya, O.; Billah, K.M.M.; Ertugrul, O.; Jiang, J.; Sun, J.; Hussain, S. Multi-material additive manufacturing: A systematic review of design, properties, applications, challenges, and 3D printing of materials and cellular metamaterials. Mater. Des. 2023, 226, 111661. [Google Scholar] [CrossRef]
  14. García-Collado, A.; Blanco, J.M.; Gupta, M.K.; Dorado-Vicente, R. Advances in polymers based Multi-Material Additive-Manufacturing Techniques: State-of-art review on properties and applications. Addit. Manuf. 2022, 50, 102577. [Google Scholar] [CrossRef]
  15. Lopes, L.R.; Silva, A.F.; Carneiro, O.S. Multi-material 3D printing: The relevance of materials affinity on the boundary interface performance. Addit. Manuf. 2018, 23, 45–52. [Google Scholar] [CrossRef]
  16. Singh, R.; Kumar, R.; Farina, I.; Colangelo, F.; Feo, L.; Fraternali, F. Multi-material additive manufacturing of sustainable innovative materials and structures. Polymers 2019, 11, 62. [Google Scholar] [CrossRef]
  17. Verma, A.; Kapil, A.; Klobčar, D.; Sharma, A. A Review on Multiplicity in Multi-Material Additive Manufacturing: Process, Capability, Scale, and Structure. Materials 2023, 16, 5246. [Google Scholar] [CrossRef]
  18. Yin, J.; Lu, C.; Fu, J.; Huang, Y.; Zheng, Y. Interfacial bonding during multi-material fused deposition modeling (FDM) process due to inter-molecular diffusion. Mater. Des. 2018, 150, 104–112. [Google Scholar] [CrossRef]
  19. Pajonk, A.; Prieto, A.; Blum, U.; Knaack, U. Multi-material additive manufacturing in architecture and construction: A review. J. Build. Eng. 2022, 45, 103603. [Google Scholar] [CrossRef]
  20. Bakhtiari, H.; Aamir, M.; Tolouei-Rad, M. Effect of 3D Printing Parameters on the Fatigue Properties of Parts Manufactured by Fused Filament Fabrication: A Review. Appl. Sci. 2023, 13, 904. [Google Scholar] [CrossRef]
  21. Lokesh, N.; Praveena, B.A.; Reddy, J.S.; Vasu, V.K.; Vijaykumar, S. Evaluation on effect of printing process parameter through Taguchi approach on mechanical properties of 3D printed PLA specimens using FDM at constant printing temperature. Mater. Today Proc. 2022, 52, 1288–1293. [Google Scholar] [CrossRef]
  22. Gebrehiwot, S.Z.; Espinosa-Leal, L.; Linderbäck, P.; Remes, H. Optimising the mechanical properties of additive-manufactured recycled polylactic acid (rPLA) using single and multi-response analyses methods. Int. J. Adv. Manuf. Technol. 2023, 129, 4909–4924. [Google Scholar] [CrossRef]
  23. Chahdoura, S.; Bahloul, R.; Tlija, M.; Tahan, A. Multi-objective optimization of PLA-FDM parameters for enhancement of industrial product mechanical performance based on GRA-RSM and BBD. Prog. Addit. Manuf. 2024, 10, 1355–1383. [Google Scholar] [CrossRef]
  24. Anderson, I. Mechanical Properties of Specimens 3D Printed with Virgin and Recycled Polylactic Acid. 3D Print. Addit. Manuf. 2017, 4, 110–115. [Google Scholar] [CrossRef]
  25. Bergaliyeva, S.; Sales, D.L.; Delgado, F.J.; Bolegenova, S.; Molina, S.I. Manufacture and Characterization of Polylactic Acid Filaments Recycled from Real Waste for 3D Printing. Polymers 2023, 15, 2165. [Google Scholar] [CrossRef]
  26. Agbakoba, V.C.; Webb, N.; Jegede, E.; Phillips, R.; Hlangothi, S.P.; John, M.J. Mechanical Recycling of Waste PLA Generated From 3D Printing Activities: Filament Production and Thermomechanical Analysis. Macromol. Mater. Eng. 2024, 309, 2300276. [Google Scholar] [CrossRef]
  27. Aly, R.; Olalere, O.; Ryder, A.; Alyammahi, M.; Samad, W.A. Mechanical Property Characterization of Virgin and Recycled PLA Blends in Single-Screw Filament Extrusion for 3D Printing. Polymers 2024, 16, 3569. [Google Scholar] [CrossRef]
  28. Voulvoulis, V.; Kirkman, N.; Giakoumis, R.; Metivier, T.; Kyle, P.; Midgley, C. Examining Material Evidence. The Carbon Fingerprint; Imperial College London: London, UK, 2020; pp. 1–15. [Google Scholar]
  29. Gomes, T.E.; Cadete, M.S.; Dias-de-Oliveira, J.; Neto, V. Controlling the properties of parts 3D printed from recycled thermoplastics: A review of current practices. Polym. Degrad. Stab. 2022, 196, 109850. [Google Scholar] [CrossRef]
  30. Naveed, N. Investigating the material properties and microstructural changes of fused filament fabricated PLA and tough-PLA parts. Polymers 2021, 13, 1487. [Google Scholar] [CrossRef]
  31. Pimenov, D.Y.; Mia, M.; Gupta, M.K.; Machado, Á.R.; Pintaude, G.; Unune, D.R.; Khanna, N.; Khan, A.M.; Tomaz, Í.; Wojciechowski, S.; et al. Resource saving by optimization and machining environments for sustainable manufacturing: A review and future prospects. Renew. Sustain. Energy Rev. 2022, 166, 112660. [Google Scholar] [CrossRef]
  32. Allwood, J.M. Squaring the Circular Economy: The Role of Recycling within a Hierarchy of Material Management Strategies. In Handbook of Recycling: State-of-The-Art for Practitioners, Analysts, and Scientists; Elsevier: Amsterdam, The Netherlands, 2014; pp. 445–477. [Google Scholar] [CrossRef]
  33. Ribeiro, M.C.S.; Fiúza, A.; Ferreira, A.; Dinis, M.D.L.; Castro, A.C.M.; Meixedo, J.P.; Alvim, M.R. Recycling approach towards sustainability advance of composite materials’ industry. Recycling 2016, 1, 178–193. [Google Scholar] [CrossRef]
Figure 1. Schematic diagram of a typical FDM-MMAM process.
Sustainability 17 06105 g001
Figure 2. Tensile sample dimensions.
Sustainability 17 06105 g002
Figure 3. Set 1 staking sequence (vPLA: rPLA).
Sustainability 17 06105 g003
Figure 4. Set 2 staking sequence (rPLA: vPLA).
Sustainability 17 06105 g004
Figure 5. (a) 3D-DIC tensile sample dimensions and (b) fabricated sample with high-contrast speckled pattern.
Sustainability 17 06105 g005
Figure 6. Experimental set-up of the tensile test for DIC method.
Sustainability 17 06105 g006
Figure 7. (a) Stress–strain curves, (b) tensile strength, and (c) elongation for MMAM samples. The 100% vPLA and 100% rPLA samples are included as baseline references for comparison against the mixed-ratio specimens.
Sustainability 17 06105 g007
Figure 8. (a) Influence of layer placement on tensile strength and (b) influence of material ratio on tensile strength.
Sustainability 17 06105 g008
Figure 9. (a) Layer placement × material ratio on tensile strength and (b) material ratio × layer placement on tensile strength.
Sustainability 17 06105 g009
Figure 10. Set 1 samples (vPLA: rPLA) before and after fracture. The colours represent different strain levels, with cooler colours (blue and purple) indicating low strain areas and warmer colours (yellow, orange, and red) indicating high strain areas.
Sustainability 17 06105 g010
Figure 11. Set 2 samples (rPLA: vPLA) before and after fracture. The colours represent different strain levels, with cooler colours (blue and purple) indicating low strain areas and warmer colours (yellow, orange, and red) indicating high strain areas.
Sustainability 17 06105 g011
Figure 12. Full-field strain and the strain localisation evolution up to the final failure of set 1 sample (vPLA: rPLA)—33:67%.
Sustainability 17 06105 g012
Figure 13. (a) TGA curves for PLA and rPLA heated at 10 °C/min to 600 °C and (b) plot of the smoothed first derivative of weight (%) showing the temperature at the maximum rate of decomposition (Tm) for vPLA and rPLA.
Sustainability 17 06105 g013
Figure 14. Comparison of TGA curves (black) and their smoothed derivative curves (blue) for (a) vPLA and (b) rPLA, showing weight loss and decomposition rate as a function of temperature.
Sustainability 17 06105 g014
Figure 15. DSC scans showing first and second heating cycles at 10 °C/min.
Sustainability 17 06105 g015
Figure 16. DM image analysis. (a) Covers the full width of the sample. (b,c) Show close-ups of the sample at the interface area of both vPLA and rPLA.
Sustainability 17 06105 g016
Figure 17. SEM images showing (a) the fractured surface of the sample position of the SEM image on the sample, (b) SEM image across the interface of both materials, and (c) close-up of the SEM image.
Sustainability 17 06105 g017
Table 1. Main advantages and challenges of MMAM for FDM.
Advantages of MMAMRefs.Challenges in MMAMRefs.
Tailored properties: Enables functionally graded materials with site-specific mechanical/thermal characteristics unattainable with a single material.[12,16]Interfacial bonding: Achieving strong adhesion between dissimilar materials is difficult due to incompatible melting points and thermal expansion, leading to delamination.[17,18]
Complete fabrication: Integrates multiple components or functions in one print, eliminating separate manufacturing and enabling easy removal of support structures.[19]Process complexity: Managing multiple extruders/feed systems increases alignment errors and deposition irregularities, requiring advanced hardware and slicing strategies.[19]
Improved functionality: Combines materials to optimise performance (e.g., using tough materials in high-stress areas for superior strength-to-weight ratios and energy absorption).[12,16]Thermal variance: Differences in cooling and shrinkage rates induce residual stresses and warping, especially in FDM’s rapidly cooled layers.
Design freedom: Allows accurate placement of different materials for complex internal layouts that are difficult or impossible to assemble manually. Material compatibility: The range of co-printable materials is limited by differences in chemistry and processing windows.[13,18]
Table 2. Influence of key FDM process parameters on the mechanical properties of PLA parts.
Process ParameterEffect on PLA Mechanical PerformanceRepresentative FindingsRef.
Layer thicknessControls the contour of each deposited layer and the contact area between layers. Finer layers (e.g., 0.1–0.2 mm) generally enhance interlayer bonding; however, excessively thin layers can cause thermal buildup, while overly thick layers introduce voids.Optimal intermediate layer height increases tensile strength; although finer layers improve cohesion, their influence may be less critical than infill density or raster orientation under certain conditions.[1]
Nozzle temperatureDetermines the polymer’s melt viscosity and the degree of interlayer interdiffusion. An optimal range ensures proper bonding, whereas temperatures too low lead to inadequate wetting and too high cause thermal degradation.Optimised nozzle temperatures improve layer fusion and reduce voids, with the optimal window typically around 200–220 °C yielding stronger parts compared to prints produced at temperatures outside this range.[1]
Infill densityDictates the internal solidity of the part. Higher infill reduces voids and increases strength and stiffness, while lower infill creates a lighter structure with reduced load-bearing capacity.A near-linear correlation exists between infill density and tensile strength; parts with high infill (e.g., >80%) tend to approach solid material properties, whereas very low infill (<20%) significantly compromises mechanical performance.[1]
Infill pattern and raster orientationInfluences internal geometry and stress distribution. Continuous, aligned raster patterns increase strength by providing uniform load transfer, while misaligned or irregular patterns result in reduced effective strength.Aligning raster orientation with the load direction (e.g., 0° alignment) yields higher tensile strength and modulus, whereas angled or lattice patterns are less effective in managing stress.[22,23]
Build orientationDetermines how the part is oriented relative to the load. Horizontal (XY) orientations produce continuous filament paths along the load direction, enhancing strength, while vertical (Z) orientations rely on weaker interlayer bonds.Orientation impacts anisotropic strength. Flat-oriented builds typically exhibit 30–50% higher tensile strength than upright builds, due to the alignment of continuous filaments along the primary stress axis.[1]
Print speedAffects the cooling and solidification dynamics. Moderate speeds allow sufficient time for interlayer fusion, while speeds too fast may cause under-extrusion, and speeds too slow can lead to overheating or thermal distortion.Optimal print speeds (generally around 40–60 mm/s) promote robust interlayer adhesion and reduce defects. Deviations from this range can lead to a measurable decline in tensile strength, though print speed tends to have a smaller impact relative to infill density and nozzle temperature.[1]
Table 3. Selected studies comparing mechanical properties of vPLA vs. rPLA.
Material and MethodSummary of Key FindingsRef.
vPLA vs. rPLA (FDM)rPLA 10% lower than vPLA
rPLA showed a 10.9% decrease in tensile strength compared to vPLA, with a slight 6.8% increase in shear strength and 2.4% decrease in hardness. Demonstrated viability of recycled filament despite modest strength loss.
[24]
vPLA vs. rPLA (Injection-moulded)rPLA 11% lower than vPLA
rPLA had ~11% lower UTS than vPLA, accompanied by drops in impact strength (~50%) and hardness (~4%). Decline attributed to molecular chain scission from thermal reprocessing.
[10]
75% rPLA/25% vPLA vs. vPLA (FDM)rPLA 19% higher than vPLA
A 75% rPLA/25% vPLA blend increased tensile strength by ~19% relative to vPLA. Smaller voids and better interlayer bonding in the recycled blend were observed versus larger voids in vPLA.
[25]
100% rPLA vs. 100% vPLA (FDM)rPLA slightly higher (34.4 vs. 31.6 MPa)
Filament made from 100% rPLA achieved UTS 34.4 MPa versus 31.6 MPa for virgin filament, indicating rPLA matched or exceeded virgin strength in this case. The improvement was attributed to increased crystallinity from the reprocessing of PLA.
[26]
0–100% rPLA in 10% steps (FDM)100% vPLA and rPLA ~50% higher than commercial
Both 100% vPLA and 100% r PLA filaments had ~50% higher UTS than commercial filament; the 50:50 blend also performed well, due to improved crystallinity and interlayer bonding.
[27]
Table 4. Sustainability considerations for FDM using rPLA.
Sustainability AspectSignificance in FDM with rPLARefs.
Plastic waste reductionRepurposes failed prints and support material, reducing landfill loads and mitigating the plastic waste crisis.[10]
Resource and energy savingsAvoids producing new PLA, saving roughly 30% energy, thereby lowering the overall carbon footprint.[3,28]
Biodegradability and end-of-lifeExtends the useful life of PLA while retaining its compost-ability, ensuring a benign end-of-life[2,3]
Circular economy modelEnables closed-loop recycling by converting waste into new filament, supporting local and sustainable manufacturing.[3]
Table 5. Sample configurations for multi-material 3D printing.
SetLayer PlacementMaterial Ratio (Outer/Core), %Description
1vPLA/rPLA/vPLA33:67, 50:50, 67:33vPLA is used for the top and bottom layers. rPLA is used for the intermediate layers.
2rPLA/vPLA/rPLA33:67, 50:50, 67:33rPLA is used for the top and bottom layers. vPLA is used for the intermediate layers.
Table 6. FDM process parameters for specimen fabrication.
ParameterValueRationale
Infill density100%Ensures maximum material usage and consistent internal structure.
Raster angles45°:45°Provides balanced stress distribution in tensile specimens.
Infill speed35 mm/sOptimised for uniform extrusion; slower speeds improve layer fusion.
Bed temperature60 °CImproves first layer adhesion and reduces warping.
Extrusion multiplier1Calibrated to the measured filament diameter for accurate deposition.
Nozzle diameter0.4 mmStandard size balancing resolution and build speed.
Table 7. TGA parameters and conditions.
ParameterValueRationale
Sample mass~10 mgEnsures accurate mass loss measurement.
Heating rate10 °C/minBalances resolution with test duration.
Temperature rangeAmbient to 600 °CCaptures the full degradation profile.
AtmosphereNitrogen (inert)Prevents oxidation, ensuring intrinsic decomposition is measured.
Pan volume100 µLStandard container for small polymer samples.
Table 8. DSC parameters and conditions.
ParameterValueRationale
Sample preparationCompression-moulded filmsEnsures uniformity for reproducible thermal data.
Heating/cooling rate10 °C/minOptimal for detecting thermal transitions.
Temperature range20–300 °CCaptures Tg, Tm, and crystallisation events.
AtmosphereNitrogenMaintains an inert environment.
Table 9. Mechanical properties of MMAM specimens.
ConfigurationStacking SequenceMaterial Ratio (vPLA: rPLA)Tensile Modulus, MPaTensile Strength, MPaElongation, %
Set 1vPLA outer, rPLA core33:67416.6033.507.20
Set 2rPLA outer, vPLA core33:67609.8017.734.37
Set 1vPLA outer, rPLA core67:33288.6045.197.39
Set 2rPLA outer, vPLA core67:33471.6738.976.29
Set 1vPLA outer, rPLA core50:50451.8140.096.84
Set 2rPLA outer, vPLA core50:50451.2740.086.02
vPLA-100:0343.3044.245.53
rPLA-0:100900.2024.576.06
Table 10. SPSS results for tensile strength of MMAM specimens.
SourceType III Sum of SquaresdfMean SquareFSig.Partial Eta Squared
Corrected model1419.272 a5283.854295.2180.0000.992
Intercept23,390.528123,390.52824,326.9410.0001.000
Layer placement226.5071226.507235.5750.0000.952
Material percentage987.3562493.678513.4420.0000.988
Layer placement * material Percentage205.4092102.705106.8160.0000.947
Error11.538120.962---
Total24,821.33818----
Corrected total1430.81017----
a R squared = 0.992 (adjusted R squared = 0.989). * indicates an interaction effect between two factors.
Table 11. Summary of TGA parameters for vPLA and rPLA.
ParametervPLArPLA
Temperature at 5 wt% loss, °C330.83329.50
Temperature at 50 wt% loss, °C362.00362.67
End-of-degradation temperature, °C391.67461.67
Residue at 600 °C, wt%0.580.99
Table 12. The DSC plot displays key thermal properties for both vPLA and rPLA.
PropertyvPLA (1st Heating Cycle)rPLA (2nd Heating Cycle)
Melting Temperature (Tm)151.20 °C148.14 °C
Crystallisation Temperature (Tc)101.63 °C (cold crystallisation)110.63 °C (cold crystallisation)
Crystallisation Enthalpy (ΔHc)15.26 J/g (at ~90.76 °C)11.11 J/g (at ~102.55 °C)
Melting Enthalpy (ΔHm)17.29 J/g12.96 J/g
Disclaimer/Publisher’s Note: The statements, opinions and data contained in all publications are solely those of the individual author(s) and contributor(s) and not of MDPI and/or the editor(s). MDPI and/or the editor(s) disclaim responsibility for any injury to people or property resulting from any ideas, methods, instructions or products referred to in the content.

