
Identifying Priority Bird Habitats Through Seasonal Dynamics: An Integrated Habitat Suitability–Risk–Quality Framework


Abstract
1. Introduction
2. Materials
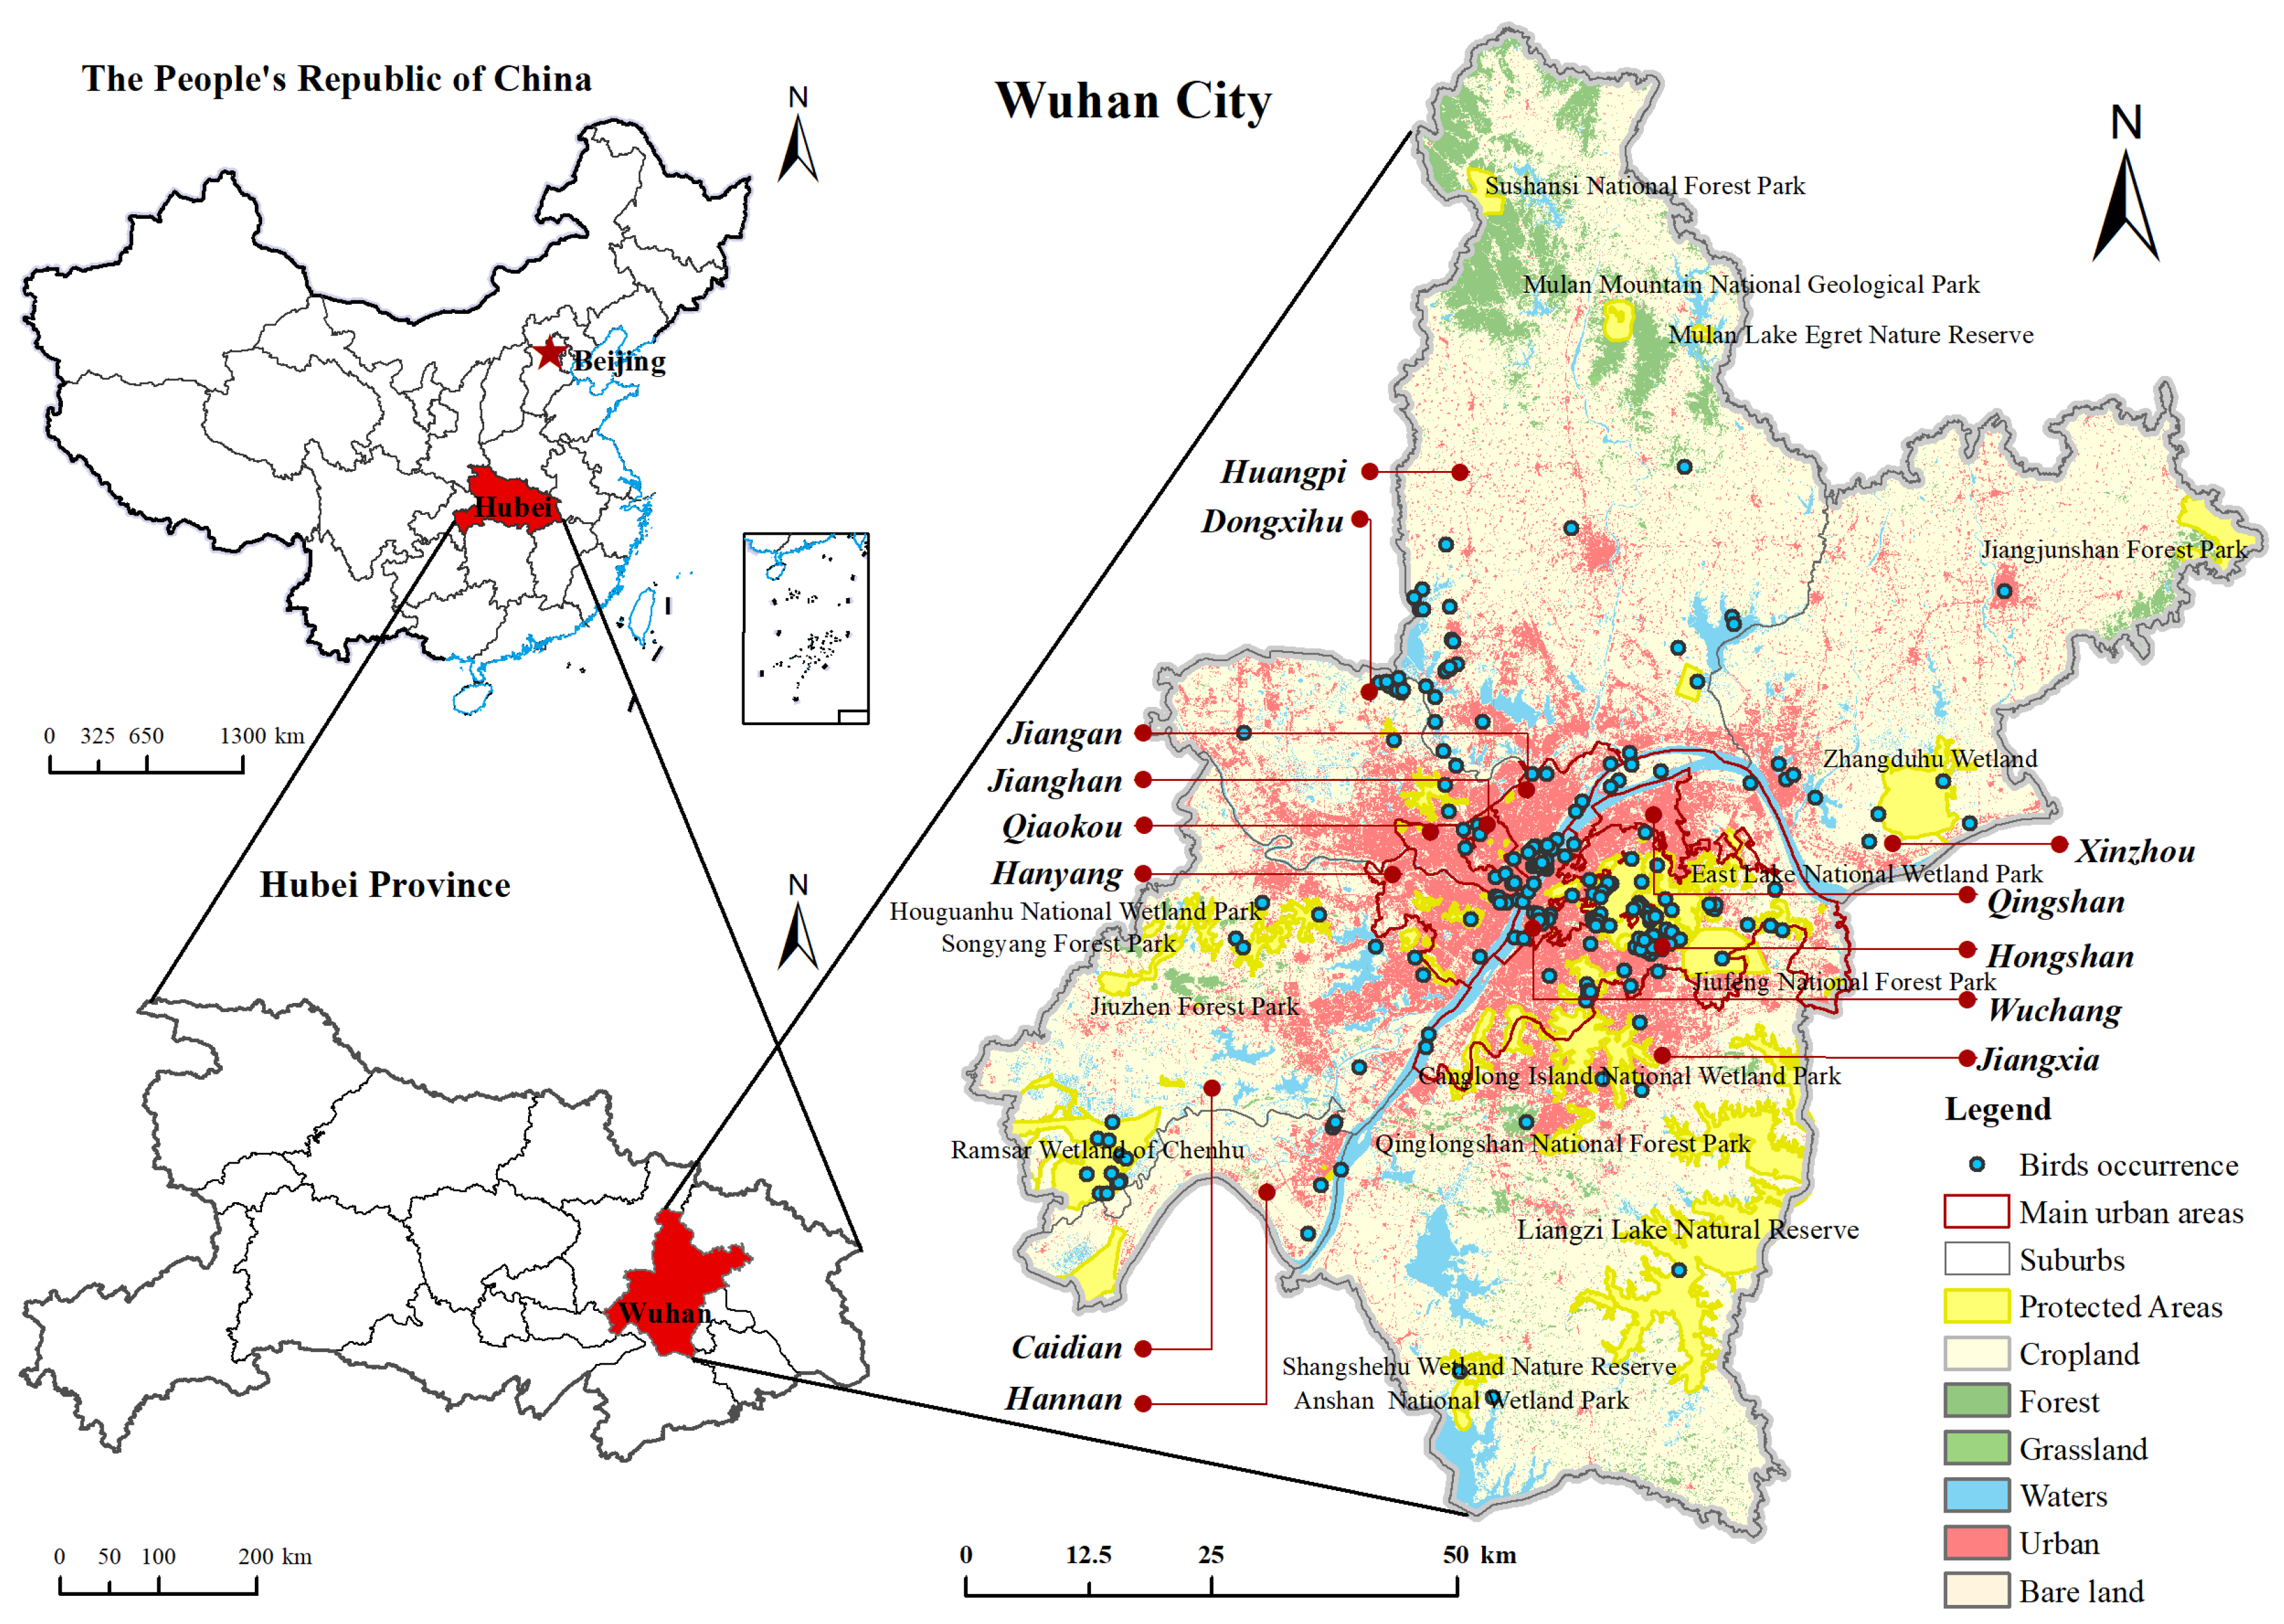
2.1. Study Area
2.2. Data Sources and Preparation
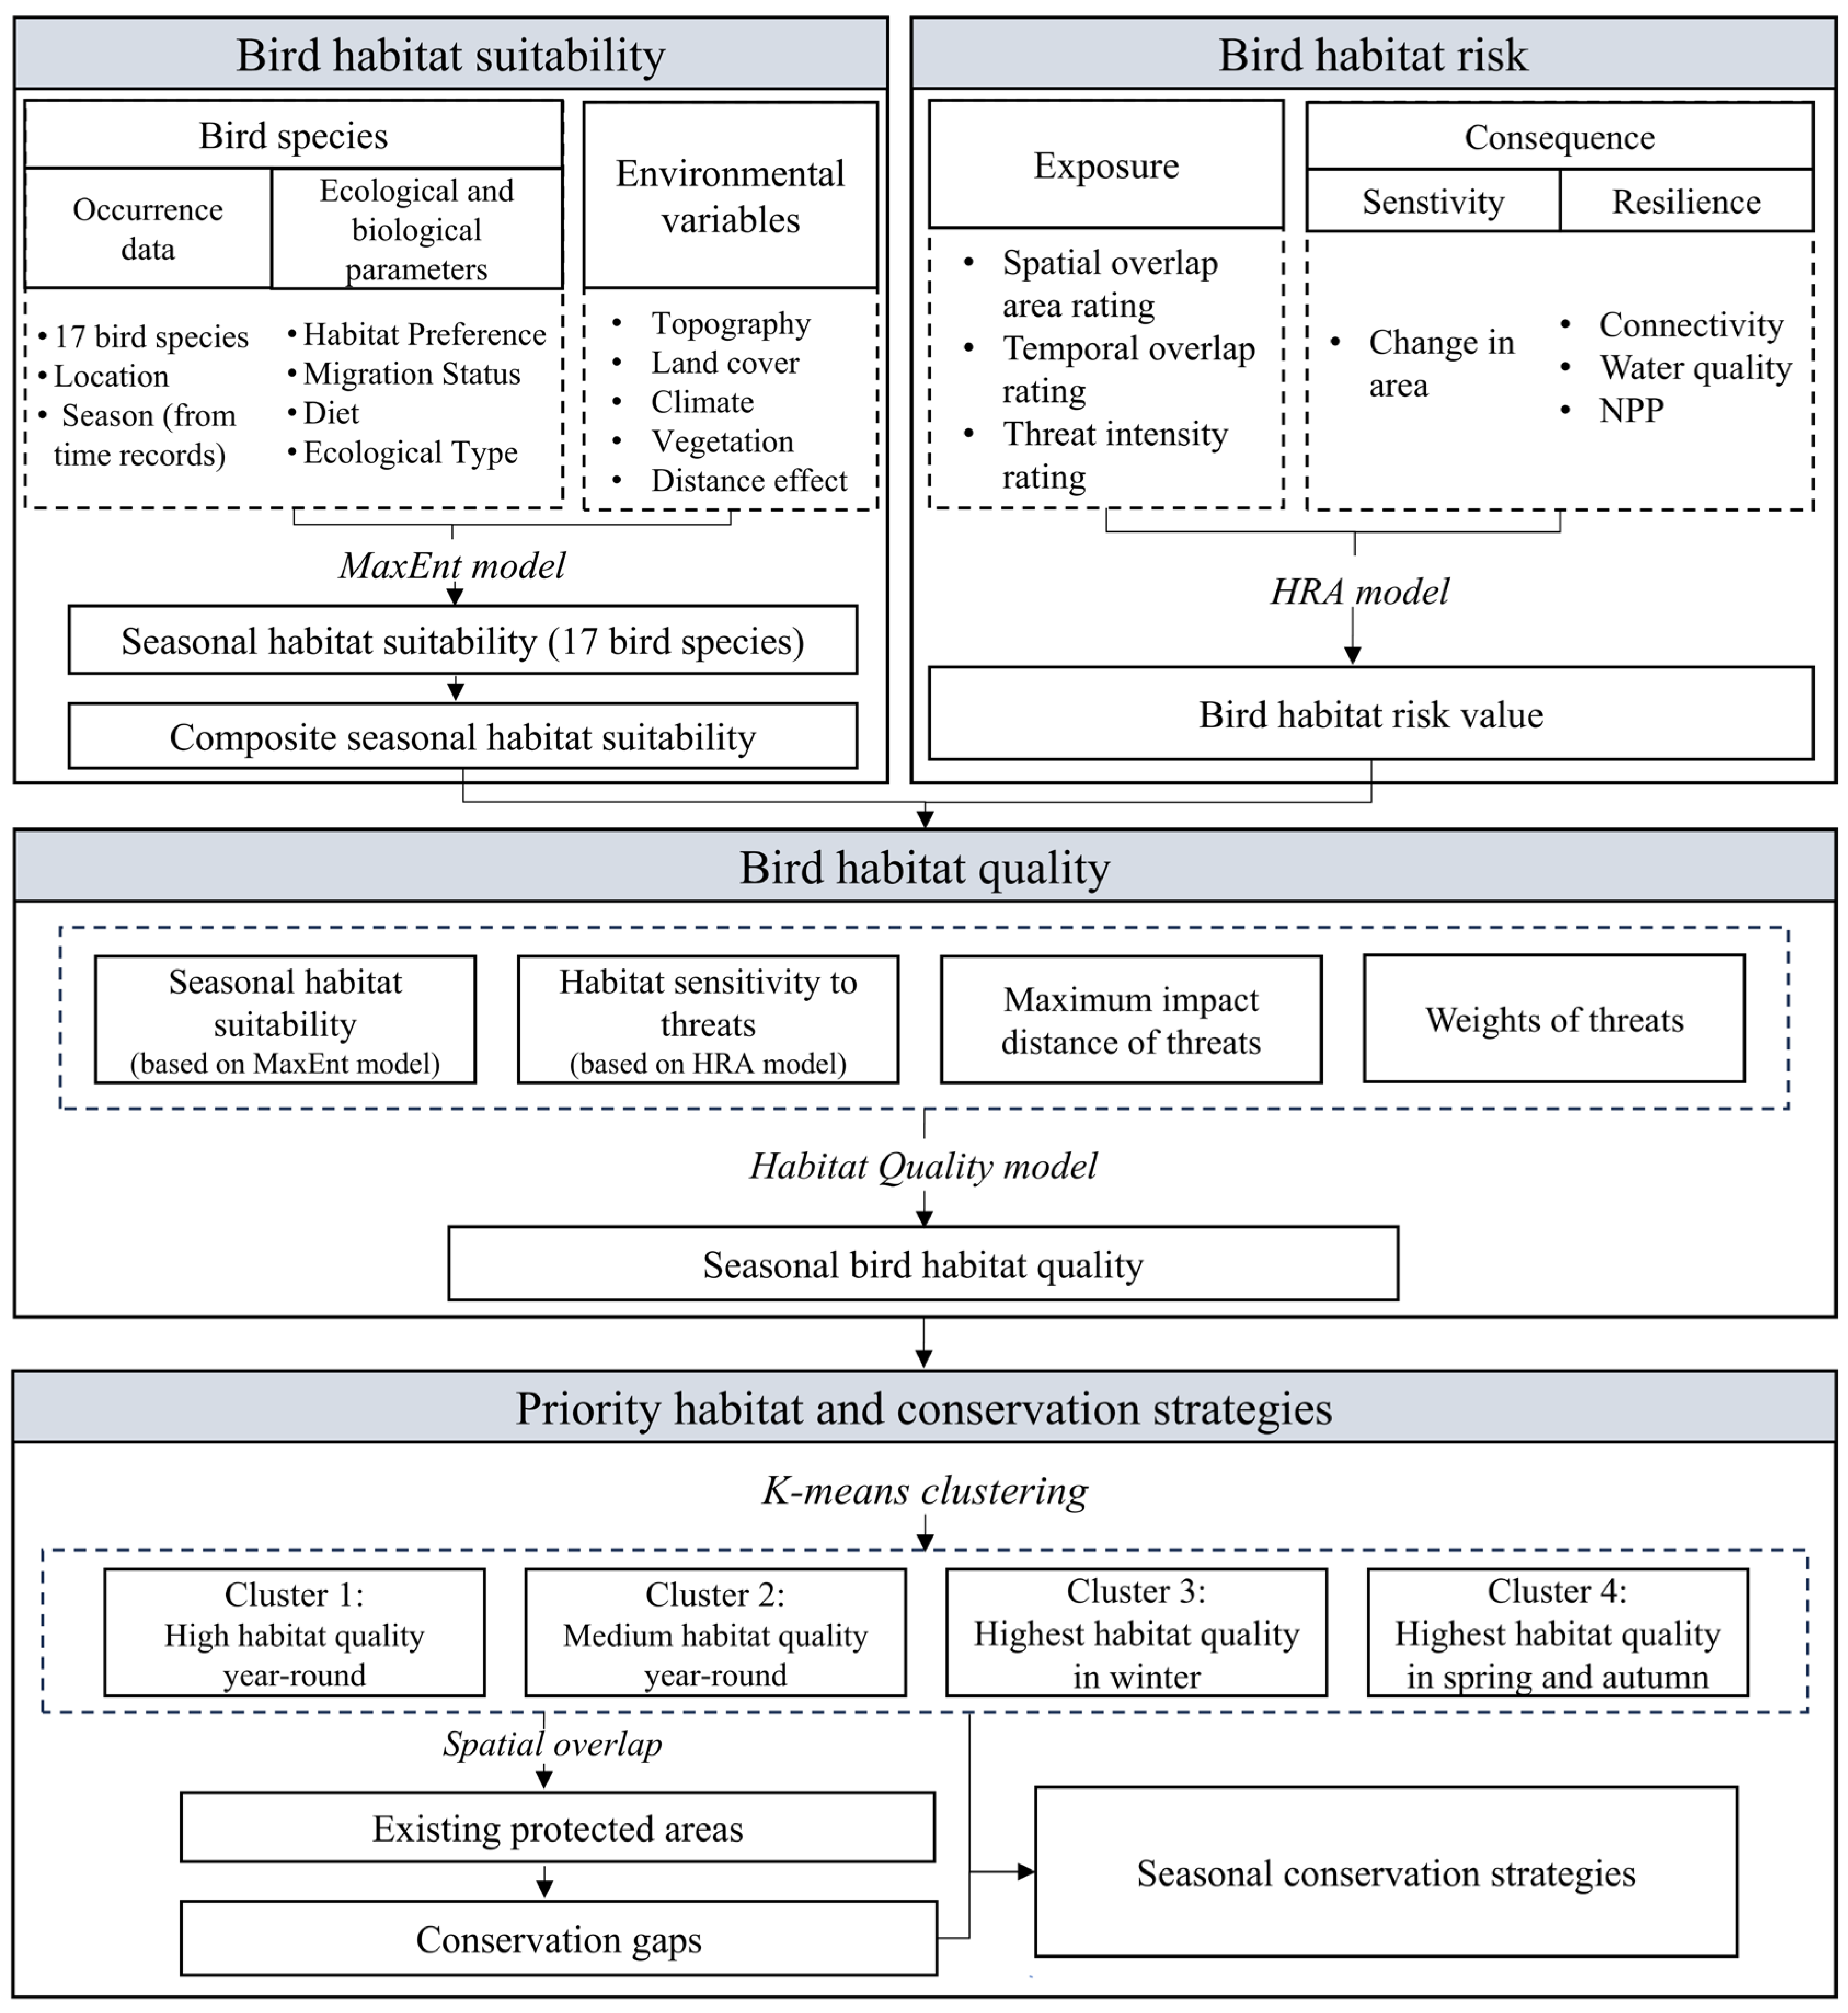
2.3. Framework
2.3.1. Prediction of Habitat Suitability Using MaxEnt
2.3.2. Assessment of Habitat Risk Using the HRA Model
2.3.3. Evaluation of Habitat Quality Using the Improved HQ Model
2.3.4. Identification of Seasonal Priority Habitats Using K-Means Clustering
3. Results
3.1. Bird Habitat Suitability
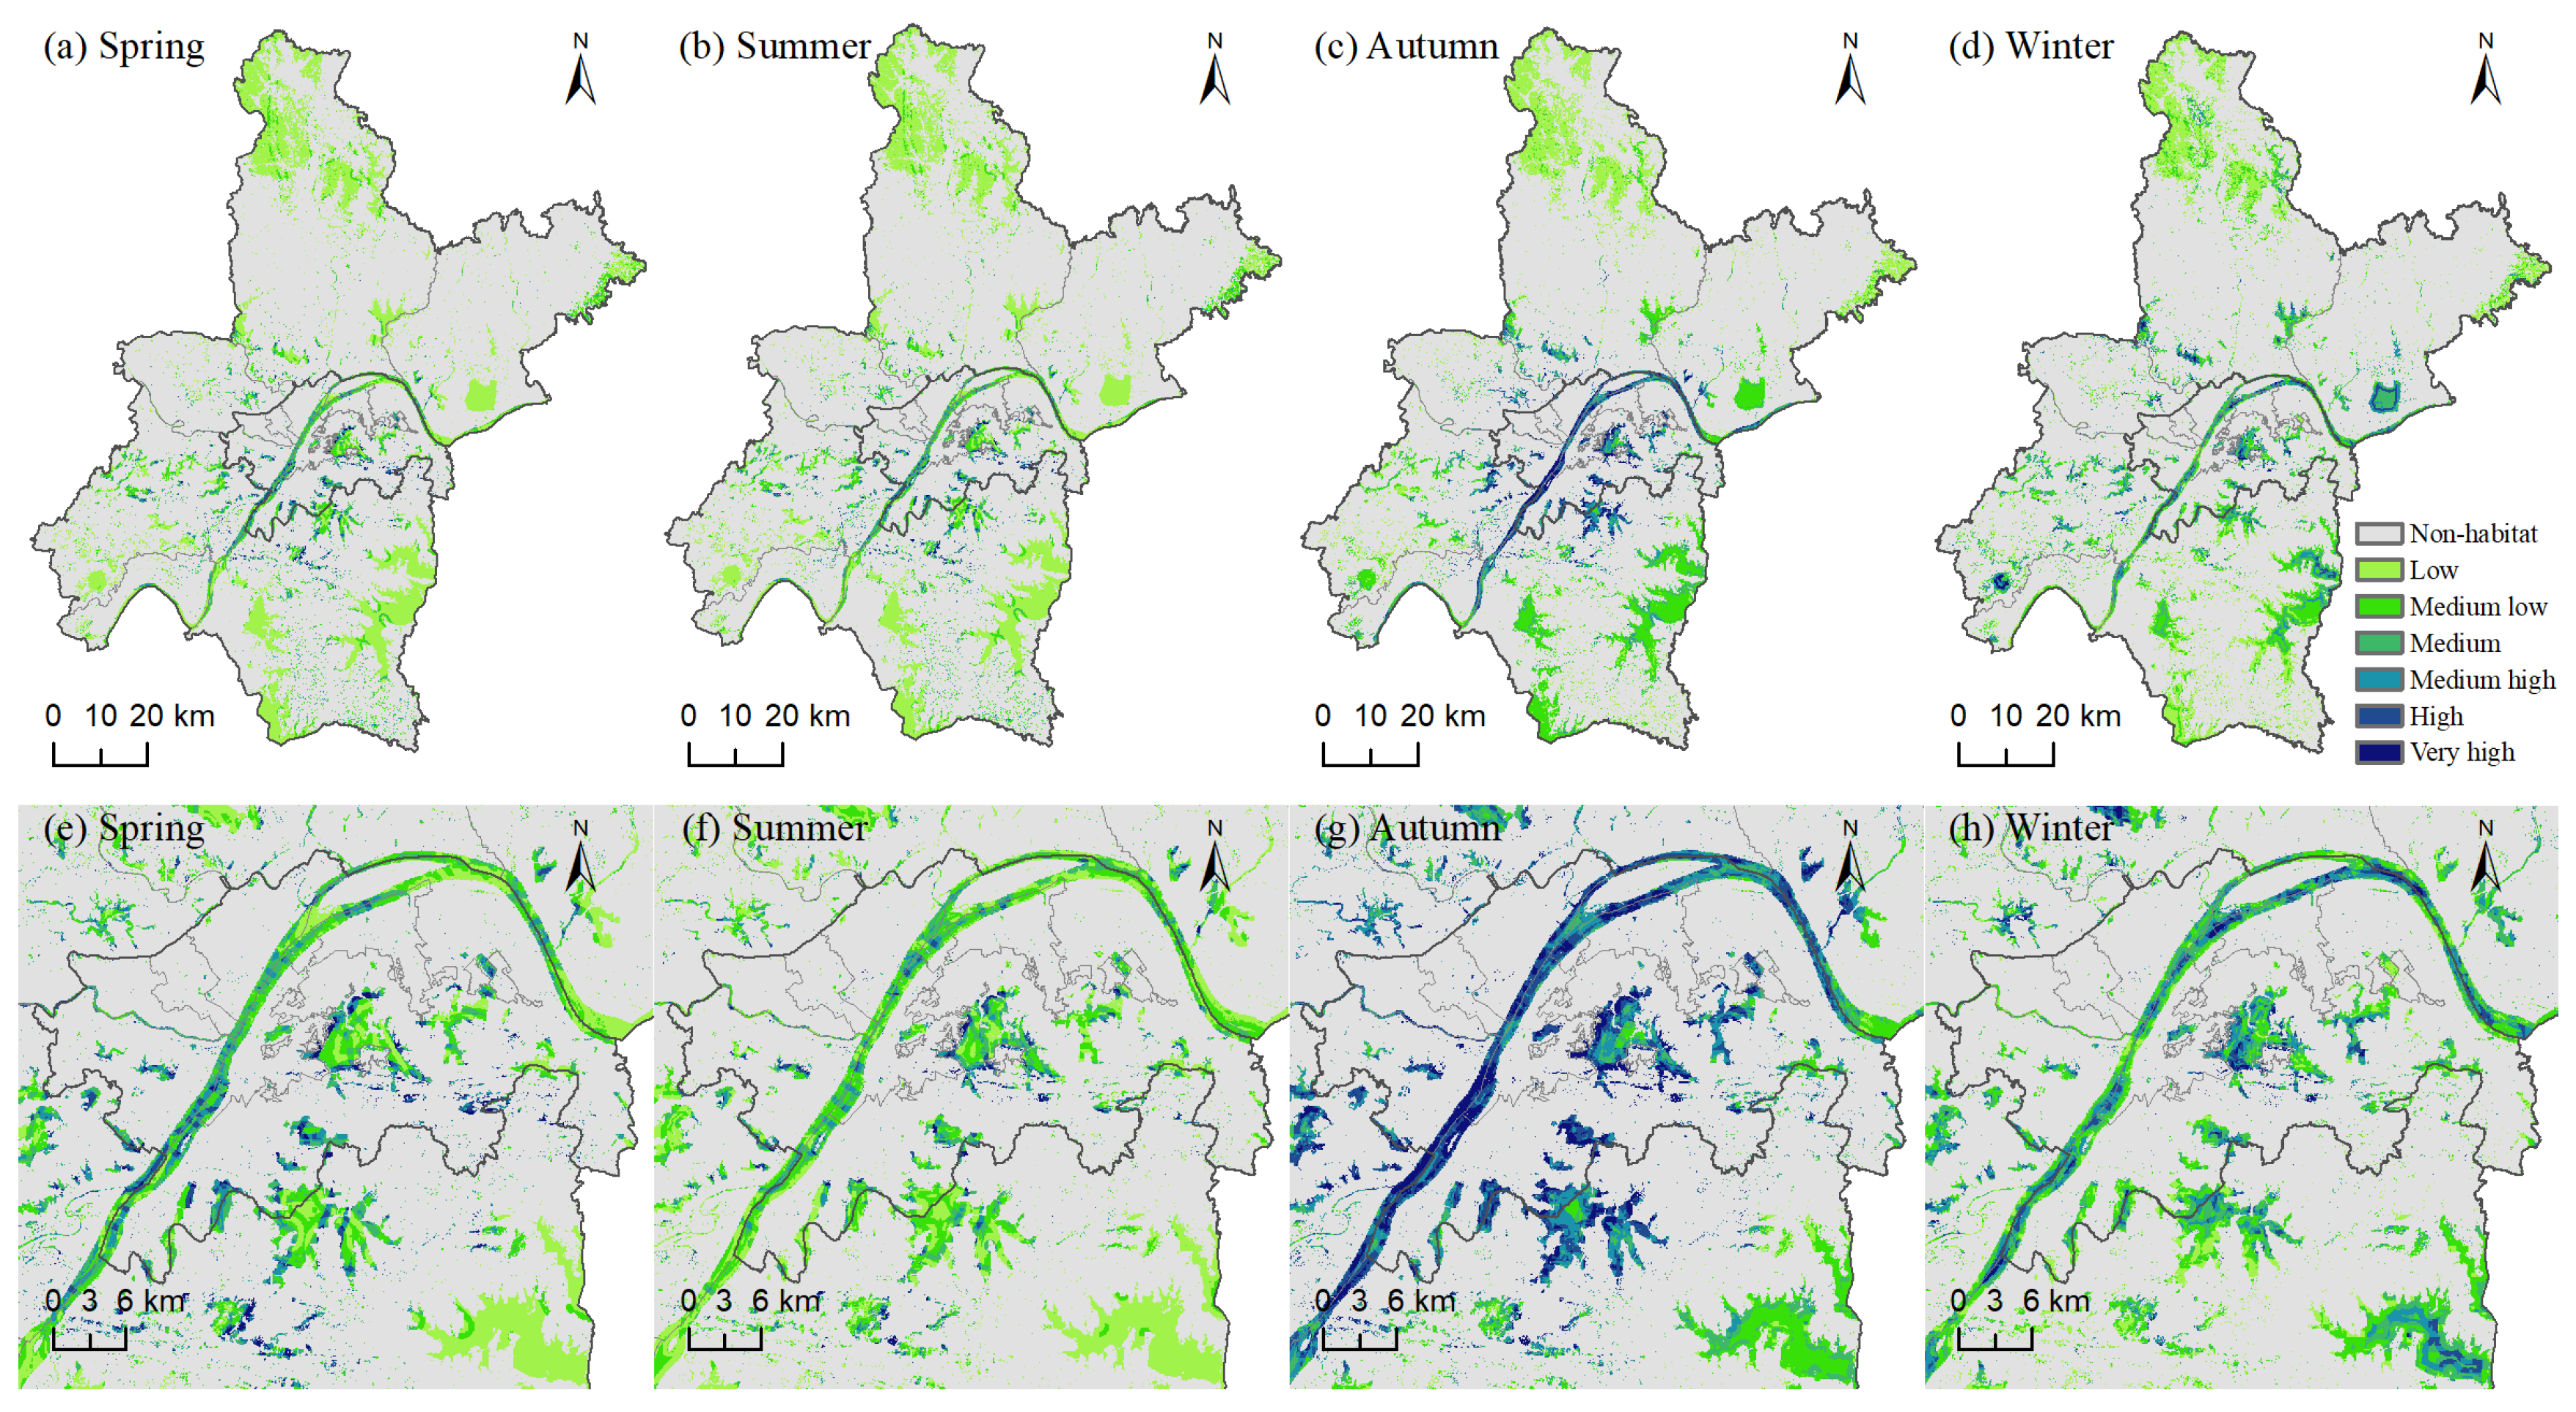
3.1.1. Seasonal Variation in Bird Habitat Suitability
3.1.2. Habitat Suitability Levels and Spatial Distribution
3.2. Bird Habitat Risk
3.2.1. Threat Intensity and Risk to Bird Habitats
3.2.2. Spatial Patterns of Bird Habitat Risk Levels
3.3. Bird Habitat Quality
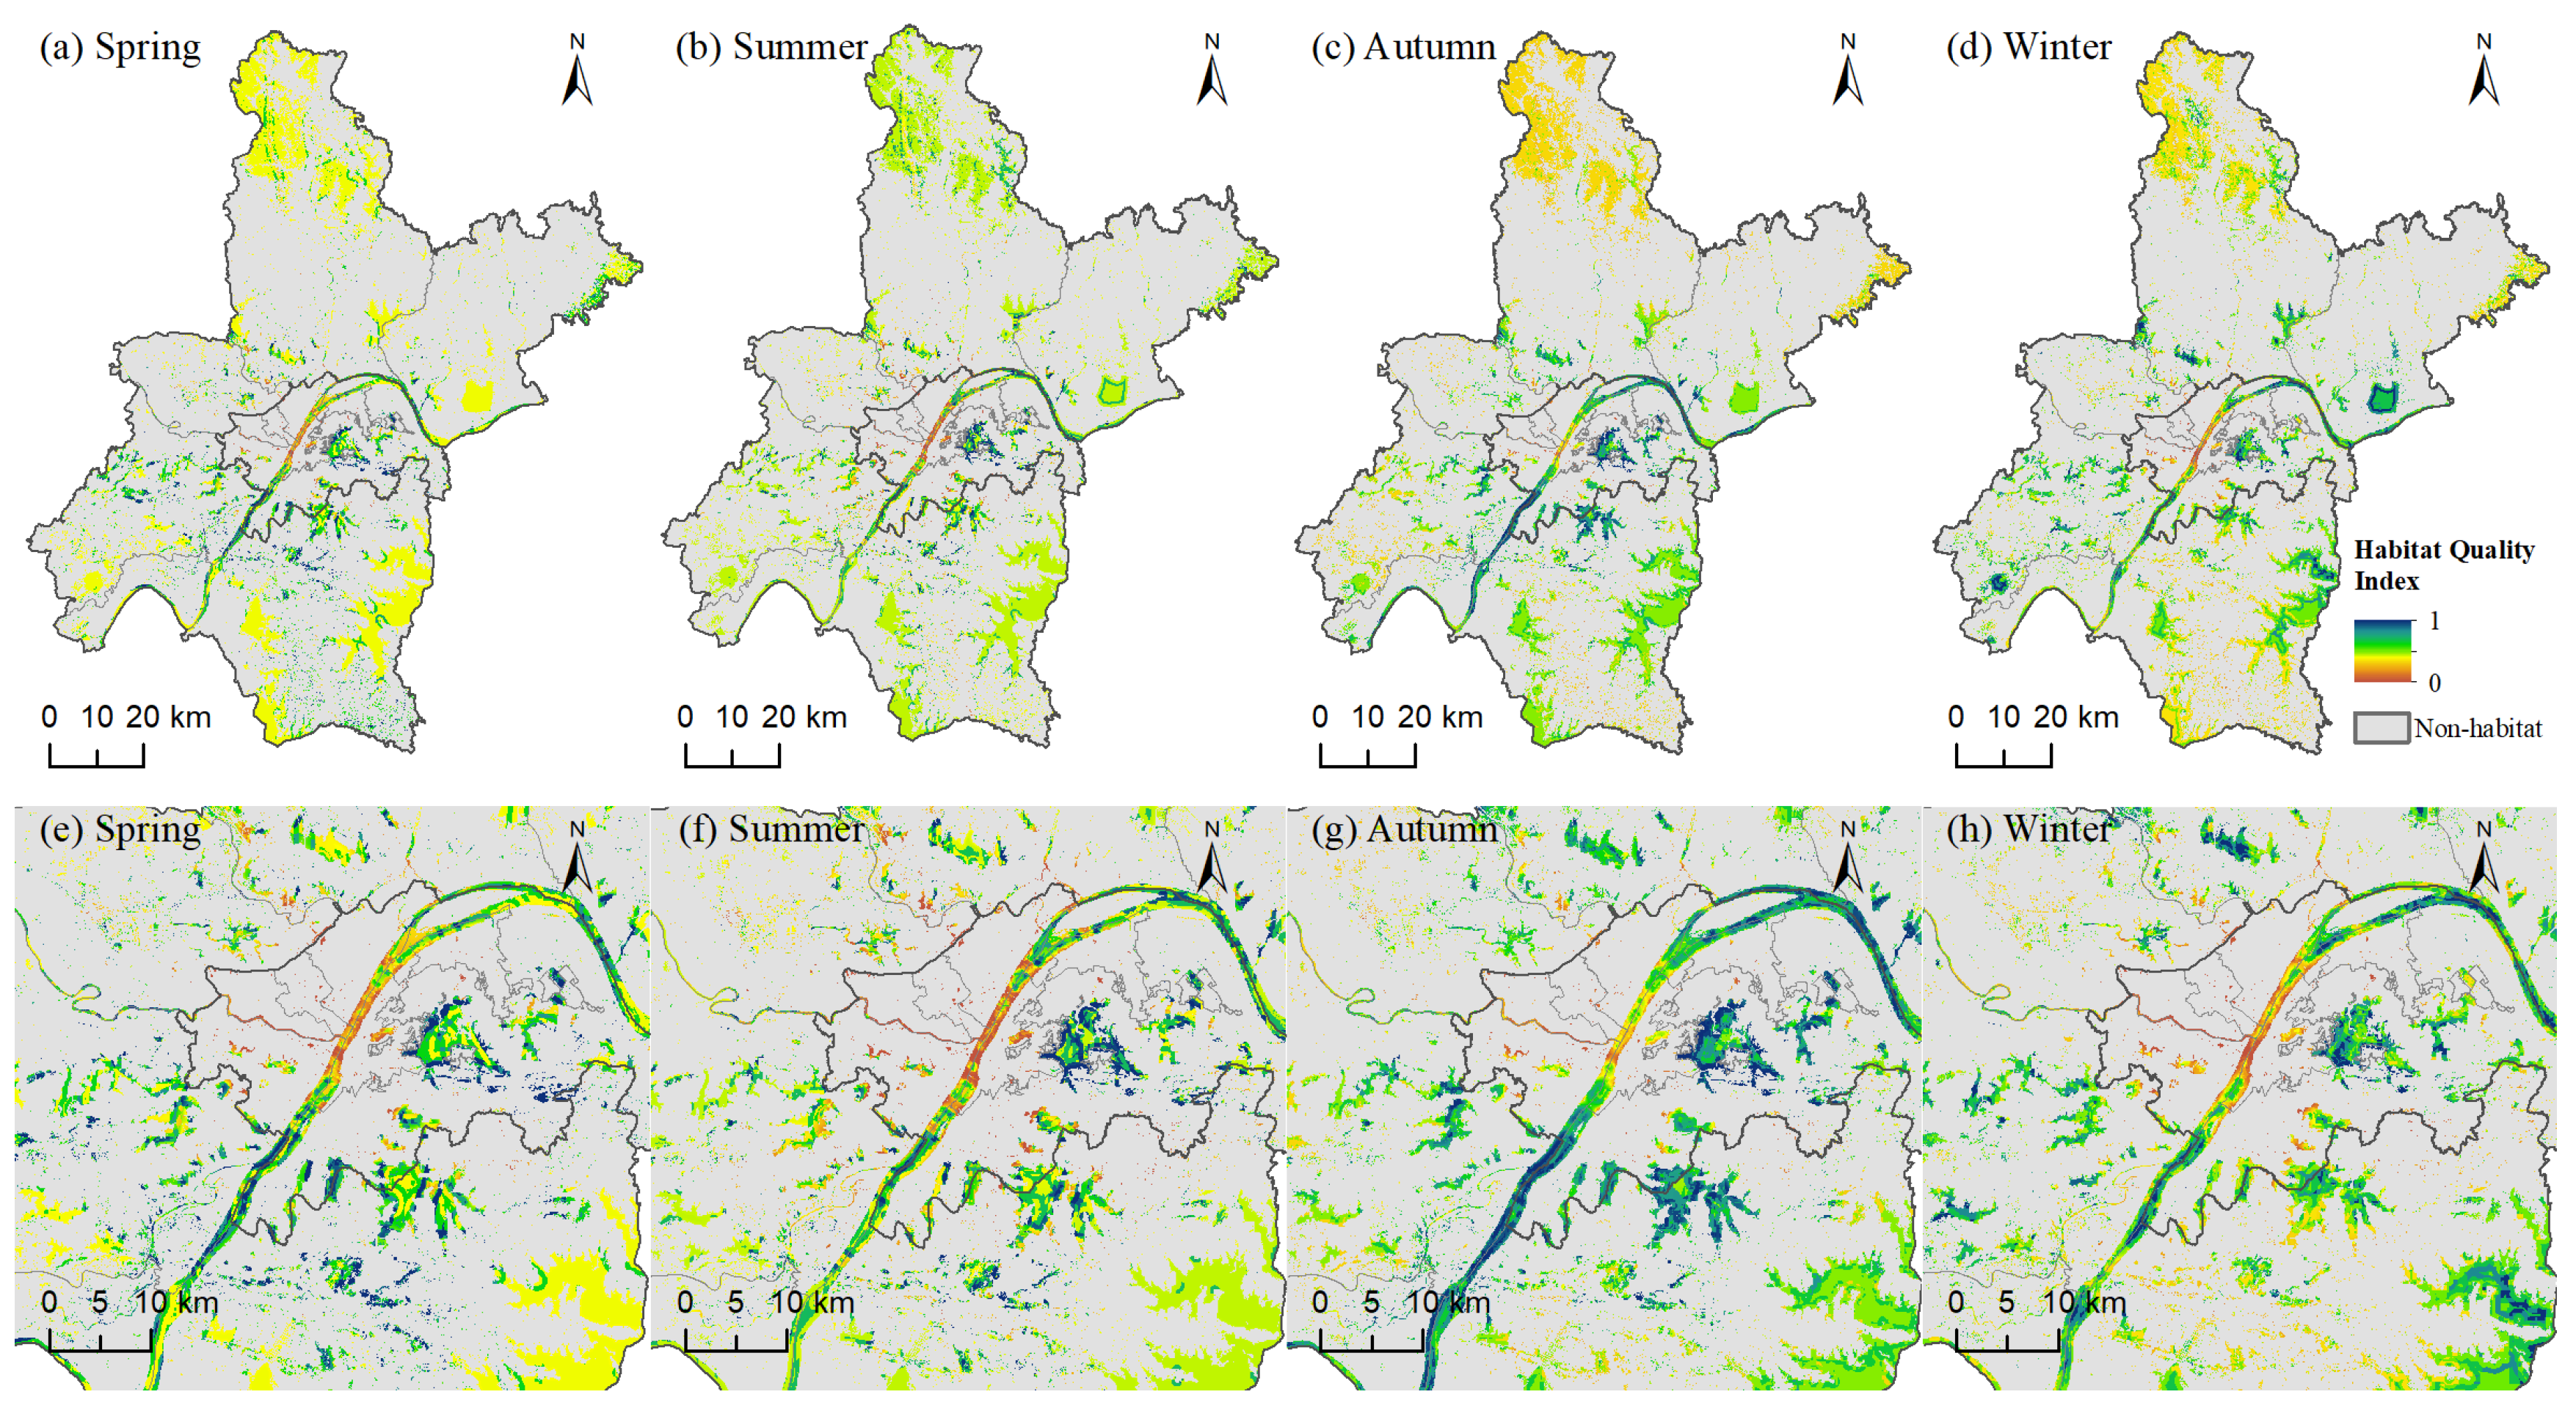
3.3.1. Seasonal Variation in Bird Habitat Quality
3.3.2. Spatial Patterns and Seasonal Dynamics of Bird Habitat Quality
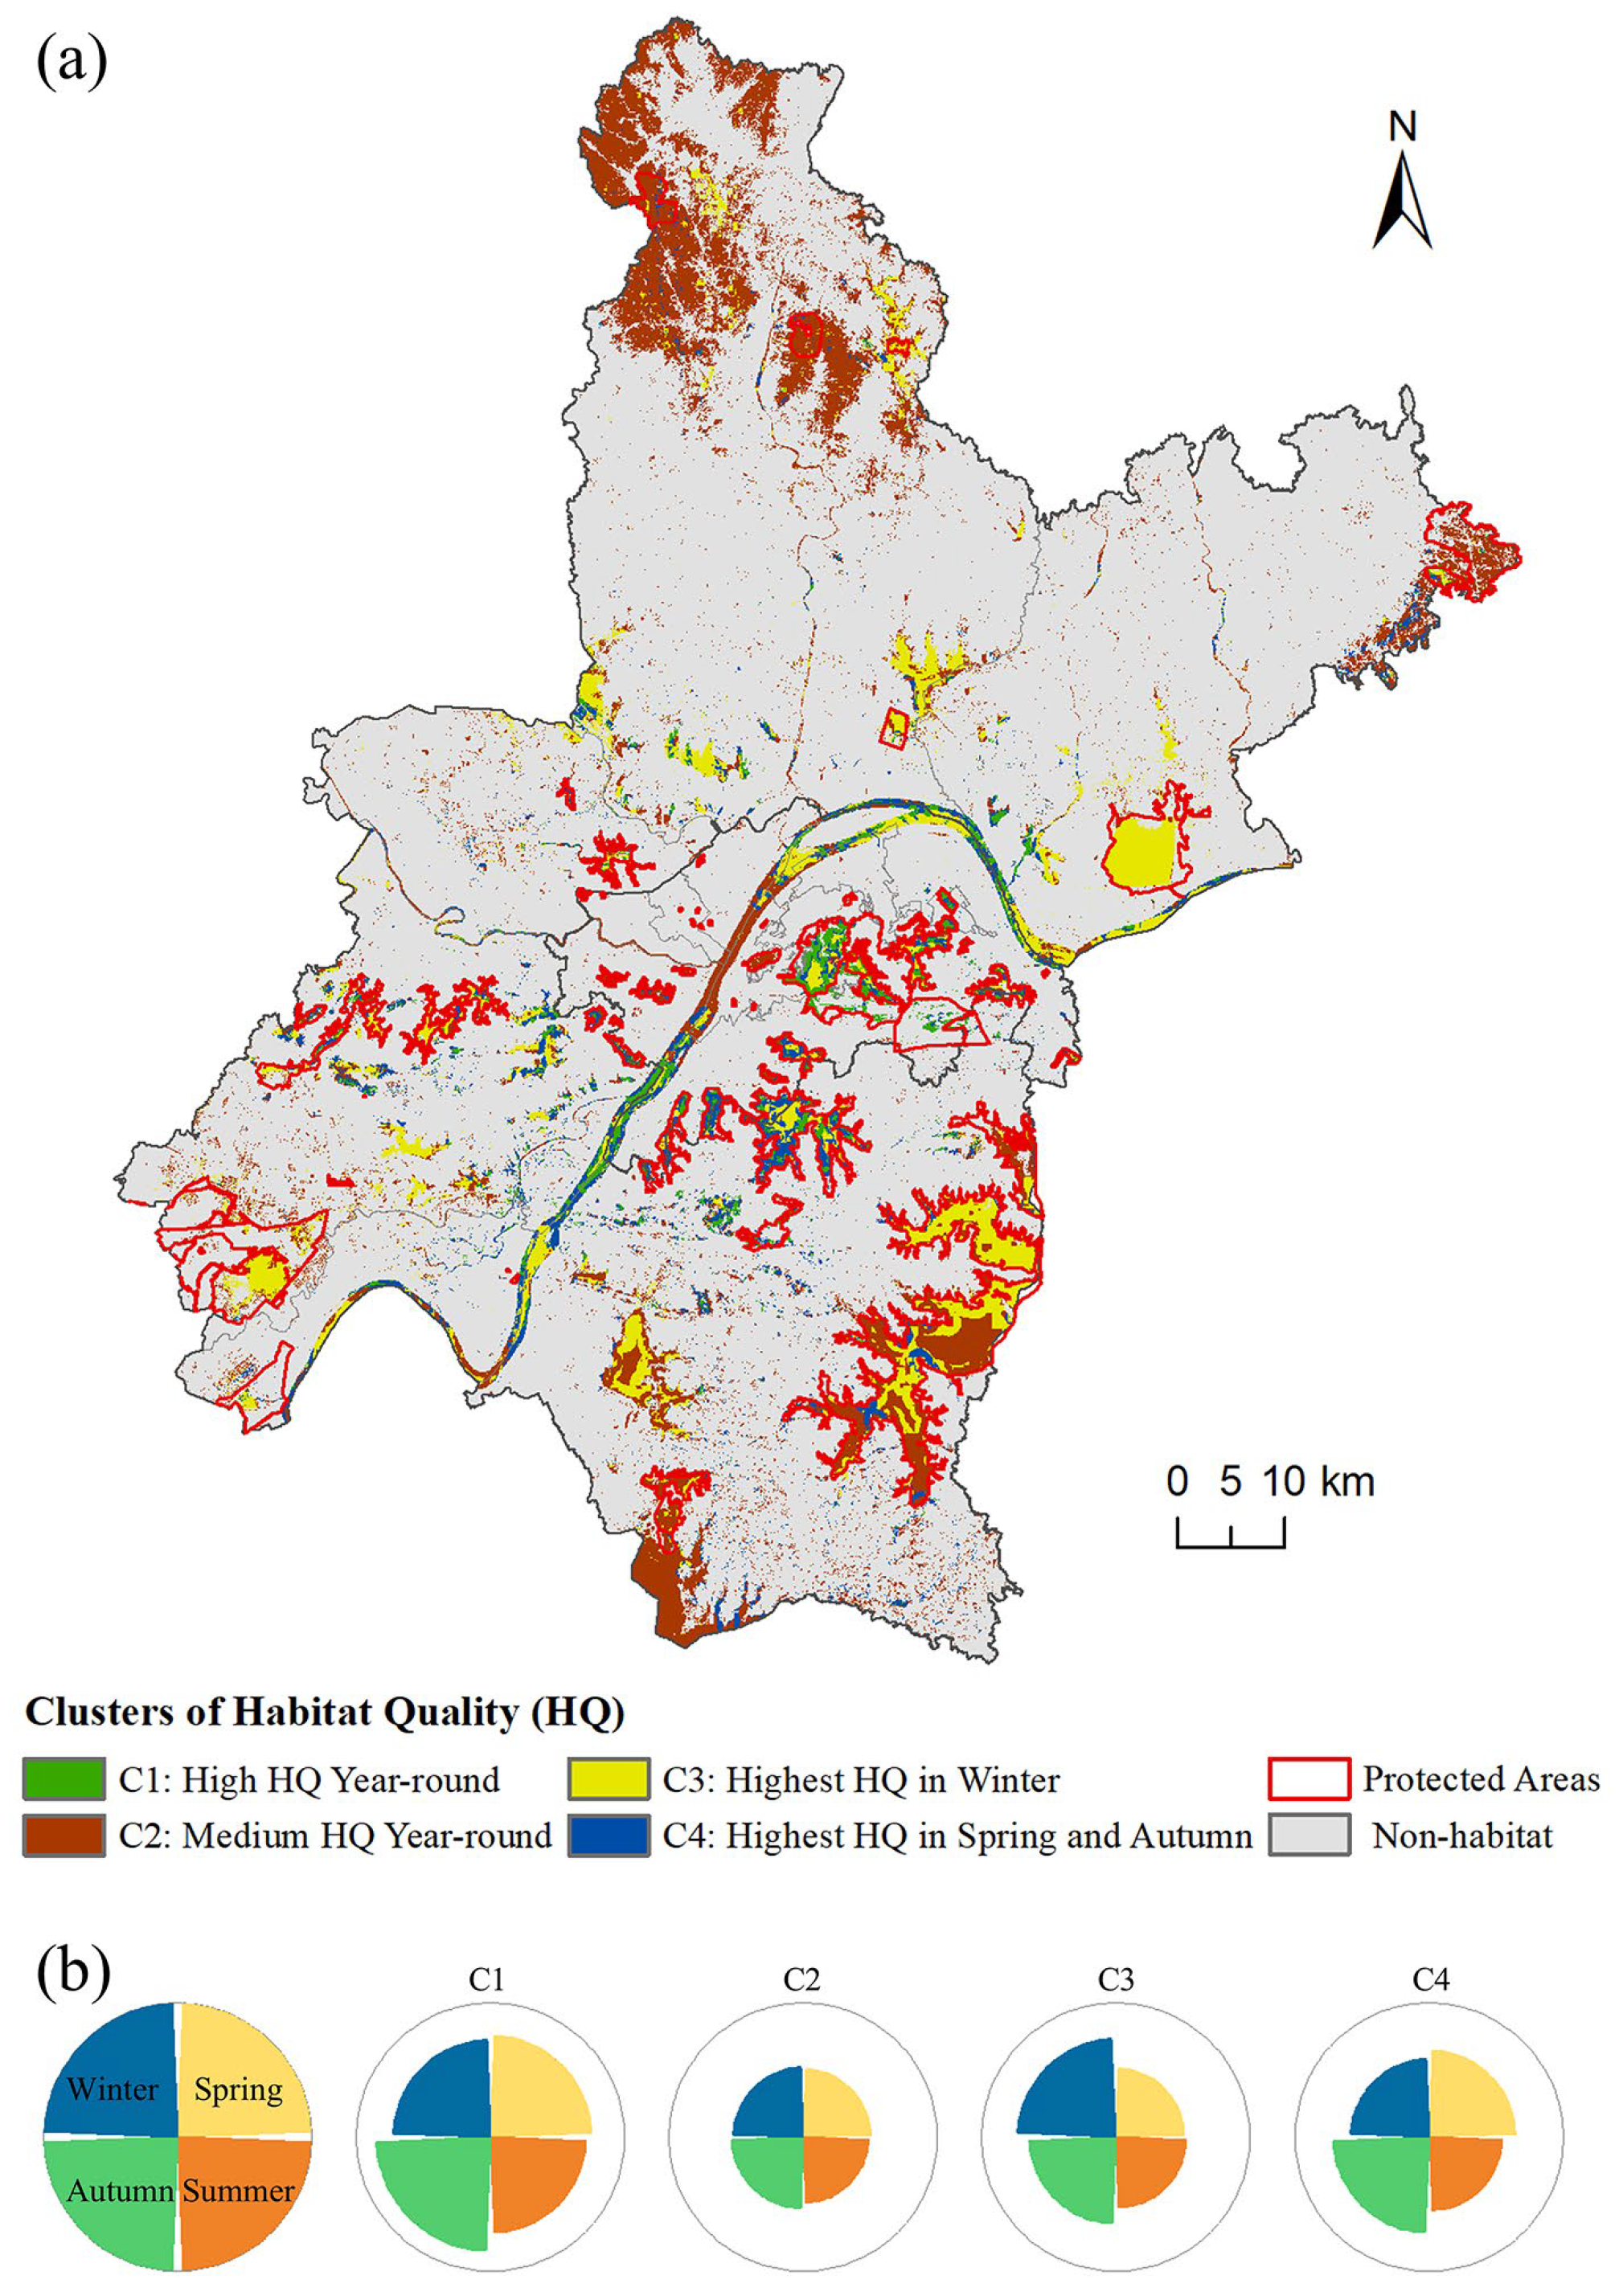
3.4. Clustering of Bird Habitats Based on Seasonal Quality Dynamics
4. Discussion
4.1. Importance of Identifying Priority Habitats Using the “Habitat Suitability–Risk–Quality” Framework
4.2. Conservation Gaps and Seasonal Strategies Based on Habitat Clusters
4.3. Limitations and Future Outlook
5. Conclusions
Supplementary Materials
Author Contributions
Funding
Institutional Review Board Statement
Informed Consent Statement
Data Availability Statement
Conflicts of Interest
References
- De la Fuente, B.; Mateo-Sánchez, M.C.; Rodríguez, G.; Gastón, A.; Pérez de Ayala, R.; Colomina-Pérez, D.; Melero, M.; Saura, S. Natura 2000 sites, public forests and riparian corridors: The connectivity backbone of forest green infrastructure. Land Use Policy 2018, 75, 429–441. [Google Scholar] [CrossRef]
- Peng, J.; Yang, Y.; Liu, Y.; Hu, Y.; Du, Y.; Meersmans, J.; Qiu, S. Linking ecosystem services and circuit theory to identify ecological security patterns. Sci. Total Environ. 2018, 644, 781–790. [Google Scholar] [CrossRef] [PubMed]
- Kong, X.; Zhou, Z.; Jiao, L. Hotspots of land-use change in global biodiversity hotspots. Resour. Conserv. Recycl. 2021, 174, 105770. [Google Scholar] [CrossRef]
- Cohen, E.B.; Horton, K.G.; Marra, P.P.; Clipp, H.L.; Farnsworth, A.; Smolinsky, J.A.; Sheldon, D.; Buler, J.J. A place to land: Spatiotemporal drivers of stopover habitat use by migrating birds. Ecol. Lett. 2021, 24, 38–49. [Google Scholar] [CrossRef] [PubMed]
- Haddad, N.M.; Brudvig, L.A.; Clobert, J.; Davies, K.F.; Gonzalez, A.; Holt, R.D.; Lovejoy, T.E.; Sexton, J.O.; Austin, M.P.; Collins, C.D.; et al. Habitat fragmentation and its lasting impact on Earth’s ecosystems. Sci. Adv. 2015, 1, e1500052. [Google Scholar] [CrossRef]
- Van Moorter, B.; Kivimaki, I.; Panzacchi, M.; Saura, S.; Brandao Niebuhr, B.; Strand, O.; Saerens, M. Habitat functionality: Integrating environmental and geographic space in niche modeling for conservation planning. Ecology 2023, 104, e4105. [Google Scholar] [CrossRef]
- Fluet-Chouinard, E.; Stocker, B.D.; Zhang, Z.; Malhotra, A.; Melton, J.R.; Poulter, B.; Kaplan, J.O.; Goldewijk, K.K.; Siebert, S.; Minayeva, T.; et al. Extensive global wetland loss over the past three centuries. Nature 2023, 614, 281–286. [Google Scholar] [CrossRef]
- Luedtke, J.A.; Chanson, J.; Neam, K.; Hobin, L.; Maciel, A.O.; Catenazzi, A.; Borzée, A.; Hamidy, A.; Aowphol, A.; Jean, A.; et al. Ongoing declines for the world’s amphibians in the face of emerging threats. Nature 2023, 622, 308–314. [Google Scholar] [CrossRef]
- Schuerch, M.; Spencer, T.; Temmerman, S.; Kirwan, M.L.; Wolff, C.; Lincke, D.; McOwen, C.J.; Pickering, M.D.; Reef, R.; Vafeidis, A.T.; et al. Future response of global coastal wetlands to sea-level rise. Nature 2018, 561, 231–234. [Google Scholar] [CrossRef]
- Wang, G.; Wu, H.; Dai, J.; Xiong, Y.; Long, Y.; Cai, X.; Mo, S.; Yang, R.; Liu, Y. Priorities identification of habitat restoration for migratory birds under the increased water level during the middle of dry season: A case study of Poyang Lake and Dongting Lake wetlands, China. Ecol. Indic. 2023, 151, 110322. [Google Scholar] [CrossRef]
- Kong, X.; Fu, M.; Zhao, X.; Wang, J.; Jiang, P. Ecological effects of land-use change on two sides of the Hu Huanyong Line in China. Land Use Policy 2022, 113, 105895. [Google Scholar] [CrossRef]
- Sallustio, L.; De Toni, A.; Strollo, A.; Di Febbraro, M.; Gissi, E.; Casella, L.; Geneletti, D.; Munafò, M.; Vizzarri, M.; Marchetti, M. Assessing habitat quality in relation to the spatial distribution of protected areas in Italy. J. Environ. Manag. 2017, 201, 129–137. [Google Scholar] [CrossRef] [PubMed]
- Ulloa, A.M.; Jax, K.; Karlsson-Vinkhuyzen, S.I. Enhancing implementation of the Convention on Biological Diversity: A novel peer-review mechanism aims to promote accountability and mutual learning. Biol. Conserv. 2018, 217, 371–376. [Google Scholar] [CrossRef]
- Courouble, M.; Davidson, N.; Dinesen, L.; Fennessy, S.; Galewski, T.; Guelmami, A.; Kumar, R.; McInnes, R.; Perennou, C.; Rebelo, L.-M.; et al. Convention on Wetlands. In Global Wetland Outlook: Special Edition 2021; Secretariat of the Convention on Wetlands: Gland, Switzerland, 2021. [Google Scholar]
- Sala, E.; Mayorga, J.; Bradley, D.; Cabral, R.B.; Atwood, T.B.; Auber, A.; Cheung, W.; Costello, C.; Ferretti, F.; Friedlander, A.M.; et al. Protecting the global ocean for biodiversity, food and climate. Nature 2021, 592, 397–402. [Google Scholar] [CrossRef]
- Allan, J.R.; Possingham, H.P.; Atkinson, S.C.; Waldron, A.; Di Marco, M.; Butchart, S.H.M.; Adams, V.M.; Kissling, W.D.; Worsdell, T.; Sandbrook, C.; et al. The minimum land area requiring conservation attention to safeguard biodiversity. Science 2022, 376, 1094–1101. [Google Scholar] [CrossRef]
- Li, G.; Fang, C.; Watson, J.E.M.; Sun, S.; Qi, W.; Wang, Z.; Liu, J. Mixed effectiveness of global protected areas in resisting habitat loss. Nat. Commun. 2024, 15, 8389. [Google Scholar] [CrossRef]
- Xia, S.; Yu, X.; Millington, S.; Liu, Y.; Jia, Y.; Wang, L.; Hou, X.; Jiang, L. Identifying priority sites and gaps for the conservation of migratory waterbirds in China’s coastal wetlands. Biol. Conserv. 2017, 210, 72–82. [Google Scholar] [CrossRef]
- Li, X.; Hou, X.; Shan, K.; Liu, Y.; Song, Y.; Wang, X.; Du, P.; Fan, C. Identifying shorebird conservation hotspots and restoration gaps in stopover sites: A perspective of ‘ecologically linked’ habitats. Glob. Ecol. Conserv. 2023, 48, e02725. [Google Scholar] [CrossRef]
- Barredo, J.I.; Caudullo, G.; Dosio, A. Mediterranean habitat loss under future climate conditions: Assessing impacts on the Natura 2000 protected area network. Appl. Geogr. 2016, 75, 83–92. [Google Scholar] [CrossRef]
- Xie, Z.; Zhang, B.; Shi, Y.; Zhang, X.; Sun, Z. Changes and protections of urban habitat quality in Shanghai of China. Sci. Rep. 2023, 13, 10976. [Google Scholar] [CrossRef]
- Xu, Z.; Dong, B.; Wei, Z.; Lu, Z.; Liu, X.; Xu, H. Study on habitat suitability change and habitat network of rare wintering cranes in important international wetlands. Ecol. Indic. 2023, 154, 110692. [Google Scholar] [CrossRef]
- Hu, J.; Zhang, J.; Li, Y. Exploring the spatial and temporal driving mechanisms of landscape patterns on habitat quality in a city undergoing rapid urbanization based on GTWR and MGWR: The case of Nanjing, China. Ecol. Indic. 2022, 143, 109333. [Google Scholar] [CrossRef]
- Nematollahi, S.; Fakheran, S.; Kienast, F.; Jafari, A. Application of InVEST habitat quality module in spatially vulnerability assessment of natural habitats (case study: Chaharmahal and Bakhtiari province, Iran). Environ. Monit Assess 2020, 192, 487. [Google Scholar] [CrossRef] [PubMed]
- He, J.; Huang, J.; Li, C. The evaluation for the impact of land use change on habitat quality: A joint contribution of cellular automata scenario simulation and habitat quality assessment model. Ecol. Model. 2017, 366, 58–67. [Google Scholar] [CrossRef]
- Wang, B.; Oguchi, T.; Liang, X. Evaluating future habitat quality responding to land use change under different city compaction scenarios in Southern China. Cities 2023, 140, 104410. [Google Scholar] [CrossRef]
- McKinnon, E.A.; Rotenberg, J.A.; Stutchbury, B.J.M. Seasonal change in tropical habitat quality and body condition for a declining migratory songbird. Oecologia 2015, 179, 363–375. [Google Scholar] [CrossRef]
- Both, C.; Van Turnhout, C.A.M.; Bijlsma, R.G.; Siepel, H.; Van Strien, A.J.; Foppen, R.P.B. Avian population consequences of climate change are most severe for long-distance migrants in seasonal habitats. Proc. R. Soc. B Biol. Sci. 2009, 277, 1259–1266. [Google Scholar] [CrossRef]
- Papageorgiou, D.; Rozen-Rechels, D.; Nyaguthii, B.; Farine, D.R. Seasonality impacts collective movements in a wild group-living bird. Mov. Ecol. 2021, 9, 38. [Google Scholar] [CrossRef]
- Schmitt, T.; Ulrich, W.; Delic, A.; Teucher, M.; Habel, J.C. Seasonality and landscape characteristics impact species community structure and temporal dynamics of East African butterflies. Sci. Rep. 2021, 11, 15103. [Google Scholar] [CrossRef]
- Bełcik, M.; Lenda, M.; Amano, T.; Skórka, P. Different response of the taxonomic, phylogenetic and functional diversity of birds to forest fragmentation. Sci. Rep. 2020, 10, 20320. [Google Scholar] [CrossRef]
- Leveau, L.M.; Leveau, C.M. Street design in suburban areas and its impact on bird communities: Considering different diversity facets over the year. Urban For. Urban Green. 2020, 48, 126578. [Google Scholar] [CrossRef]
- Walsh, J.C.; Gibson, M.R.; Simmonds, J.S.; Mayfield, H.J.; Bracey, C.; Melton, C.B.; Reside, A.E.; Maron, M. Effectiveness of conservation interventions for Australian woodland birds: A systematic review. Biol. Conserv. 2023, 282, 110030. [Google Scholar] [CrossRef]
- Kremen, C.; Cameron, A.; Moilanen, A.; Phillips, S.J.; Thomas, C.D.; Beentje, H.; Dransfield, J.; Fisher, B.L.; Glaw, F.; Good, T.C.; et al. Aligning Conservation Priorities Across Taxa in Madagascar with High-Resolution Planning Tools. Science 2008, 320, 222–226. [Google Scholar] [CrossRef] [PubMed]
- Fern, R.R.; Morrison, M.L. Mapping critical areas for migratory songbirds using a fusion of remote sensing and distributional modeling techniques. Ecol. Inform. 2017, 42, 55–60. [Google Scholar] [CrossRef]
- Zeng, W.; Tang, H.; Liang, X.; Hu, Z.; Yang, Z.; Guan, Q. Using ecological security pattern to identify priority protected areas: A case study in the Wuhan Metropolitan Area, China. Ecol. Indic. 2023, 148, 110121. [Google Scholar] [CrossRef]
- Zhang, Y.; Hu, W.; Min, M.; Zhao, K.; Zhang, S.; Liu, T. Optimization of ecological connectivity and construction of supply-demand network in Wuhan Metropolitan Area, China. Ecol. Indic. 2023, 146, 109799. [Google Scholar] [CrossRef]
- Lin, J.; He, S.; Liu, X.; Huang, Z.; Li, M.; Chen, B.; Hu, W. Identifying conservation and restoration priorities for degraded coastal wetland vegetations: Integrating species distribution model and GeoDetector. Sci. Total Environ. 2024, 906, 167491. [Google Scholar] [CrossRef]
- Liu, Z.; Huang, Q.; Tang, G. Identification of urban flight corridors for migratory birds in the coastal regions of Shenzhen city based on three-dimensional landscapes. Landsc. Ecol. 2021, 36, 2043–2057. [Google Scholar] [CrossRef]
- Zhao, H.; Liu, D.; Li, F.; Liu, X.; Niu, J.; He, J.; Liu, Y. Incorporating spatio-temporal connectivity for prioritized conservation of individual habitat patches in a dynamic landscape. Ecol. Indic. 2021, 124, 107414. [Google Scholar] [CrossRef]
- Yang, L.; Xu, H.; Pan, S.; Chen, W.; Zeng, J. Identifying the impact of global human activities expansion on natural habitats. J. Clean. Prod. 2024, 434, 140247. [Google Scholar] [CrossRef]
- Duan, H.; Yu, X. Linking landscape characteristics to shorebird habitat quality changes in a key stopover site along the East Asian–Australasian Flyway migratory route. Ecol. Indic. 2022, 144, 109490. [Google Scholar] [CrossRef]
- Avon, C.; Bergès, L. Prioritization of habitat patches for landscape connectivity conservation differs between least-cost and resistance distances. Landsc. Ecol. 2016, 31, 1551–1565. [Google Scholar] [CrossRef]
- Duflot, R.; Avon, C.; Roche, P.; Bergès, L. Combining habitat suitability models and spatial graphs for more effective landscape conservation planning: An applied methodological framework and a species case study. J. Nat. Conserv. 2018, 46, 38–47. [Google Scholar] [CrossRef]
- Peng, J.; Pan, Y.; Liu, Y.; Zhao, H.; Wang, Y. Linking ecological degradation risk to identify ecological security patterns in a rapidly urbanizing landscape. Habitat Int. 2018, 71, 110–124. [Google Scholar] [CrossRef]
- Hubei Provincial Department of Natural Resources. Main Data Bulletin of the Third National Land Survey of Hubei Province; Hubei Provincial Department of Natural Resources: Wuhan, China, 2021. (In Chinese) [Google Scholar]
- Shi, D.; Liao, S.-Y.; Zhu, L.; Li, B.V. Review on bird-building collisions and the case study of a systematic survey in China. Biodiv. Sci. 2022, 30, 21321. [Google Scholar] [CrossRef]
- Zhang, Q.; Schaaf, C.; Seto, K.C. The Vegetation Adjusted NTL Urban Index: A new approach to reduce saturation and increase variation in nighttime luminosity. Remote Sens. Environ. 2013, 129, 32–41. [Google Scholar] [CrossRef]
- Ma, Q.; He, C.; Wu, J. Behind the rapid expansion of urban impervious surfaces in China: Major influencing factors revealed by a hierarchical multiscale analysis. Land Use Policy 2016, 59, 434–445. [Google Scholar] [CrossRef]
- Tian, Y.; Qian, J. Suburban identification based on multi-source data and landscape analysis of its construction land: A case study of Jiangsu Province, China. Habitat Int. 2021, 118, 102459. [Google Scholar] [CrossRef]
- Ma, Q.; Wu, J.; He, C. A hierarchical analysis of the relationship between urban impervious surfaces and land surface temperatures: Spatial scale dependence, temporal variations, and bioclimatic modulation. Landsc. Ecol. 2016, 31, 1139–1153. [Google Scholar] [CrossRef]
- Jaynes, E.T. Information Theory and Statistical Mechanics. Phys. Rev. 1957, 106, 620–630. [Google Scholar] [CrossRef]
- Phillips, S.J.; Anderson, R.P.; Schapire, R.E. Maximum entropy modeling of species geographic distributions. Ecol. Model. 2006, 190, 231–259. [Google Scholar] [CrossRef]
- Phillips, S.J.; Dudík, M. Modeling of species distributions with Maxent: New extensions and a comprehensive evaluation. Ecography 2008, 31, 161–175. [Google Scholar] [CrossRef]
- Elith, J.; Graham, C.H.; Valavi, R.; Abegg, M.; Bruce, C.; Ferrier, S.; Ford, A.J.; Guisan, A.; Hijmans, R.J.; Huettmann, F.; et al. Presence-only and Presence-absence Data for Comparing Species Distribution Modeling Methods. Biodivers. Inform. 2020, 15, 69–80. [Google Scholar] [CrossRef]
- Valavi, R.; Guillera-Arroita, G.; Lahoz-Monfort, J.J.; Elith, J. Predictive performance of presence-only species distribution models: A benchmark study with reproducible code. Ecol. Monogr. 2021, 92, e1486. [Google Scholar] [CrossRef]
- Brown, J.L.; Anderson, B. SDMtoolbox: A python-based GIS toolkit for landscape genetic, biogeographic and species distribution model analyses. Methods Ecol. Evol. 2014, 5, 694–700. [Google Scholar] [CrossRef]
- Brown, J.L.; Bennett, J.R.; French, C.M. SDMtoolbox 2.0, the next generation Python-based GIS toolkit for landscape genetic, biogeographic and species distribution model analyses. PeerJ 2017, 5, e4095. [Google Scholar] [CrossRef]
- Hernandez, P.A.; Graham, C.H.; Master, L.L.; Albert, D.L. The effect of sample size and species characteristics on performance of different species distribution modeling methods. Ecography 2006, 29, 773–785. [Google Scholar] [CrossRef]
- Chin, A.; Ruppert, J.; Shrestha, N.; Fortin, M.-J. Urban Avian Conservation Planning Using Species Functional Traits and Habitat Suitability Mapping. Land 2022, 11, 1831. [Google Scholar] [CrossRef]
- Dias, R.A.; Marcon, A.P.; Kappes, B.B.; Azpiroz, A.B.; Barbosa, F.G.; Bencke, G.A.; Clay, R.; Di Giacomo, A.S.; Fontana, C.S.; Repenning, M.; et al. A new analytical framework for Maxent species distribution models unveils complex spatiotemporal suitability patterns for two migratory seedeaters (Aves: Sporophila) of conservation concern. Ecol. Inform. 2023, 77, 102189. [Google Scholar] [CrossRef]
- Wang, F.; Yuan, X.; Sun, Y.; Liu, Y. Species distribution modeling based on MaxEnt to inform biodiversity conservation in the Central Urban Area of Chongqing Municipality. Ecol. Indic. 2024, 158, 111491. [Google Scholar] [CrossRef]
- Elith, J.; Phillips, S.J.; Hastie, T.; Dudík, M.; Chee, Y.E.; Yates, C.J. A statistical explanation of MaxEnt for ecologists. Divers. Distrib. 2011, 17, 43–57. [Google Scholar] [CrossRef]
- Merow, C.; Smith, M.J.; Silander, J.A. A practical guide to MaxEnt for modeling species’ distributions: What it does, and why inputs and settings matter. Ecography 2013, 36, 1058–1069. [Google Scholar] [CrossRef]
- Elith, J. Quantitative Methods for Modeling Species Habitat: Comparative Performance and an Application to Australian Plants. In Quantitative Methods for Conservation Biology; Ferson, S., Burgman, M., Eds.; Springer: New York, NY, USA, 2000; pp. 39–58. [Google Scholar]
- Swets, J.A. Measuring the Accuracy of Diagnostic Systems. Science 1988, 240, 1285–1293. [Google Scholar] [CrossRef]
- Sharp, R.; Chaplin-Kramer, R.; Wood, S.; Guerry, A.; Tallis, H.; Ricketts, T.; Nelson, E.; Ennaanay, D.; Wolny, S.; Olwero, N.; et al. InVEST User’s Guide; The Natural Capital Project, Stanford University, University of Minnesota, The Nature Conservancy, and World Wildlife Fund: Gland, Switzerland, 2018. [Google Scholar]
- Arkema, K.K.; Verutes, G.; Bernhardt, J.R.; Clarke, C.; Rosado, S.; Canto, M.; Wood, S.A.; Ruckelshaus, M.; Rosenthal, A.; McField, M.; et al. Assessing habitat risk from human activities to inform coastal and marine spatial planning: A demonstration in Belize. Environ. Res. Lett. 2014, 9, 114016. [Google Scholar] [CrossRef]
- Duggan, J.M.; Eichelberger, B.A.; Ma, S.; Lawler, J.J.; Ziv, G. Informing management of rare species with an approach combining scenario modeling and spatially explicit risk assessment. Ecosyst. Health Sustain. 2015, 1, 1–18. [Google Scholar] [CrossRef]
- Hyrenbach, D.; Wyatt, K.H.; Griffin, R.; Guerry, A.D.; Ruckelshaus, M.; Fogarty, M.; Arkema, K.K. Habitat risk assessment for regional ocean planning in the U.S. Northeast and Mid-Atlantic. PLoS ONE 2017, 12, e0188776. [Google Scholar]
- Niz, W.C.; Laurino, I.R.A.; de Freitas, D.M.; Rolim, F.A.; Motta, F.S.; Pereira-Filho, G.H. Modeling risks in marine protected areas: Mapping of habitats, biodiversity, and cultural ecosystem services in the southernmost atlantic coral reef. J. Environ. Manag. 2023, 345, 118855. [Google Scholar] [CrossRef]
- Samhouri, J.F.; Levin, P.S. Linking land- and sea-based activities to risk in coastal ecosystems. Biol. Conserv. 2012, 145, 118–129. [Google Scholar] [CrossRef]
- Caro, C.; Marques, J.C.; Cunha, P.P.; Teixeira, Z. Ecosystem services as a resilience descriptor in habitat risk assessment using the InVEST model. Ecol. Indic. 2020, 115, 106426. [Google Scholar] [CrossRef]
- Bastos, M.I.; Roebeling, P.C.; Alves, F.L.; Villasante, S.; Magalhães Filho, L. High risk water pollution hazards affecting Aveiro coastal lagoon (Portugal)–A habitat risk assessment using InVEST. Ecol. Inform. 2023, 76, 102144. [Google Scholar] [CrossRef]
- GB3838-2002; State Environmental Protection Administration. Environmental Quality Standards for Surface Water. China Environmental Science Press: Beijing, China, 2002.
- Li, J.; Wang, Z.; Lai, C.; Wu, X.; Zeng, Z.; Chen, X.; Lian, Y. Response of net primary production to land use and land cover change in mainland China since the late 1980s. Sci. Total Environ. 2018, 639, 237–247. [Google Scholar] [CrossRef] [PubMed]
- Chen, S.; Jiang, H.; Chen, Y.; Cai, Z. Spatial-temporal patterns of net primary production in Anji (China) between 1984 and 2014. Ecol. Indic. 2020, 110, 105954. [Google Scholar] [CrossRef]
- Zhai, T.; Wang, J.; Fang, Y.; Qin, Y.; Huang, L.; Chen, Y. Assessing ecological risks caused by human activities in rapid urbanization coastal areas: Towards an integrated approach to determining key areas of terrestrial-oceanic ecosystems preservation and restoration. Sci. Total Environ. 2020, 708, 135153. [Google Scholar] [CrossRef] [PubMed]
- Studwell, A.; Hines, E.; Nur, N.; Jahncke, J. Using habitat risk assessment to assess disturbance from maritime activities to inform seabird conservation in a coastal marine ecosystem. Ocean Coast. Manag. 2021, 199, 105431. [Google Scholar] [CrossRef]
- De Kort, H.; Baguette, M.; Lenoir, J.; Stevens, V.M. Toward reliable habitat suitability and accessibility models in an era of multiple environmental stressors. Ecol. Evol. 2020, 10, 10937–10952. [Google Scholar] [CrossRef]
- Hartigan, J.A.; Wong, M.A. Algorithm AS 136, A K-Means Clustering Algorithm. J. R. Stat. Soc. Ser. C (Appl. Stat.) 1979, 28, 100–108. [Google Scholar] [CrossRef]
- Jigu, S.; Jie, L.; Lianyu, Z. Clustering Algorithms Research. J. Softw. 2008, 19, 48–61. [Google Scholar]
- Jain, A.K. Data clustering: 50 years beyond K-means. Pattern Recognit. Lett. 2010, 31, 651–666. [Google Scholar] [CrossRef]
- Dai, J.; Fang, J.; Guo, Z.; Hou, J. Research on ecological restoration assessment and eco-economic development of sea area by introducing the K-means clustering algorithm. Environ. Sci. Pollut. Res. Int. 2023, 30, 118318–118331. [Google Scholar] [CrossRef]
- Ikotun, A.M.; Ezugwu, A.E.; Abualigah, L.; Abuhaija, B.; Heming, J. K-means clustering algorithms: A comprehensive review, variants analysis, and advances in the era of big data. Inf. Sci. 2023, 622, 178–210. [Google Scholar] [CrossRef]
- Thorndike, R.L. Who belongs in the family? Psychometrika 1953, 18, 267–276. [Google Scholar] [CrossRef]
- Syakur, M.A.; Khotimah, B.K.; Rochman, E.M.S.; Satoto, B.D. Integration K-Means Clustering Method and Elbow Method For Identification of The Best Customer Profile Cluster. IOP Conf. Ser. Mater. Sci. Eng. 2018, 336, 012017. [Google Scholar] [CrossRef]
- Jenkins, C.N.; Van Houtan, K.S.; Pimm, S.L.; Sexton, J.O. US protected lands mismatch biodiversity priorities. Proc. Natl. Acad. Sci. USA 2015, 112, 5081–5086. [Google Scholar] [CrossRef]
- Ghoddousi, A.; Loos, J.; Kuemmerle, T. An Outcome-Oriented, Social–Ecological Framework for Assessing Protected Area Effectiveness. BioScience 2021, 72, 201–212. [Google Scholar] [CrossRef] [PubMed]
- Fan, F.; Wen, X.; Feng, Z.; Gao, Y.; Li, W. Optimizing urban ecological space based on the scenario of ecological security patterns: The case of central Wuhan, China. Appl. Geogr. 2022, 138, 102619. [Google Scholar] [CrossRef]
- Jokimäki, J.; Suhonen, J. Distribution and habitat selection of wintering birds in urban environments. Landsc. Urban Plan. 1998, 39, 253–263. [Google Scholar] [CrossRef]
- McKinney, M.L. Urbanization, biodiversity, and conservation. BioScience 2002, 52, 883–890. [Google Scholar] [CrossRef]
- Duan, H.; Yu, X.; Shan, K.; Zhang, C.; Liu, H. Effects of habitat loss on migratory shorebird community structure at stopover sites: A case study in the Yellow River Delta, China. Front. Mar. Sci. 2022, 9, 1049765. [Google Scholar] [CrossRef]
- Yan, Z.; Teng, M.; He, W.; Wang, Y.; Yang, J.; Wang, P. Improving conservation effectiveness of nature reserve for golden snub-nosed monkey, a niche-based approach. Ecol. Evol. 2018, 8, 9315–9325. [Google Scholar] [CrossRef]
- Wuhan Water Resources Bulletin. Wuhan Water Affairs Bureau. 2020. Available online: https://swj.wuhan.gov.cn/szy/202104/t20210413_1666703.html (accessed on 15 July 2024).
- Wang, M.; Yao, J.; Chang, H.; Liu, R.; Xu, N.; Liu, Z.; Gong, H.; Zheng, H.; Wang, J.; Guo, X.; et al. Underground well water level observation grid dataset from 2005 to 2022. Sci. Data 2025, 12, 728. [Google Scholar] [CrossRef]
- Terrado, M.; Sabater, S.; Chaplin-Kramer, B.; Mandle, L.; Ziv, G.; Acuna, V. Model development for the assessment of terrestrial and aquatic habitat quality in conservation planning. Sci. Total Environ. 2016, 540, 63–70. [Google Scholar] [CrossRef] [PubMed]
- Li, Z. Bird Diversity and Interannual, Seasonal Variation Dynamics in Wuhan City. Hubei For. Sci. Technol. 2021, 50, 39–42,88. (In Chinese) [Google Scholar]
- Hu, H.; Tang, R.; Tang, Z. Studies on the Birds of Wuhan (II): Seasonal Variation in Species Composition and Population Numbers. J. Wuhan Univ. (Nat. Sci. Ed.) 1981, 4, 94–106. (In Chinese) [Google Scholar]
- Yuan, L.; Liu, D.; Tian, B.; Yuan, X.; Bo, S.; Ma, Q.; Wu, W.; Zhao, Z.; Zhang, L.; Keesing, J.K. A solution for restoration of critical wetlands and waterbird habitats in coastal deltaic systems. J. Environ. Manag. 2022, 302, 113996. [Google Scholar] [CrossRef]
- Moores, N.; Jung, H.; Kim, H.-J.; Hwang, B.-Y.; Hur, W.-H.; Borzée, A. The Hwaseong Wetlands Reclamation Area and Tidal Flats, Republic of Korea: A Case of Waterbird Conservation in the Yellow Sea. Conservation 2022, 2, 526–549. [Google Scholar] [CrossRef]
- Lee, J.-H.; Kim, I.-C.; Lee, S.-W.; Son, J.-J.; Jang, J.-U.; Sung, H.-C. International importance of tidal flats in the Republic of Korea as shorebird stopover sites in the East Asian–Australasian flyway. Avian Conserv. Ecol. 2023, 18, 23. [Google Scholar] [CrossRef]
- Shi, X.; Hu, C.; Soderholm, J.; Chapman, J.; Mao, H.; Cui, K.; Ma, Z.; Wu, D.; Fuller, R.A.; Lecours, V.; et al. Prospects for monitoring bird migration along the East Asian-Australasian Flyway using weather radar. Remote Sens. Ecol. Conserv. 2022, 9, 169–181. [Google Scholar] [CrossRef]
- Xia, S.; Yu, X.; Lei, J.; Hearn, R.; Smith, B.; Lei, G.; Xie, P. Priority sites and conservation gaps of wintering waterbirds in the Yangtze River floodplain. J. Geogr. Sci. 2021, 30, 1617–1632. [Google Scholar] [CrossRef]
- Matutini, F.; Baudry, J.; Fortin, M.-J.; Pain, G.; Pithon, J. Conservation networks do not match the ecological requirements of amphibians. Peer Community J. 2023, 3, e58. [Google Scholar] [CrossRef]
- Ye, Y.; Lin, W.; Song, J.; Wei, Q.; Zheng, Y. Spatial mismatches and multi-dimensional conservation priorities for urban birds in China. J. Environ. Manag. 2025, 379, 124905. [Google Scholar] [CrossRef]
- Sun, W.; Zhao, Y.; Chen, W.; Bai, Y. Current national nature reserves are insufficient to safeguard the long-term survival of birds and mammals in China. Commun. Earth Environ. 2024, 5, 304. [Google Scholar] [CrossRef]
- Bai, Y.; Wong, C.P.; Jiang, B.; Hughes, A.C.; Wang, M.; Wang, Q. Developing China’s Ecological Redline Policy using ecosystem services assessments for land use planning. Nat. Commun. 2018, 9, 3034. [Google Scholar] [CrossRef] [PubMed]
- Xu, X.; Yang, G.; Tan, Y. Identifying ecological red lines in China’s Yangtze River Economic Belt: A regional approach. Ecol. Indic. 2019, 96, 635–646. [Google Scholar] [CrossRef]
- Wei, J.; Tian, Y.; Li, C.; Yuan, H.; Liu, Y. The Coordinative Evaluation of Suburban Construction Land from Spatial, Socio-Economic, and Ecological Dimensions: A Case Study of Suburban Wuhan, Central China. Land 2025, 14, 900. [Google Scholar] [CrossRef]
- Hua, Y.; Cui, B.; He, W.; Cai, Y. Identifying potential restoration areas of freshwater wetlands in a river delta. Ecol. Indic. 2016, 71, 438–448. [Google Scholar] [CrossRef]
- Liang, Q.; Zhai, J.; Li, C. From separation to incorporation: Development of a unifying framework that integrated bird habitats with public recreation spaces within the wetland park system. J. Clean. Prod. 2023, 430, 139647. [Google Scholar] [CrossRef]
- Wei, J.; Zhang, Y.; Liu, Y.; Li, C.; Tian, Y.; Qian, J.; Gao, Y.; Hong, Y.; Liu, Y. The impact of different road grades on ecological networks in a mega-city Wuhan City, China. Ecol. Indic. 2022, 137, 108784. [Google Scholar] [CrossRef]
- Xie, S.; Wang, X.; Ren, Y.; Su, Z.; Su, Y.; Wang, S.; Zhou, W.; Lu, F.; Qian, Y.; Gong, C.; et al. Factors responsible for forest and water bird distributions in rivers and lakes along an urban gradient in Beijing. Sci. Total Environ. 2020, 735, 139308. [Google Scholar] [CrossRef]
- González-Sargas, E.; Meehan, T.D.; Hinojosa-Huerta, O.; Villagomez-Palma, S.; Calvo-Fonseca, A.; Dodge, C.; Gómez-Sapiens, M.; Shafroth, P.B. Bird community response to one decade of riparian restoration along the Colorado River delta in Mexico. Ecol. Eng. 2024, 205, 107291. [Google Scholar] [CrossRef]
- Sun, X.; Shen, J.; Xiao, Y.; Li, S.; Cao, M. Habitat suitability and potential biological corridors for waterbirds in Yancheng coastal wetland of China. Ecol. Indic. 2023, 148, 110090. [Google Scholar] [CrossRef]
- Tarjuelo, R.; Benítez-López, A.; Casas, F.; Martín, C.A.; García, J.T.; Viñuela, J.; Mougeot, F. Living in seasonally dynamic farmland: The role of natural and semi-natural habitats in the movements and habitat selection of a declining bird. Biol. Conserv. 2020, 251, 108794. [Google Scholar] [CrossRef]
- U.S. Fish and Wildlife Service. Urban Bird Treaty Program Guidebook V.3, Making Cities Healthier Places for Birds and People; U.S. Fish and Wildlife Service: Hadley, MA, USA, 2020.
- Lin, H.-Y.; Schuster, R.; Wilson, S.; Cooke, S.J.; Rodewald, A.D.; Bennett, J.R. Integrating season-specific needs of migratory and resident birds in conservation planning. Biol. Conserv. 2020, 252, 108826. [Google Scholar] [CrossRef]
- Soares, R.M.V.; Lira, P.K.; Manes, S.; Vale, M.M. A methodological framework for prioritizing habitat patches in urban ecosystems based on landscape functional connectivity. Urban Ecosyst. 2023, 27, 147–157. [Google Scholar] [CrossRef]
- Convention on Biological Diversity (CBD). Decision Adopted by the Conference of the Parties to the Convention on Biological Diversity: 14/8. In Protected Areas and Other Effective Area-Based Conservation Measures; CBD Secretariat: Sharm El-Sheikh, Egypt, 2018. [Google Scholar]
- Cook, C.N. Progress developing the concept of other effective area-based conservation measures. Conserv. Biol. 2024, 38, e14106. [Google Scholar] [CrossRef]
- Bleyhl, B.; Baumann, M.; Griffiths, P.; Heidelberg, A.; Manvelyan, K.; Radeloff, V.C.; Zazanashvili, N.; Kuemmerle, T. Assessing landscape connectivity for large mammals in the Caucasus using Landsat 8 seasonal image composites. Remote Sens. Environ. 2017, 193, 193–203. [Google Scholar] [CrossRef]
- He, J.; Huang, J.; Liu, D.; Wang, H.; Li, C. Updating the habitat conservation institution by prioritizing important connectivity and resilience providers outside. Ecol. Indic. 2018, 88, 219–231. [Google Scholar] [CrossRef]
- Huang, J.; Andrello, M.; Martensen, A.C.; Saura, S.; Liu, D.; He, J.; Fortin, M.J. Importance of spatio–temporal connectivity to maintain species experiencing range shifts. Ecography 2020, 43, 591–603. [Google Scholar] [CrossRef]
- Churko, G.; Kienast, F.; Bolliger, J. A Multispecies Assessment to Identify the Functional Connectivity of Amphibians in a Human-Dominated Landscape. ISPRS Int. J. Geo-Inform. 2020, 9, 287. [Google Scholar] [CrossRef]
- Donaldson, L.; Bennie, J.J.; Wilson, R.J.; Maclean, I.M.D. Designing effective protected area networks for multiple species. Biol. Conserv. 2021, 258, 109125. [Google Scholar] [CrossRef]
- Bellard, C.; Bertelsmeier, C.; Leadley, P.; Thuiller, W.; Courchamp, F. Impacts of climate change on the future of biodiversity. Ecol. Lett. 2012, 15, 365–377. [Google Scholar] [CrossRef]


| Data Name | Type | Content | Format | Year | Sources |
|---|---|---|---|---|---|
| Bird Observation Dataset | Seasonal | Species name, taxonomy, time, coordinates, and count | .txt | 2016–2020 | Global Biodiversity Information Facility (GBIF), https://www.gbif.org/ (accessed on 11 September 2024). |
| Land Use/Land Cover (LULC) | Annual | Land-use type: cropland, forest, grassland, wetlands, urban land, and bare land | .tif | 2020 | GLC_FCS30: global land-cover product with fine classification system at 30 m using time-series Landsat imagery, https://data.casearth.cn/ (accessed on 8 June 2024). |
| Digital Elevation Model (DEM) | Annual | Slope, aspect, and elevation | .hdf | NASA Shuttle Radar Topography Mission Global 1 arc second V003 (SRTMGL1) datasets with a spatial resolution of 30 m, https://www.earthdata.nasa.gov/data/catalog/lpcloud-srtmgl1-003 (accessed on 10 June 2024). | |
| Normalized Difference Vegetation Index (NDVI) | Seasonal | Surface vegetation coverage; seasonal NDVI derived using MVC method | .hdf | 2020 | MODIS/Terra Vegetation Indices 16-Day L3 Global 250 m SIN Grid V061, https://www.earthdata.nasa.gov/data/catalog/lpcloud-mod13q1-061 (accessed on 15 July 2024). |
| Net Primary Productivity (NPP) | Annual | Annual Gross and Net Primary Production | .hdf | 2020 | MODIS/Terra Net Primary Production Gap-Filled Yearly L4 Global 500 m SIN Grid V061, https://www.earthdata.nasa.gov/data/catalog/lpcloud-mod17a3hgf-061 (accessed on 15 July 2024). |
| Temperature | Seasonal | Monthly temperature data, aggregated to seasonal values using AVC method | .nc | 2020 | 1 km monthly temperature dataset for China, National Earth System Science Data Center, National Science and Technology Infrastructure of China, http://www.geodata.cn (accessed on 18 July 2024). |
| Precipitation | Seasonal | Monthly precipitation data, aggregated to seasonal values using AVC method | .nc | 2020 | 1 km monthly precipitation dataset for China, National Earth System Science Data Center, National Science and Technology Infrastructure of China, http://www.geodata.cn (accessed on 18 July 2024). |
| Roads | Annual | Railways, highways, and urban expressways classified as high-level roads; primary and secondary roads classified as low-level roads | .osm | 2020 | OpenStreetMap, https://www.openstreetmap.org (accessed on 15 July 2024). |
| Nighttime Light | Seasonal | Human activity range; seasonal nighttime light extracted using MVC; urban boundaries identified using the VANUI index, integrating NDVI and nighttime light data | .tif | 2020 | 500 m Nighttime Light map by EOG, https://eogdata.mines.edu/products/vnl/ (accessed on 1 September 2024). |
| GDP | Annual | Gross domestic product for a 1 km grid, in million yuan per square kilometer, corrected using district-level GDP data from the Wuhan Statistical Yearbook | .tif | 2020 | China GDP Spatial Distribution Kilometer Grid Dataset, https://www.resdc.cn (accessed on 1 September 2024). |
| Population Density | Annual | Population density per grid cell, in the number of people per square kilometer, corrected using district-level population data from the Wuhan Statistical Yearbook | .tif | 2020 | Global High Resolution Population Denominators Project, https://dx.doi.org/10.5258/SOTON/WP00675 (accessed on 10 September 2024). |
| Building Height | Annual | Units in meters; classified into four categories based on avian collision risk studies | .tif | 2020 | Urban building height data with a spatial resolution of 1 m, The Department of Natural Resources of Hubei Province |
| Nature Reserve | Annual | Location, size, and time of approval, defined as inaccessible areas | .shp | 2020 | The Department of Natural Resources of Hubei Province |
| Variable Category | Environmental Variable (unit) | Abbr. |
|---|---|---|
| Topography | Elevation (m) | DEM |
| Slope (°) | Slope | |
| Aspect (°) | Aspect | |
| Land cover | Land-use type | LUCC |
| Climate | Temperature (℃) | TEMP |
| Precipitation (mm) | PRE | |
| Vegetation | Normalized Difference Vegetation Index | NDVI |
| Net Primary Production (kgC/m2/a) | NPP | |
| Distance effect | Distance to wetland (m) | DtoW |
| Distance to forest (m) | DtoF | |
| Distance to bare land (m) | DtoB | |
| Distance to urban areas (m) | DtoU | |
| Distance to cropland (m) | DtoC | |
| Distance to high-level roads (m) | DtoHR | |
| Distance to low-level roads (m) | DtoLR | |
| Distance to buildings (m) | DtoBL |
| Criteria | Low (1) | Medium (2) | High (3) | Reference(s) | |
|---|---|---|---|---|---|
| Exposure | Spatial Overlap Area Rating | <10% | 10–30% | ≥30% | Samhouri [68,72] |
| Temporal Overlap Rating | 0–4 months per year | 4–8 months per year | 8–12 months per year | [67,73] | |
| Intensity Rating | Low intensity | Medium intensity | High intensity | [67,73] | |
| Consequence—Sensitivity | Change in Area | Low loss (<20%) | Medium loss (20–50%) | High loss (>50%) | [67,73] |
| Consequence—Resilience | Connectivity | High (>100 km) | Medium (10–100 km) | Low (<10 km) | [67,73] |
| Water Quality | >70% of the area with a water quality of better than Class III | 50–60% of the area with a water quality of better than Class III | <50% of the area with a water quality of better than Class III | [75] | |
| NPP (kgC/m2/a) | High (>0.5) | Moderate (0.2–0.5) | Low (<0.2) | [76,77] | |
| Land-Use Type | Habitat Suitability Classification from MaxEnt | Adjusted Habitat Suitability in HQ Model |
|---|---|---|
| Wetland/Forest/Grassland | <0.049 | 0.5 |
| 0.049–0.126 | 0.6 | |
| 0.126–0.226 | 0.7 | |
| 0.226–0.354 | 0.8 | |
| 0.354–0.516 | 0.9 | |
| ≥0.516 | 1 | |
| Cropland/Urban/Bare Land | 0 | 0 |
| Land-Use Type | Cropland | Urban | Bare Land | High-Level Roads | Low-Level Roads | Buildings |
|---|---|---|---|---|---|---|
| Wetland | 0.7970 | 0.8737 | 0.6300 | 0.7500 | 0.6000 | 0.8500 |
| Forest | 0.6364 | 0.9189 | 0.5600 | 0.8000 | 0.7000 | 0.8500 |
| Grassland | 0.5781 | 0.5663 | 0.4907 | 0.6000 | 0.4000 | 0.8500 |
| Cropland | 0 | 0 | 0 | 0 | 0 | 0 |
| Urban | 0 | 0 | 0 | 0 | 0 | 0 |
| Bare Land | 0 | 0 | 0 | 0 | 0 | 0 |
| Threat | Maximum Impact Distance (km) | Weight | Distance-Decay Function |
|---|---|---|---|
| Cropland | 0.5 | 0.3 | Linear |
| Urban | 2 | 0.9 | Exponential |
| Bare Land | 0.5 | 0.1 | Linear |
| High-level Roads | 1 | 1 | Linear |
| Low-level Roads | 0.8 | 0.6 | Linear |
| Buildings | 1 | 0.9 | Exponential |
| Habitat Type | Spring | Summer | Autumn | Winter | ||||
|---|---|---|---|---|---|---|---|---|
| Mean | SD | Mean | SD | Mean | SD | Mean | SD | |
| All habitats | 0.0745 | 0.10 | 0.0504 | 0.08 | 0.1393 | 0.16 | 0.1123 | 0.11 |
| Wetland | 0.0775 | 0.10 | 0.0561 | 0.08 | 0.1854 | 0.16 | 0.1405 | 0.12 |
| Forest | 0.0665 | 0.10 | 0.0385 | 0.07 | 0.0444 | 0.09 | 0.0542 | 0.07 |
| Grassland | 0.0939 | 0.11 | 0.0453 | 0.07 | 0.0922 | 0.12 | 0.0855 | 0.09 |
| Habitat Type | Spring | Summer | Autumn | Winter | ||||
|---|---|---|---|---|---|---|---|---|
| Mean | SD | Mean | SD | Mean | SD | Mean | SD | |
| All habitats | 0.5418 | 0.09 | 0.5208 | 0.08 | 0.6063 | 0.12 | 0.5938 | 0.12 |
| Wetland | 0.5400 | 0.09 | 0.5224 | 0.08 | 0.6475 | 0.12 | 0.6228 | 0.13 |
| Forest | 0.5443 | 0.09 | 0.5180 | 0.07 | 0.5223 | 0.07 | 0.5345 | 0.08 |
| Grassland | 0.5598 | 0.10 | 0.5108 | 0.07 | 0.5524 | 0.09 | 0.5590 | 0.10 |
| Cluster | Protected Area (km2) | Unprotected Area (km2) | Total Area (km2) | Protection Rate (%) |
|---|---|---|---|---|
| Cluster 1 | 46.22 | 53.16 | 99.38 | 46.51 |
| Cluster 2 | 187.47 | 655.68 | 843.15 | 22.23 |
| Cluster 3 | 179.44 | 208.16 | 387.60 | 46.30 |
| Cluster 4 | 70.21 | 152.68 | 222.89 | 31.50 |
| Total | 483.34 | 1069.68 | 1553.02 | 31.22 |
Disclaimer/Publisher’s Note: The statements, opinions and data contained in all publications are solely those of the individual author(s) and contributor(s) and not of MDPI and/or the editor(s). MDPI and/or the editor(s) disclaim responsibility for any injury to people or property resulting from any ideas, methods, instructions or products referred to in the content. |
© 2025 by the authors. Licensee MDPI, Basel, Switzerland. This article is an open access article distributed under the terms and conditions of the Creative Commons Attribution (CC BY) license (https://creativecommons.org/licenses/by/4.0/).
Share and Cite
Wei, J.; Tian, Y.; Li, C.; Zhang, Y.; Yuan, H.; Liu, Y. Identifying Priority Bird Habitats Through Seasonal Dynamics: An Integrated Habitat Suitability–Risk–Quality Framework. Sustainability 2025, 17, 6078. https://doi.org/10.3390/su17136078
Wei J, Tian Y, Li C, Zhang Y, Yuan H, Liu Y. Identifying Priority Bird Habitats Through Seasonal Dynamics: An Integrated Habitat Suitability–Risk–Quality Framework. Sustainability. 2025; 17(13):6078. https://doi.org/10.3390/su17136078
Chicago/Turabian StyleWei, Junqing, Yasi Tian, Chun Li, Yan Zhang, Hongzhou Yuan, and Yanfang Liu. 2025. "Identifying Priority Bird Habitats Through Seasonal Dynamics: An Integrated Habitat Suitability–Risk–Quality Framework" Sustainability 17, no. 13: 6078. https://doi.org/10.3390/su17136078
APA StyleWei, J., Tian, Y., Li, C., Zhang, Y., Yuan, H., & Liu, Y. (2025). Identifying Priority Bird Habitats Through Seasonal Dynamics: An Integrated Habitat Suitability–Risk–Quality Framework. Sustainability, 17(13), 6078. https://doi.org/10.3390/su17136078