Article

Feasibility of Struvite Crystals Obtained from Swine Wastewater and Urban Sewage Sludge Liquid Fraction as Fertilising Product

by
Rubén Rodríguez-Alegre
,
Sergi Durán-Videra
,
Manuel Cepero-Sánchez
,
Laura Pérez Megías
,
Carlos Andecochea Saiz
and
Xialei You
*
Leitat Technological Center, Circular Economy & Decarbonization Department, Carrer de La Innovació 2, 08225 Terrassa, Spain
*
Author to whom correspondence should be addressed.
These authors contributed equally to this work.
Sustainability 2025, 17(13), 6080; https://doi.org/10.3390/su17136080
Submission received: 20 June 2025 / Revised: 30 June 2025 / Accepted: 1 July 2025 / Published: 2 July 2025

Abstract

Increasing global food demand has led to an intensive use of synthetic fertilisers. In this regard, the use of non-conventional streams such as swine wastewater (SW) and urban sewage sludge liquid fraction (USS) for the production of bio-based fertilisers can increase the sustainability of both the fertiliser industry and agriculture while reducing the reliance on imported nutrients. In this work, USS and SW were assessed for the production of struvite at different PO43−:Mg2+ ratios. Significant differences were found in terms of struvite crystals’ shape and size among both feedstocks due to the different saturation indexes, and it was concluded that PO43−:Mg2+ ratios of 1:2 for SW and 1:1 for USS were the most suitable for obtaining big crystals suitable to be used for direct fertilisation. In addition, it was observed that the crystallisation process is highly dependent on the presence of interfering ions (mainly Ca) that can result in the formation of hydroxyapatite instead of struvite. Finally, recovering struvite from SW and USS could potentially reduce the European import of P by up to 6.5%.

Graphical Abstract

1. Introduction

The global population is projected to reach 10.3 billion people by 2080, according to United Nations estimates, resulting in an intensification of agricultural production to supply increasing food demand [1]. Although non-renewably sourced synthetic mineral fertilisers (fossil energy for N, and rock deposits for P) have enabled access to sufficient food for the world’s population, it is crucial to shift towards a circular approach for fertiliser production to ensure future food security [2].
The circular economy approach is intended to optimise resource use while reducing waste generation through the reuse, recycling, and valorisation of by-products [3]. In this framework, recovering nutrients (mainly N and P) from waste streams can enhance overall agriculture sector sustainability by closing anthropogenic nutrient cycles [4]. In addition, this approach mitigates the environmental impact linked to fertilising products production by reducing the use of non-renewable resources such as phosphate rock, which is currently considered a critical raw material [5], avoiding the release of carbon dioxide and nitrous oxide resulting of the production of nitrogen-based fertilisers [6], and shortening the value chain and transportation distances for both raw materials and manufactured fertilising products [7]. Within this context, recovering struvite through the valorisation of wastes is an alternative to commercial fertilisers, allowing the recovery of the previously mentioned nutrients while closing the circularity approach in the valorisation of waste streams.
Several studies have identified animal manure and sewage sludge as the most promising waste streams for being valorised to obtain bio-based fertilisers (BBFs), representing more than 90% of the nutrients contained in commonly generated wastes [8]. Swine wastewater (SW), the liquid fraction of animal manure, contains large amounts of macronutrients in its composition. While N can be found as soluble NH4+, P as PO43− is found in the solid phase, which can be resolubilised by decreasing the pH down to 5, as reported elsewhere [9]. With a high content of macronutrients, struvite crystallisation is potentially favoured. However, SW usually contains Ca, which can interfere negatively with the crystallisation process by inhibiting struvite formation.
Urban sewage sludge liquid fraction (USS) contains lower concentrations of both N and P compared to SW. However, it could still be valorised as a resource for struvite production, particularly as the increasing number of wastewater treatment facilities results in the generation of high volumes of USS. Nutrients contained in USS and manure can be recovered through membrane-based technologies or crystallisation, among others [10,11].
Most pressure-driven membrane processes aim to remove water, obtaining a nutrient-rich stream, resulting in low-quality fertilising products that could contain pollutants such as heavy metals or pathogens. By contrast, the crystallisation of struvite (MgNH4PO4⋅6H2O), formed with equimolar concentration of its components (N, P, and Mg), allows the simultaneous and selective recovery of N and P [12,13]. In addition, due to the low solubility of struvite crystals, its use as slow-release fertiliser would lead to a reduction of nutrient loss (mostly N) by volatilisation and leaching [14].
The purity and nutrient release rates from struvite crystals is directly related to the size and morphology of the crystals. Larger and uniform crystals retain fewer pollutants during crystallisation and dissolve more slowly, offering a longer nutrient release period [15], while irregular crystals retain more pollutants and dissolve faster due to their higher specific area, accelerating their interaction with soil moisture and microorganisms [16]. Therefore, in order to offer a high-purity product and prolonged fertilising effect, it is preferable to use larger and uniform crystals.
This study aims to assess the recovery of N and P through struvite crystallisation using USS and SW as feedstocks. The use of both feedstocks will be compared in terms of process kinetics and obtained product characteristics, crystal size, and morphology.

2. Materials and Methods

2.1. Reagents and Equipment

pH adjustments were performed using sulphuric acid 98% and sodium hydroxide 17 M; isopropanol (99.8%) was used for struvite cleaning and isolation; and MgCl2·6H2O was used as magnesium source for crystallisation. All reagents were supplied by Scharlab (Barcelona, Spain).
To remove solids from samples, a DIGICEN 21 R (Ortoalresa, Madrid, Spain) centrifuge was used; struvite crystal visualisation was performed using an AXIOPLAN (Carl Zeiss, Oberkochen, Germany) microscope and a JSM-6010LV scanning electron microscope (SEM) (JEOL TOUCHSCOPE, Tokyo, Japan).
For struvite characterisation, a Fourier-transform infrared spectroscope (FTIR) IRAffinity-1S (SHIMADZU, Barcelona, Spain) and a X’Pert (Malvern Panalytical, Almelo, The Netherlands) X-ray diffraction (XRD) system were used. In addition, thermogravimetric analysis using a TGA Q500 (TA Instruments, Barcelona, Spain) and differential scanning calorimetry (DSC) using a Q20 (TA Instruments, New Castle, DE, USA) were also carried out.
The chemical composition of the liquid fraction was measured through the following colourimetric methods using a spectrophotometer R3900 (HACH, Barcelona, Spain): chemical oxygen demand (COD) based on the potassium dichromate method [17]; phosphorus in the form of phosphate (P-PO43−) based on the phosphomolybdenum blue method [18]; nitrogen in the form of ammonium (N-NH4+) based on the indophenol blue method [19]; and magnesium in the form of magnesium(II) ions (Mg2+) based on the phthalein purple method [20].
The theoretical calculations of mineral precipitation were carried out using the Visual MINTEQ version 3.1 software (KTH Royal Institute of Technology, Stockholm, Sweden).

2.2. Feedstocks Characterisation

SW samples were obtained from a solid–liquid separator with a mesh of 280 μm from a farm in Muntanyola (Spain) and afterwards acidified with sulphuric acid to pH 5 to resolubilise phosphate salts as reported elsewhere [9]. USS was collected from a wastewater treatment plant located in Terrassa (Spain). Both samples were centrifuged at 5100 RPM and 5 °C for 30 min for the removal of solids; 80% of the initial volume was recovered as the centrifuged fraction and characterised, obtaining the values presented in Table 1.

2.3. Struvite Crystallisation

For struvite crystallisation, 3 different molar ratios of PO43−:Mg2+ (1:1, 1:2, and 1:3) were assessed based on the theoretical stoichiometry of struvite and preliminary work. The centrifuged supernatant’s pH was adjusted to 9 ± 0.5 using sodium hydroxide according to the optimal conditions reported by Zin et al. [21], to switch phosphate equilibria towards HPO42−. Proper amounts of MgCl2·6H2O were added to reach the PO43−:Mg2+ molar ratios, and the mixture was stirred and allowed to settle for 24 h.
As ammonium was naturally present in excess in the liquid fraction of both the SW and the USS, only the phosphate to magnesium molar ratio was adjusted in this study. After stirring, the samples were allowed to settle. The supernatant was collected and filtered with 0.45 µm PVDF filters to be analysed.

2.4. Struvite Cleaning Protocol

A cleaning protocol was implemented for cleaning and isolating struvite crystals from the sediment and reducing the presence of impurities coming from the feedstock to perform a more precise characterisation. In this protocol, the solid is first rinsed with deionised water several times. The mixture of crystals and deionised water is stirred for 15 min, ensuring a thorough wash, to remove any remaining impurities. The deionised water is then removed with a Pasteur pipette, leaving only the washed crystals. Afterwards, the crystals are additionally cleaned with a further purification step using a 4:1 volumetric ratio of isopropanol to crystals.
After isopropanol addition, the mixture is shaken to foster the solubilisation of potential impurities and allowed to settle prior to the separation of crystals from isopropanol. Finally, the crystals are further rinsed with deionised water to remove any residual solvent.

2.5. Struvite Analysis Techniques

Once precipitated and cleaned following the protocol presented in Section 2.4, the resulting solid was characterised to assess struvite’s physical and chemical properties. The morphology of the crystals was examined by optical microscopy at ×10, ×20, and ×40 magnifications, and by SEM, operated at an accelerating voltage of 5 kV, after coating the samples with a thin gold layer. FTIR spectra were recorded over the range of 600–3600 cm−1, with a resolution of 4 cm−1. XRD analysis was performed with λ = 1.5419 Å radiation, operating at 45 kV and 40 mA, with diffraction patterns collected over a 2θ range of 5–50° and a step size of 0.0263°. Thermal characterisation was conducted by TGA under a nitrogen atmosphere, from ambient temperature to 800 °C, at a heating rate of 10 °C min−1, with a slower heating rate of 5 °C min−1 at 90 °C; and DSC under a nitrogen atmosphere was carried out from 50 °C to 300 °C, at a heating rate of 10 °C min−1.

2.6. Process Monitoring

The formation of struvite crystals is dependent on the supersaturation of the solution. The saturation index (SI) indicates the solution’s potential to precipitate according to the product solubility and its components’ ionic activity. For positive SI values, the solution is supersaturated, favouring crystallisation. It can be expressed as stated by Ye et al. [22] (Equations (1)–(3)):
SI = Log 10 ( SSR )
SSR = IAP / K sp
IAP = Mg 2 + NH 4 + PO 4 3 = γ Mg 2 + γ NH 4 + γ PO 4 3 Mg 2 + NH 4 + [ PO 4 3 ]
where SSR is the supersaturation ratio, Ksp is the struvite solubility product (10–13.26 at 25 °C), and IAP is the ionic activity product of all the elements needed to produce struvite. Struvite crystallisation kinetics can be modelled using first-order kinetics as shown in Equation (4) [23]:
ln [ C C e q / ( C o C e q ) ] = kt
where C represents the concentration of the sample at time t, Ceq is the equilibrium concentration, Co is the initial concentration, and k is the rate constant for the first-order reaction.
Finally, the percentage of recovered nutrients was also used as a circularity indicator. This points out the recovery of nutrients, which allows their use as a fertiliser in soils, reducing the human environmental footprint and increasing the circularity of the process. The recovery ratio of each nutrient separately was calculated following the equation adapted from Papangelou & Mathijs [24] and Preisner et al. [25] (Equation (5)):
I rec = 1 m initial m final m initial · 100
where the recovery of NPK is represented by Irec in %, minitial is the initial mass of the nutrients on the slurry (g), and mfinal is the final mass of the treated slurry (g).

3. Results and Discussion

3.1. Crystallisation Process Assessment

For both feedstocks, SI values were calculated for all assessed PO43−:Mg2+ molar ratios (Table 2) and it can be observed that the values obtained for SW were significantly higher than those reported for USS. It is important to notice that, although only the phosphate to magnesium molar ratio was adjusted in this study, ammonium was naturally present in excess in the liquid fraction of both the SW and the USS. As such, ammonium was not considered a limiting factor in the precipitation process, and the stoichiometric conditions required for struvite crystallisation were met without the need for additional ammonium dosing or control.
After struvite crystallisation, the resulting supernatants were analysed in triplicate to assess the phosphorus recovery ratio. The results obtained from these analyses are shown in Table 3.
The content of macronutrients (N and P) in the SW feed is tightly related to the pigs’ diet and can vary between farm types and seasons. In the case of this study, samples show an initial concentration of around 3500 mg L−1 and 840 mg L−1, for N-NH4+ and P-PO43−, respectively. In contrast, USS has variations between facilities but tends to have a stable composition over time outside heavy touristic nodes. The content of the macronutrients found in the USS was considerably smaller, with concentrations of 483 mg L−1 and 87 mg L−1, for N-NH4+ and P-PO43−, respectively. Regarding the magnesium content, its presence in the feeds was 719 mg L−1 and 38 mg L−1 for SW and USS, respectively.
After precipitation, the supernatants from the SW had similar remnants of phosphorus in the three cases (1:1, 1:2, and 1:3). However, there was a noticeable change in the ammonium content, with supernatants with PO43−:Mg2+ ratios above equimolar showing a greater reduction in ammonium presence. Magnesium concentration is related to that of phosphate, which is the limiting reagent in the precipitation reaction. Thus, the remaining magnesium concentration was greater at higher PO43−:Mg2+ ratios.
In the case of the USS supernatants, there was a similar tendency to the SW. The remaining phosphorus was also similar in the three cases. The ammonium decreased at higher PO43−:Mg2+ ratios, with a reduction more pronounced than for the SW, and the magnesium increased following the same trend as before.
The potential interferences in the formation of struvite crystals due to the presence of calcium, in the form of hydroxyapatite (Ca5(PO4)3OH), were assessed for both SW and USS through Visual MINTEQ software modelling. The software yielded theoretical hydroxyapatite precipitation rates of 13.34 ± 0.67% for SW and 42.63 ± 0.21% for the USS, reducing the phosphorus availability to produce struvite. The different behaviour between both feedstocks can be explained by the higher initial concentration of Ca2+ compared to Mg2+ in the case of USS, which increases the chances of the PO43− interacting with the Ca2+ for its precipitation in the form of hydroxyapatite. This explanation is reinforced by the decrease in ammonia concentrations at greater PO43−:Mg2+ ratios, particularly for the USS case, as the increased concentration of magnesium versus calcium favours the precipitation of struvite.

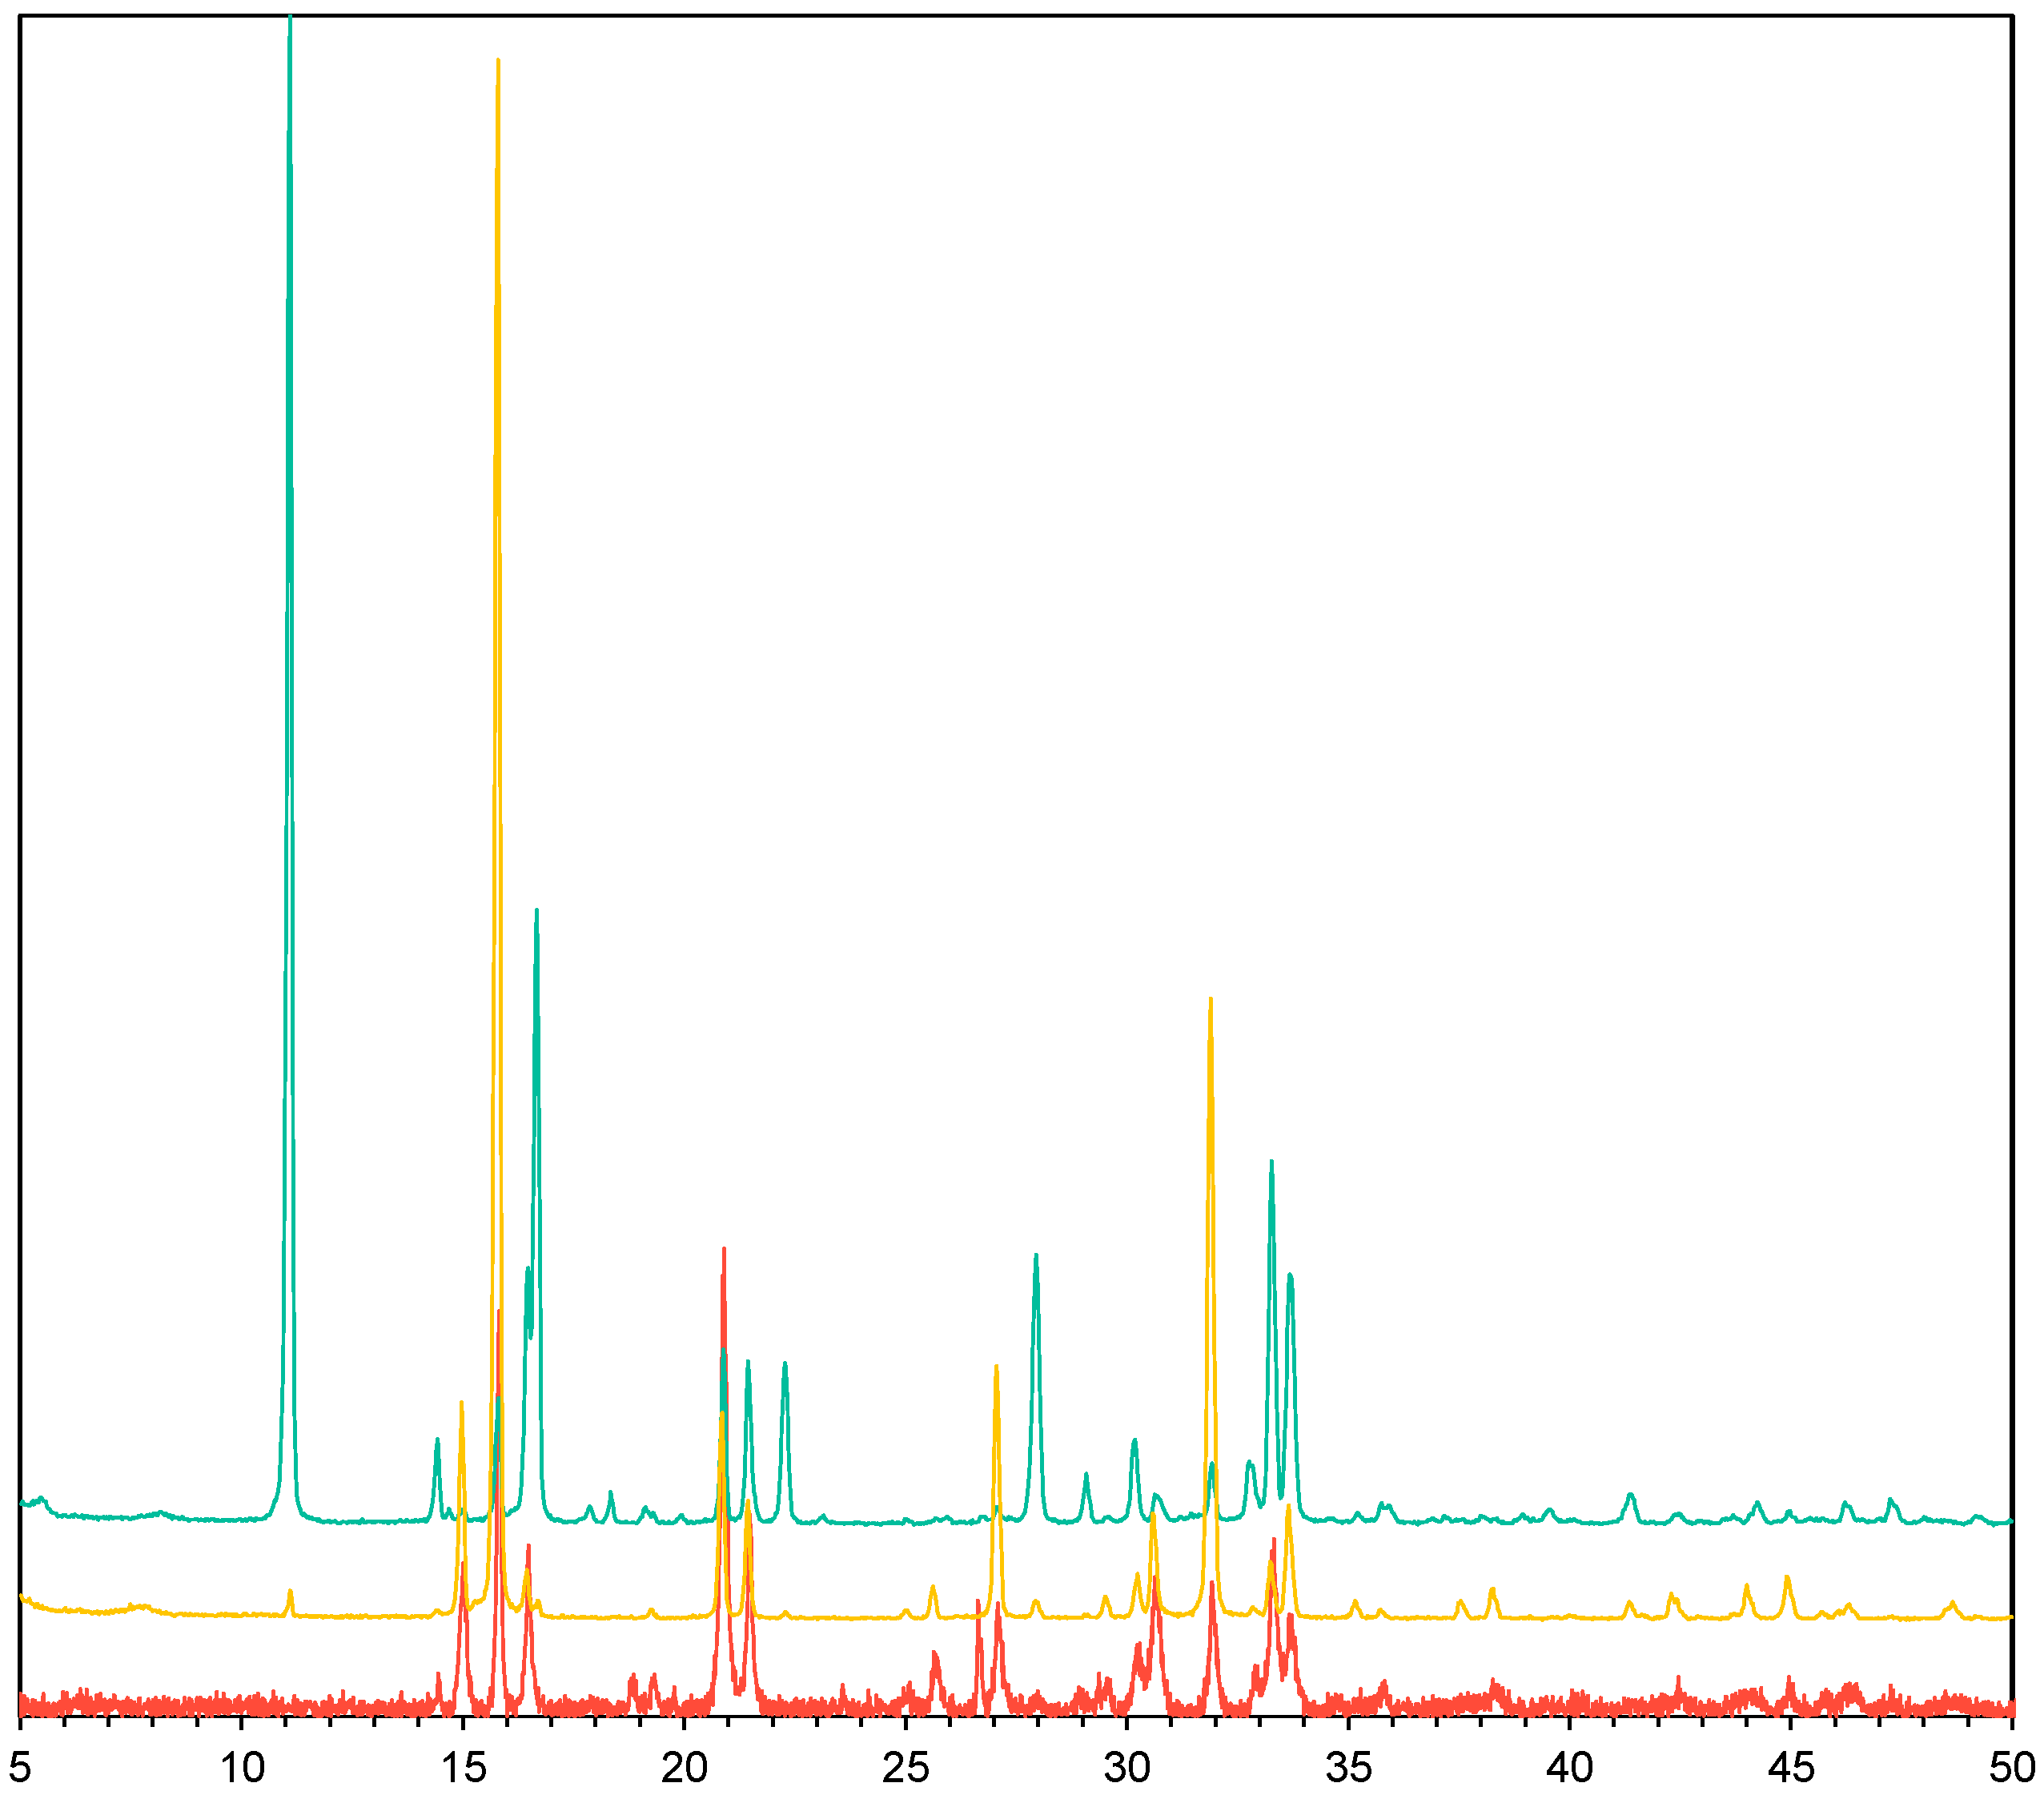
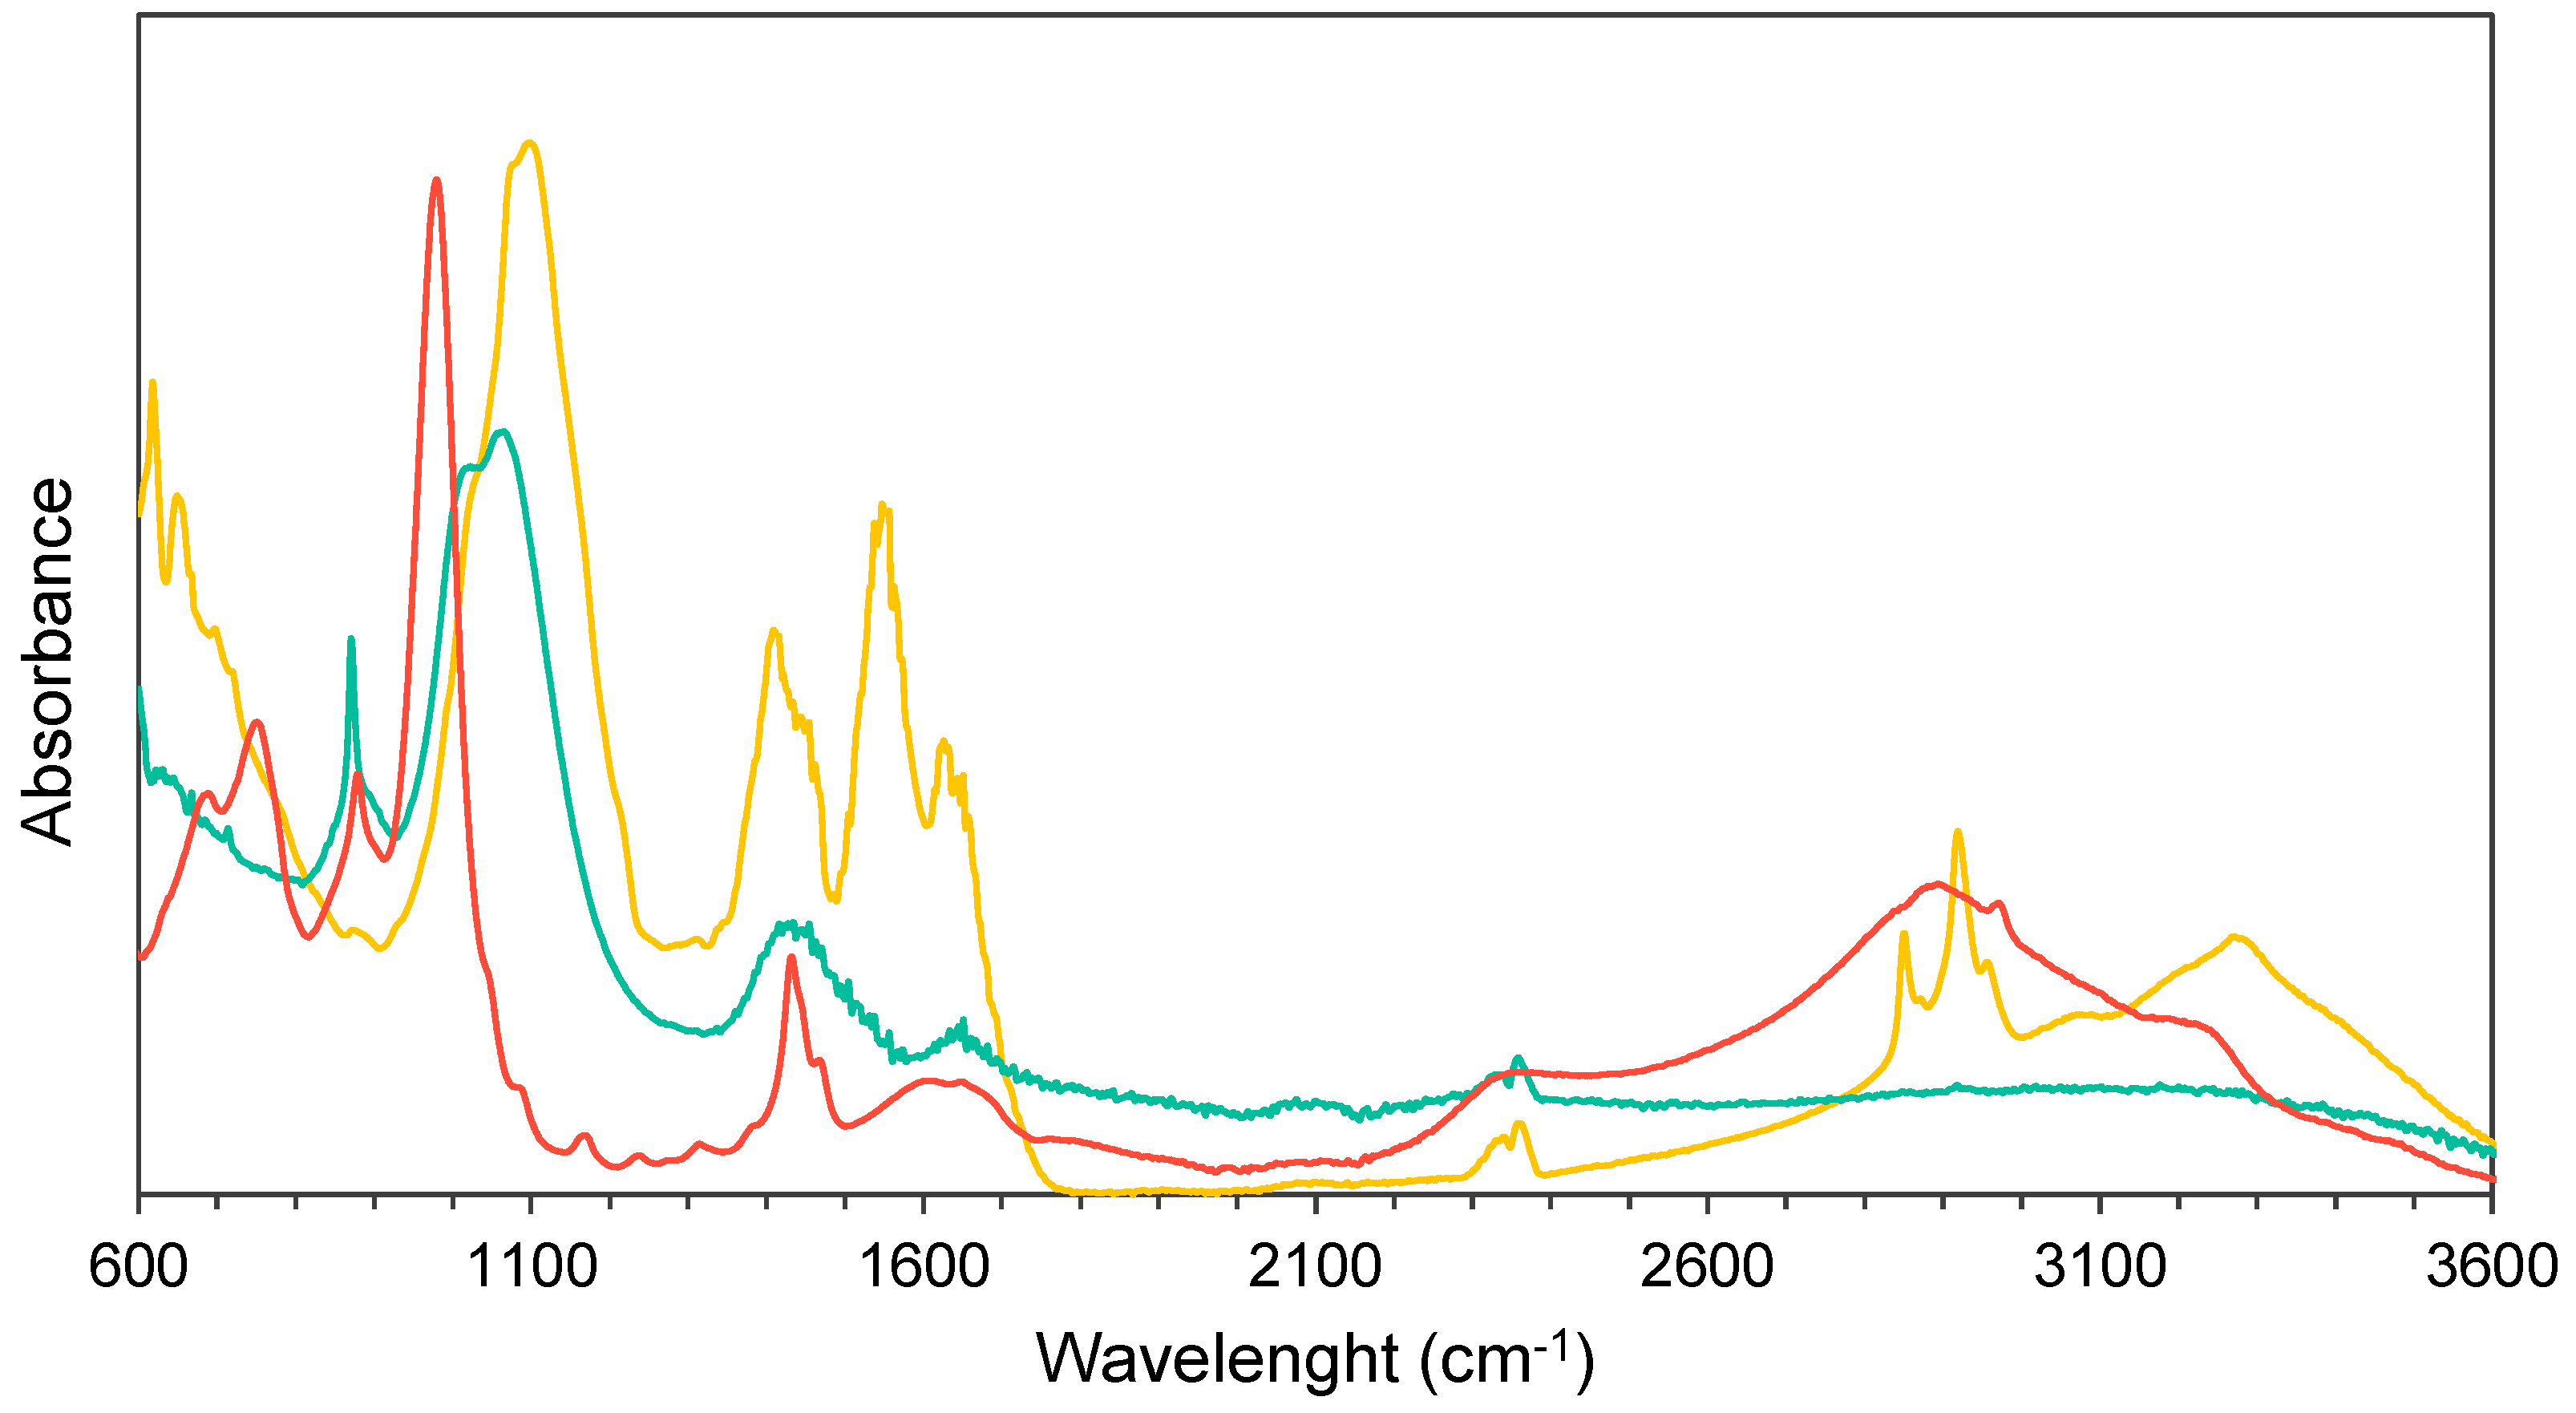
3.2. Struvite Crystals Characterisation

Cleaned struvite crystals were visually characterised under the optical microscope, revealing that struvite crystals obtained from SW were more numerous and exhibited a multilayer cross-shaped morphology, while those from USS displayed a rod-like shape (Figure 1). This distinction appears to be influenced by differences in the saturation indices of each source, with SW having greater saturation indices (9.83 to 11.04) than those of the USS (6.89 to 7.32). Higher saturation indices favour nucleation, and consequently, more crystals are in the media and over existing crystal planes, creating an overlapping layer. In contrast, lower saturation indices allow slower and more controlled crystal growth, resulting in larger, elongated single crystals [26].
These morphologies directly affect their dissolution rates since larger single crystals dissolve at a lower rate in soil due to their lower specific area, while multilayer crystals have a higher specific area, resulting in faster dissolution rates. The increased exposure of edges and sharp angles to soil moisture and microorganisms accelerates the release of nutrients.
The images obtained using optical microscopy allow for the determination of optimal PO43−:Mg2+ ratios for struvite crystallisation from the studied streams. Looking for big macrocrystalline structures that allow direct use of the struvite, the optimal ratio for crystallisation under this condition from SW is 1:2, whereas for USS, it is 1:1.
A more detailed observation of the crystals was conducted using SEM, based on the crystals obtained with the optimal ratios (Figure 2). The obtained images provide a better understanding of the morphology of these crystals. The surfaces of the SW-derived crystals exhibited irregular shapes based on the overlapping of multiple smaller crystalline structures on top of each other (affecting the dissolution rate as was explained previously), which leads to surface impurities trapped within the crystalline structure. In contrast, the USS-derived crystals displayed a uniform crystalline structure with a smoother surface, suggesting higher crystal purity, as there was no retention of impurities within the crystal structure. The higher purity of these crystals makes them more suitable as potential secondary raw materials for the fertiliser industry.
A comparative XRD analysis between the synthesised struvite and a reference pattern from the RRUFF database [27] is shown in Figure 3.
The struvite from SW and USS showed peaks at identical positions to the reference, confirming the successful formation of struvite. The variation in peak intensities observed between the reference struvite and the struvite precipitated in this study can be attributed to differences in crystal morphology (cross-shaped struvite crystals in the case of SW whereas and rod-shaped ones in the case of USS) that affects their orientation when deposited on the sample holder for XRD analysis [28].
In addition to the expected struvite peaks, both the SW and USS samples showed an intense peak at approximately 2θ ≈ 11.6°, which is not present in the reference. This peak was identified as brushite (CaHPO4·2H2O), a calcium phosphate phase commonly formed in streams with Ca presence [29].
For a deeper characterisation of the struvite, the IR spectra were compared with a synthetic struvite from the literature, identifying the main peaks (Figure 4) [30]. The peak around 884 cm−1 is associated with oscillation modes of ammonium. The peaks between 1000 cm−1 and 1100 cm−1 correspond to the antisymmetric vibration modes of the phosphate group. The peaks at 1434 cm−1, 1541 cm−1, and 1651 cm−1 are associated with the stretching and bending vibrations of the ammonium group (NH4+).
Looking at the results of the SW-derived struvite spectrum, most peaks are present. However, some of them are not as pronounced as the compared spectrum, particularly the peak at 884 cm−1: though present, it is significantly smaller than the reference struvite spectrum. Furthermore, some peaks are more pronounced than the reference, particularly around 1541 cm−1 and the broad peak around 2900 cm−1, where sharp peaks are found in the SW spectrum.
Regarding the USS-derived struvite spectrum, it follows a similar trend when compared to the reference struvite, though contrary to what happened with the SW, the peak at 884 cm−1 is well defined, while the broad peak at 2900 cm−1 can barely be seen.
When comparing all the spectra, it can be noticed that, although the three of them do not have matching peaks around 1100 cm−1, all are within the range reported for phosphate.
Regarding TGA (Figure 5a), a test for both struvite obtained was carried out up to 800 °C with an isotherm at 90 °C for 10 min, to obtain a representative characterisation of the products. Similar thermograms were obtained for struvite crystals obtained from both matrices when compared to those obtained in previous studies, such as [31], where struvite was obtained with Ca ions as interference in struvite crystallisation. In this case, as previous studies reported, the water and ammonium loss for both struvite is over 40% [32].
The DSC thermogram (Figure 5b) of the obtained struvite shows thermal behaviour similar to pure struvite, confirming the absence of impurities. A sharp endothermic peak at approximately 165–170 °C is observed for both samples, SW and USS, which is characteristic of the dehydration of crystalline struvite and corresponds to the release of its six molecules of water.

3.3. Crystallisation Kinetics

The crystallisation kinetics were assessed with the optimal ratios for both SW and USS (Figure 6). The time needed to achieve up to 98% phosphate reduction in SW was 450 min, resulting in a kinetic constant of 0.008 min−1 (R2 = 0.993). Meanwhile, for the case of USS, it needed 60 min to reduce phosphate content by up to 89%, reporting a kinetic constant of 0.110 min−1 (R2 = 0.983).
As mentioned above, the efficiency of phosphate reduction in struvite crystallisation systems is influenced by the SI. As the concentration decreases, the system’s SI also decreases, reducing the rate of nucleation and increasing the size of the crystals. However, kinetics are strongly influenced by the solids content. The higher solids concentration in SW (20.60 g kg−1) reduced the overall crystallisation velocity, inhibiting it even during the faster nucleation step. In contrast, the reduced content of these solids (13.29 g kg−1) in USS allowed a sharper decrease in phosphorus content at the beginning, which reduced as the phosphorous was depleted.
The morphological characteristics of the struvite obtained under the optimal molar ratio have already been discussed. These crystals were analysed using optical microscopy and SEM, confirming the typical cross and rod shapes of struvite from SW and USS, respectively. No significant morphological changes were observed during the kinetic experiments.

3.4. Substitution Potential of Synthetic Fertilisers

According to Eurostat and the Fertilizers Europe annual report, EU27 countries imported 5.1 million tonnes of nitrogen and 1.0 million tonnes of phosphorus in 2022 [33], underscoring Europe’s reliance on external inputs of nutrients. The recovery of nutrients from SW and USS can relieve this dependency on external trades, which is of relevance due to the current geopolitical situation.
In this study, the substitution potential of recovered struvite for synthetic fertilisers is calculated considering the feedstocks characteristics as representative of overall SW and USS. All assumptions and obtained results are shown in Table 4.
According to the results obtained in this study, more than 60,000 tonnes of P can be recovered from SW and up to 17,000 tonnes of P can be recovered from USS, representing a potential to substitute up to 6.5% phosphorus imports. The recovery of nitrogen reached up to 1.7% of European imports, but it is worth noting that in this study, only the nitrogen recovered by struvite crystallisation is considered, while the main technology used for nitrogen recovery from waste streams is stripping–scrubbing.
From an agronomic perspective, struvite presents several advantages compared to conventional fertilisers (e.g., triple superphosphate). Its low water solubility (0.02–0.03 g L−1 at 25 °C) results in a slow and controlled release of nutrients, particularly phosphorus and ammonium, which can reduce nutrient losses through leaching and runoff.
This property makes struvite especially suitable for crops with steady nutrient demands over time and in soils prone to phosphorus fixation, especially cereals. Moreover, studies have shown that struvite can be as effective as traditional fertilisers such as monoammonium phosphate or urea in terms of crop yield, while offering improved nutrient use efficiency and reduced environmental impact [36]. In addition, it is suitable for organic agriculture, and its recovery from SW waste and USS streams aligns with circular economy principles, contributing to more sustainable agricultural practices.

4. Conclusions

This study explored struvite crystallisation from SW and USS at varying phosphate–magnesium ratios (1:1, 1:2, and 1:3). Results showed optimal performance with ratios of 1:2 for SW and 1:1 for USS, based on crystal sizes for direct crystal use. At these ratios, phosphate recovery in SW was 97.74%, while in USS it was 88.91%, with varying struvite recovery efficiency (86% for SW and 57% for USS).
Crystallisation kinetic analyses were performed for the optimal ratios, revealing that crystallisation is inhibited in the presence of suspended solids, resulting in a slower crystallisation rate by using SW as feedstock, although it has a significantly higher initial concentration of all struvite components.
Struvite crystals were characterised using optical microscopy, SEM, FTIR, XRD, TGA, and DSC. After assessing the physicochemical properties of the obtained crystals, it could be confirmed that they were high-purity struvite crystals, although the initial concentration of ammonium, phosphate, and magnesium—and therefore the SI—play a fundamental role in the crystal structure and size.
Additionally, the effect of calcium as a competing ion was studied based on software simulation, proving that higher content ratios of calcium compared to phosphorous led to preferential crystallisation in the form of hydroxyapatite instead of struvite. Further research is needed to improve the struvite crystallisation ratio by using streams with high content on calcium, thus increasing the struvite recovery efficiency and its potential to substitute for imported nutrients.
Finally, the recovery of nutrients from SW and USS as struvite could reduce European nutrient imports by up to 6.5% for phosphorus and up to 1.7% for nitrogen. In this regard, it is essential to explore synergies between mineral fertilisers and microbial biostimulants to enhance phosphorus bioavailability by promoting hydroxyapatite solubility, thereby improving the import substitution potential.
Future research should explore the use of alternative magnesium sources, such as industrial by-products (desalination brines or steel slags from steel manufacturing industries, among others), to improve the cost-effectiveness and environmental sustainability of the process. Assessing the availability and potential impurities of these sources would be key to ensuring consistent high-quality struvite production. In addition, further studies focusing on the scale-up of the process and its integration into existing farms or wastewater treatment plants would be valuable to evaluate its technical and economic feasibility in relevant environments.

Author Contributions

R.R.-A. was responsible for conceptualisation, formal analysis, methodology, results, project management support, and writing and editing of the original draft. S.D.-V. contributed to the USS analytical work, experimentation, writing, and editing of the original draft. M.C.-S. contributed to the SW analytical work and experimentation. L.P.M. contributed to the literature search, writing, editing, and reviewing. C.A.S. was involved in conceptualisation and writing, editing, and reviewing, as well as project management and funding acquisition, X.Y. was responsible for conceptualisation and visualisation, writing, editing, and reviewing, as well as project coordination and funding acquisition. All authors have read and agreed to the published version of the manuscript.

Funding

This study was funded by the Circular Bio-Based Europe Joint Undertaking (CBE-JU) and its members in the framework of the research project ReLEAF (Recycling Locally Produced Bio-Wastes to Ensure Affordability and Availability of Innovative Bio-Based Fertilisers) [GA: 101156998]. This project also received funding from UKRI [GA 10127468] and the Swiss State Secretariat for Education, Research and Innovation (SERI) [Grant 24.00216, 101156998]. This study was also funded by the European Commission within the program HORIZON 2020 in the framework of the research project FERTIMANURE (Innovative nutrient recovery from secondary sources—Production of high-added value fertilisers from animal manure) [GA: 862849].

Institutional Review Board Statement

Not applicable.

Informed Consent Statement

Not applicable.

Data Availability Statement

The original contributions presented in this study are included in the article. Full dataset is available at 10.5281/zenodo.15781648.

Acknowledgments

The authors also thank Jarod Erreyes Pilozo and Lidia Rodríguez Rupérez for their support in experimentation tasks.

Conflicts of Interest

The authors declare no conflict of interest.

References

  1. Food and Agriculture Organization of the United Nations. World Fertilizer Trends and Outlook to 2020. 2020. Available online: https://www.fao.org/3/i6895e/i6895e.pdf (accessed on 9 March 2025).
  2. Robles, Á.; Aguado, D.; Barat, R.; Borrás, L.; Bouzas, A.; Giménez, J.B.; Martí, N.; Ribes, J.; Ruano, M.V.; Serralta, J.; et al. New frontiers from removal to recycling of nitrogen and phosphorus from wastewater in the Circular Economy. Bioresour. Technol. 2020, 300, 122673. [Google Scholar] [CrossRef] [PubMed]
  3. Cervantes, G.; Torres, L.G.; Ortega, M. Valorization of Agricultural Wastes and Biorefineries: A Way of Heading to Circular Economy. In Industrial Symbiosis for the Circular Economy; Salomone, R., Cecchin, A., Deutz, P., Raggi, A., Cutaia, L., Eds.; Strategies for Sustainability; Springer International Publishing: Cham, Switzerland, 2020; pp. 181–194. ISBN 978-3-030-36659-9. [Google Scholar] [CrossRef]
  4. Mahmud, K.; Panday, D.; Mergoum, A.; Missaoui, A. Nitrogen Losses and Potential Mitigation Strategies for a Sustainable Agroecosystem. Sustainability 2021, 13, 2400. [Google Scholar] [CrossRef]
  5. European Comission. Critical Raw Materials. Available online: https://single-market-economy.ec.europa.eu/sectors/raw-materials/areas-specific-interest/critical-raw-materials_en (accessed on 9 March 2025).
  6. Besen, M.R.; Ribeiro, R.H.; Bayer, C.; Piva, J.T. Nitrous oxide emissions from enhanced-efficiency nitrogen fertilizers applied to annual crops in a subtropical ecosystem. Nutr. Cycl. Agroecosyst. 2021, 121, 85–98. [Google Scholar] [CrossRef]
  7. Tyagi, J.; Ahmad, S.; Malik, M. Nitrogenous fertilizers: Impact on environment sustainability, mitigation strategies, and challenges. Int. J. Environ. Sci. Technol. 2022, 19, 11649–11672. [Google Scholar] [CrossRef]
  8. Buckwell, A.; Nadeu, E.; Six, L.; Van Keer, K.; Williams, A. Nutrient Recovery and Reuse (NRR) in European Agriculture. A Review of the Issues, Opportunities, and Actions; RISE Foundation: Brussels, Belgium, 2016. [Google Scholar]
  9. Rodríguez-Alegre, R.; Zapata-Jiménez, J.; You, X.; Pérez-Moya, M.; Sanchis, S.; García-Montaño, J. Nutrient recovery and valorisation from pig slurry liquid fraction with membrane technologies. Sci. Total Environ. 2023, 874, 162548. [Google Scholar] [CrossRef]
  10. Shi, S.; Tong, B.; Wang, X.; Luo, W.; Tan, M.; Wang, H.; Hou, Y. Recovery of nitrogen and phosphorus from livestock slurry with treatment technologies: A meta-analysis. Waste Manag. 2022, 144, 313–323. [Google Scholar] [CrossRef]
  11. Cucina, M.; De Nisi, P.; Sordi, S.; Adani, F. Sewage Sludge as N-Fertilizers for Crop Production Enabling the Circular Bioeconomy in Agriculture: A Challenge for the New EU Regulation 1009/2019. Sustainability 2021, 13, 13165. [Google Scholar] [CrossRef]
  12. Wu, H.; Vaneeckhaute, C. Nutrient recovery from wastewater: A review on the integrated Physicochemical technologies of ammonia stripping, adsorption and struvite precipitation. Chem. Eng. J. 2022, 433, 133664. [Google Scholar] [CrossRef]
  13. Lorick, D.; Macura, B.; Ahlström, M.; Grimvall, A.; Harder, R. Effectiveness of struvite precipitation and ammonia stripping for recovery of phosphorus and nitrogen from anaerobic digestate: A systematic review. Environ. Evid. 2020, 9, 27. [Google Scholar] [CrossRef]
  14. Rufí-Salís, M.; Brunnhofer, N.; Petit-Boix, A.; Gabarrell, X.; Guisasola, A.; Villalba, G. Can wastewater feed cities? Determining the feasibility and environmental burdens of struvite recovery and reuse for urban regions. Sci. Total Environ. 2020, 737, 139783. [Google Scholar] [CrossRef]
  15. Peeva, G.; Yemendzhiev, H.; Koleva, R.; Nenov, V. Agrotechnical Assessment of Struvite Application. JACEN 2021, 10, 213–221. [Google Scholar] [CrossRef]
  16. Pérez-Piqueres, A.; Ribó, M.; Rodríguez-Carretero, I.; Quiñones, A.; Canet, R. Struvite as a Sustainable Fertilizer in Mediterranean Soils. Agronomy 2023, 13, 1391. [Google Scholar] [CrossRef]
  17. Quan, J.; Qu, G.; Dong, Z.; Lu, P.; Cai, Y.; Wang, S. Potassium dichromate method of coal gasification the study of the typical organic compounds in water. IOP Conf. Ser. Earth Environ. Sci. 2017, 64, 012010. [Google Scholar] [CrossRef]
  18. Nagul, E.A.; McKelvie, I.D.; Worsfold, P.; Kolev, S.D. The molybdenum blue reaction for the determination of orthophosphate revisited: Opening the black box. Anal. Chim. Acta 2015, 890, 60–82. [Google Scholar] [CrossRef]
  19. Lin, K.; Li, P.; Wu, Q.; Feng, S.; Ma, J.; Yuan, D. Automated determination of ammonium in natural waters with reverse flow injection analysis based on the indophenol blue method with o-phenylphenol. Microchem. J. 2018, 138, 519–525. [Google Scholar] [CrossRef]
  20. McCallum, J.R. ANALYSIS FOR SMALL AMOUNTS OF CALCIUM, MAGNESIUM, BARIUM, AND SULPHATE USING PHTHALEIN PURPLE. Can. J. Chem. 1956, 34, 921–925. [Google Scholar] [CrossRef]
  21. Zin, M.M.T.; Tiwari, D.; Kim, D.-J. Maximizing ammonium and phosphate recovery from food wastewater and incinerated sewage sludge ash by optimal Mg dose with RSM. J. Ind. Eng. Chem. 2020, 86, 136–143. [Google Scholar] [CrossRef]
  22. Ye, X.; Ye, Z.-L.; Lou, Y.; Pan, S.; Wang, X.; Wang, M.K.; Chen, S. A comprehensive understanding of saturation index and upflow velocity in a pilot-scale fluidized bed reactor for struvite recovery from swine wastewater. Powder Technol. 2016, 295, 16–26. [Google Scholar] [CrossRef]
  23. Bayuseno, A.P.; Perwitasari, D.S.; Muryanto, S.; Tauviqirrahman, M.; Jamari, J. Kinetics and morphological characteristics of struvite (MgNH4PO4.6H2O) under the influence of maleic acid. Heliyon 2020, 6, e03533. [Google Scholar] [CrossRef]
  24. Papangelou, A.; Mathijs, E. Assessing agro-food system circularity using nutrient flows and budgets. J. Environ. Manag. 2021, 288, 112383. [Google Scholar] [CrossRef]
  25. Preisner, M.; Smol, M.; Horttanainen, M.; Deviatkin, I.; Havukainen, J.; Klavins, M.; Ozola-Davidane, R.; Kruopienė, J.; Szatkowska, B.; Appels, L.; et al. Indicators for resource recovery monitoring within the circular economy model implementation in the wastewater sector. J. Environ. Manag. 2022, 304, 114261. [Google Scholar] [CrossRef] [PubMed]
  26. Mehta, C.M.; Batstone, D.J. Nucleation and growth kinetics of struvite crystallization. Water Res. 2013, 47, 2890–2900. [Google Scholar] [CrossRef] [PubMed]
  27. Lafuente, B.; Downs, R.T.; Yang, H.; Stone, N. The Power of Databases: The RRUFF Project. 2015. Available online: https://rruff.info/ (accessed on 9 March 2025).
  28. Kleeberg, R.; Monecke, T.; Hillier, S. Preferred orientation of mineral grains in sample mounts for quantitative XRD measurements: How random are powder samples? Clays Clay Min. 2008, 56, 404–415. [Google Scholar] [CrossRef]
  29. Alotibi, S.; Alshaaer, M. The Effect of Full-Scale Exchange of Ca2+ with Co2+ Ions on the Crystal Structure and Phase Composition of CaHPO4·2H2O. Crystals 2023, 13, 941. [Google Scholar] [CrossRef]
  30. Bindhu, B.; Swetha, A.S.; Veluraja, K. Studies on the effect of phyllanthus emblica extract on the growth of urinary type struvite crystals invitro. Clin. Phytosci. 2015, 1, 3. [Google Scholar] [CrossRef]
  31. Acelas, N.Y.; Flórez, E.; López, D. Phosphorus recovery through struvite precipitation from wastewater: Effect of the competitive ions. Desalination Water Treat. 2015, 54, 2468–2479. [Google Scholar] [CrossRef]
  32. Hövelmann, J.; Stawski, T.M.; Besselink, R.; Freeman, H.M.; Dietmann, K.M.; Mayanna, S.; Pauw, B.R.; Benning, L.G. A template-free and low temperature method for the synthesis of mesoporous magnesium phosphate with uniform pore structure and high surface area. Nanoscale 2019, 11, 6939–6951. [Google Scholar] [CrossRef]
  33. Fertilizers Europe. Fertilizer Industry. Facts & Figures 2023. 2023. Available online: https://www.fertilizerseurope.com/wp-content/uploads/2023/07/Industry-Facts-and-figures-2023.pdf (accessed on 9 March 2025).
  34. Köninger, J.; Lugato, E.; Panagos, P.; Kochupillai, M.; Orgiazzi, A.; Briones, M.J. Manure management and soil biodiversity: Towards more sustainable food systems in the EU. Agric. Syst. 2021, 194, 103251. [Google Scholar] [CrossRef]
  35. Eurostat. Sewage Sludge Production and Disposal. European Data. Available online: https://data.europa.eu/data/datasets/g1a4auwbnkfrmzm3dg6zg?locale=en (accessed on 9 March 2025).
  36. De Sousa, R.N.; Alleoni, L.R.F. Performance of Struvite and Organomineral Fertilizers Compared to Traditional Source of Phosphorus in Maize Cultivation on Tropical Soils. J. Soil. Sci. Plant Nutr. 2024, 24, 5250–5271. [Google Scholar] [CrossRef]
Figure 1. Optical microscope view of struvite crystals from SW and USS for the studied PO43−:Mg2+ ratios.
Sustainability 17 06080 g001
Figure 2. SEM view of struvite crystals from SW and USS for the studied optimal ratios.
Sustainability 17 06080 g002
Figure 3. XDR diffractogram from struvite obtained in this study from SW (yellow) and USS (green), and a reference struvite (red) obtained from the RRUFF database [27].
Sustainability 17 06080 g003
Figure 4. IR spectrum obtained from struvite analysis obtained in this study for SW (yellow) and USS (green), and a reference struvite (red) obtained from the RRUFF database [27].
Sustainability 17 06080 g004
Figure 5. (a) TGA spectrum obtained from struvite analysis obtained in this study for SW (yellow) and USS (green), and temperature gradient (red). (b) DSC spectrum for SW (yellow) and USS (green).
Sustainability 17 06080 g005
Figure 6. Struvite formation kinetics for SW (yellow) and USS (green) with the optimal ratios determined previously.
Sustainability 17 06080 g006
Table 1. SW and USS initial characterisation.
ParameterUnitSWUSS
pH-7.02 ± 0.407.20 ± 0.37
NH4+mg L−13496.03 ± 10.60483.00 ± 1.41
PO43−mg L−1844.23 ± 16.2787.05 ± 0.25
Mg2+mg L−1719.43 ± 3.4837.750 ± 0.32
Ca2+mg L−1251.80 ± 15.1179.63 ± 1.59
Solids contentg kg−120.60 ± 1.7313.29 ± 0.65
Table 2. Calculated SI for all assessed conditions.
SWUSS
Molar ratioFeed1:11:21:3Feed1:11:21:3
SI9.839.8310.8711.046.897.017.207.32
Table 3. Chemical composition of the supernatant obtained from struvite crystallisation in the different treated streams.
Molar Ratio
PO43−:Mg2+
Parameter
N-NH4+
mg L−1
(mol L−1)
P-PO43−
mg L−1
(mol L−1)
Mg2+
mg L−1
(mol L−1)
P Recovery
%
SWFeed3496.03 ± 10.60
(0.25 ± 7.57 × 10⁻⁴)
844.23 ± 16.27
(2.72·10−2 ± 5.25 × 10⁻⁴)
719.43 ± 3.48
(2.96·10−2 ± 1.43 × 10⁻⁴)
-
Supernatant 1:12869.02 ± 16.61
(0.20 ± 1.17 × 10⁻³)
22.06 ± 0.53
(7.12·10−4 ± 1.70 × 10⁻⁵)
350.67 ± 8.10
(1.44·10−2 ± 3.33 × 10⁻⁴)
97.50 ± 2.40
Supernatant 1:22744.62 ± 8.25
(0.19 ± 5.88 × 10⁻⁴)
19.99 ± 0.08
(6.45·10−4 ± 2.51 × 10⁻⁶)
562.41 ± 9.28
(2.31·10−2 ± 3.82 × 10⁻⁴)
97.74 ± 0.40
Supernatant 1:32777.05 ± 19.21
(0.19 ± 1.37 × 10⁻³)
30.76 ± 0.39
(9.93·10−4 ± 1.24 × 10⁻⁵)
1049.94 ± 16.62
(4.32·10−2 ± 6.84 × 10⁻⁴)
96.52 ± 1.27
USSFeed483.00 ± 1.41
(3.45·10−2 ± 1.01 × 10⁻⁴)
87.05 ± 0.25
(2.81·10−3 ± 7.99 × 10⁻⁶)
37.750 ± 0.32
(1.31·10−2 ± 1.31 × 10⁻⁵)
-
Supernatant 1:1419.25 ± 1.24
(2.99·10−2 ± 8.83 × 10⁻⁵)
9.65 ± 0.07
(6.36·10−4 ± 2.06 × 10⁻⁵)
19.76 ± 0.39
(8.13·10−4 ± 1.60 × 10⁻⁵)
88.91 ± 0.73
Supernatant 1:2386.25 ± 1.24
(2.76·10−2 ± 8.83 × 10⁻⁵)
5.05 ± 0.02
(1.63·10−4 ± 6.85 × 10⁻⁷)
33.57 ± 0.04
(1.38·10−3 ± 1.60 × 10⁻⁶)
94.20 ± 0.40
Supernatant 1:3374.00 ± 2.48
(2.67·10−2 ± 1.77 × 10⁻⁴)
2.88 ± 0.03
(9.28·10−5 ± 7.99 × 10⁻⁷)
63.56 ± 0.06
(2.62·10−3 ± 2.33 × 10⁻⁶)
96.69 ± 1.04
Table 4. Assumptions and results regarding the substitution potential of recovered struvite. Annual production data obtained from [34,35].
ParameterSWUSS
Annual wastewater production (Mt y−1)216.0870.0
Struvite recovery efficiency (%)86.057.0
Recovered P (kt y−1)64.516.8
Recovered N (kt y−1)23.16.0
Disclaimer/Publisher’s Note: The statements, opinions and data contained in all publications are solely those of the individual author(s) and contributor(s) and not of MDPI and/or the editor(s). MDPI and/or the editor(s) disclaim responsibility for any injury to people or property resulting from any ideas, methods, instructions or products referred to in the content.

