Article

Determination of the Main Factors Influencing the Chemical Composition of Atmospheric Deposition in the Territory of the Southern Baikal Region (Eastern Siberia, Russia)

by
Yelena Molozhnikova
1,*,
Maxim Shikhovtsev
1,*,
Viktor Kalinchuk
2,
Olga Netsvetaeva
1 and
Tamara Khodzher
1
1
Limnological Institute, Siberian Branch Russian Academy of Sciences, Ulan-Batorskaya Street 3, Irkutsk 664033, Russia
2
V.I. Il’ichev Pacific Oceanological Institute, Far Eastern Branch of Russian Academy of Sciences, Baltiyskaya Street 43, Vladivostok 690041, Russia
*
Authors to whom correspondence should be addressed.
Sustainability 2025, 17(13), 6062; https://doi.org/10.3390/su17136062
Submission received: 16 May 2025 / Revised: 25 June 2025 / Accepted: 30 June 2025 / Published: 2 July 2025

Abstract

In this study, a large portion of data on the chemical composition of precipitation falling in the South Baikal region shows the main factors determining their formation in 2017–2024. Taking into account the high variability of meteorological conditions in the region, both in time and in space, a method of observing the chemical composition of atmospheric precipitation has been developed, which makes it possible to determine its composition depending on the conditions of air mass formation. Using statistical analysis, marker substances characterizing the main groups of sources influencing the composition of atmospheric precipitation were identified. Joint analysis of air mass trajectories and data on chemical composition of precipitation allowed for establishing the areas of location of potential sources of precipitation pollution. All precipitation events were categorized based on the similarity of air mass formation conditions and chemical composition. Precipitation composition data collected on the shores of Lake Baikal reflect the influence of different types of pollutants such as industrial emissions, motor vehicles, dust storms, and forest fires. The results of the study are relevant for air quality assessment in the region and demonstrate the potential of using precipitation chemistry data to understand the long-range transport of pollutants, which contributes to sustainable development by increasing the availability of air quality data in ecologically significant regions such as Lake Baikal.

1. Introduction

Atmospheric precipitation is a key aspect of the Earth’s climate system. It plays a central role in the global water and energy cycle, linking clouds, water vapor, atmospheric processes, and circulation processes occurring on land and ocean surfaces. The accurate and timely understanding of precipitation characteristics at regional and global scales is essential for both numerical weather forecasting and freshwater resource management [1,2,3]. The amount of impurities in the air that come into rainwater or snow depends on the height of the clouds from which the precipitation falls and the time that has elapsed since it formed. Chemical analysis of atmospheric precipitation is one of the main elements of environmental monitoring. Atmospheric precipitation acts as a reliable indicator to determine the level of atmospheric pollution and identify the sources of these substances [4,5,6,7,8,9]. Precipitation effectively removes gas and aerosol impurities from the atmosphere through the process of intracloud and sub-cloud washout, contributing to air purification. However, it can also have a negative impact on the environment.
Over the past fifty years, a considerable amount of data has been accumulated to show that regular precipitation containing pollutants has long-term environmental impacts. Plants and aquatic ecosystems are primarily affected [10,11,12,13,14,15]. At an inflow of atmospheric precipitation with low pH value into water bodies (<4.5) [16], there are changes in the physical and chemical properties of water, which deteriorate its quality and make it unsuitable for aquatic life [17,18]. Atmospheric precipitation can damage plant leaves, reducing their ability to photosynthesize and increasing the likelihood of disease and fungal infections, which can lead to reduced forest productivity and forest mortality [19,20,21]. Acid precipitation can dissolve calcium and magnesium needed to maintain soil fertility and can release aluminum from the soil, which becomes toxic to plants and can inhibit their growth [22,23]. Soil degradation leads to a decline in soil organisms, which, in turn, affects ecosystems that depend on healthy soil. In addition, acid precipitation has a negative impact on the urban environment. It causes the destruction of architectural monuments, corrosion of building elements, and damage to cars [24,25]. The problems listed above are the basis for the negative environmental impacts produced by polluted precipitation.
In the Baikal region, atmospheric precipitation forms the river runoff of the lake and is one of the main sources of dissolved substances. According to the data up to 2005, the share of atmospheric precipitation in the incoming part of the chemical balance of Baikal was up to 6% [26]. In recent decades, an increase in the acidity of atmospheric precipitation has been noted in the Baikal region [27], which may contribute to the transition of insoluble metal compounds into the dissolved state and increase their potential threat to flora and fauna, both to the ecosystem of the lake itself and its coastal areas. Thus, in the Baikal Biosphere Reserve, located on the eastern coast of South Baikal, as a result of acid precipitation, the growth suppression of coniferous forests on the Khamar-Daban mountain range was observed [28,29,30]. As a result of some studies [31,32], it was revealed that in the chemical composition of atmospheric precipitation in the region, there had been a decrease in the total content of alkaline components, with an increase in the proportion of acidic components, which had an impact on the chemical composition of rivers on the eastern coast of South Baikal. Precipitation with increased nitrogen content was one of the key factors contributing to the massive development of the subglacial dinoflagellate community Gymnodinium baicalense var. minor Antipova in Larch Bay (South Baikal) in 2018 [33]. In July 2019, a massive proliferation of cyanobacteria occurred after four days of nitrogen- and phosphorus-enriched rainstorms [34]. In June 2022, fecal indicator bacteria increased in the same area due to heavy rainfall [35].
Since there are practically no large anthropogenic sources on the lake shore, it is very important to identify the role of local and remote sources on the composition of atmospheric deposition. At present, there are several ways to utilize the accumulated knowledge about the chemical composition of atmospheric precipitation to solve environmental problems. One of them is the identification of sources of pollutants entering the region with atmospheric precipitation. The chemical composition of precipitation not only reflects the impact of human activity on the environment in a particular place but also indicates the process of long-range transport of pollutants. The composition of atmospheric deposition varies from region to region due to differences in synoptic and meteorological conditions, as well as geographical features [36]. Toxic substances generated over cities are known to be transported over long distances with air masses. Their concentrations decrease over time due to the dispersion of pollutants, and they eventually reach the underlying surface with precipitation. Precipitation composition helps to understand the relative contributions of different sources of atmospheric pollutants. Therefore, the study of the chemical composition of atmospheric precipitation and the establishment of concentrations of individual elements in it served as a foundation for the development of a methodology that allows for identifying groups of natural and anthropogenic sources involved in its formation. The fact that Lake Baikal, a unique natural site of the UNESCO World Heritage Site, which is of strategic importance as the largest source of drinking water on Earth, is located in the study area makes this work particularly relevant.
The purpose of this work is to identify the key factors determining the formation of the chemical composition of precipitation falling on the coast and in the water area of South Baikal in the modern period. The results obtained in this work on the composition of atmospheric precipitation give an idea of the transfer of impurities from different sources to the study area and allow for characterizing the quality of the air basin in this unique natural object of the Earth.

2. Study Area

The study area is located in the center of Asia (70–110° E longitude, 45–65° N latitude). The Central Ecological Zone (CEZ) of South Baikal was chosen as the object of the study. The research focuses on investigating the chemical composition of atmospheric precipitation during the observation period from 2017 to 2024. The choice of the observation area was justified by the fact that in this area, it was possible to study not only natural climatic factors but also areas with unfavorable environmental conditions for the composition of atmospheric deposition. Additionally, here it is possible to assess the role of the transboundary transfer of pollutants from neighboring regions to Lake Baikal. A significant influence on the formation and distribution of precipitation in the territory under consideration is exerted by the relief, complexity, and variety of altitudes of which lead to the fact that precipitation here is distributed extremely unevenly, from 200 mm/year on the western coast in Middle Baikal to 1400 mm/year on the slopes of the Khamar-Daban ridge in South Baikal. Precipitation falling on the water area of the lake itself ranges from 200 to 500 mm/year [37]. The predominant proportion of precipitation (from 70–80% on the slopes of coastal mountains and up to 80–90% on the coast and lake mirror) falls from April to October, with a maximum in July (up to 30% of the annual amount) (Figure 1). In winter, the amount of precipitation is minimal (from 5 to 20% of the annual amount), which is due to the significant influence of the Siberian anticyclone [38].
Sampling of atmospheric precipitation was carried out at three atmospheric monitoring stations in the Central Ecological Zone of South Baikal. On the western coast of the lake, sampling was carried out at the Listvyanka station (51.8467° N, 104.8930° E), and on the eastern coast, at the Baikalskaya station (51.6439° N, 105.5236° E) and the Tankhoy station (51.5632° N, 105.1353° E). All sampling stations are located in the direction of the main air mass transport from major anthropogenic sources of the Irkutsk Region and the Republic of Buryatia. The Listvyanka station is located on the top of the coastal hill, 205 m above the lake level and 656 m above sea level. Such a location of the station makes it possible to avoid the influence of local sources of atmospheric pollution (Listvyanka settlement) and to monitor regional and global pollution transports. The pipe heights of major sources of atmospheric pollution in the region vary from 80 to 250 m. The height of the flare can reach heights of more than 500 m above ground level [40]. For example, studies have shown that the transport of sulfur and nitrogen oxides over long distances to Lake Baikal is so significant that sometimes the Listvyanka monitoring station records exceedances of the average daily maximum permissible concentrations of these pollutants [41,42].
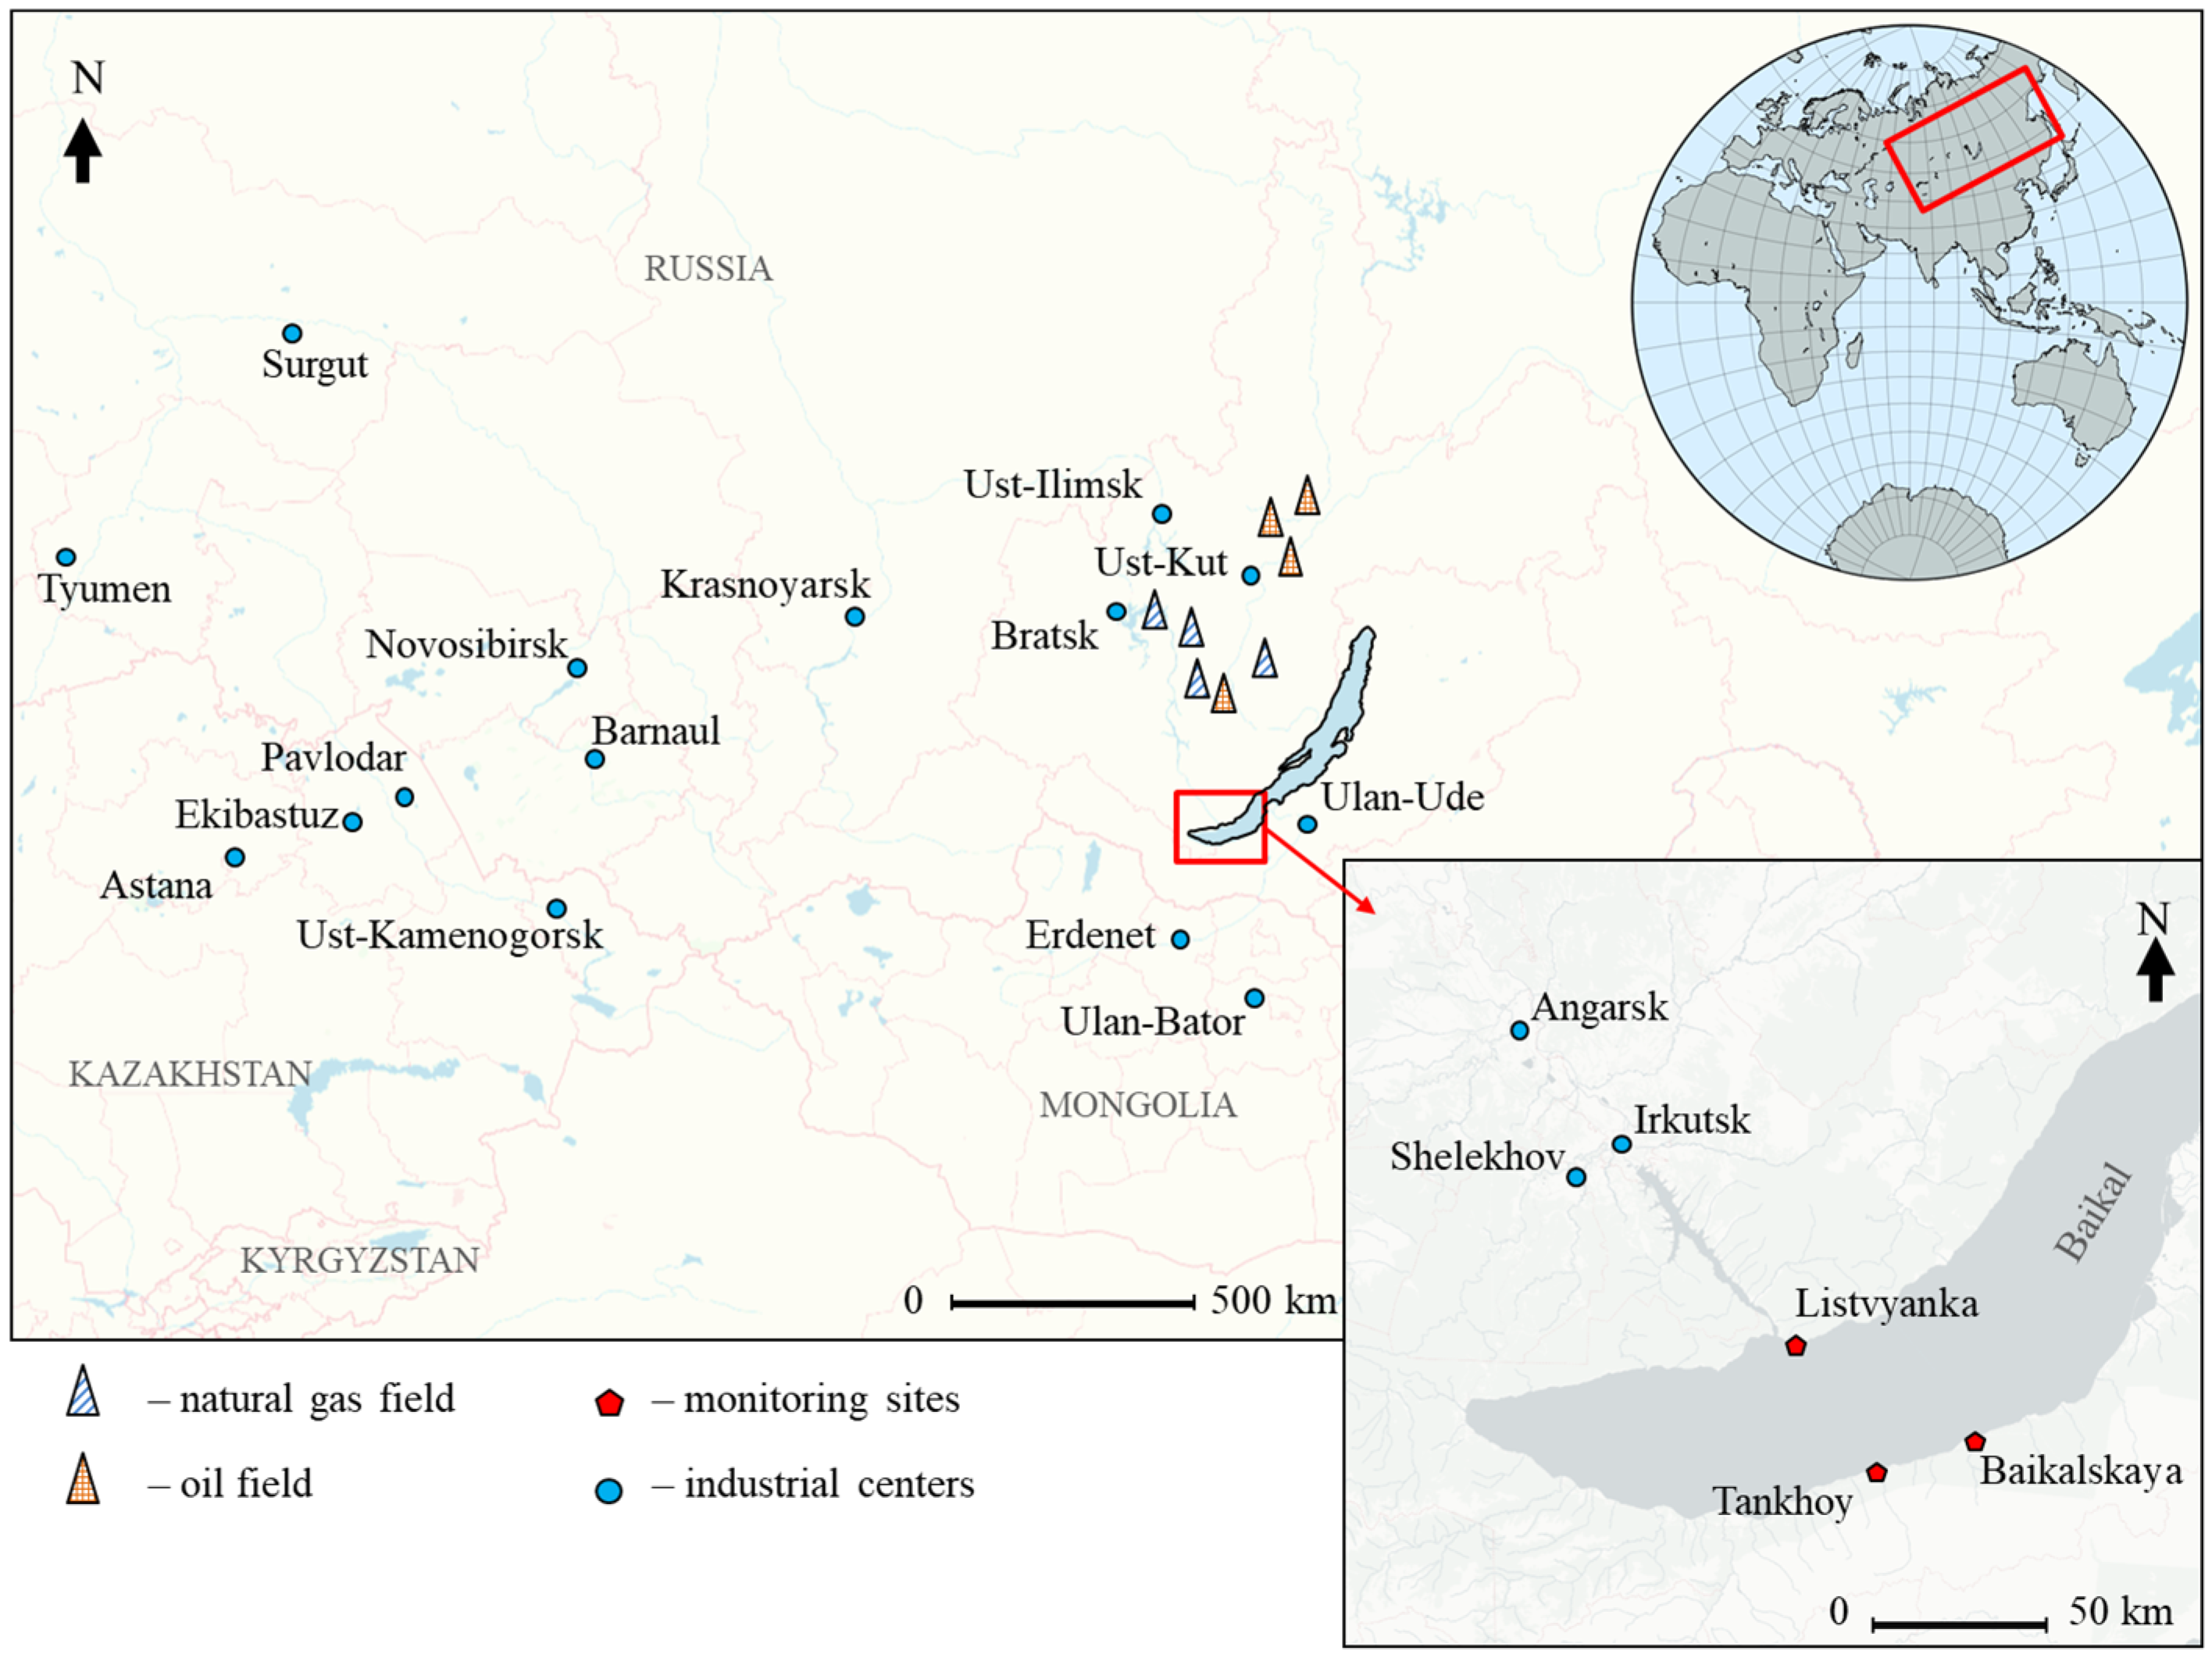
The Baikalskaya station is located in the northern foothills of the Khamar-Daban range on the shore of Lake Baikal near the mouth of the Mishikha River (458 m above sea level). The Tankhoy station is located in a small settlement on the lake shore 20 m from the water’s edge, away from residential objects, and is little affected by local sources (455 m above sea level). The location of the observation stations, the largest stationary sources of atmospheric pollution, and a map-scheme of the study area are presented in Figure 2.

3. Methodological Approach

Traditionally, trajectory and factor analysis methods are used to identify sources of pollutants entering the receptor region with atmospheric precipitation [43]. The composition of atmospheric deposition is known to be influenced by the local background, the region of formation of the air mass that brought the precipitation, and synoptic conditions [44]. In this article, we conducted a study to determine the key factors that influenced the chemical composition of precipitation that fell on the coast and water area of South Baikal, as well as to identify a group of sources of pollutants entering the region. The study was conducted in three stages. At the first stage, we collected samples of atmospheric precipitation on the western and eastern coasts of South Baikal (Figure 2) and analyzed their chemical composition. At the second stage, methods of statistical data processing were used to identify natural and anthropogenic groups of sources affecting the chemical composition of atmospheric deposition, and “tracer substances” were selected. At the third stage, the concentration-weighted trajectory (CWT) method was applied to quantitatively and spatially assess the contribution of the region of air mass formation to the chemical composition of atmospheric precipitation. The CWT analysis was used to determine the location of remote sources of analyzed pollutants.
Chemical composition of precipitation. Precipitation (rain) was collected by automatic precipitation collectors US-320 (Japan) in the warm season, and in plastic containers (snow) in the cold season. Sampling was carried out at each event, according to the recommendations for the organization of EANET monitoring stations. Chemical analyses were performed in the accredited laboratory of hydrochemistry and atmospheric chemistry of the Limnological Institute of the Siberian Branch of the Russian Academy of Sciences according to the methods recommended in the atmospheric monitoring networks of international programs—EMEP [45] and EANET [46]. The chemical composition of precipitation was determined using an ICS-3000 ionic system (Dionex, Sunnyvale, CA, USA) (SO42−, NO3, Cl, Na+, NH4+, K+) and ContrAA800 (Analytik Jena AG, Jena, Germany) (Mg2+, Ca2+) with an accuracy of up to 2–6%. In precipitation, pH and specific electrical conductance were determined using a pH meter “pH-Expert” (Econix Expert, Moscow, Russia) with an accuracy of ±0.01 pH and a conductometer DS-12 (Horiba, Kyoto, Japan) with an accuracy of ±1%. The application of modern methods of analysis and equipment and annual participation in international comparison tests (ICI) under the EANET, EMEP, and WMO programs allowed us to obtain measurement results at a confidence probability p = 0.95 with an accuracy of up to 4%.
Statistical analysis. The determination of natural and anthropogenic groups of sources influencing the chemical composition of atmospheric precipitation, as well as the selection of “tracer substances”, was carried out using methods of statistical data processing. The calculation of factor loadings and selection of “tracer substances” was carried out using the software RStudio v. 4.3.0 [47]. To perform factor analysis, the functions of the basic package of STATS—prcomp, factanal—were used in this work.
Analytical techniques for identifying potential sources of contamination. Two key approaches were used to identify the relationship between changes in precipitation pollutant concentrations and the region of air mass formation: trajectory analysis and concentration-weighted trajectory analysis. These methods made it possible to study in detail the influence of various sources on the chemical composition of precipitation deposited in the territory of South Baikal.
Trajectory analysis: The HYSPLIT hybrid single-particle Lagrangian model developed by the National Oceanic and Atmospheric Administration was used to simulate air mass trajectories (NOAA) [48,49,50]; 72 h back trajectories based on archived GDAS1 meteorological data with a horizontal resolution of 1° were modeled. This method allows for tracking the path of air masses bringing atmospheric precipitation to the observation station, which helps to identify possible sources of pollution.
Concentration-weighted trajectory analysis. CWT analysis is used to estimate the weighted average pollutant concentration as a function of the residence time of air masses in each grid cell [51,52]. The study area was divided into a 0.5° × 0.5° grid. The formula for calculating the weighted average concentration in each grid cell (Cij) is as follows:
C i j = k k = 1 N τ i j k k = 1 N C k × τ i j k ,
where Cij—weighted average concentration in a grid cell, (i,j)th, k—trajectory index, N—total number of trajectories, Ck—measured pollutant concentration detected during import of the trajectory k, and τijk—trajectory stay time corresponding to the day of sampling in the (i,j)th cell. Using this algorithm [53] made it possible to identify significant source areas for such components as SO42−, Ca2+, Cl, HCO3, K+, Na+, and NO3, which are marker substances for different types of pollution sources.
Identifying the role of wildfires. To analyze the impact of forest fires on the chemical composition of atmospheric precipitation, data on the number of fire centers were obtained with the help of systems of Fire Information for Resource Management System (FIRMS) and Global Forest Watch (GFW (https://firms.modaps.eosdis.nasa.gov, accessed on 29 June 2025)).

4. Results

4.1. Chemical Composition of Precipitation

To study the role of local sources and long-range transport in the formation of the chemical composition of atmospheric deposition in the South Baikal region, 558 samples of atmospheric precipitation were collected and analyzed. Of these, 309 were collected on the western coast: Listvyanka station (2017–2022), 249; and on the eastern coast: Baikalskaya station (from May to October 2017–2022) and Tankhoy station (2023–2024).
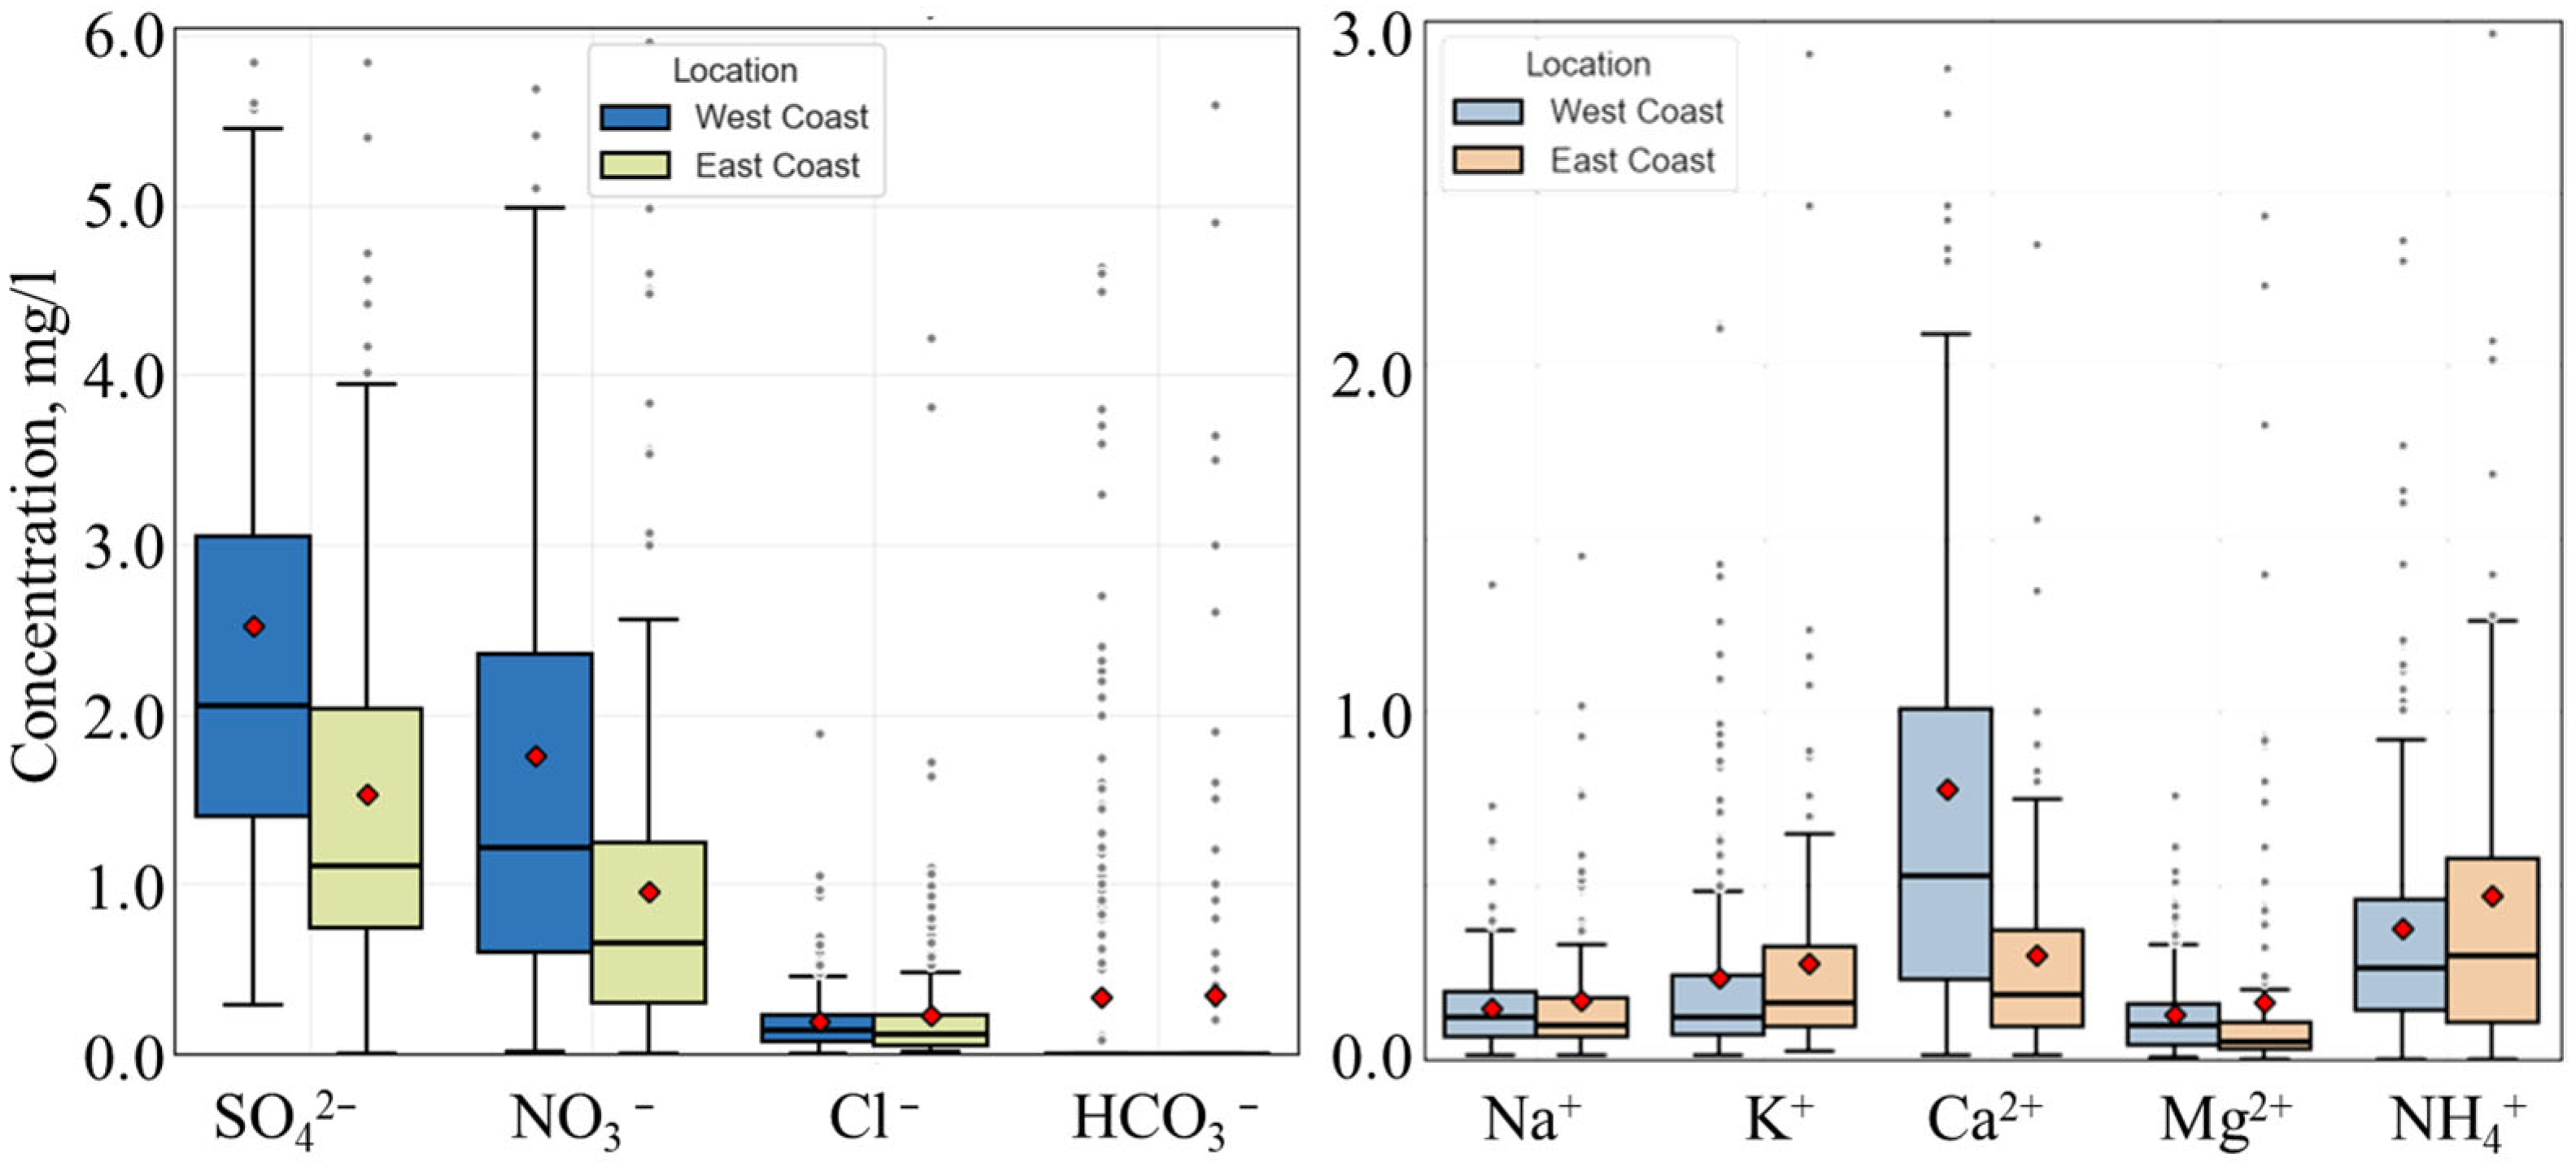
On the basis of the results of the chemical analysis of atmospheric precipitation samples, boxplots were constructed (Figure 3). The graph shows the median of the distribution of major ion concentrations, the first (lower boundary of the “box”) and third quartile (upper boundary), atypical values beyond one and a half times the product of the difference between Q3 and Q1 (gray dots), and the arithmetic mean (red dots). As can be seen from Figure 3, the chemical composition of atmospheric precipitation at the coast of South Baikal was subject to significant variability. This allowed us to make an assumption that the composition of atmospheric precipitation was influenced by different groups of sources, including the local background, as well as sources located in other territories. Figure 3 shows that the median and mean values of concentrations of almost all ions in precipitation on the west coast over the entire observation period were two to two and a half times higher than on the east coast, which is quite natural, given the closer location of regional industrial centers to this area (Figure 2). The exceptions were potassium, ammonium, and hydrogen carbonate ions, whose concentrations on the east coast were slightly higher than on the west coast. For both coasts, sulfates and nitrates were determinant among anions. Whereas cations on the west coast were dominated by calcium and ammonium, on the east coast, they were dominated by ammonium and, to a lesser extent, potassium and calcium.

4.2. Selection of Tracer Substances

The determination of groups of sources influencing the chemical composition of atmospheric deposition was carried out in two steps. The first one is an inventory of all possible natural and anthropogenic sources of aerosols in the studied region [54]. The second—by means of methods of statistical processing of data of atmospheric deposition samples [55], is the determination of natural and anthropogenic groups of sources influencing the chemical composition of atmospheric deposition and the selection of tracer substances.
Eastern Siberia is one of the key industrial regions of Russia, where a variety of industries with characteristic tracers are located: power engineering (SO42−, NO3, NH4+) [56,57], steel works (NO3, SO42−) [58], cement manufacture (Ca2+, Mg2+, HCO3) [59], mining industry (Ca2+, Mg2+, SiO2), chemical and petrochemical industries (NH4+, Cl) [60], wood burning (Br, K+), and motor transport (NO3, CO, Na+, Cl) [61]. In addition to industry, natural sources influenced the composition of precipitation in the Southern Pribaikalie. The main natural sources of aerosol and their tracers in the region are dust storms and soil dusting (Ca2+, Mg2+, HCO3, Cl, K+); wildfires (K+, NH4+, SO42−, NO3) [62]; vegetation (NH4+) [63]; marine aerosols, less significant for Eastern Siberia (Br, Na+, Cl) [64,65]; and volcanic activity (SO42−) [66]. The tracers listed above allow for the effective identification of natural and anthropogenic sources of pollution and the identification of the main ones that have influenced the chemical composition of atmospheric precipitation in the study area.
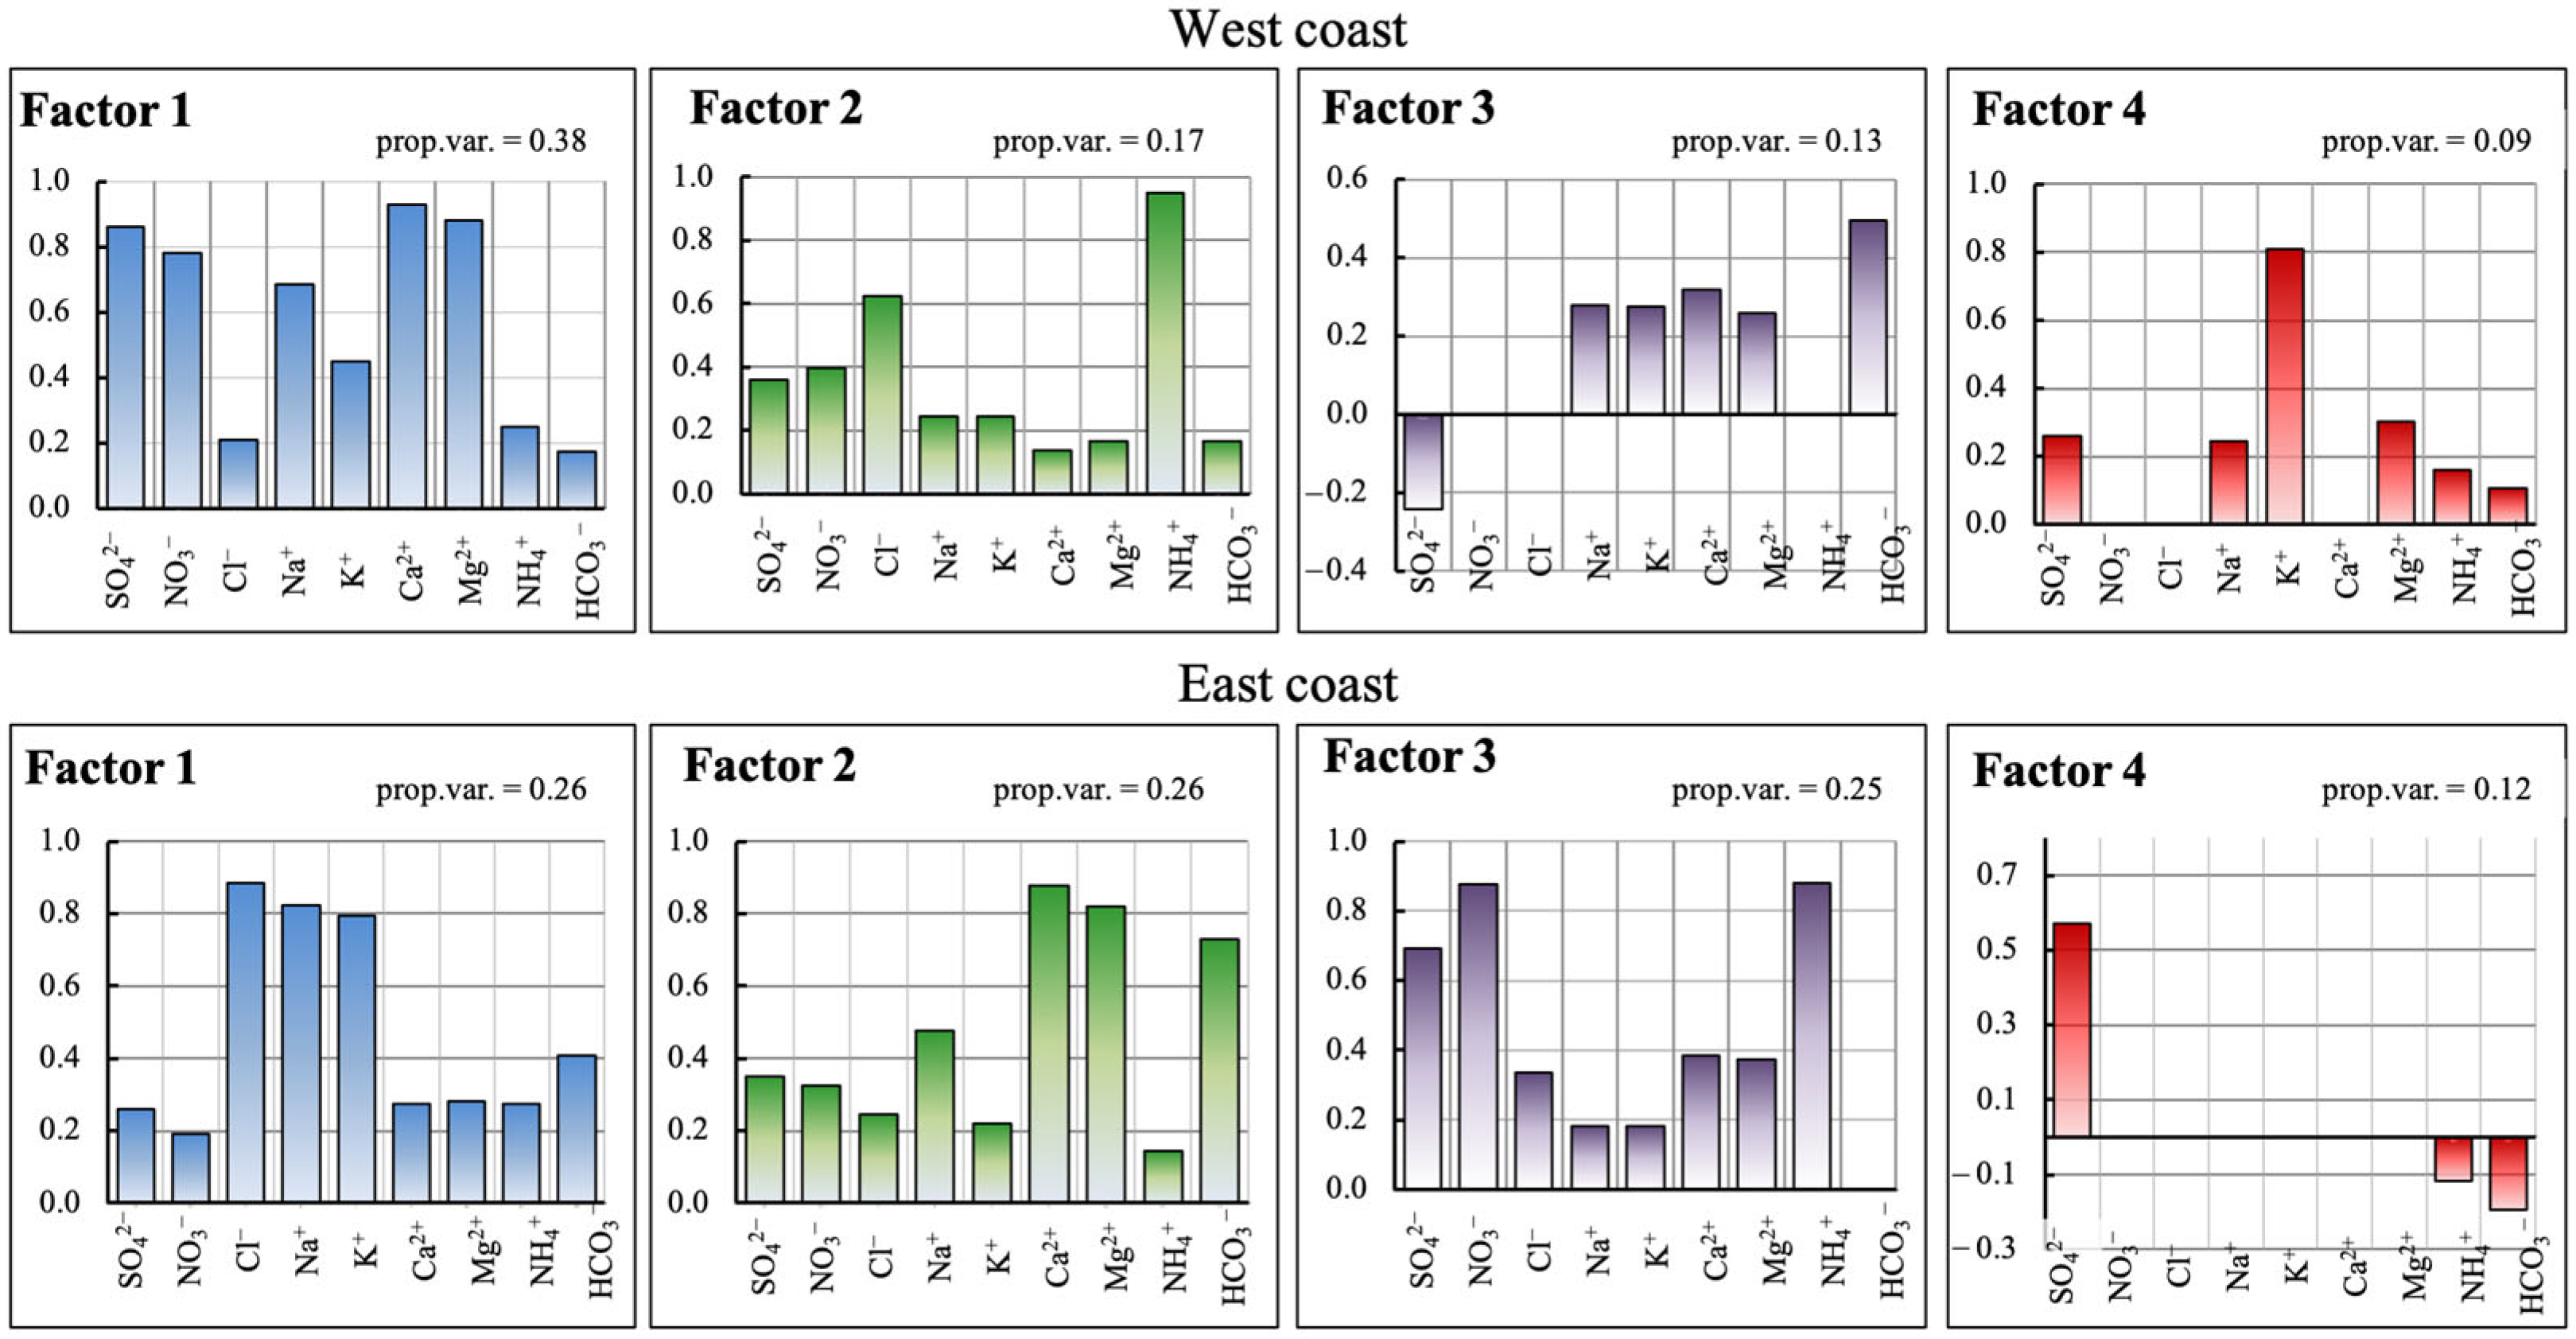
When interpreting the results of precipitation chemical composition, all selected samples were divided into two groups: precipitation falling on the western coast (Listvyanka station) and precipitation of the eastern coast (Tanhoy and Baikalskaya stations). When interpreting the results of precipitation composition in each group, four main factors were selected, the total contribution of which was about 70% of the total variance of the initial data. The results of the statistical analysis are presented in Figure 4. For each factor, the load, which determines the intensity of the relationship between the factor and the components, is shown.
West coast (Listvyanka station). The evaluation of factor loadings based on the ionic composition of precipitation sampled on the west coast is shown in Figure 4. The factor including ions was allocated first to SO42−, NO3, Ca2+, Mg2+, and, to a lesser extent, Na+. Since one of the main sources of SO42− in the atmosphere is the combustion of organic fuel by heat power facilities, we can attribute the first factor to anthropogenic sources. Besides SO42−, ions of Ca2+ and Mg2+ are present in the first factor, indicating the relatively close proximity of coal-burning sources [67]. In the second factor, the ion of NH4+ was released and, to a lesser extent, Cl, which can be associated with the influence of the local natural background. For the third factor, the highest load is observed for HCO3. The ion of HCO3 may be formed as a result of the atmospheric oxidation of CO2, and it could also be included in precipitation through aeolian weathering. In the fourth factor, the ion of K+ was released—a biomass combustion tracer. This tracer may indicate both wood burning from stove heating and the effects of wildfires [68]. Since the largest wildfires were observed in the Siberian region during the period under consideration, it can be assumed that they were the source of K+ in atmospheric deposition on the western shore of the lake [69].
East coast (stations Tankhoy and Baikalskaya). The first factor (Figure 4) was characterized by high positive loadings for Cl, K+, and Na+. As noted earlier, K+ is an indicator of biomass combustion. Emissions from internal combustion engines running on gasoline may contain Na+, diesel engines—Cl, and the use of salt for de-icing in wintertime additionally increases the concentration of these elements in the air. Therefore, it can be assumed that the composition of atmospheric precipitation was most influenced by the local anthropogenic background since there is a settlement with wood stove heating and a large automobile highway near the precipitation sampling stations. The second factor, with loads of Ca2+, Mg2+, and HCO3, is related to the influence of the soil component. Most often, this factor is connected with atmospheric precipitation formed over the territories of Kazakhstan and Mongolia. The third factor, with loads of NO3, NH4+, and SO42−, as on the western shore of the lake, probably indicates the influence of heat and the power industry. Since there are no large sources of fossil fuel combustion near the plants, i.e., TPP, and instead of the Ca2+ there is the ion of NH4+, the indicator of long-range transport and gas-phase processes in the atmosphere, it can be assumed that in the composition of atmospheric deposition on the eastern shore, the source of heat energy is less significant than on the western shore. In the fourth factor, the ion of SO42− was released, but it was not associated with other ions, which requires additional study of its origin. Thus, the assessment of factor loadings by the ionic composition of atmospheric precipitation showed that on the west coast, the main sources of precipitation pollution are associated with anthropogenic activities, the influence of local natural background, and wildfires. On the east coast, in addition to the local background, remote anthropogenic sources and soil aerosols brought from afar had a greater influence.

4.3. Geographic Zoning to Categorize Source Groups

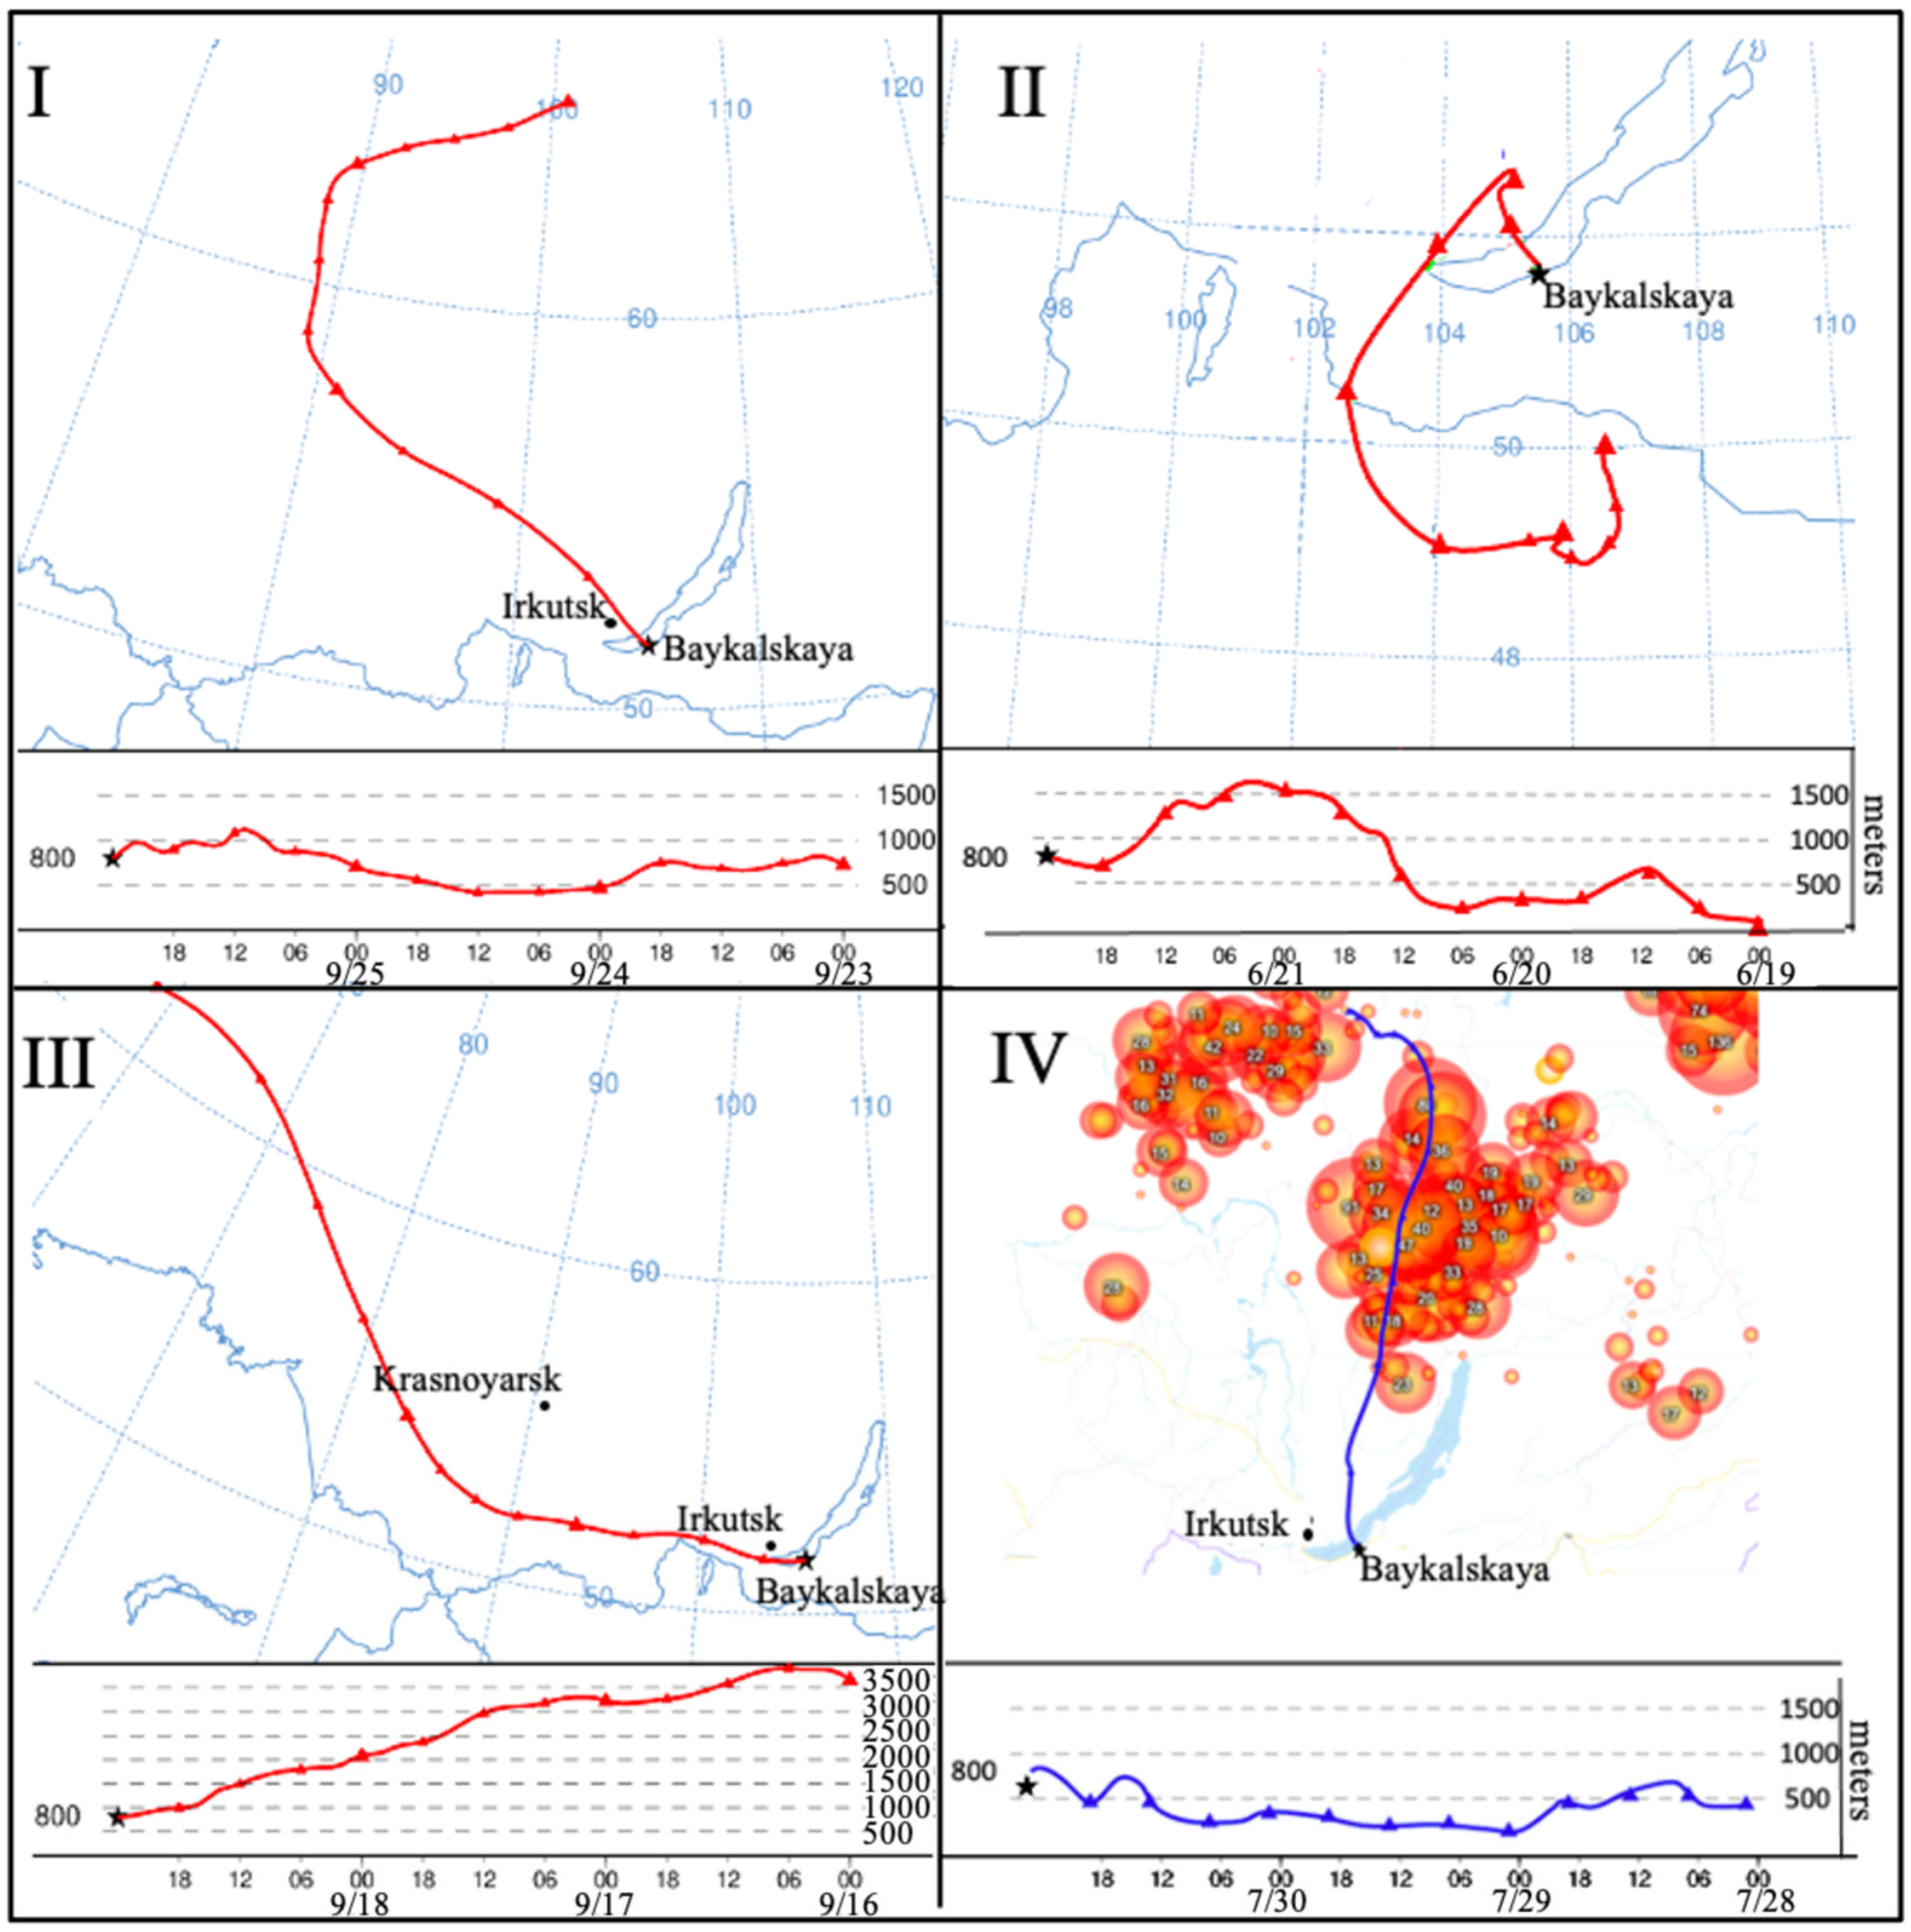
In Russia, the southern part of Eastern Siberia can be distinguished among the most contaminated territories [70], as large industrial centers are located here. In addition, there are some areas on the territory of the region, remote from these centers, where the share of pollution in the chemical composition of atmospheric precipitation is estimated as minimal, which allows us to compare precipitation by the content of substances of “anthropogenic” and “natural” origin. The regime and intensity of precipitation in general, and its chemical composition in particular, are influenced by the characteristic atmospheric circulation and features of the orography of the area [71,72]. The studies [73,74,75] in which the issues of atmospheric circulation in Eastern Siberia were considered show that due to the continentality of the climate and difficult orographic conditions, the zonal component of air transport manifests itself more strongly than in other regions of Russia. We divided all cases of precipitation by their chemical composition. The location of remote sources of analyzed contaminants in atmospheric precipitation was determined using CWT and trajectory analysis. It should be noted that in order to obtain detailed meteorological fields, including wind speed, the mesoscale WRF model, which is well adapted to the tasks of diagnostics and the forecasting of atmospheric processes in the Baikal region, can be used in the future [76]. As a result of the analysis, four main groups of precipitation were identified (Figure 5), each characterized by a unique combination of air mass formation conditions and a specific chemical composition:
The first group (I):
  • Formation conditions: Air masses are formed under the influence of large anticyclonic formations established over the territory of Eastern Siberia. They pass over the areas with high anthropogenic load—the cities of Krasnoyarsk, Irkutsk, Angarsk, Shelekhov, Sayansk, Bratsk, Cheremkhovo, Gusinoozersk, and Ulan-Ude.
  • Chemical composition: The following ions predominate: SO42−, NH4+, and NO3 (more than 40–50% of the total soluble content), indicating a significant impact of industrial and motor vehicle emissions.
  • Features: Characterized by a stable atmosphere and the presence of jet streams at the upper boundary of the nocturnal atmospheric boundary layers at altitudes of 200–500 m above ground level.
The second group (II):
  • Formation conditions: Air masses are formed over the territory of Kazakhstan and Mongolia.
  • Chemical composition: Terrigenous elements predominate—Ca2+, HCO3, Cl, K+, and Mg2+. The ratio [Ca2+, HCO3, Cl, K+, Mg2+]/[SO42−, NH4+, NO3] is above 1, indicating the influence of aeolian transport (dust storms) and other natural factors.
  • Features: This group of atmospheric precipitation shows less influence from anthropogenic sources and more influence from natural processes.
The third group (III):
  • Formation conditions: Air masses are formed in areas remote from large anthropogenic sources of pollution. The main influence is exerted by local natural conditions and meteorological parameters—temperature regime, wind speeds, and downward flows.
  • Chemical composition: Characterized by low mineralization. Natural components prevail, and the pH value of atmospheric precipitation is low at 5.1–5.5.
  • Features: This group of precipitation is the most “clean” among all those considered above and characterizes the background composition of atmospheric deposition without significant influence of human activity.
The fourth group (IV):
  • Formation conditions: Air masses are formed over large areas of forest fires during the warm season.
  • Chemical composition: Increased content of biomass combustion products, ions of K+, NH4+, SO42−, and NO3. Atmospheric precipitation mineralization is greatly increased by the release of combustible materials during fires.
  • Features: Wildfires can significantly alter the chemical composition of precipitation by adding a variety of organic compounds and carbon-containing particles.

5. Discussion

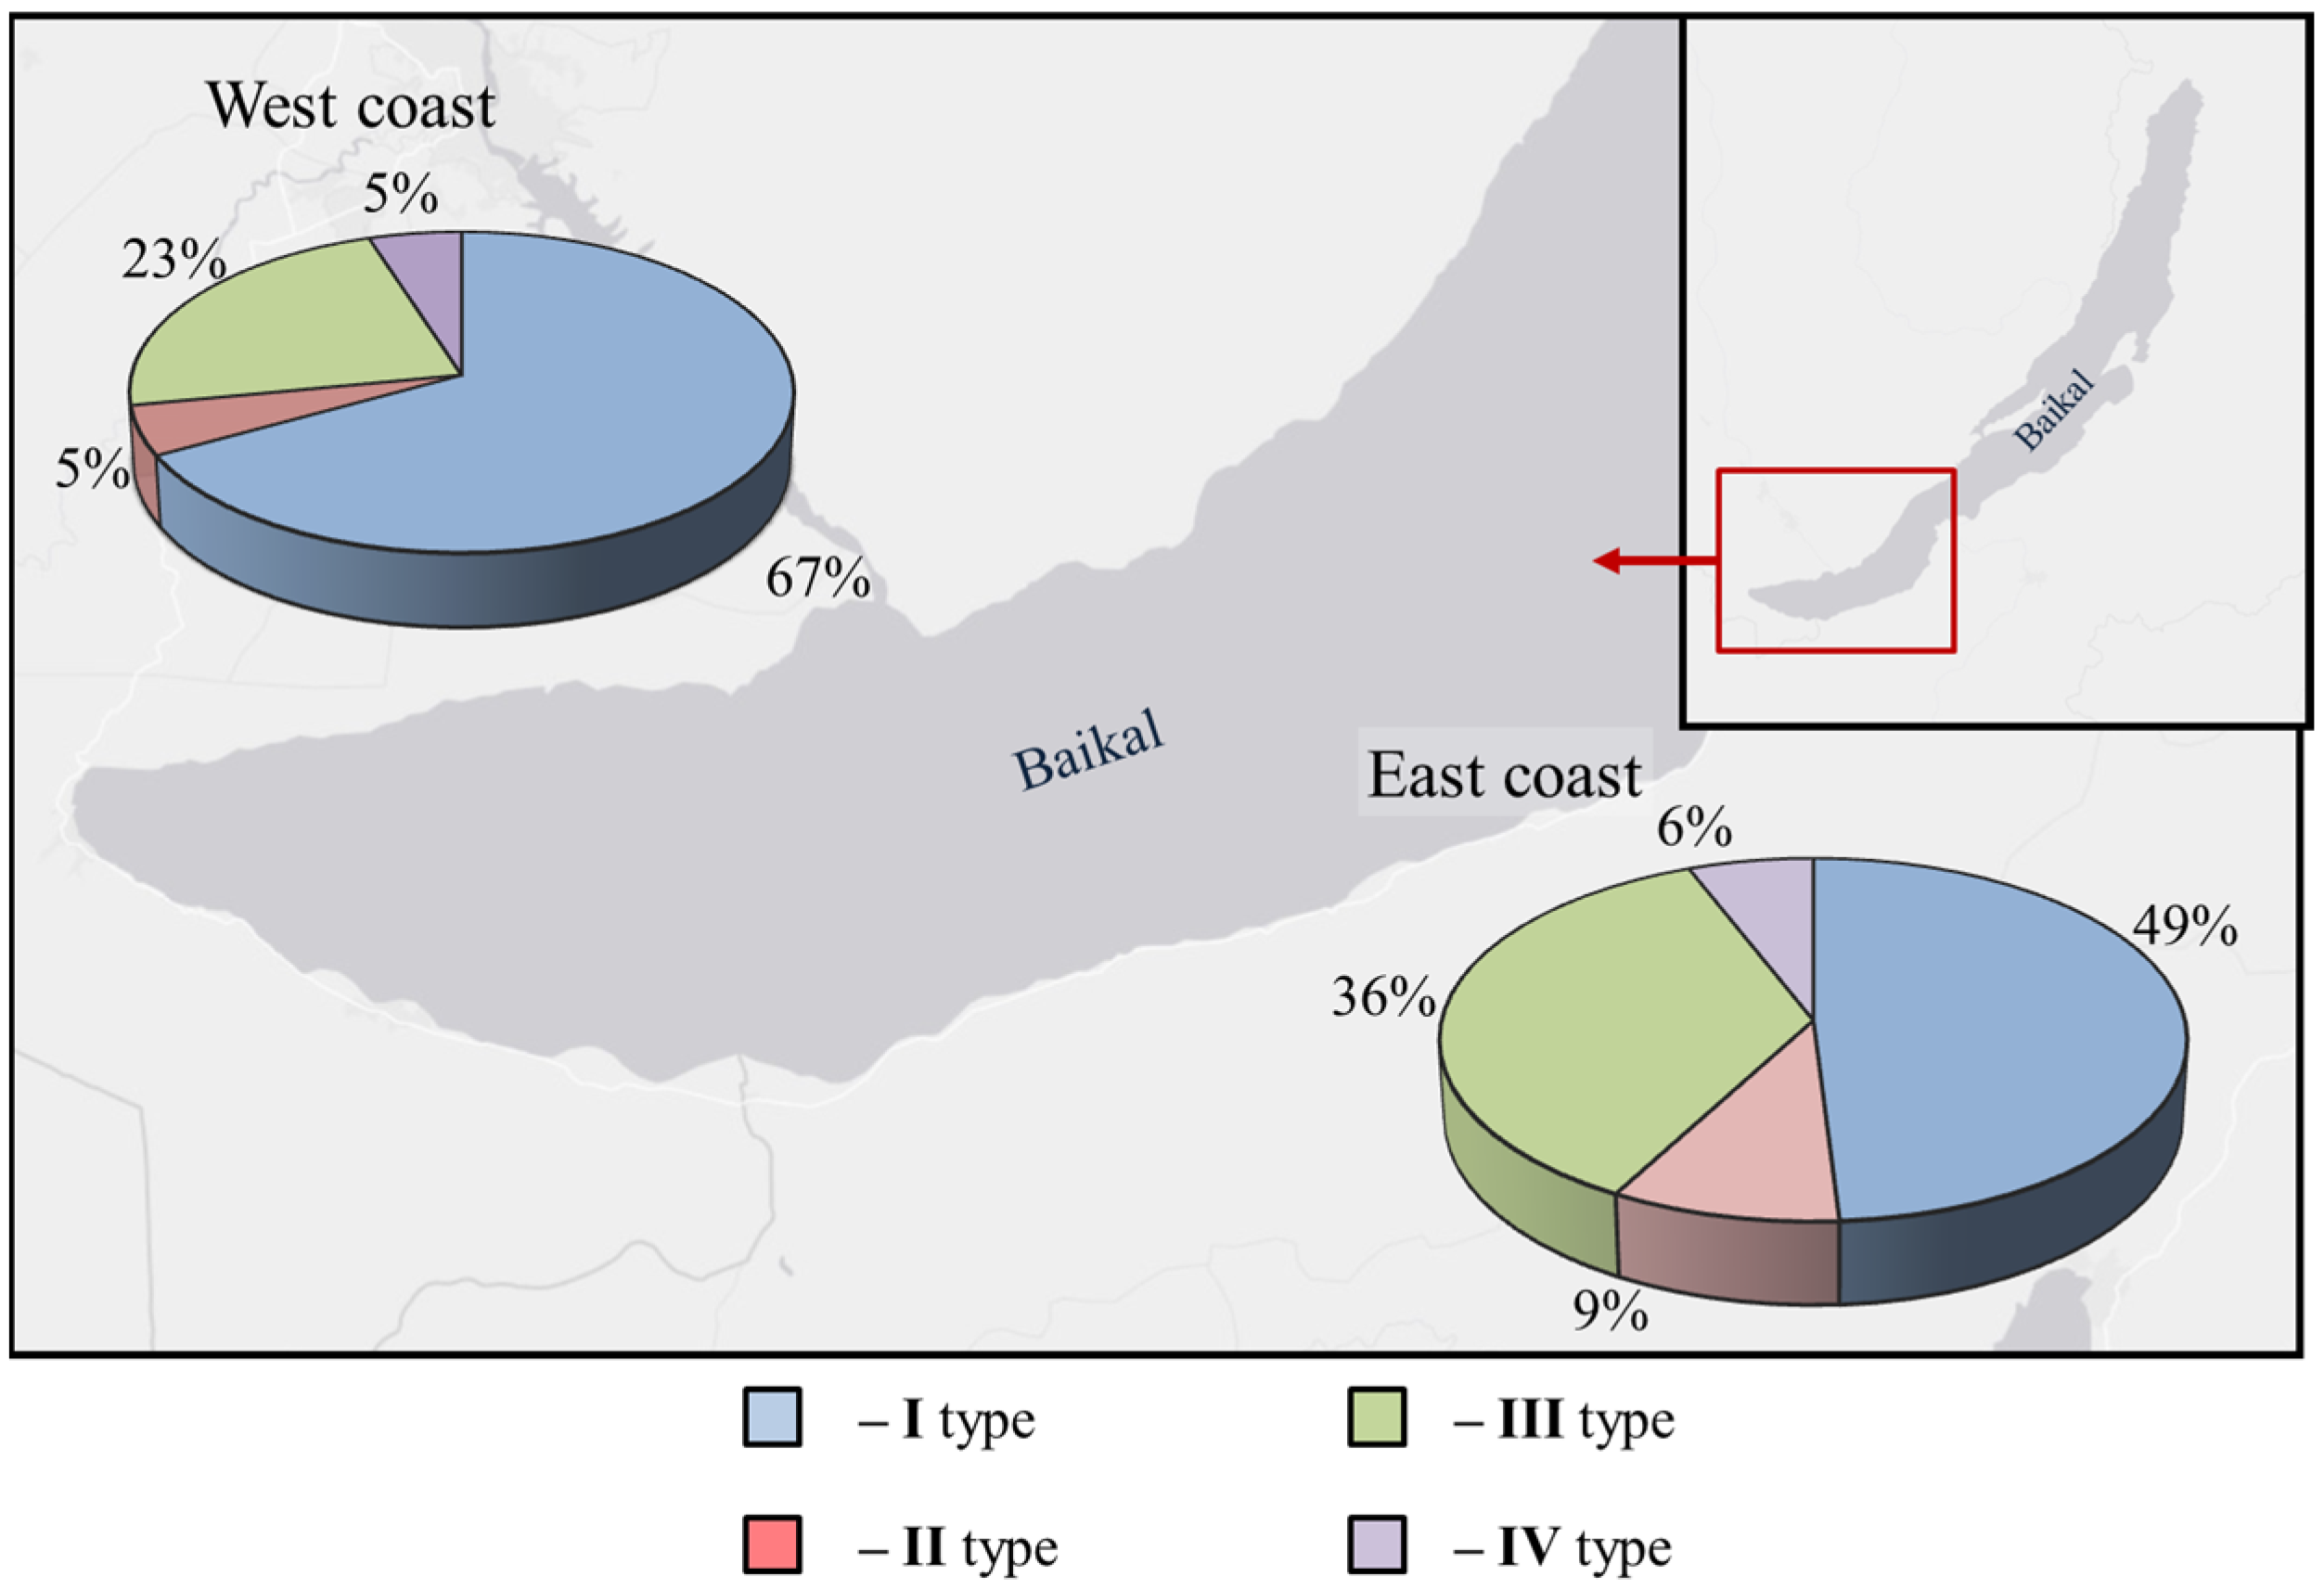
To assess the influence of anthropogenic and natural factors on the chemical composition of atmospheric precipitation in the Southern Baikal Region, a comprehensive analysis was carried out combining data on the chemical composition of precipitation with a model of the reverse trajectories of air masses (HYSPLIT). For each day with precipitation, inverse trajectories of air mass transport were calculated, and all meteorological situations for the study period were analyzed using the methodology described above. The classification was focused on the location of the main industrial centers of the Baikal study region, the recurrence of different trajectories, differences in synoptic situations, and the chemical composition of atmospheric precipitation. Having analyzed long-term data on the chemical composition of precipitation (Figure 6), it was obtained that the composition of precipitation in South Baikal is mostly influenced by air masses formed over the industrial centers of Eastern Siberia (67% of cases on the west coast and 49% of cases on the east coast), and we attributed them to the first type of precipitation. The second type includes precipitation whose composition was more influenced by the natural background (23% on the west coast and 36% on the east coast). Precipitation with a predominance of terrigenous components in the chemical composition was less common, such as Ca2+, HCO3, Cl, K+, and Mg2+—type III (5% cases on the west coast and 9% cases on the east coast). A typical feature of these precipitation events was the formation of air flows over the areas of Northern Mongolia and Kazakhstan (Figure 6). The atmospheric precipitation combined into type IV (5% on the west coast and 6% of cases on the east coast) was recorded at the stations when its composition was influenced by smoke plumes from large wildfires in the region. This type of precipitation was observed less frequently, although the number of wildfires in the region has been increasing in recent years. The largest number of cases of the fourth type of precipitation was recorded in 2018, and the most typical for this rain group was sampled at Baikalskaya station on 30 July 2019.
CWT methodology was applied to identify potential remote pollution sources that have influenced precipitation composition in the Baikal region. In this study, 72 h back trajectories with the ensemble option were modeled to account for uncertainties in forecasting air mass movement. As shown previously (Figure 4), the choice of tracers—sulfate (SO42−), nitrate (NO3), calcium (Ca2+), potassium (K+), hydrocarbonate (HCO3), and chloride (Cl)—is caused by their significance as indicators of both industrial pollution and natural processes. The study covered the period from 2017 to 2024, which made it possible to take into account the inter-annual variability of meteorological conditions and different levels of anthropogenic activity.
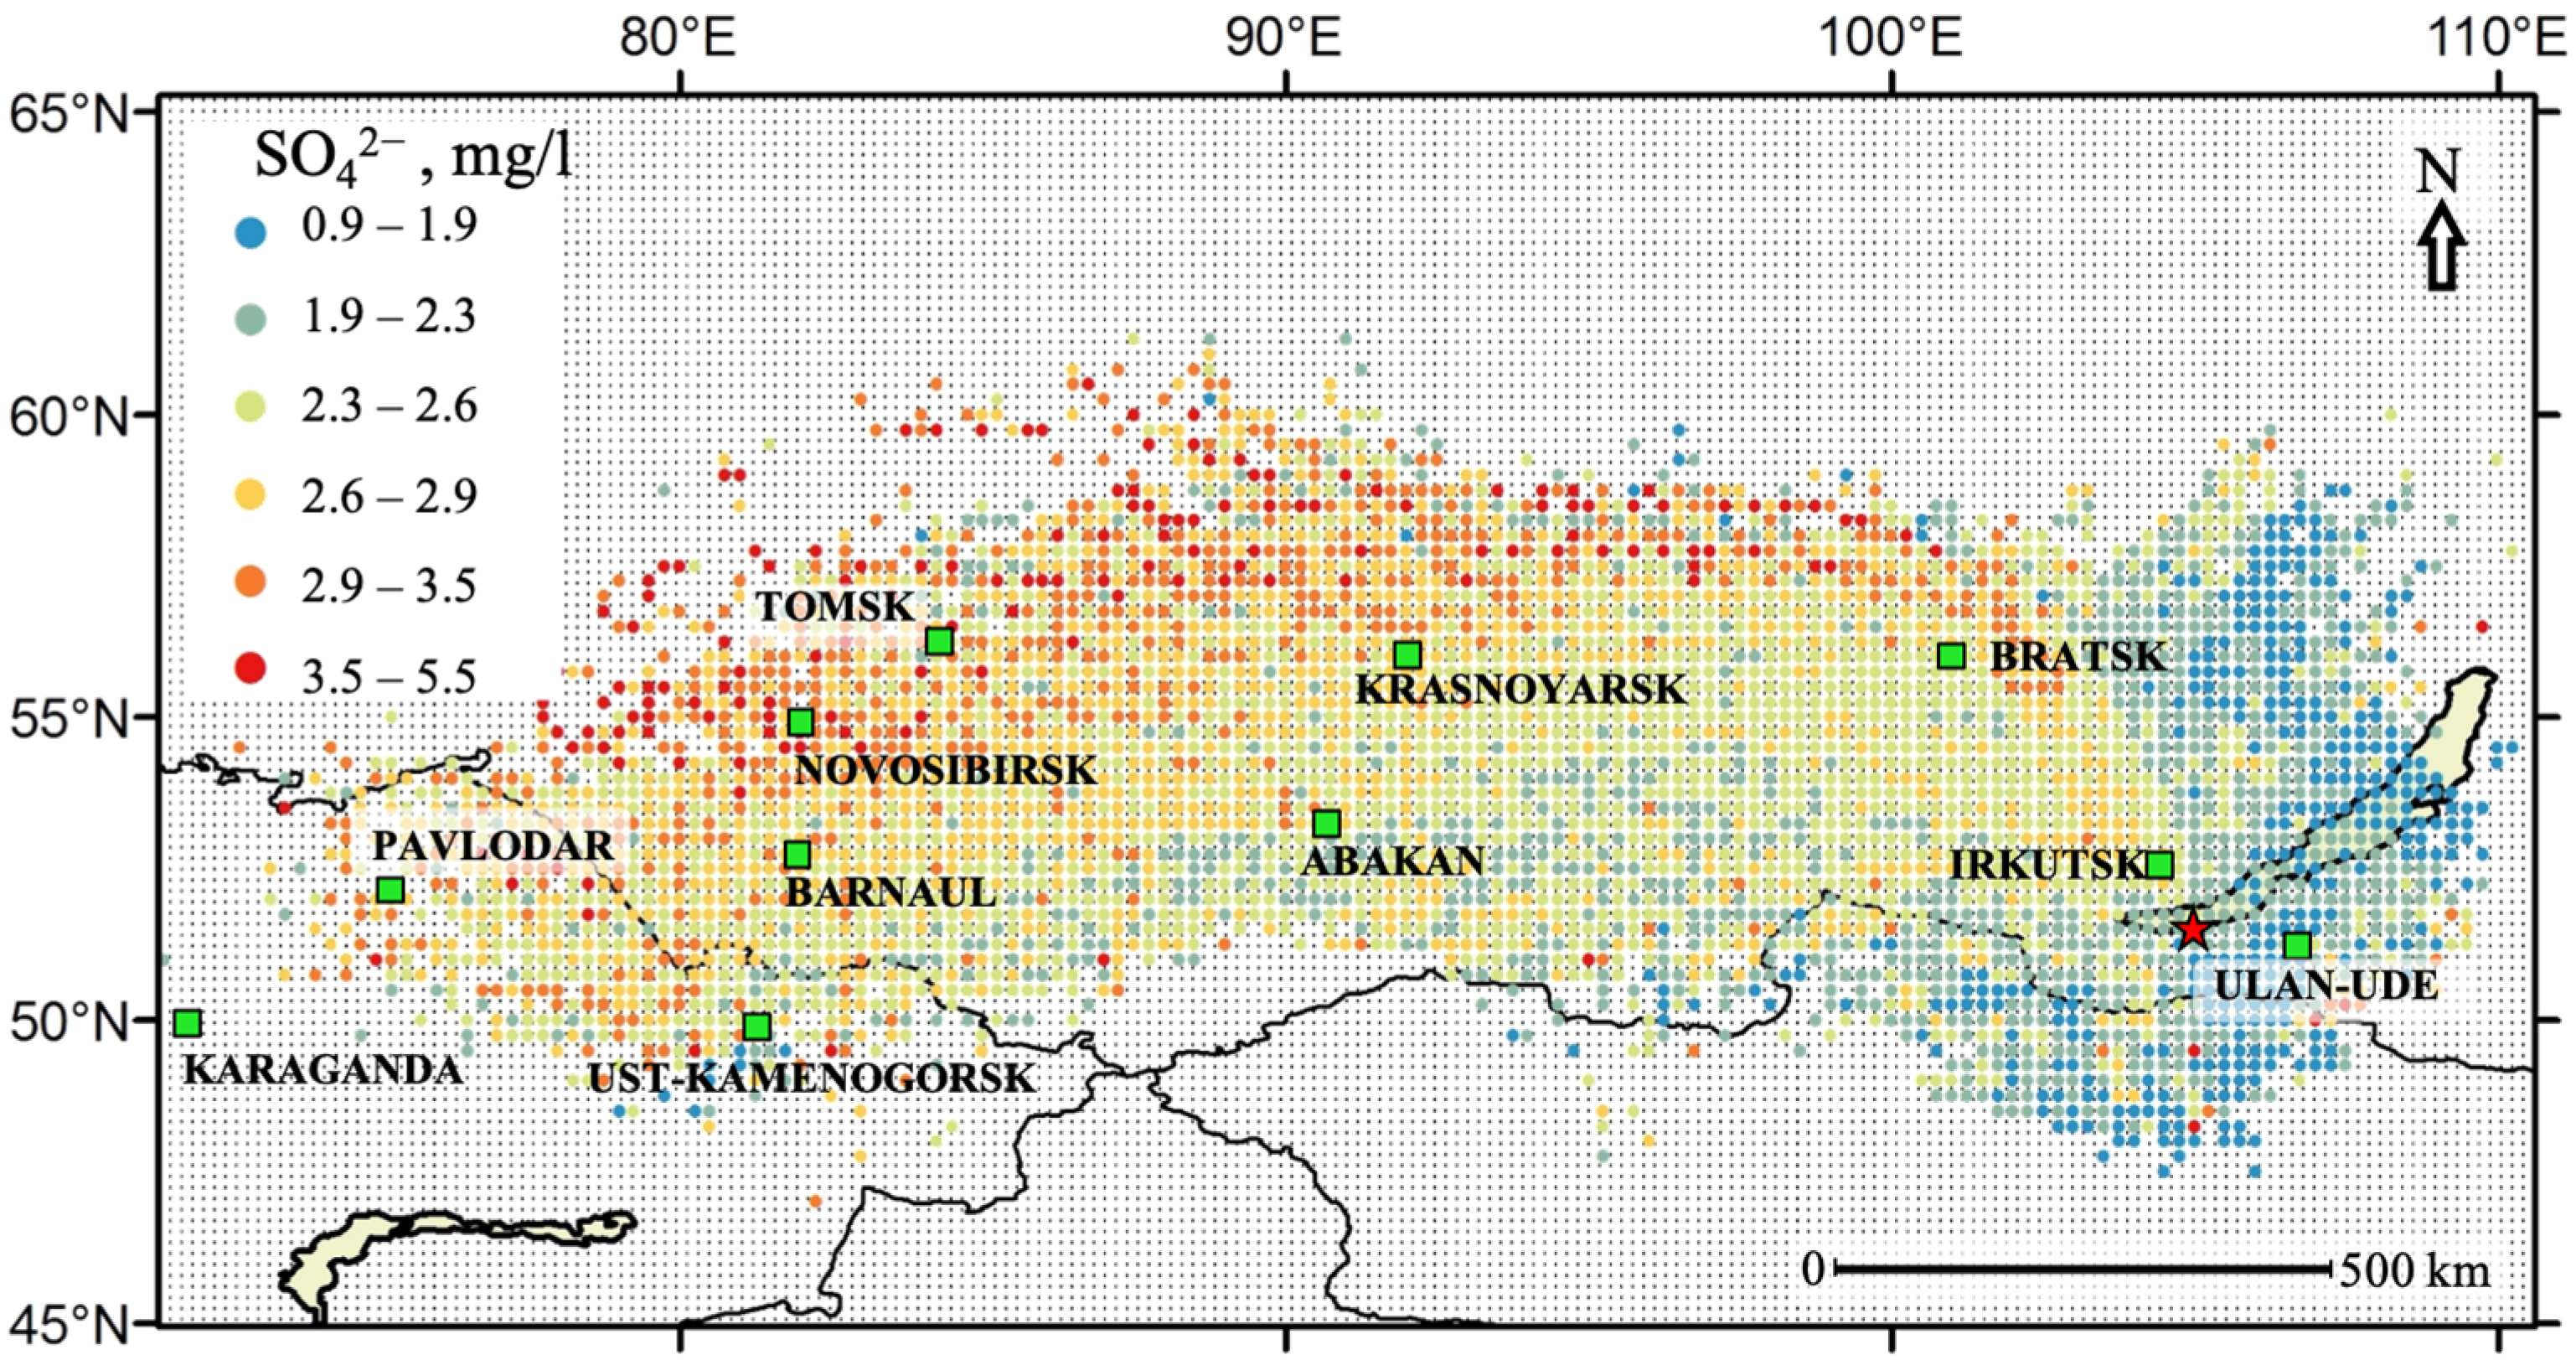
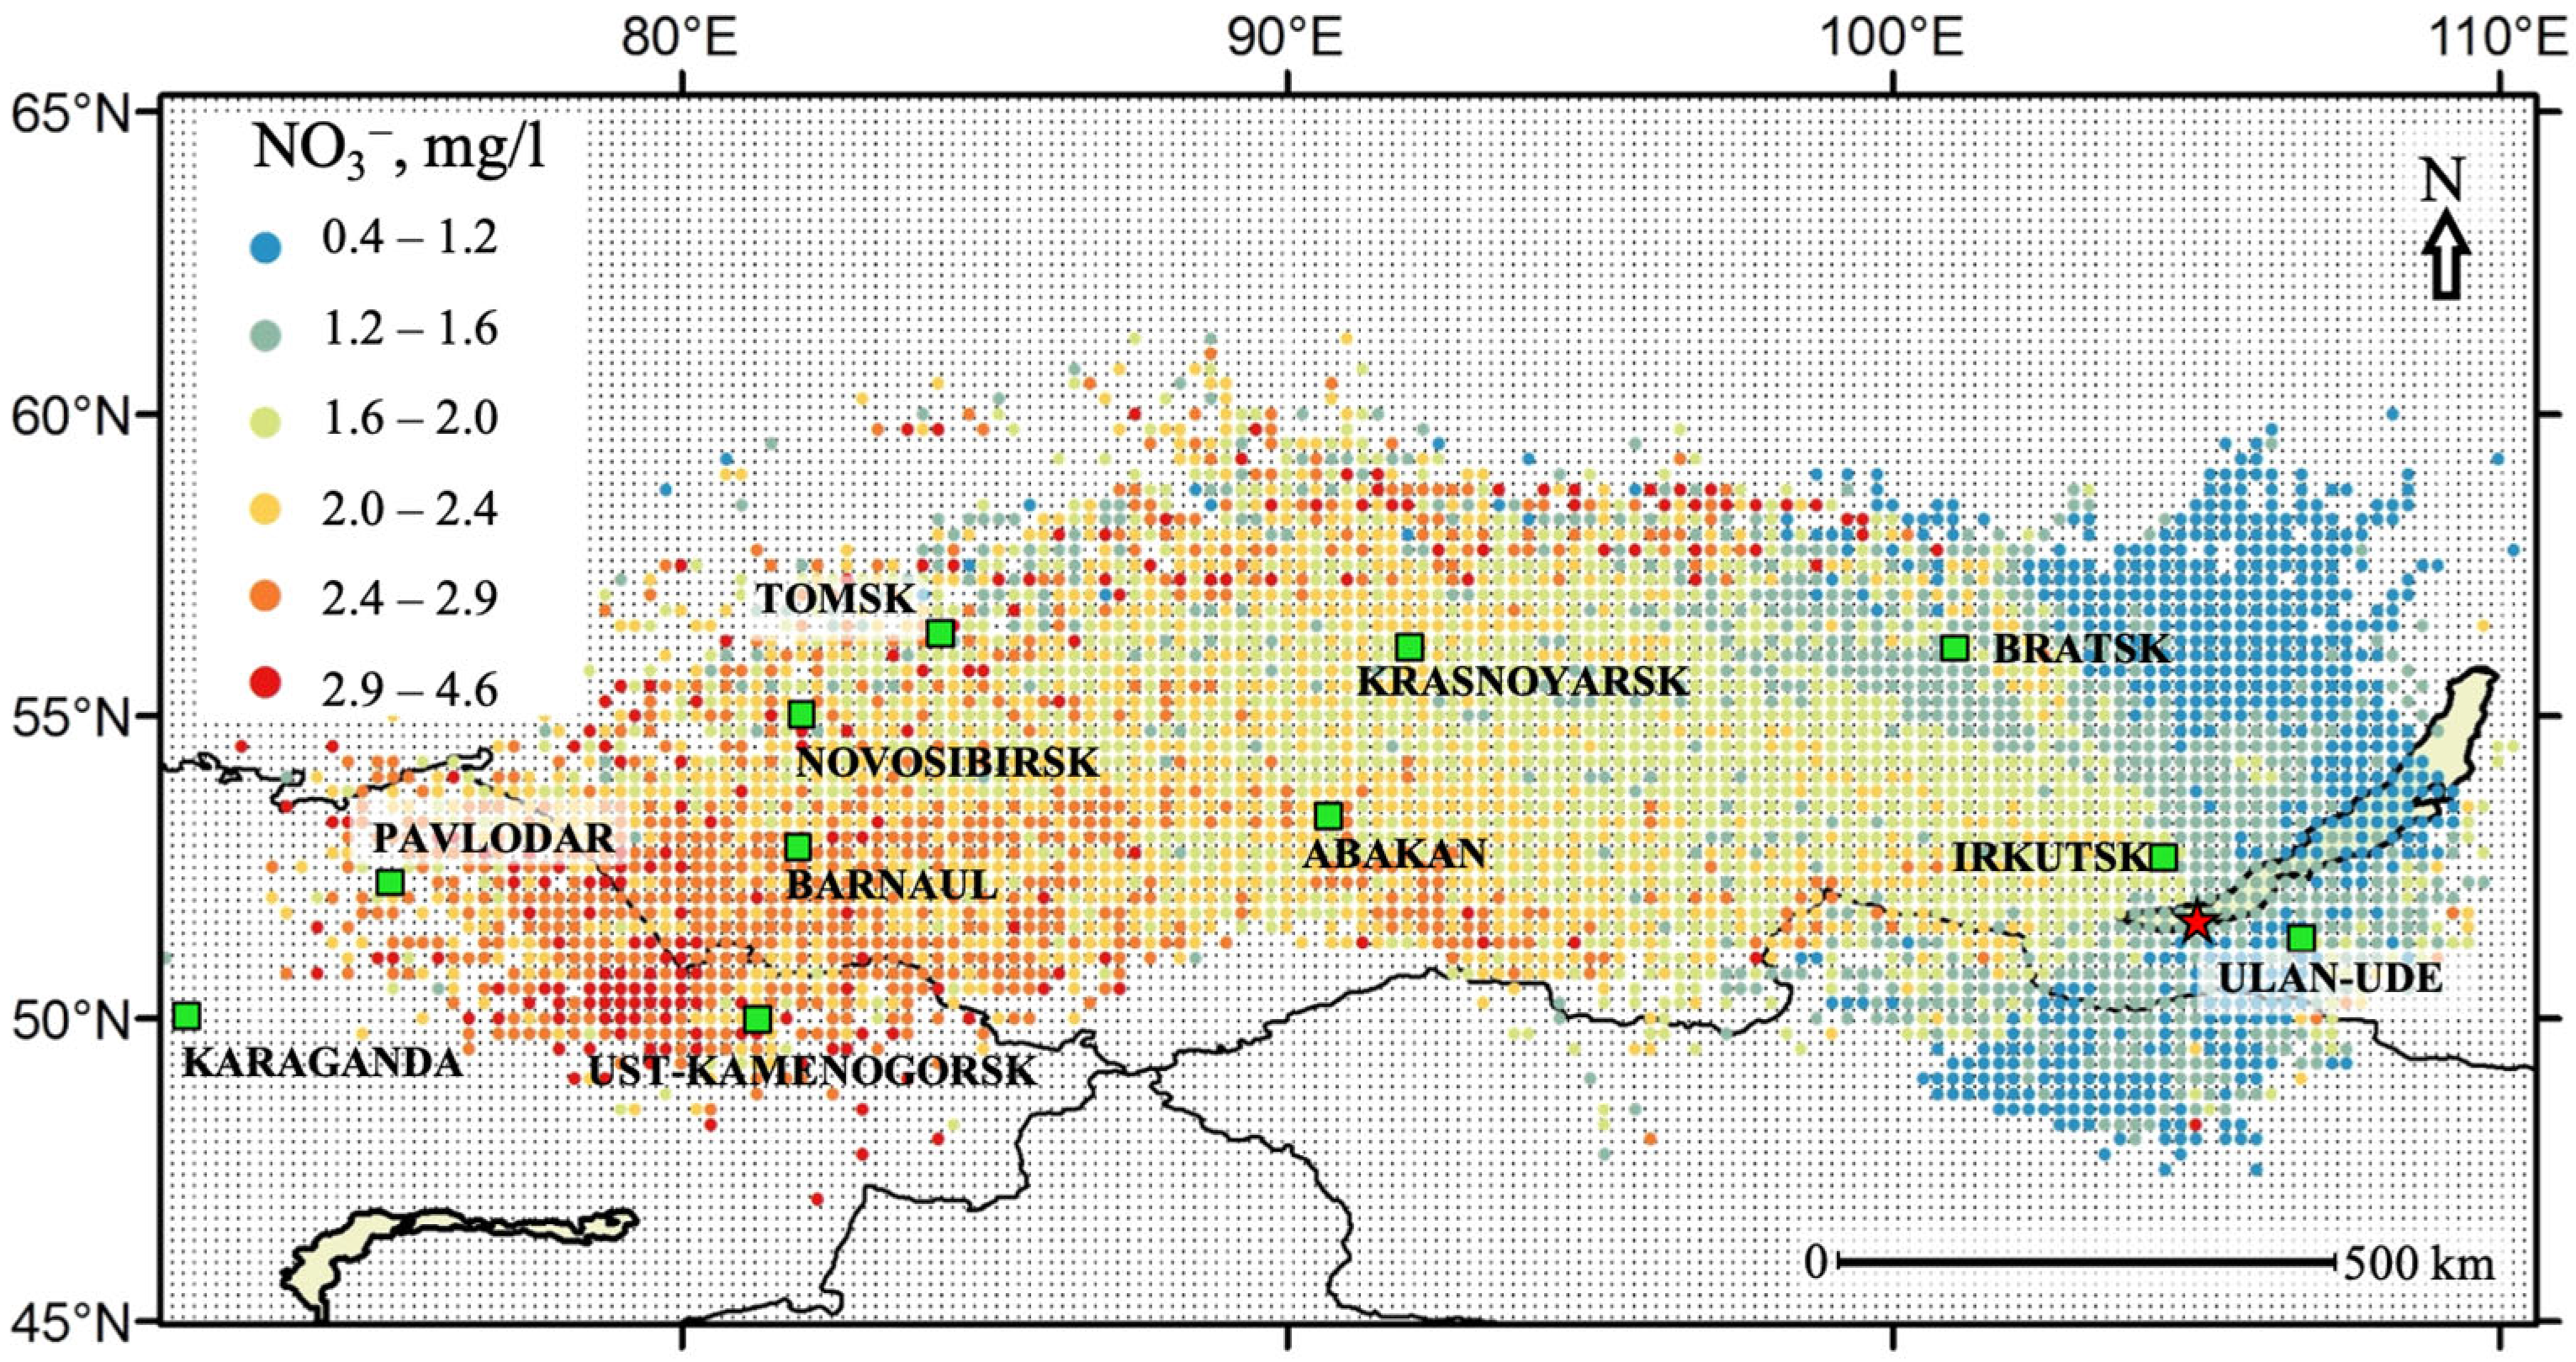
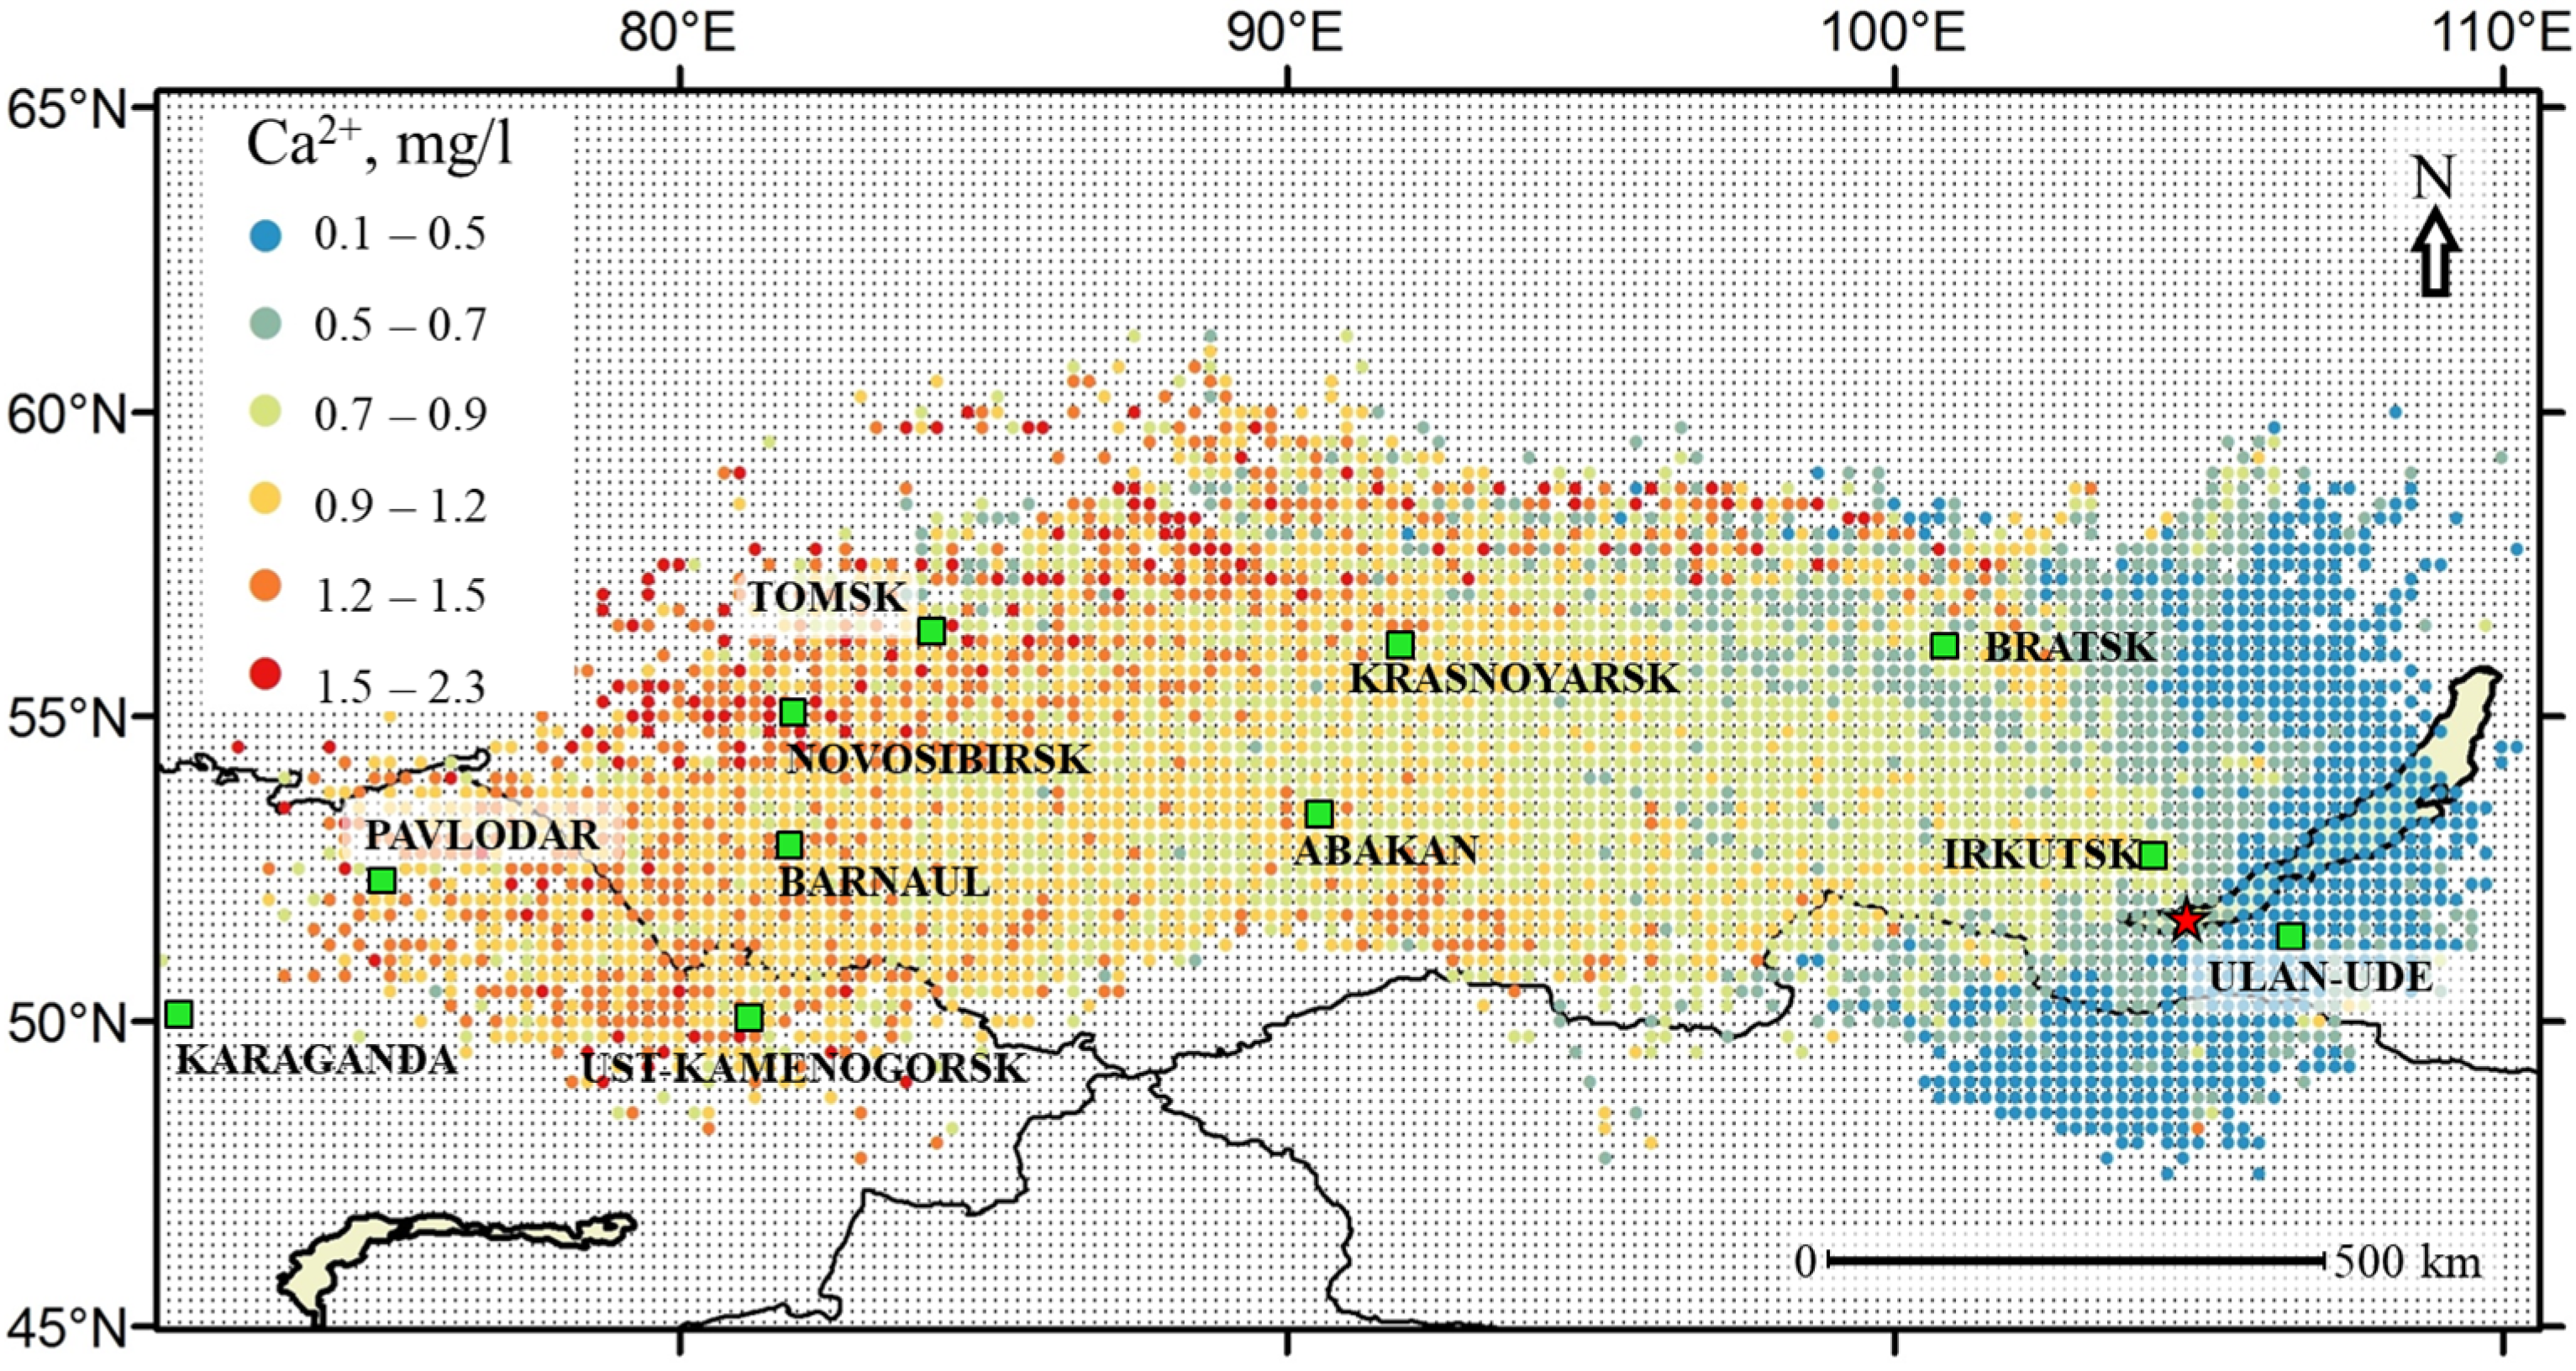
Figure 7, Figure 8 and Figure 9 present the results of CWT analysis for tracers of the anthropogenic contamination of SO42−, NO3, and frequently associated Ca2+ in atmospheric precipitation sampled on the coast of Southern Baikal. The maps show the distribution of potential sources that contribute to the increase or decrease in anthropogenic impurities in atmospheric deposition.
High concentrations of anthropogenic pollution tracers (red and orange areas) are concentrated over territories with intensive economic activity: large cities and industrial centers of Western and Eastern Siberia. Concentrations of SO42− (3.00–5.52 mg/L) and NO3 (2.37–4.55 mg/L) in precipitation reach maximum values in the areas located above the major industrial centers of Western and Eastern Siberia—the cities of Novosibirsk, Krasnoyarsk, Bratsk, and Irkutsk. This indicates significant atmospheric air pollution in these areas and is primarily associated with emissions from motor transport; heat power; and chemical, metallurgical, and other types of industry. High concentrations of Ca2+ (1.16–2.31 mg/L) in industrial centers of Western and Eastern Siberia are associated with emissions of ash components from heat power engineering, construction dust, cement production, and mining.
When air masses move from Kazakhstan through the south of Eastern Siberia and Altai, a decrease in the concentration of SO42− (2.31–2.99 mg/L) is observed, to moderate values (yellow and green areas), indicating a decrease in the influence of large anthropogenic sources. Precipitations with a high content of NO3—1.62–4.55 mg/L (red and orange areas)—were formed under the influence of the large industrial centers of Northern Kazakhstan.
The concentration of Ca2+ (0.75–1.46 mg/L) varied from high (orange areas) to moderate values (yellow and green areas). It can be assumed that the influence of anthropogenic factors on the composition of atmospheric precipitation was less significant, but natural sources of calcium, such as dust storms and soil erosion in arid areas, could occur.
Minimum concentrations (blue and gray areas) for SO42− (0.90–2.30 mg/L), NO3 (0.40–1.61 mg/L), and Ca2+ (0.14–1.15 mg/L) typical for areas remote from industrial centers are observed in the northern part of the Irkutsk Region and Northern Mongolia. Clean natural conditions with minimal human impact prevail here.
Thus, the maps obtained from the CWT analysis (Figure 7, Figure 8 and Figure 9) confirm that high concentrations of SO42−, Ca2+, and NO3 are associated with industrial areas of Western and Eastern Siberia, while their low values are typical for remote natural areas.
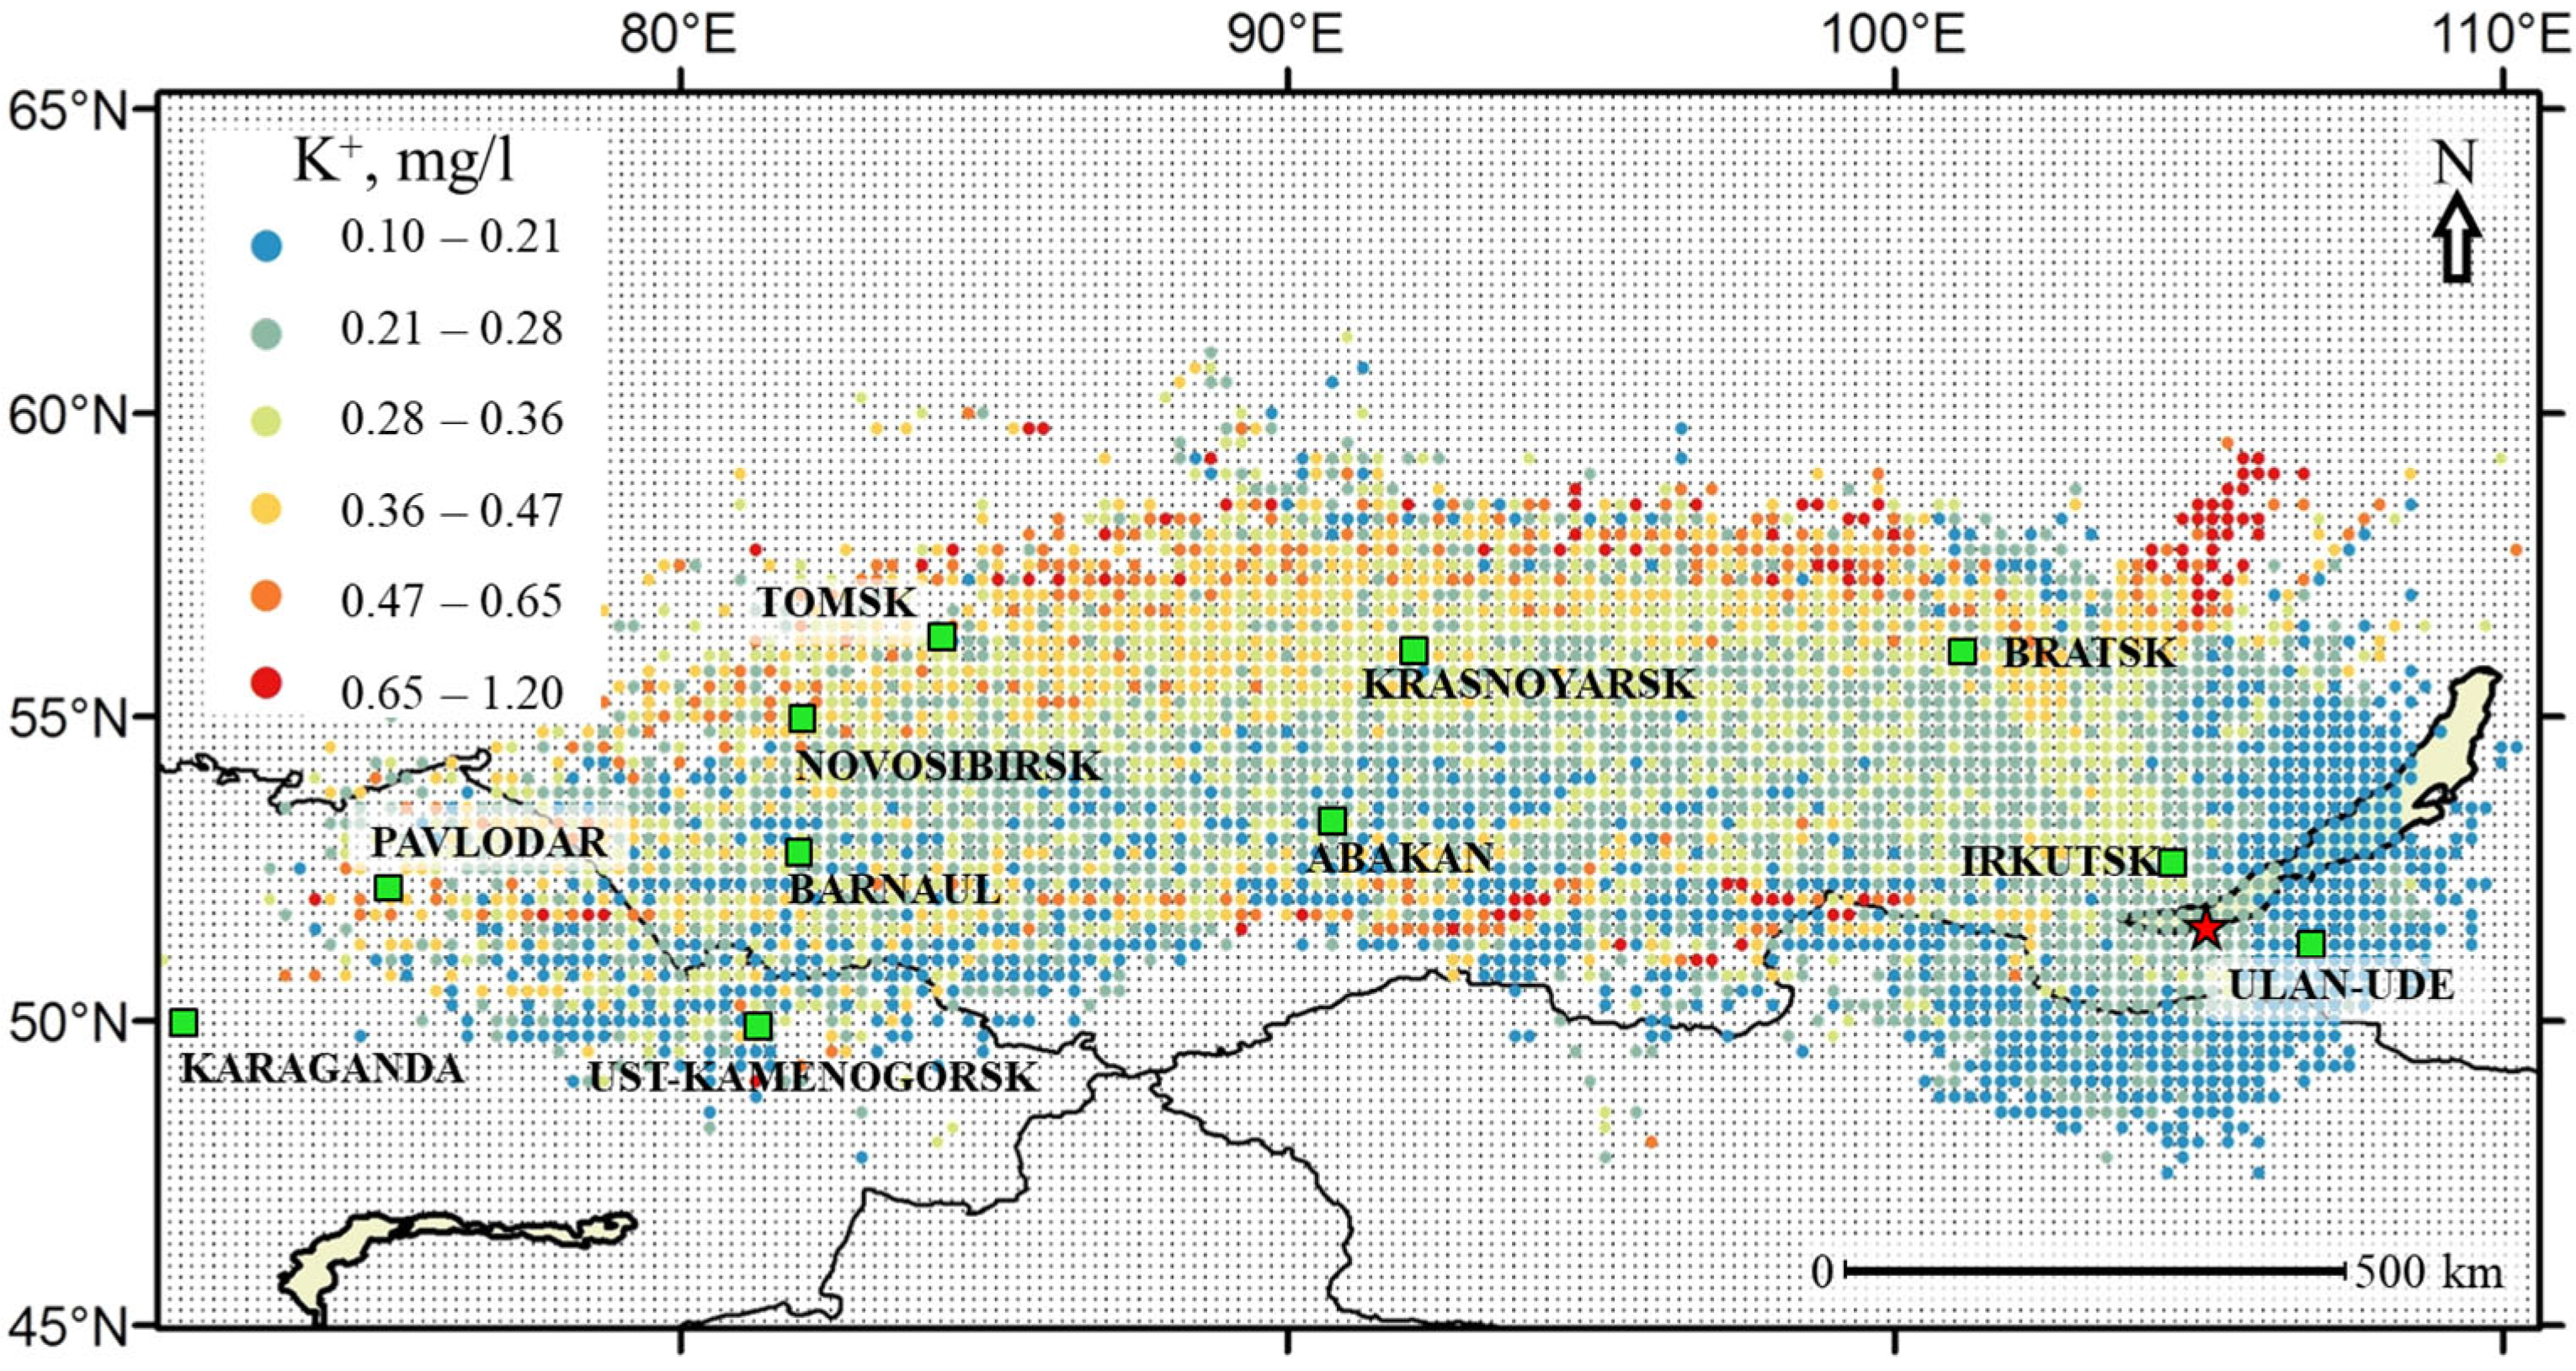
Figure 10 presents the results of the CWT analysis for the K+ ion. According to the proposed methodology and statistical analysis, high concentrations of this ion in precipitation samples are associated with wildfires. According to the data of the Federal Forestry Agency of Russia for the period 2017–2022 in the study area, the most frequent wildfires occurred in the north of the Krasnoyarsk Territory and the Irkutsk Region. According to calculations (red and orange areas), in the precipitation formed over the northern territories of the Krasnoyarsk Territory and the Irkutsk Region, K+ concentrations reach maximum values (0.48–1.20 mg/L).
Most of the study area had moderate K+ values ranging from 0.22 to 0.47 mg/L, which corresponds to the yellow-green areas on the map. This may indicate the localized impact of anthropogenic sources, such as agricultural biomass burning operations, emissions from cement plants, metallurgical plants, and solid fuel combustion. Areas remote from industrial centers and wildfire zones, such as the northern region of Mongolia and the northern parts of the Baikal region, are characterized by low concentrations, indicated in blue on the map (from 0.10 to 0.28 mg/L).
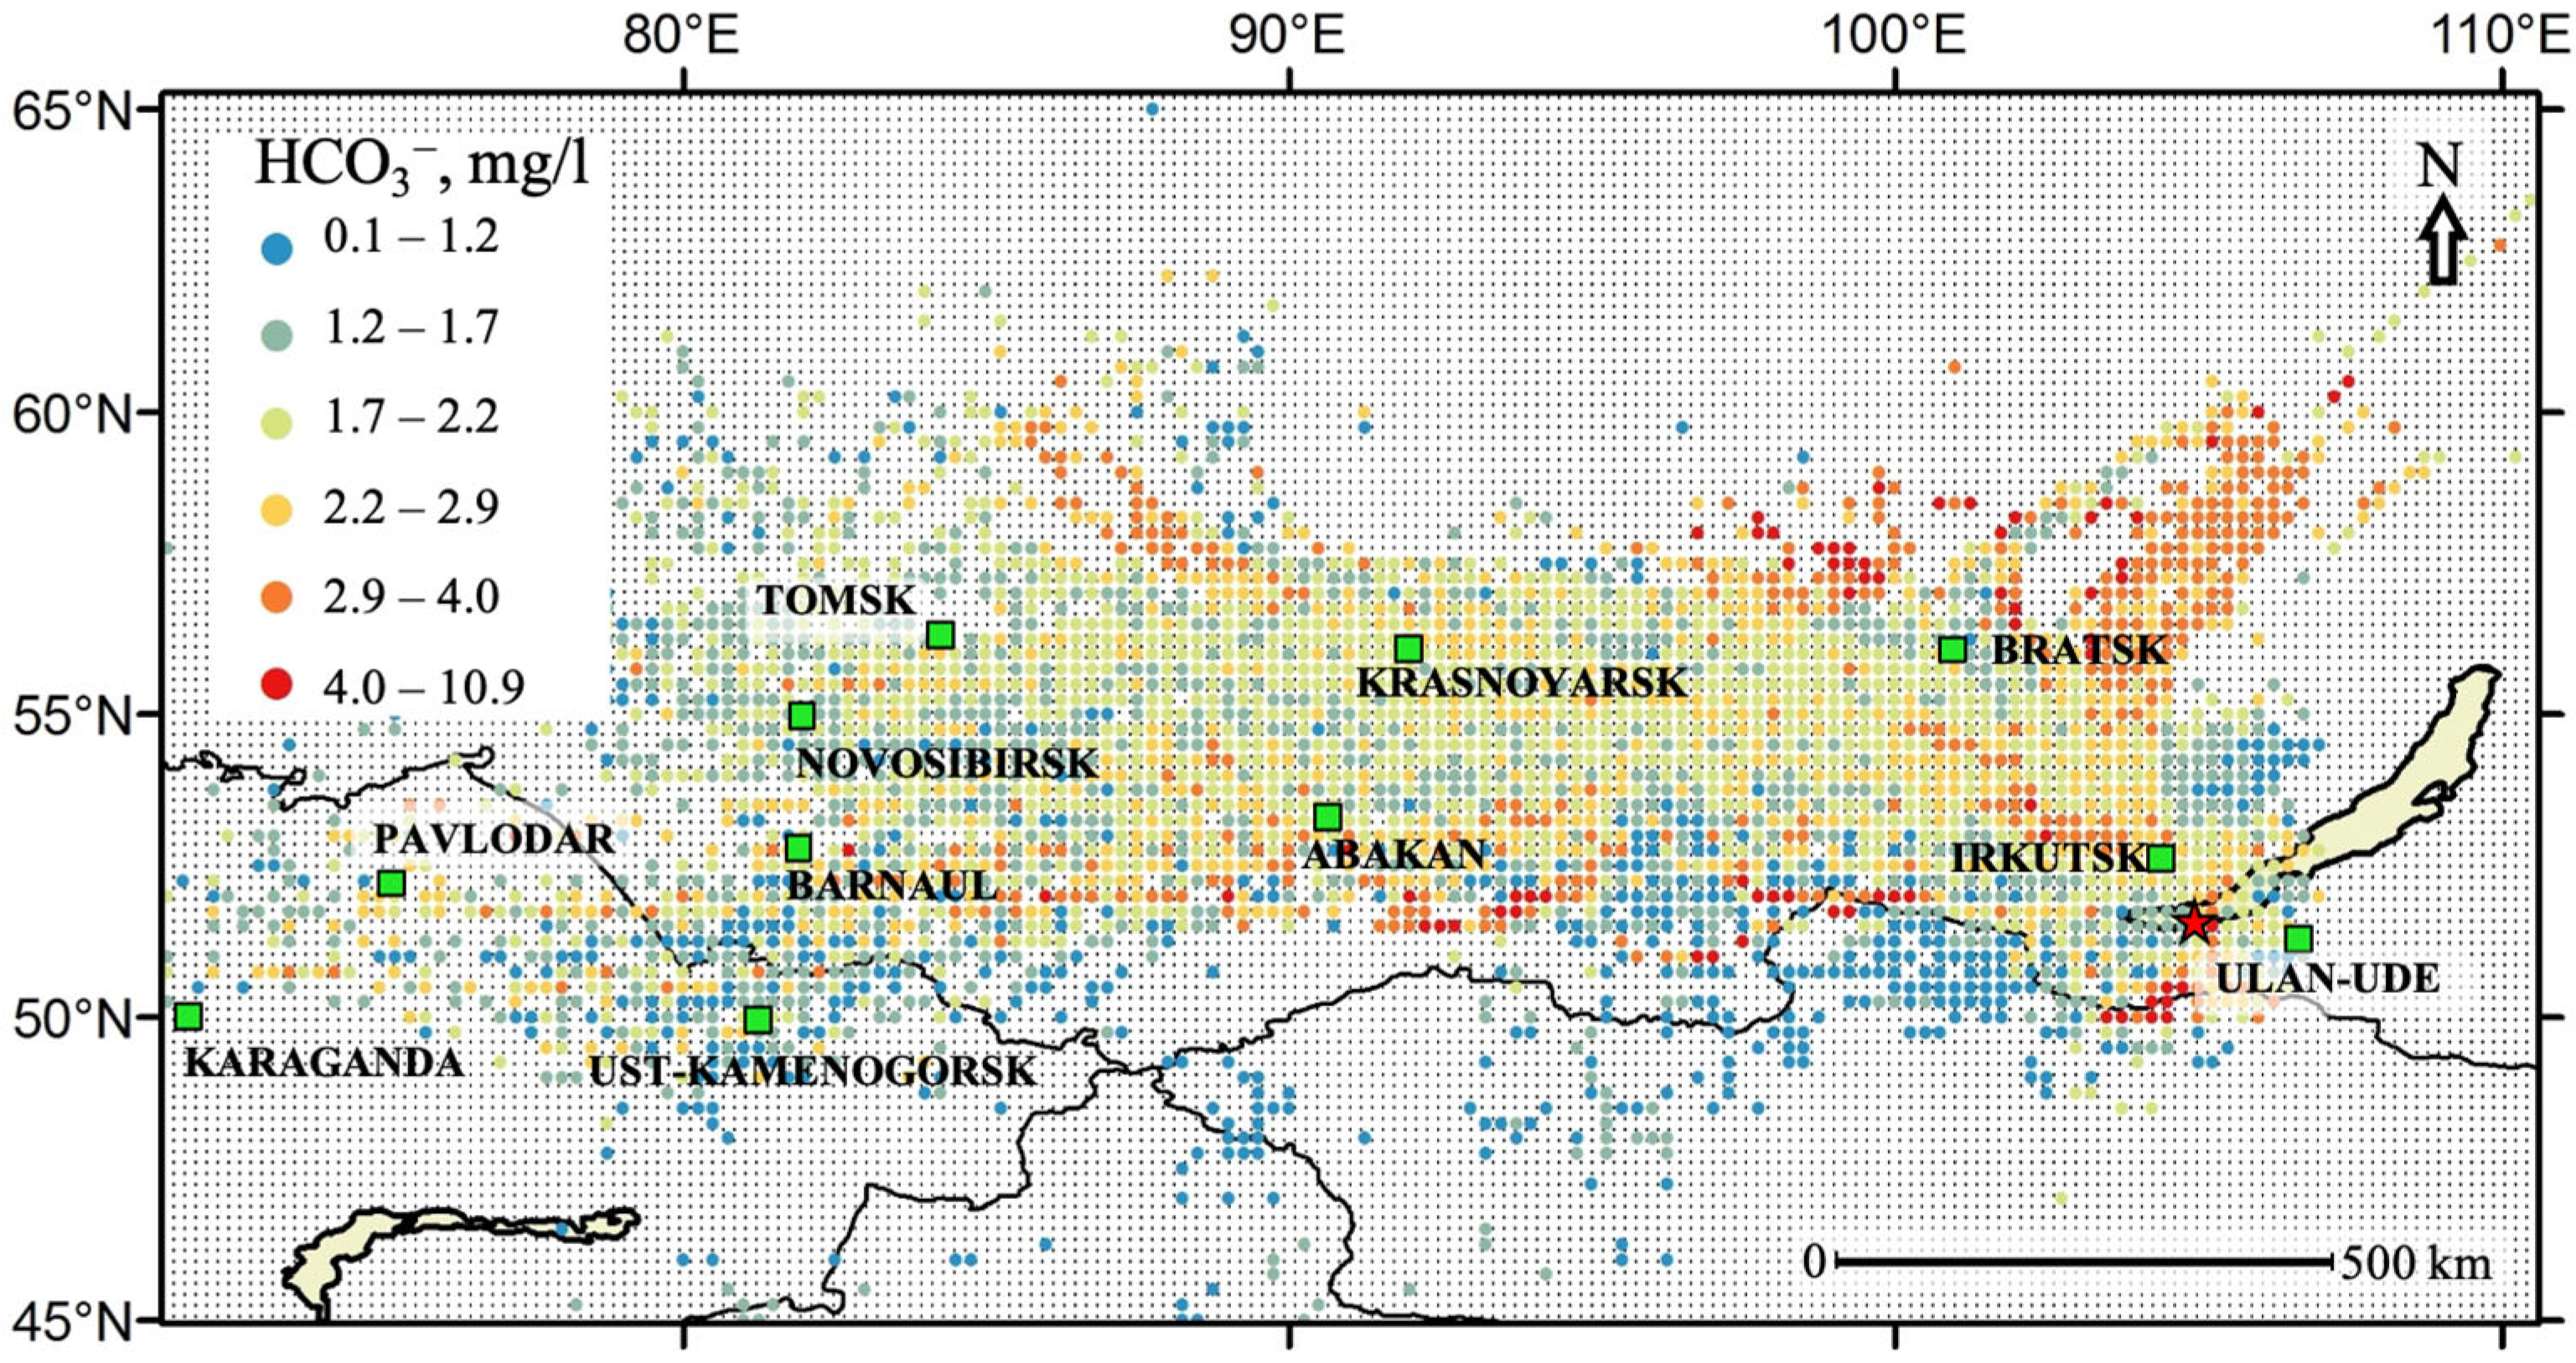
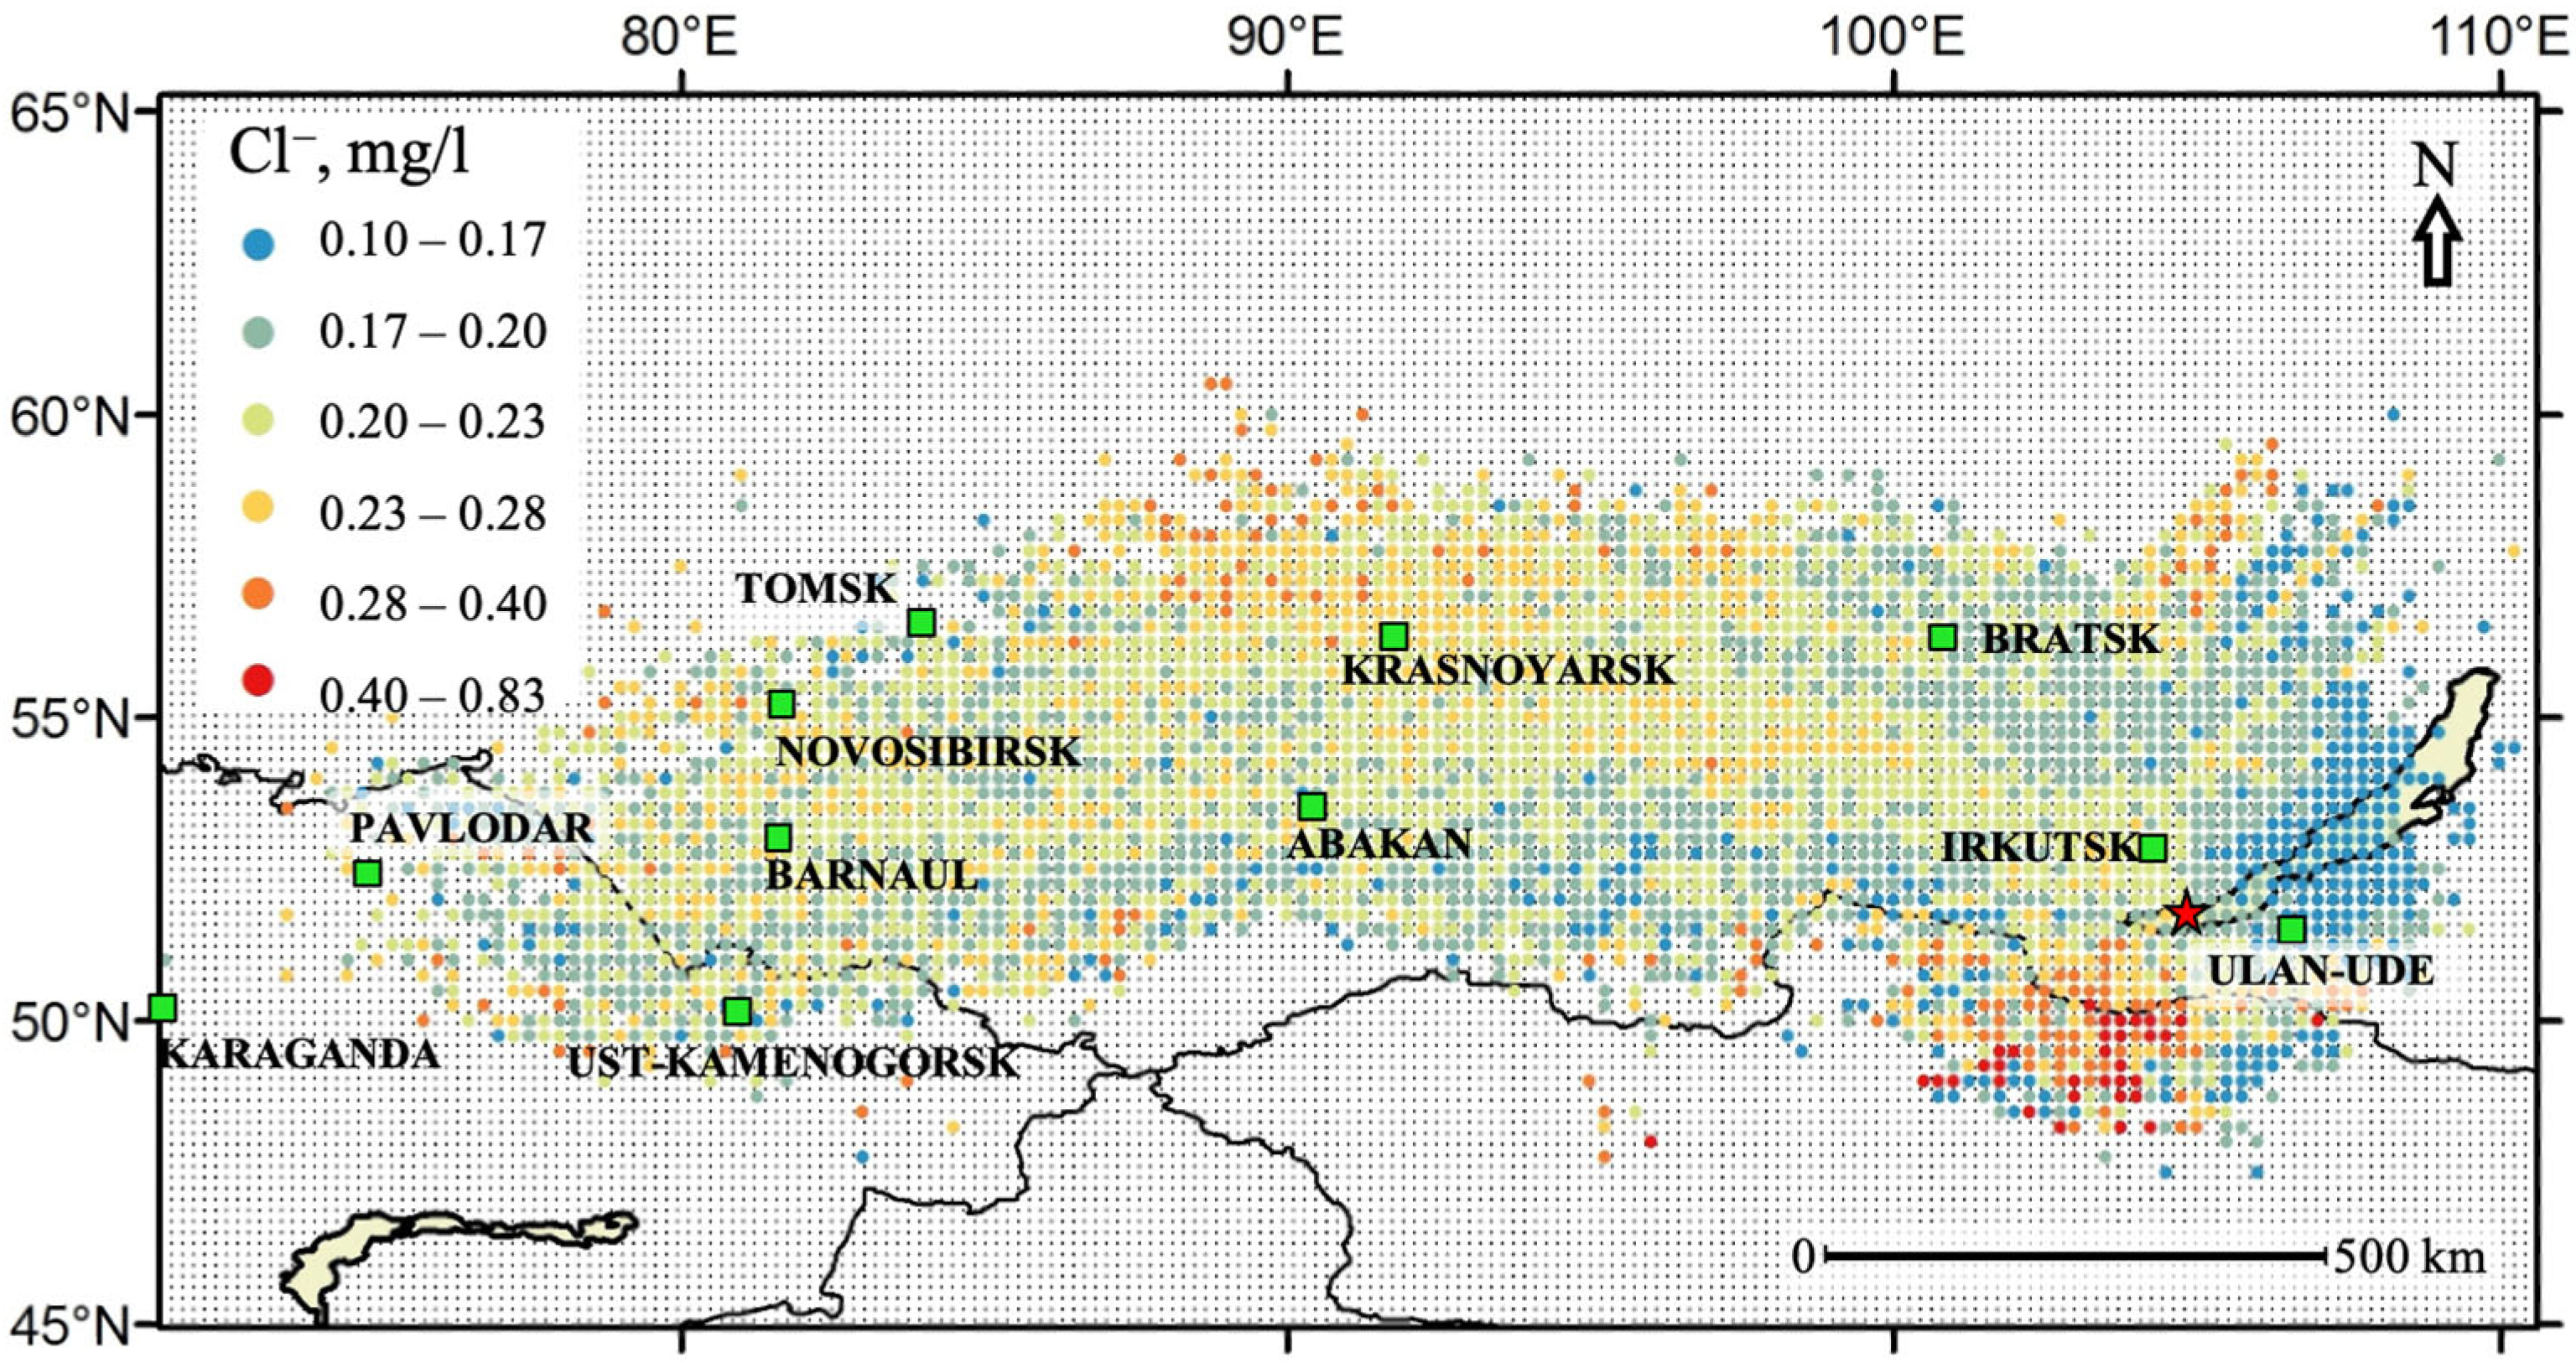
Figure 11 and Figure 12 show the geographic distribution of sources of HCO3 and Cl ions. High concentrations of these tracers of 2.86–10.90 mg/L for HCO3 and 0.29–0.83 mg/L for Cl, marked in red and orange colors, are concentrated over the territories of Northern Mongolia, which confirms and complements our previous conclusions that atmospheric precipitation that came from the territory of Kazakhstan and Mongolia contain terrigenous elements in its chemical composition. When air masses move over the industrial centers of the northern regions of Western and Eastern Siberia, one more source with maximum HCO3 ion areas can be identified (Figure 11). In addition to soil erosion and dust storms, anthropogenic emissions and chemical reactions in the atmosphere are associated with CO2.
The CWT analysis of Cl concentration in atmospheric precipitation (Figure 12) showed that moderate values of this ion, ranging from 0.18 to 0.28 mg/L, were observed in most of the studied area, which corresponds to yellow-green areas on the map. The cleanest precipitation in terms of Cl content (blue areas from 0.01–0.17 mg/L) is typical for the northern areas of the Baikal region.
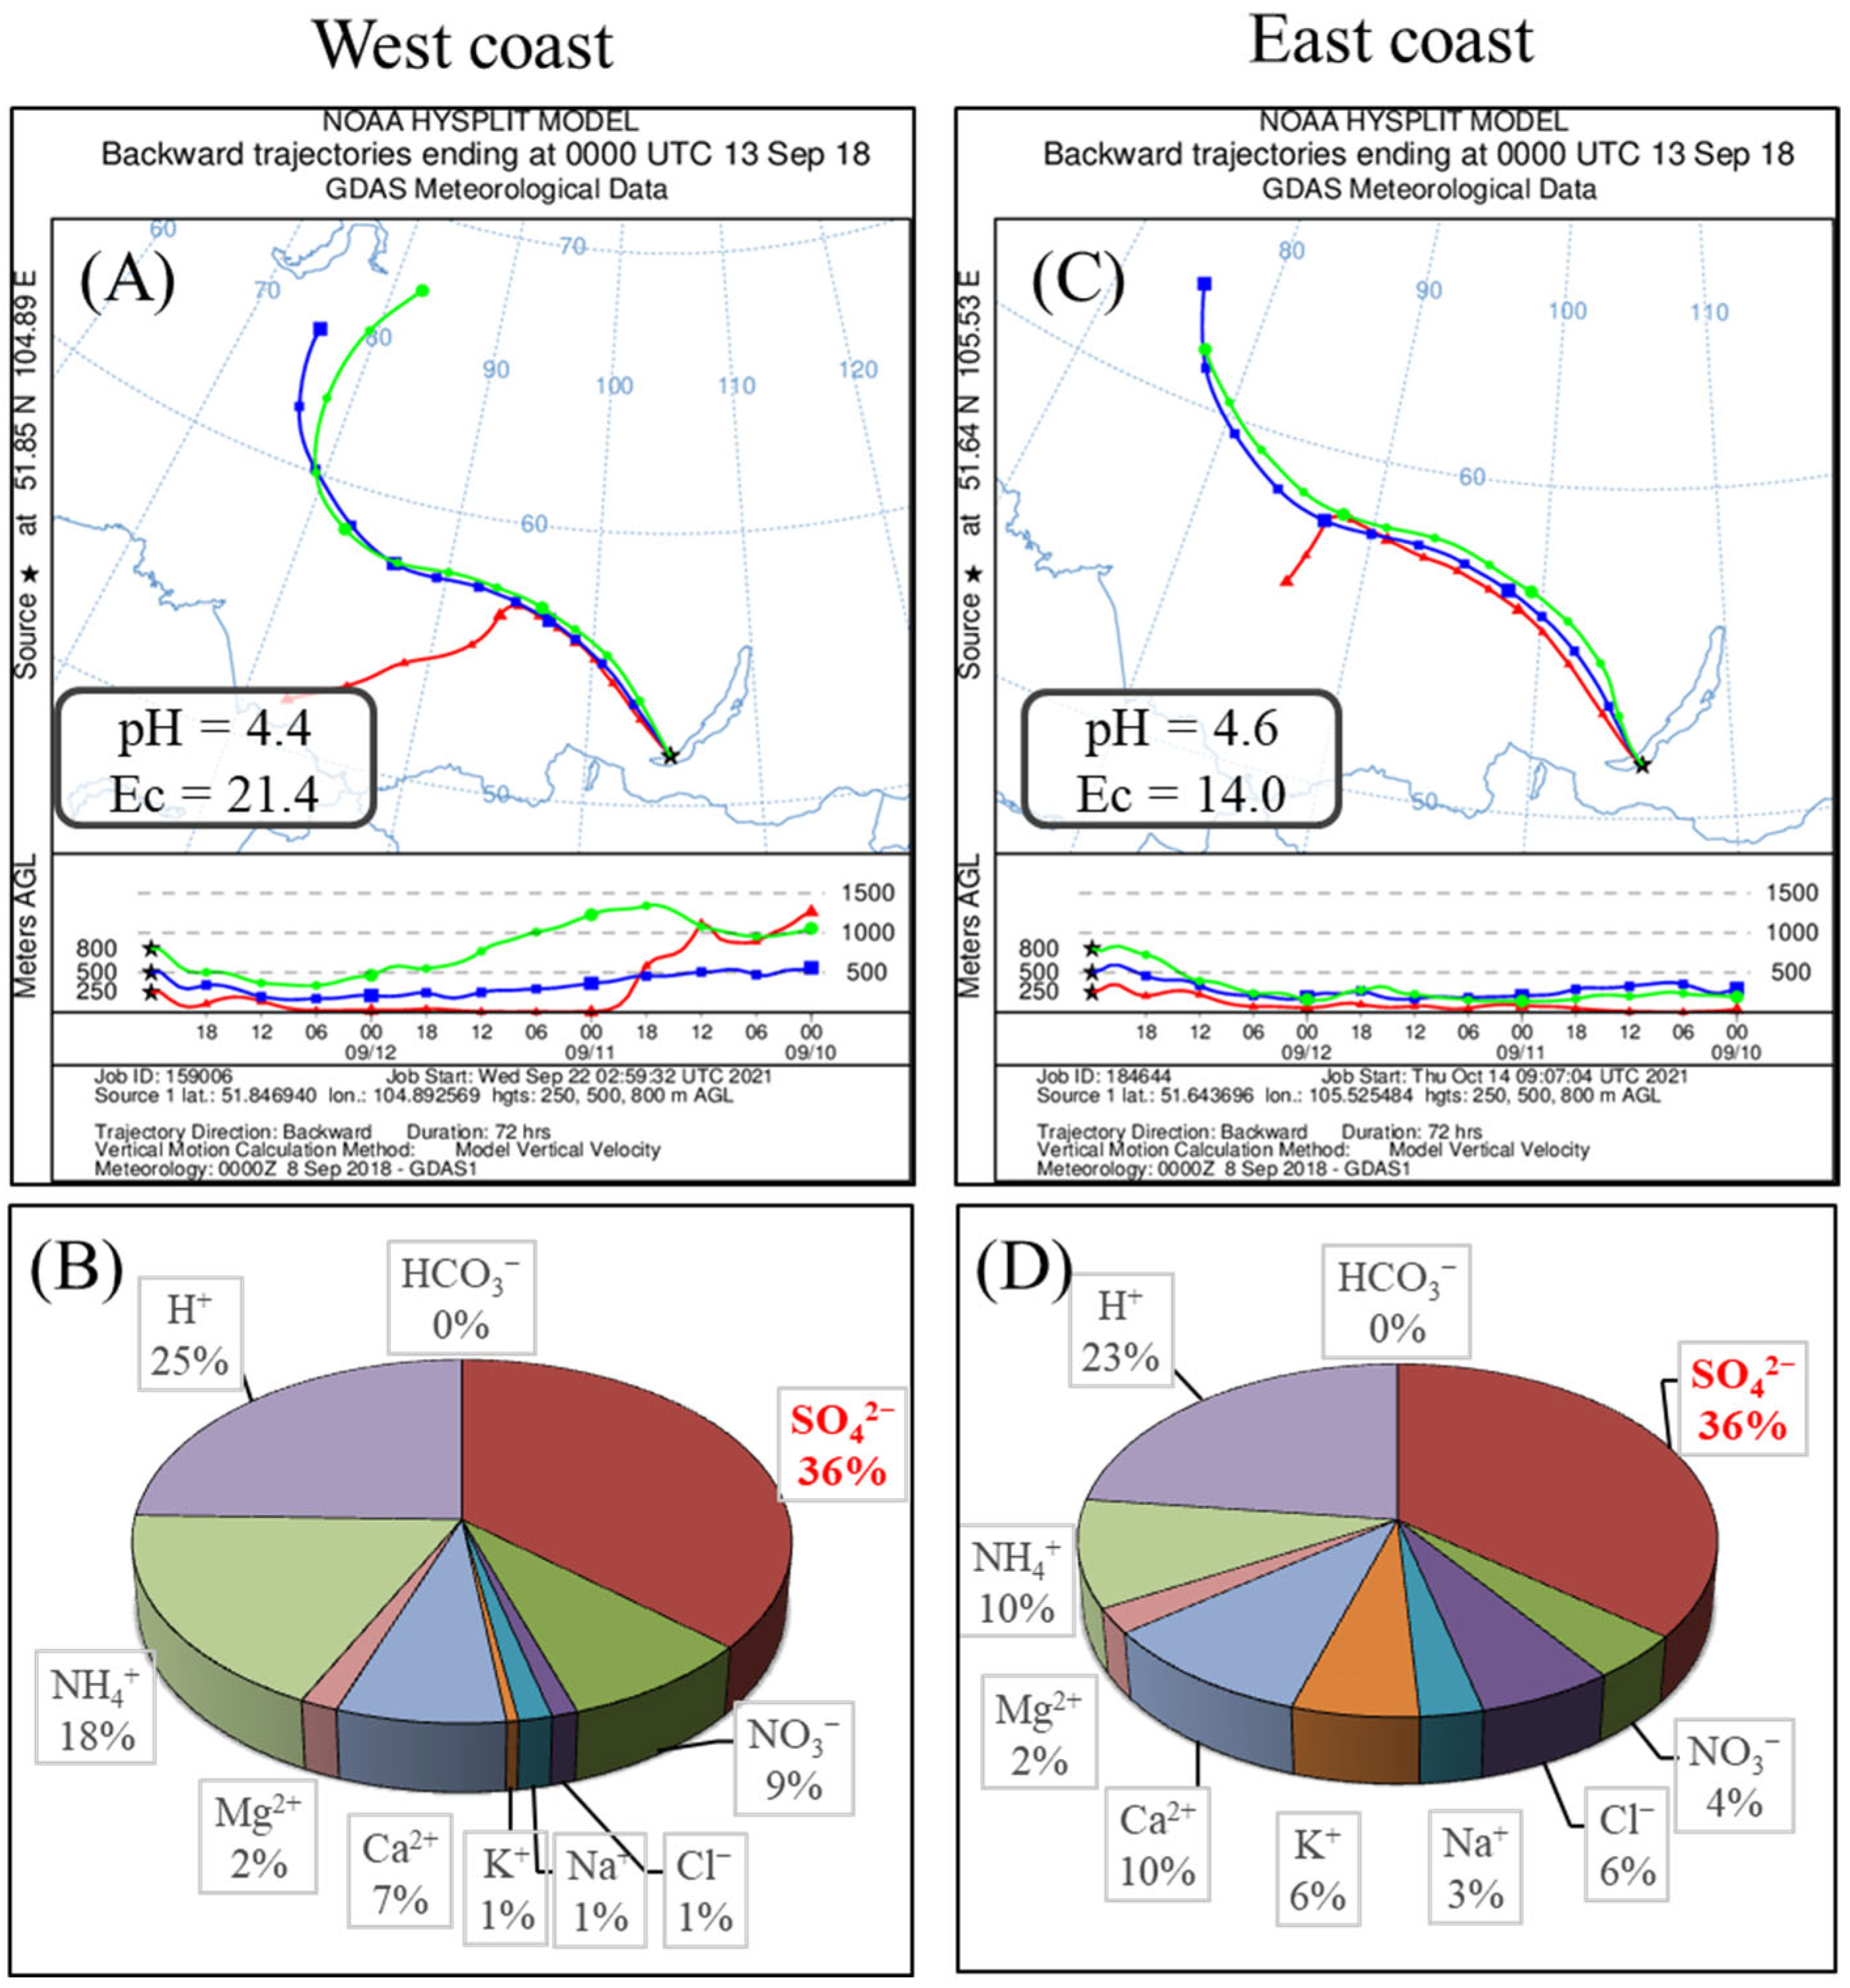
As an example, let us consider several cases of precipitation falling on the coast and water area of South Baikal. Figure 13 shows the case of the arrival of air masses from 13 September 2018, carrying precipitation of the first group to the station. As can be seen from the calculations on the HYSPLIT model (Figure 13), the air masses were formed over the industrial centers of Eastern Siberia. In the relative chemical composition, more than 50% of the total soluble content was composed of SO42−, NH4+, H+, and NO3 ions. The prevalence of these ions indicates the contribution of emissions from industrial enterprises and motor transport to the formation of the chemical composition of atmospheric precipitation.
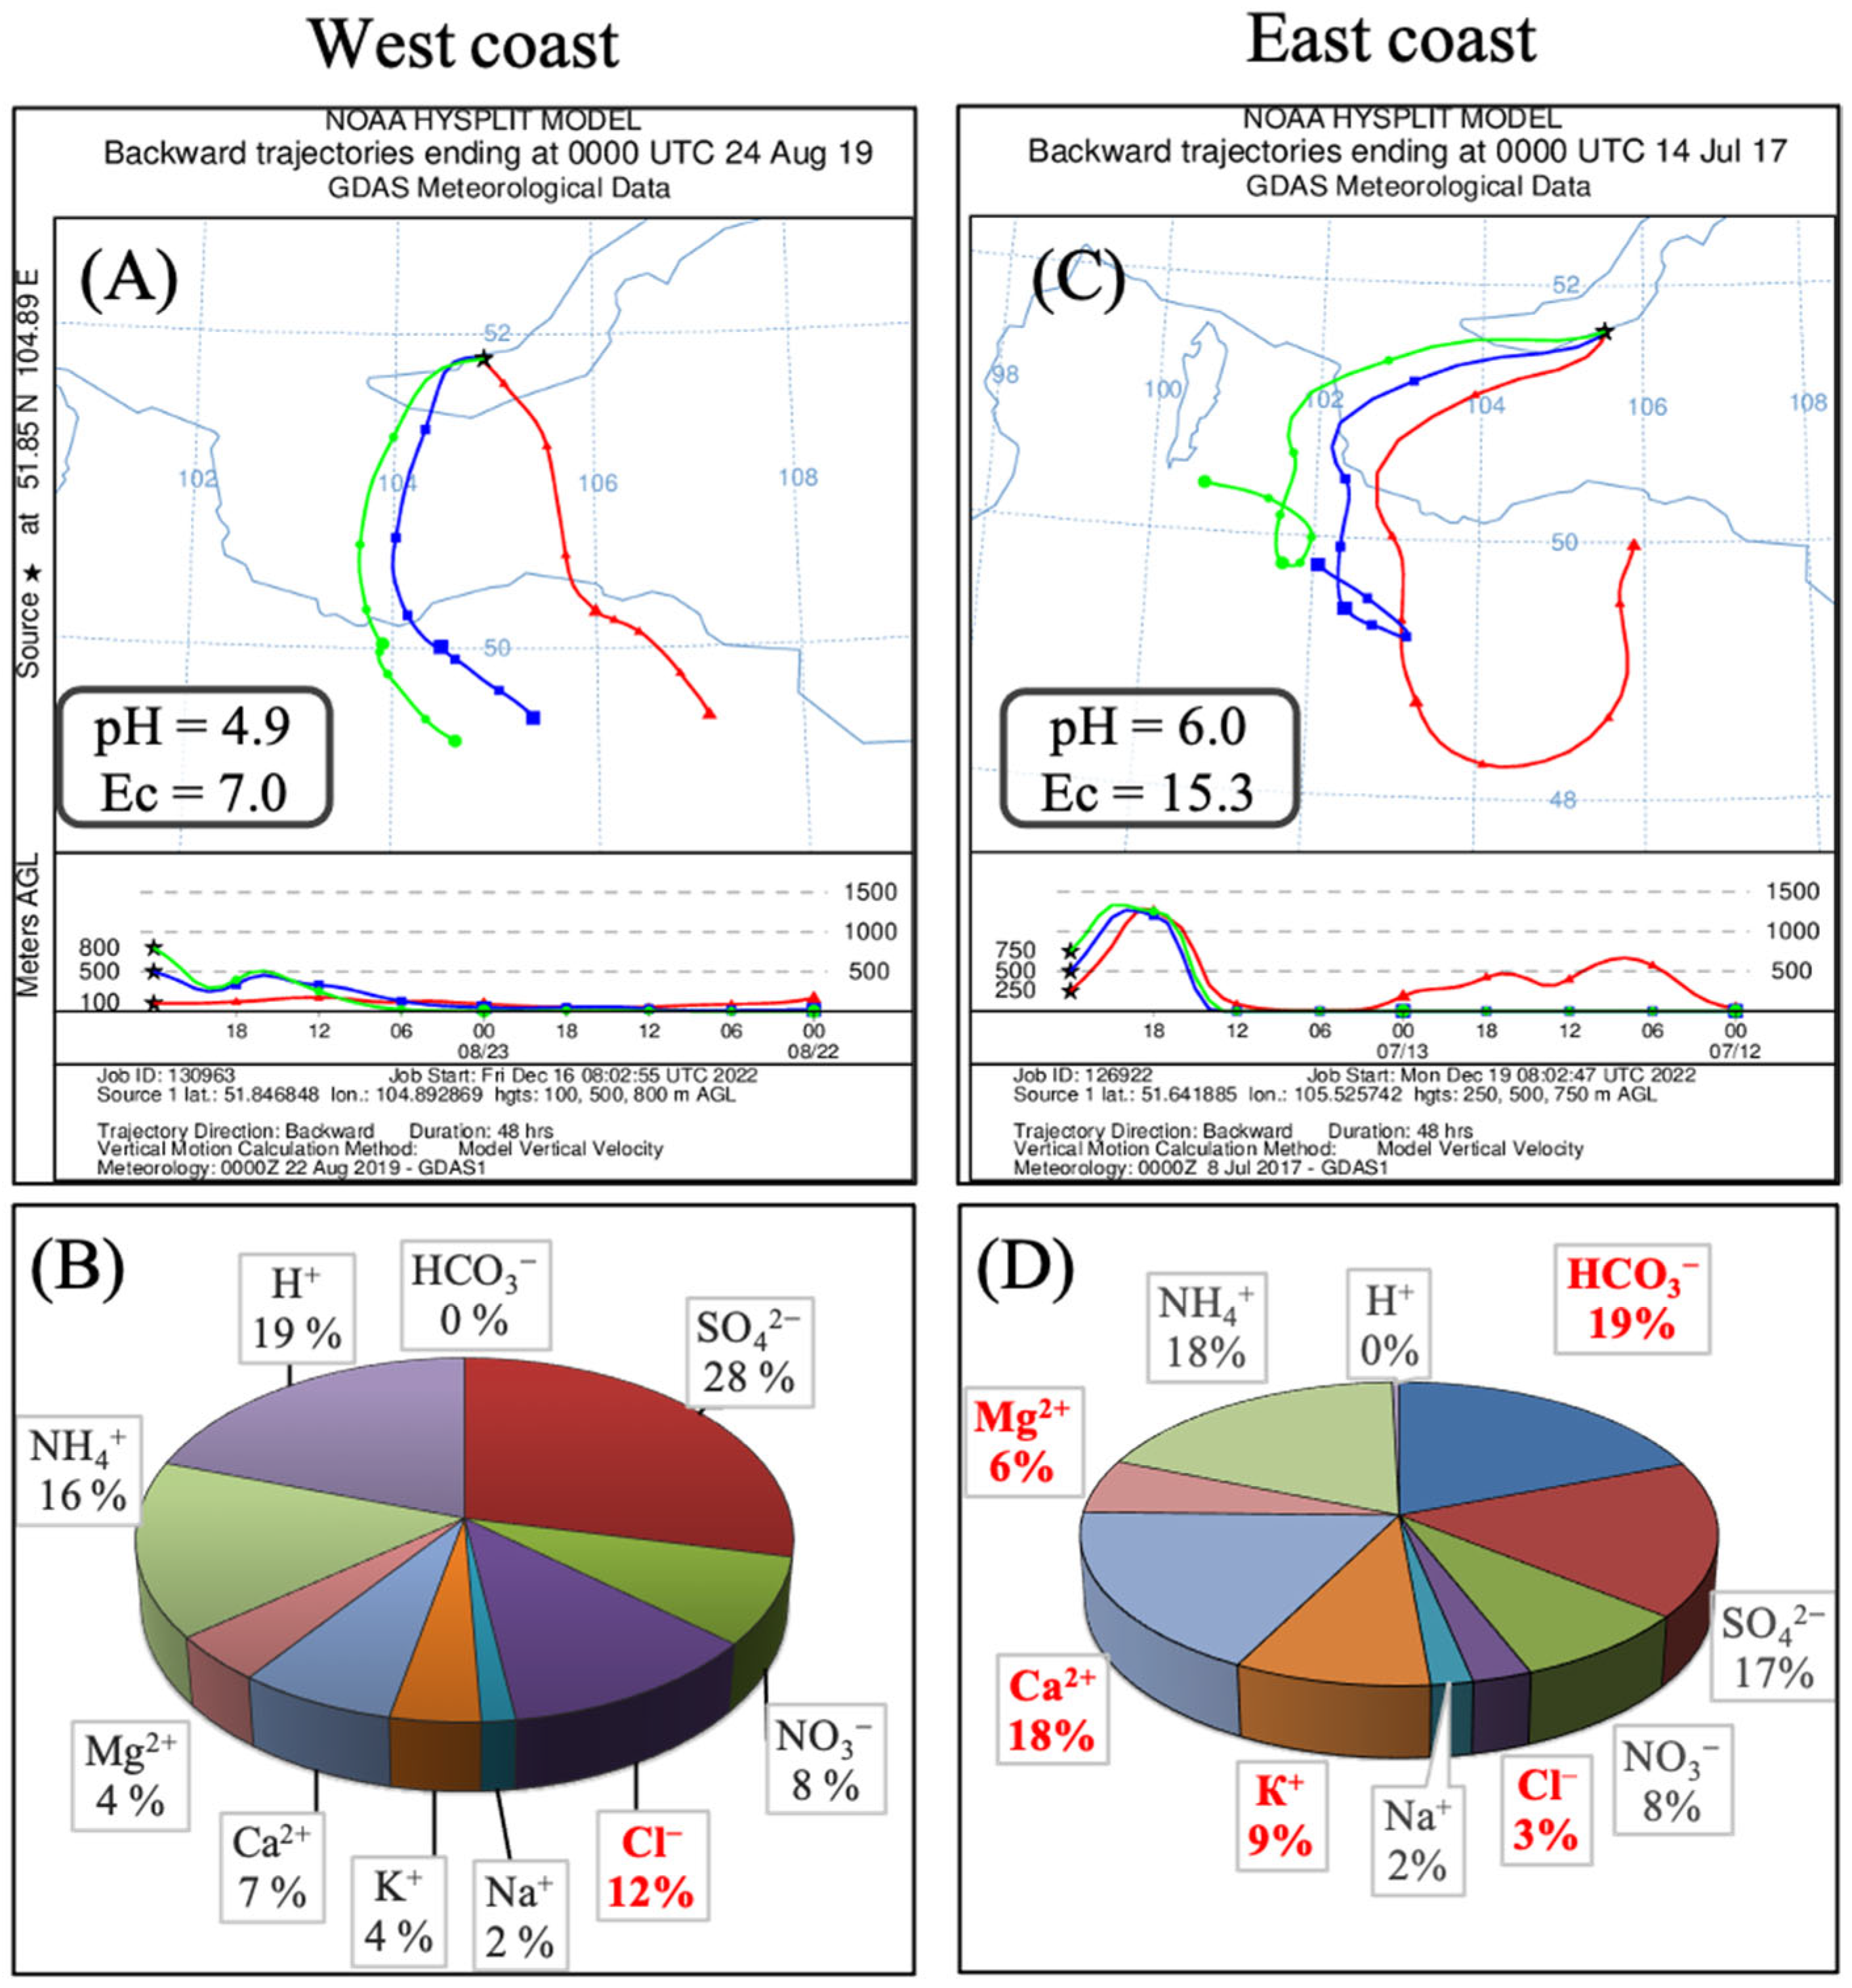
Figure 14A,B shows the case of atmospheric precipitation at the west coast station from 24 August 2019. According to the modeling results, the air masses formed over the territories of Northern Mongolia, and their relative share of Cl is high—12%. As another example of precipitation formed over the territories of Mongolia, consider the data obtained for 14 July 2017 (Figure 14C,D) at the east coast. On this day, the rainfall of the second group was recorded. The chemical composition of this rain was dominated by terrigenous elements—Ca2+, HCO3, Cl, K+, and Mg2+.
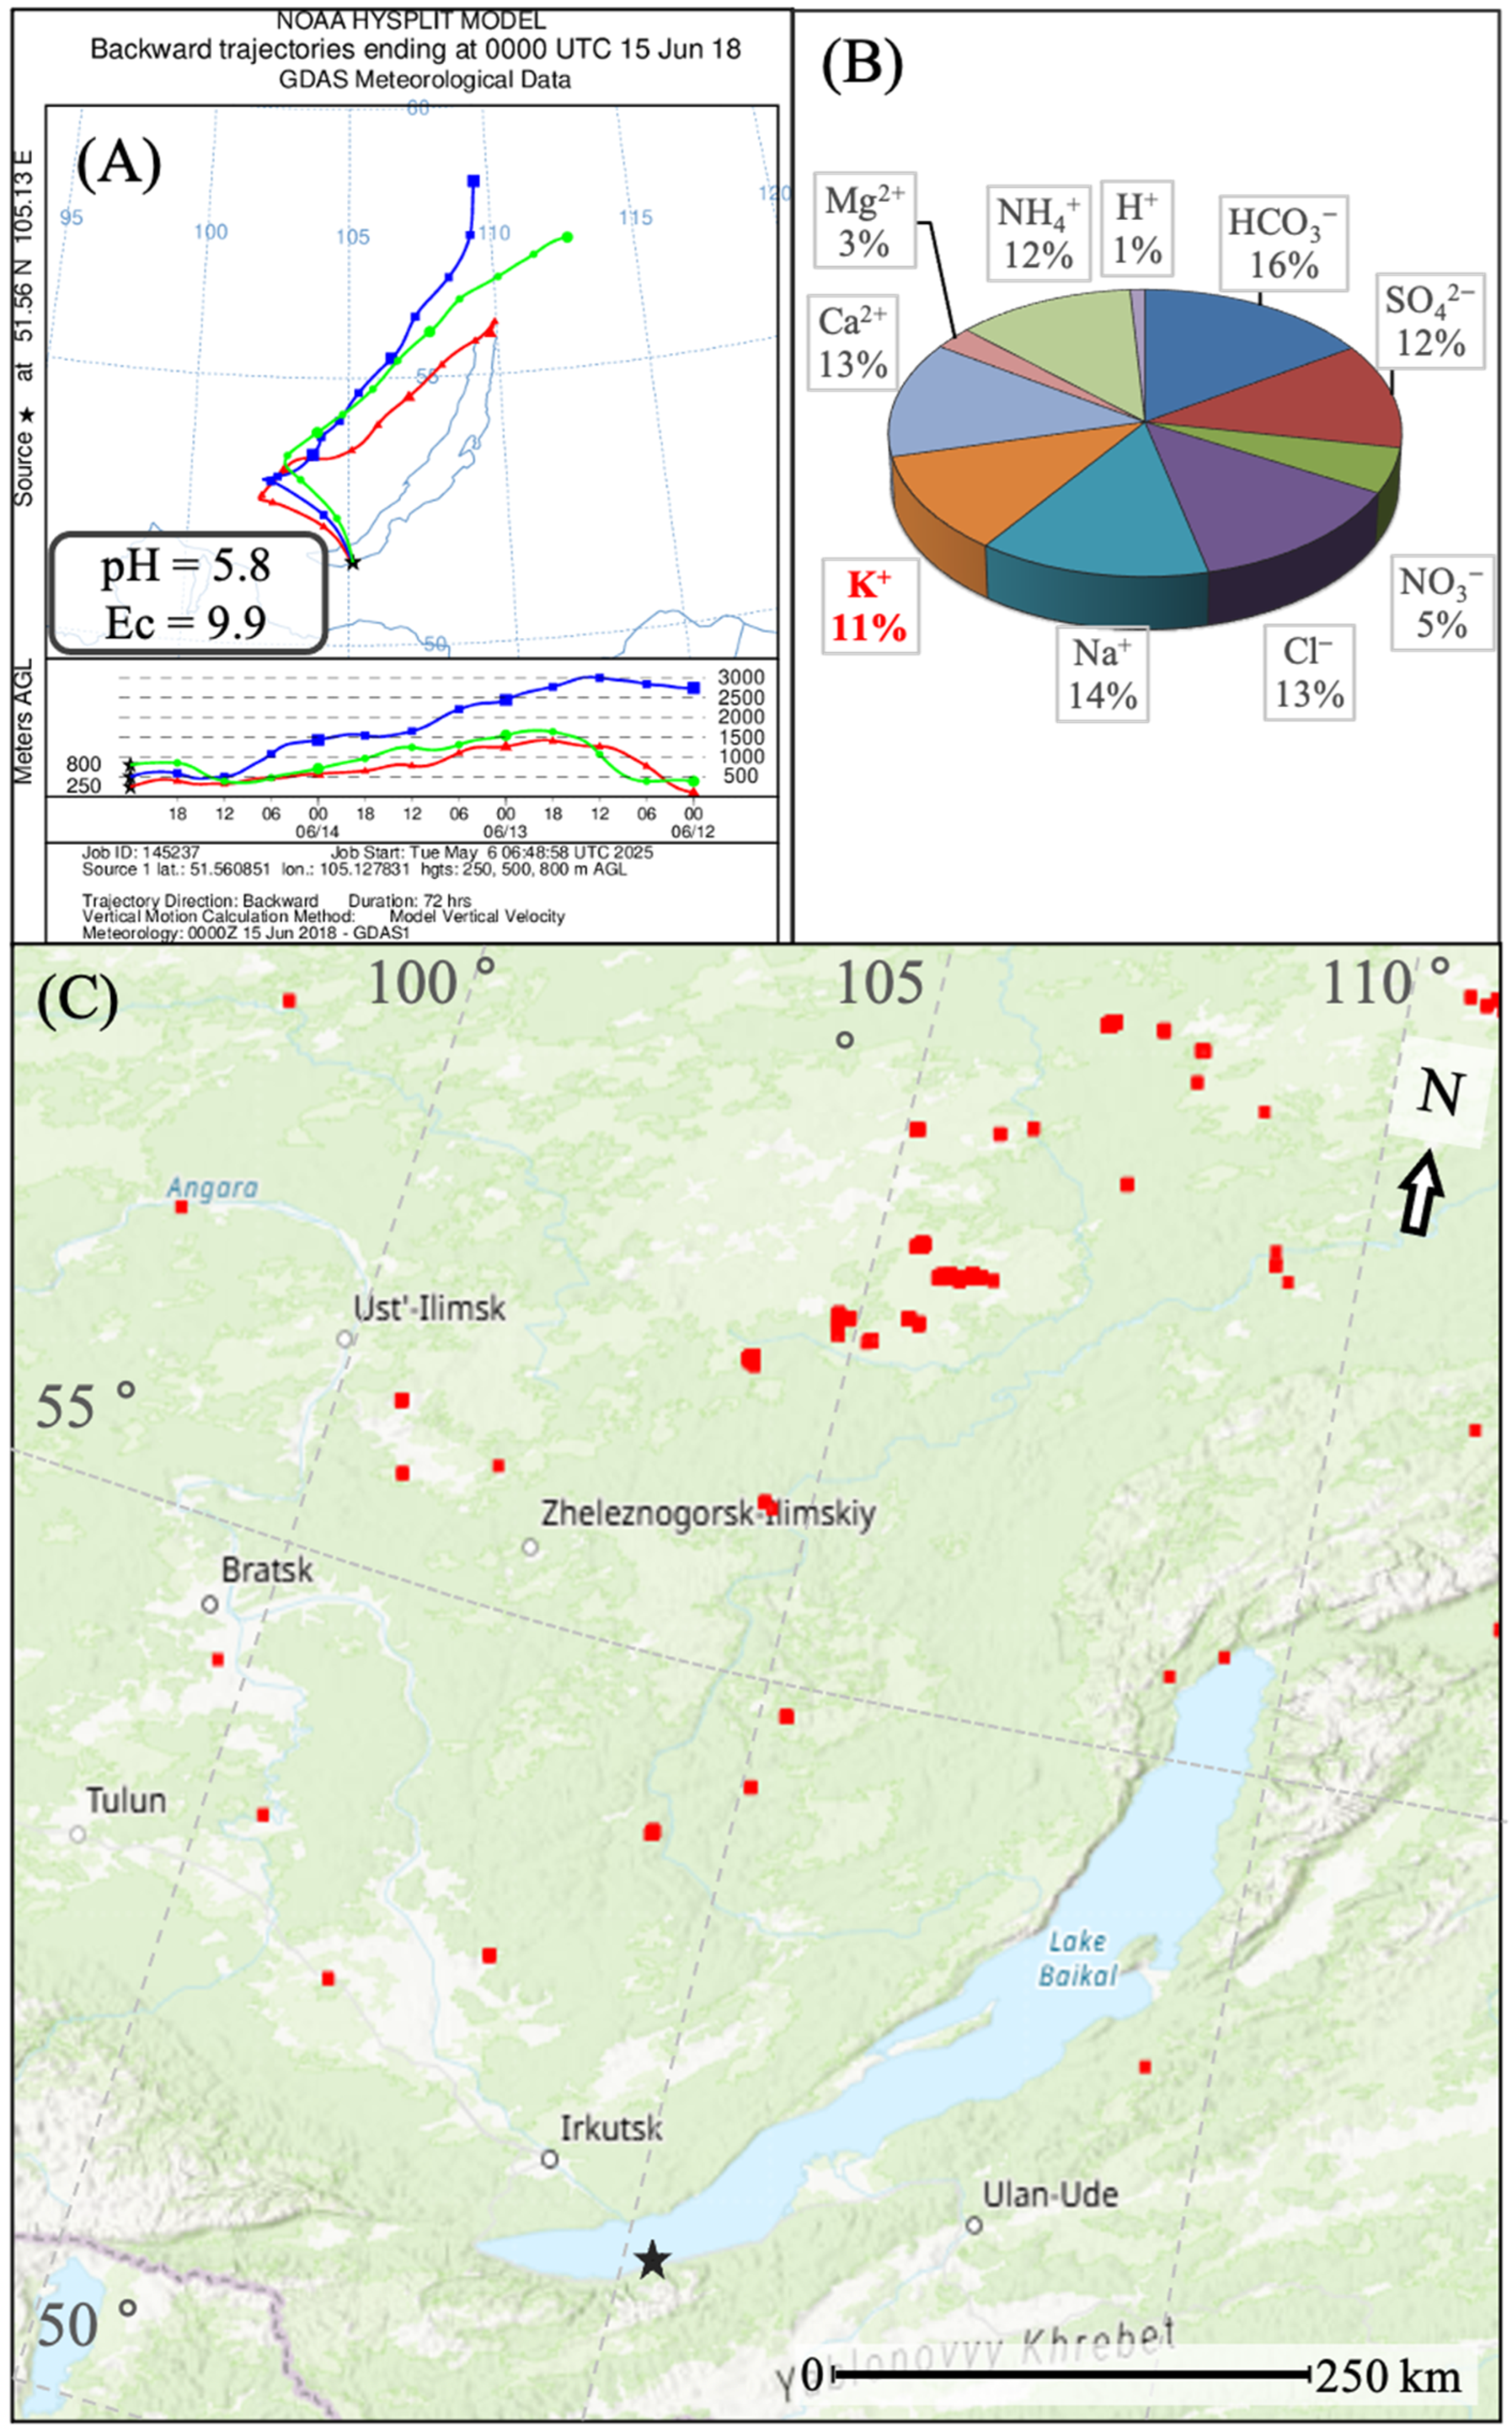
On 15 June 2018, the east coast station (Figure 15) received rainfall that can be classified as Group 4. In the relative chemical composition (Figure 15), the share of K+—wildfire tracer—was 11%. When comparing the calculations of reverse trajectories of air masses for 15 June 2018 (HYSPLIT) and data from maps and the Fire Information for Resource Management System (FIRMS), it can be seen (Figure 15) that air masses passed over areas where large wildfires were recorded at that time.

6. Conclusions

The chemical composition of atmospheric precipitation in the Southern Baikal region is formed under the influence of both local and regional, as well as transboundary, remote sources. The statistical analysis of data on the chemical composition of precipitation allowed us to define “tracer substances” and identify several groups of sources of influence on their formation. Thus, natural processes play a significant role in the composition of precipitation falling on the western coast of the lake, but the share of regional anthropogenic sources in their composition is also high. On the eastern coast, the influence of natural background dominates in precipitation, and anthropogenic sources are less significant. Natural sources contributing to precipitation composition can be divided into soil, vegetation, gas-phase transformations in the atmosphere, and biomass burning during wildfires. Anthropogenic sources are mostly related to the combustion of organic fuel (heat and power facilities, motor transport).
The methodological approach offered in this work and calculations using trajectory analysis allowed us to divide all analyzed precipitation by regions of air mass formation. The composition of atmospheric precipitation in South Baikal was mainly influenced by air masses formed over the industrial centers of Eastern and Western Siberia. The second most significant influence on the composition of precipitation in South Baikal was exerted by air masses coming from the clean northern areas of the Baikal region. At this time, precipitation with a low content of polluting impurities and low pH values occurred. Atmospheric precipitation with an increased content of terrigenous alkaline components enriched in the northern regions of Mongolia and Kazakhstan was least common. Atmospheric precipitation under the influence of smoke plumes from large wildfires contained significant values of trace sulfur element—potassium (K+).
The maps of potential sources of atmospheric pollution obtained using the CWT method for the Southern Baikal region allowed us to identify regions associated with the arrival of “tracer substances” of anthropogenic origin with precipitation in the study area. The submitted method showed satisfactory results for identifying regional sources of atmospheric pollution. High concentrations of anthropogenic components are observed near large cities and industrial centers of Siberia. At the same time, minimum concentrations of substances in precipitation are recorded in air masses coming from remote background areas of the region.
The results obtained in the work emphasize the need for an integrated approach to assessing the state of the air basin of the unique natural object—Lake Baikal—and the role of the atmosphere in its ecosystem. Studying the chemical composition of atmospheric precipitation not only helps to understand the current state of the environment but also provides valuable data for predicting future changes and developing measures to prevent them. With the growing anthropogenic impact on the environment and climate change in the Baikal region, it is especially important to pay attention to such studies in order to preserve the unique ecosystem of the lake for future generations.

Author Contributions

Conceptualization, methodology, data analysis, writing, review and editing, Y.M.; data analysis, digital mapping, review and editing, M.S.; CWT maps of potential sources, V.K.; chemical analyses, O.N.; project administration, review and editing, T.K. All authors have read and agreed to the published version of the manuscript.

Funding

The work was carried out under the theme of the state assignment of the Limnological Institute of the Siberian Branch of the Russian Academy of Sciences No. 0279-2021-0014 “Investigation of the role of atmospheric deposition on aquatic and terrestrial ecosystems of the Lake Baikal basin, identification of sources of atmospheric pollution”. The CWT analysis was carried out with the support of the Ministry of Science and Education of the Russian Federation (Project 124022100081-7) “Geochemical tracers of oceanographic processes and phenomena in the marginal seas of East Asia”.

Institutional Review Board Statement

Not applicable.

Informed Consent Statement

Not applicable.

Data Availability Statement

Data used are available on request from the corresponding author.

Acknowledgments

The authors express their gratitude to the staff of the Baikal State Biosphere Reserve and the Limnological Institute for their assistance in sampling atmospheric precipitation. The authors express their special gratitude to the staff of the Laboratory of Hydrochemistry and Atmospheric Chemistry of the Limnological Institute for part of the chemical analysis of atmospheric precipitation samples.

Conflicts of Interest

The authors declare no conflicts of interest.

References

  1. Bruintjes, R.T. A review of cloud seeding experiments to enhance precipitation and some new prospects. Bull. Am. Meteorol. Soc. 1999, 80, 805–820. [Google Scholar] [CrossRef]
  2. Al Hosari, T.; Al Mandous, A.; Wehbe, Y.; Shalaby, A.; Al Shamsi, N.; Al Naqbi, H.; Farrah, S. The UAE cloud seeding program: A statistical and physical evaluation. Atmosphere 2021, 12, 1013–1030. [Google Scholar] [CrossRef]
  3. Abshaev, A.M.; Flossmann, A.; Siems, S.T.; Prabhakaran, T.; Yao, Z.; Tessendorf, S. Rain enhancement through cloud seeding. In Unconventional Water Resources; Springer: Berlin/Heidelberg, Germany, 2022; pp. 21–49. [Google Scholar]
  4. Szwed, M.; Kozłowski, R. Snow cover as an indicator of dust pollution in the area of exploitation of rock materials in the Świętokrzyskie Mountains. Atmosphere 2022, 13, 409–419. [Google Scholar] [CrossRef]
  5. Zhang, H.; Zhao, Z.; Cai, A.; Liu, B.; Wang, X.; Li, R.; Wang, Q.; Zhao, H. Source apportionment of heavy metals in wet deposition in a typical industry city based on multiple models. Atmosphere 2022, 13, 1716–1732. [Google Scholar] [CrossRef]
  6. Bhaskar, V.V.; Safai, P.D.; Mukherjee, S. Hydrochemistry of atmospheric precipitation over an urban station in the peninsular India: Assessment of the long-term data. Atmos. Pollut. Res. 2022, 13, 101343. [Google Scholar] [CrossRef]
  7. Zeng, J.; Han, G. Rainwater chemistry reveals air pollution in a Karst forest: Temporal variations, source apportionment, and implications for the forest. Atmosphere 2020, 11, 1315–1333. [Google Scholar] [CrossRef]
  8. Górka, M.; Pilarz, A.; Modelska, M.; Drzeniecka-Osiadacz, A.; Potysz, A.; Widory, D. Urban Single Precipitation Events: A Key for Characterizing Sources of Air Contaminants and the Dynamics of Atmospheric Chemistry Exchanges. Water 2024, 16, 3701–3720. [Google Scholar] [CrossRef]
  9. Chudaeva, V.A.; Chudaev, O.V.; Yurchenko, S.G. Features of chemical composition of atmospheric precipitation in the south of the Far East. Water Resour. 2008, 35, 60–71. [Google Scholar] [CrossRef]
  10. Keeler, G.J.; Landis, M.S.; Norris, G.A.; Christianson, E.M.; Dvonch, J.T. Sources of mercury wet deposition in Eastern Ohio, USA. Environ. Sci. Technol. 2006, 40, 5874–5881. [Google Scholar] [CrossRef]
  11. Gorham, E. Acid precipitation and its influence upon aquatic ecosystems—An overview. Water Air Soil Pollut. 1976, 6, 457–481. [Google Scholar] [CrossRef]
  12. Gunn, J.M.; Keller, W. Effects of ice and snow cover on the chemistry of nearshore lake water during spring melt. Ann. Glaciol. 1985, 7, 208–212. [Google Scholar] [CrossRef]
  13. Lovett, G.M.; Tear, T.H.; Evers, D.C.; Findlay, S.E.; Cosby, B.J.; Dunscomb, J.K.; Weathers, K.C. Effects of air pollution on ecosystems and biological diversity in the eastern United States. Ann. N. Y. Acad. Sci. 2009, 1162, 99–135. [Google Scholar] [CrossRef]
  14. Wedin, D.A.; Tilman, D. Influence of nitrogen loading and species composition on the carbon balance of grasslands. Science 1996, 274, 1720–1723. [Google Scholar] [CrossRef]
  15. Gavrilaș, S.; Burescu, F.-L.; Chereji, B.-D.; Munteanu, F.-D. The Impact of Anthropogenic Activities on the Catchment’s Water Quality Parameters. Water 2025, 17, 1791–1815. [Google Scholar] [CrossRef]
  16. Galloway, J.N.; Likens, G.E.; Keene, W.C.; Miller, J.M. The composition of precipitation in remote areas of the world. J. Geophys. Res. Ocean. 1982, 87, 8771–8786. [Google Scholar] [CrossRef]
  17. Kawamura, G.; Bagarinao, T.; Yong, A.S.K.; Chen, C.Y.; Noor, S.N.M.; Lim, L.S. Low pH affects survival, growth, size distribution, and carapace quality of the postlarvae and early juveniles of the freshwater prawn Macrobrachium rosenbergii de Man. Ocean Sci. J. 2015, 50, 371–379. [Google Scholar] [CrossRef]
  18. Baker, J.P.; Bernard, D.P.; Christensen, S.W.; Sale, M.J.; Freda, J.; Heltcher, K.; Warren-Hicks, W. Biological Effects of Changes in Surface Water Acid-Base Chemistry; Oak Ridge National Lab. (ORNL): Oak Ridge, TN, USA, 1990; (No. ORNL/M-1086). [Google Scholar]
  19. Augustaitis, A.; Augustaitienė, I.; Kliučius, A.; Pivoras, G.; Šopauskienė, D.; Girgždienė, R. The seasonal variability of air pollution effects on pine conditions under changing climates. Eur. J. For. Res. 2010, 129, 431–441. [Google Scholar] [CrossRef]
  20. Etzold, S.; Ferretti, M.; Reinds, G.J.; Solberg, S.; Gessler, A.; Waldner, P.; de Vries, W. Nitrogen deposition is the most important environmental driver of growth of pure, even-aged and managed European forests. For. Ecol. Manag. 2020, 458, 117762. [Google Scholar] [CrossRef]
  21. Commission of the European Communities. Communication from the Commission to the European Parliament, the Council, the European Economic and Social Committee and the Committee of the Regions: A Strategy for ICT R&D and Innovation in Europe: Raising the Game; Office for Official Publications of the European Communities: Luxembourg, 2009; Volume 116. [Google Scholar]
  22. Sillmann, J.; Aunan, K.; Emberson, L.; Büker, P.; Van Oort, B.; O’Neill, C.; Brisebois, A. Combined impacts of climate and air pollution on human health and agricultural productivity. Environ. Res. Lett. 2021, 16, 093004. [Google Scholar] [CrossRef]
  23. Elad, Y.; Pertot, I. Climate Change Impacts on Plant Pathogens and Plant Diseases. J. Crop Improv. 2014, 28, 99–139. [Google Scholar] [CrossRef]
  24. Izah, S.C.; Ogwu, M.C.; Shahsavani, A. Air Pollutants in the Context of One Health. In The Handbook of Environmental Chemistry; Springer: Berlin/Heidelberg, Germany, 2024; Volume 134. [Google Scholar]
  25. Sawyer, W.E.; Aigberua, A.O.; Nwodo, M.U.; Akram, M. Overview of Air Pollutants and Their One Health Effects. In Air Pollutants in the Context of One Health: Fundamentals, Sources, and Impacts; Springer: Berlin/Heidelberg, Germany, 2024; pp. 3–30. [Google Scholar]
  26. Khodzher, T.V.; Sorokovikova, L.M. An assessment of the entry of soluble substances from the atmosphere and with the river runoff into Lake Baikal. Geogr. Prir. Resur. 2007, 3, 185–191. [Google Scholar]
  27. Netsvetaeva, O.G.; Chipanina, E.V.; Obolkin, V.A.; Zimnik, E.A.; Sez’ko, N.P.; Lopatina, I.N.; Khodzher, T.V. Peculiarities of chemistry of atmospheric precipitations at stations Listvyanka (Irkutsk region) and Primorskaya Primorye territory. Opt. Atmos. Ocean 2013, 26, 466–471. [Google Scholar]
  28. Urbanaviciene, I.N. Monitoring the state of epiphytic lichen cover in fir forests of the Baikal Reserve. Nat. Baikal Sib. Proc. Nat. Reserves Natsio 2017, 170–179. [Google Scholar]
  29. Mukhin, D.P.; Musatov, K.E.; Alekseev, N.K. Condition of fir plantations of the northern macro-slope of Khamar-Daban. Baikal Nat. Biosph. Reserve 2015, 43, 166–169. [Google Scholar]
  30. Belova, N.A.; Morozova, T.I. Dynamics of forest pathology condition of fir stands of the Baikal Nature Reserve (1983–2015). For. Bull. 2018, 22, 5–15. [Google Scholar]
  31. Tomberg, I.V.; Sorokovikova, L.M.; Netsvetayeva, O.G.; Sezko, N.P.; Zhuchenko, N.A. Chemical composition and acidification trend of snow and tributary waters of South Baikal. Opt. Atmos. Ocean 2016, 29, 516–520. [Google Scholar]
  32. Obolkin, V.; Khodzher, T.; Sorokovikova, L.; Tomberg, I.; Netsvetaeva, O.; Golobokova, L. Effect of long-range transport of sulphur and nitrogen oxides from large coal power plants on acidification of river waters in the Baikal region, East Siberia. Int. J. Environ. Stud. 2016, 73, 452–461. [Google Scholar] [CrossRef]
  33. Obolkin, V.A.; Volkova, E.A.; Ohira, S.I.; Toda, K.; Netsvetaeva, O.G.; Chebunina, N.S.; Nosova, V.V.; Bondarenko, N.A. The role of atmospheric precipitation in the under-ice blooming of endemic dinoflagellate Gymnodinium baicalense var. minor Antipova in Lake Baikal. Limnol. Freshw. Biol. 2019, 345–352. [Google Scholar]
  34. Bondarenko, N.A.; Tomberg, I.V.; Shirokaya, A.A.; Belykh, O.I.; Tikhonova, I.V.; Fedorova, G.A.; Timoshkin, O.A. Dolichospermum lemmermannii (Nostocales) bloom in world’s deepest Lake Baikal (East Siberia): Abundance, toxicity and factors influencing growth. Limnol. Freshw. Biol. 2021, 4, 1101–1110. [Google Scholar] [CrossRef]
  35. Malnik, V.V.; Gorshkova, A.S.; Tomberg, I.V.; Netsvetaeva, O.G.; Molozhnikova, E.V.; Timoshkin, O.A. Coastal Water Quality in Lake Baikal in Bol’shie Koty Bay, Determined by the Effect of Atmospheric Precipitation and the Survival of Indicator Microorganisms. Water Resour. 2024, 51, 267–283. [Google Scholar] [CrossRef]
  36. Svv, D.R.; Al-Rashidi, A.; Sabarathinam, C.; Alsabti, B.; Al-Wazzan, Y.; Kumar, U.S. Temporal and spatial shifts in the chemical composition of urban coastal rainwaters of Kuwait: The role of air mass trajectory and meteorological variables. Sci. Total Environ. 2023, 899, 165649. [Google Scholar] [CrossRef] [PubMed]
  37. Afanasyev, A.N. Water Resources and Water Balance of the Lake Baikal Basin; Science; Siberian Branch: Novosibirsk, USSR, 1976; pp. 1–238. [Google Scholar]
  38. Obolkin, V.A.; Netsvetaeva, O.G.; Golobokova, L.P.; Potemkin, V.L.; Zimnik, E.A.; Filippova, U.G.; Khodzher, T.V. Results of long-term studies of acid deposition in the area of South Baikal. Geogr. Nat. Resour. 2013, 2, 66–73. [Google Scholar]
  39. Potemkina, T.; Potemkin, V. Extreme phenomena in the Lake Baikal basin: Tropical nights and hot days as indicators of climate warming (Eastern Siberia, Russia). Theor. Appl. Climatol. 2024, 155, 6581–6590. [Google Scholar] [CrossRef]
  40. Saneev, B.G.; Ivanova, I.Y.; Maisyuk, E.P.; Tuguzova, T.F.; Ivanov, R.A. Energy infrastructure of the central ecological zone of the Baikal natural territory: Impact on the natural environment and ways to reduce it. Geogr. Nat. Resour. 2016, 5, 218–224. [Google Scholar]
  41. Obolkin, V.; Molozhnikova, E.; Shikhovtsev, M.; Netsvetaeva, O.; Khodzher, T. Sulfur and nitrogen oxides in the atmosphere of Lake Baikal: Sources, automatic monitoring, and environmental risks. Atmosphere 2021, 12, 1348. [Google Scholar] [CrossRef]
  42. Shikhovtsev, M.Y.; Molozhnikova, Y.V.; Obolkin, V.A.; Potemkin, V.L.; Lutskin, E.S.; Khodzher, T.V. Features of Temporal Variability of the Concentrations of Gaseous Trace Pollutants in the Air of the Urban and Rural Areas in the Southern Baikal Region (East Siberia, Russia). Appl. Sci. 2024, 14, 8327. [Google Scholar] [CrossRef]
  43. Sharma, A.; Khare, P.; Singh, N.; Tiwari, S.; Chate, D.M.; Kumar, R. Anthropogenic aerosols in precipitation over the Indo-Gangetic basin. Environ. Geochem. Health 2023, 45, 961–980. [Google Scholar] [CrossRef]
  44. Celle-Jeanton, H.; Travi, Y.; Loÿe-Pilot, M.D.; Huneau, F.; Bertrand, G. Rainwater chemistry at a Mediterranean inland station (Avignon, France): Local contribution versus long-range supply. Atmos. Res. 2009, 91, 118–126. [Google Scholar] [CrossRef]
  45. Norwegian Institute for Air Research. EMEP Manual for Sampling and Chemical Analysis; Norwegian Institute for Air Research: Kjeller, Norway, 1995; p. 303. [Google Scholar]
  46. EANET. Technical Manual for Wet Deposition Monitoring in East Asia; Network Center for EANET Press: Niigata, Japan, 2010; p. 113. [Google Scholar]
  47. Mathur, K. A Step-by-Step Guide to Exploratory Factor Analysis; Vidya Books: Meerut, India, 2022. [Google Scholar]
  48. Draxler, R.R.; Hess, G.D. An overview of the HYSPLIT_4 modelling system for trajectories. Aust. Meteorol. Mag. 1998, 47, 295–308. [Google Scholar]
  49. Stein, A.F.; Draxler, R.R.; Rolph, G.D.; Stunder, B.J.; Cohen, M.D.; Ngan, F. NOAA’s HYSPLIT atmospheric transport and dispersion modeling system. Bull. Am. Meteorol. Soc. 2015, 96, 2059–2077. [Google Scholar] [CrossRef]
  50. Hsu, Y.K.; Holsen, T.M.; Hopke, P.K. Comparison of hybrid receptor models to locate PCB sources in Chicago. Atmos. Environ. 2003, 37, 545–562. [Google Scholar] [CrossRef]
  51. Li, C.; Ling, X.; Liu, W.; Tang, Z.; Zhuang, Q.; Fang, M. Long-Term Spatiotemporal Variability and Source Attribution of Aerosols over Xinjiang, China. Remote Sens. 2025, 17, 2207–2228. [Google Scholar] [CrossRef]
  52. Hu, K.; Liao, H.; Liu, D.; Jin, J.; Chen, L.; Li, S.; Zhao, D. A Novel Method for Quantifying the Contribution of Regional Transport to PM2.5 in Beijing (2013–2020): Combining Machine Learning with Concentration-Weighted Trajectory Analysis. Geosci. Model Dev. Discuss. 2024, 8, 1–20. [Google Scholar] [CrossRef]
  53. Ghosh, S.; Biswas, J.; Guttikunda, S.; Roychowdhury, S.; Nayak, M. An investigation of potential regional and local source regions affecting fine particulate matter concentrations in Delhi, India. J. Air Waste Manag. Assoc. 2015, 65, 218–231. [Google Scholar] [CrossRef]
  54. Molozhnikova, Y.V.; Shikhovtsev, M.Y.; Netsvetaeva, O.G.; Khodzher, T.V. Ecological Zoning of the Baikal Basin Based on the Results of Chemical Analysis of the Composition of Atmospheric Precipitation Accumulated in the Snow Cover. Appl. Sci. 2023, 13, 8171. [Google Scholar] [CrossRef]
  55. Semenov, M.Y.; Silaev, A.V.; Semenov, Y.M.; Begunova, L.A.; Semenov, Y.M. Identifying and characterizing critical source areas of organic and inorganic pollutants in urban agglomeration in Lake Baikal watershed. Sustainability 2022, 14, 14827. [Google Scholar] [CrossRef]
  56. Dadashazar, H.; Ma, L.; Sorooshian, A. Sources of pollution and interrelationships between aerosol and precipitation chemistry at a central California site. Sci. Total Environ. 2019, 651, 1776–1787. [Google Scholar] [CrossRef]
  57. Talovskaya, A.V.; Adil’bayeva, T.E.; Yazikov, E.G. Monitoring For Elemental Composition Of Particulate Matter Deposited In Snow Cover Around Coal-Fired Thermal Power Plant Karaganda, Central Kazakhstan. Geogr. Environ. Sustain. 2024, 16, 180–192. [Google Scholar] [CrossRef]
  58. Sun, S.; Liu, S.; Li, L.; Zhao, W. Components, acidification characteristics, and sources of atmospheric precipitation in Beijing from 1997 to 2020. Atmos. Environ. 2021, 266, 118707. [Google Scholar] [CrossRef]
  59. Brugnone, F.; D’Alessandro, W.; Parello, F.; Liotta, M.; Bellomo, S.; Prano, V.; Li Vigni, L.; Sprovieri, M.; Calabrese, S. Atmospheric Deposition around the Industrial Areas of Milazzo and Priolo Gargallo (Sicily–Italy)—Part A: Major Ions. Int. J. Environ. Res. Public Health 2023, 20, 3898–3923. [Google Scholar] [CrossRef]
  60. Cheng, I.; Xu, X.; Zhang, L. Overview of receptor-based source apportionment studies for speciated atmospheric mercury. Atmos. Chem. Phys. 2015, 15, 7877–7895. [Google Scholar] [CrossRef]
  61. Amato, F.; Viana, M.; Richard, A.; Furger, M.; Prévôt, A.S.H.; Nava, S.; Lucarelli, F.; Bukowiecki, N.; Alastuey, A.; Reche, C.; et al. Size and time-resolved roadside enrichment of atmospheric particulate pollutants. Atmos. Chem. Phys. 2011, 11, 2917–2931. [Google Scholar] [CrossRef]
  62. Sricharoenvech, P.; Edwards, R.; Yaşar, M.; Gay, D.A.; Schauer, J. Understanding the origin of wet deposition black carbon in North America during the fall season. Environments 2025, 12, 58. [Google Scholar] [CrossRef]
  63. Anselmo-Moreira, F.; da Silva Pedrosa, G.; da Silva, I.L.; do Nascimento, A.; dos Santos, T.C.; Catharino, E.L.M.; de Souza, S.R. Biogenic volatile organic compound (BVOC) emission profiles from native Atlantic Forest trees: Seasonal variation and atmospheric implications in southeastern Brazil. Urban For. Urban Green. 2025, 104, 128645. [Google Scholar] [CrossRef]
  64. Charron, A.; Plaisance, H.; Sauvage, S.; Coddeville, P.; Galloo, J.C.; Guillermo, R. A Methodology for Examining the Long-Range Transport and the Source-Receptor Relationships for Acidic Pollutants; WIT Transactions on Ecology and the Environment; WIT Press: Billerica, MA, USA, 2024; Volume 37. [Google Scholar]
  65. Cao, Y.Z.; Wang, S.; Zhang, G.; Luo, J.; Lu, S. Chemical characteristics of wet precipitation at an urban site of Guangzhou, South China. Atmos. Res. 2009, 94, 462–469. [Google Scholar] [CrossRef]
  66. Bani, P.; Oppenheimer, C.; Tsanev, V.; Scaillet, B.; Primulyana, S.; Saing, U.B.; Marlia, M. Modest volcanic SO2 emissions from the Indonesian archipelago. Nat. Commun. 2022, 13, 3366–3381. [Google Scholar] [CrossRef]
  67. Heo, J.; McGinnis, J.E.; de Foy, B.; Schauer, J.J. Identification of potential source areas for elevated PM2.5, nitrate and sulfate concentrations. Atmos. Environ. 2013, 71, 187–197. [Google Scholar] [CrossRef]
  68. Duan, F.; Liu, X.; Yu, T.; Cachier, H. Identification and estimate of biomass burning contribution to the urban aerosol organic carbon concentrations in Beijing. Atmos. Environ. 2004, 38, 1275–1282. [Google Scholar] [CrossRef]
  69. Golobokova, L.P.; Khodzher, T.V.; Zhamsueva, G.S.; Zayakhanov, A.S.; Starikov, A.; Khuriganova, O.I. Variability of the chemical composition of the atmospheric aerosol in the coastal zone of the southern basin of Lake Baikal (East Siberia, Russia). Atmosphere 2022, 13, 1090. [Google Scholar] [CrossRef]
  70. State Report. On the State and Protection of the Environment of the Russian Federation in 2023; Ministry of Natural Resources and Environment of Russia: Moscow, Russia, 2024. [Google Scholar]
  71. Osipova, O.P.; Osipov, E.Y. Atmospheric circulation processes and precipitation regime in the Northern Part of the Baikal Mountain Region. Russ. Meteorol. Hydrol. 2019, 44, 695–703. [Google Scholar] [CrossRef]
  72. Antokhina, O.Y.; Antokhin, P.N.; Devyatova, E.V.; Mordvinov, V.I. Main precipitation regimes in the south of Eastern Siberia and Mongolia in July. Atmos. Ocean Opt. 2018, 31, 443–450. [Google Scholar]
  73. Vinogradova, G.M.; Zavalishin, N.N.; Kuzin, V.I. Intra-century climate changes in Eastern Siberia. Atmos. Ocean Opt. 2002, 15, 408–411. [Google Scholar]
  74. Shimaraev, M.N.; Starygina, L.N. Zonal atmospheric circulation, climate and hydrological processes in Baikal (1968–2007). Geogr. Nat. Resour. 2010, 3, 62–84. [Google Scholar] [CrossRef]
  75. Shikhovtsev, A.Y. Reference optical turbulence characteristics at the Large Solar Vacuum Telescope site. Publ. Astron. Soc. Jpn. 2024, 76, 538–549. [Google Scholar] [CrossRef]
  76. Shikhovtsev, A.Y.; Kovadlo, P.G.; Lezhenin, A.A.; Gradov, V.S.; Zaiko, P.O.; Khitrykau, M.A.; Shikhovtsev, M.Y. Simulating atmospheric characteristics and daytime astronomical seeing using Weather Research and Forecasting Model. Appl. Sci. 2023, 13, 6354. [Google Scholar] [CrossRef]
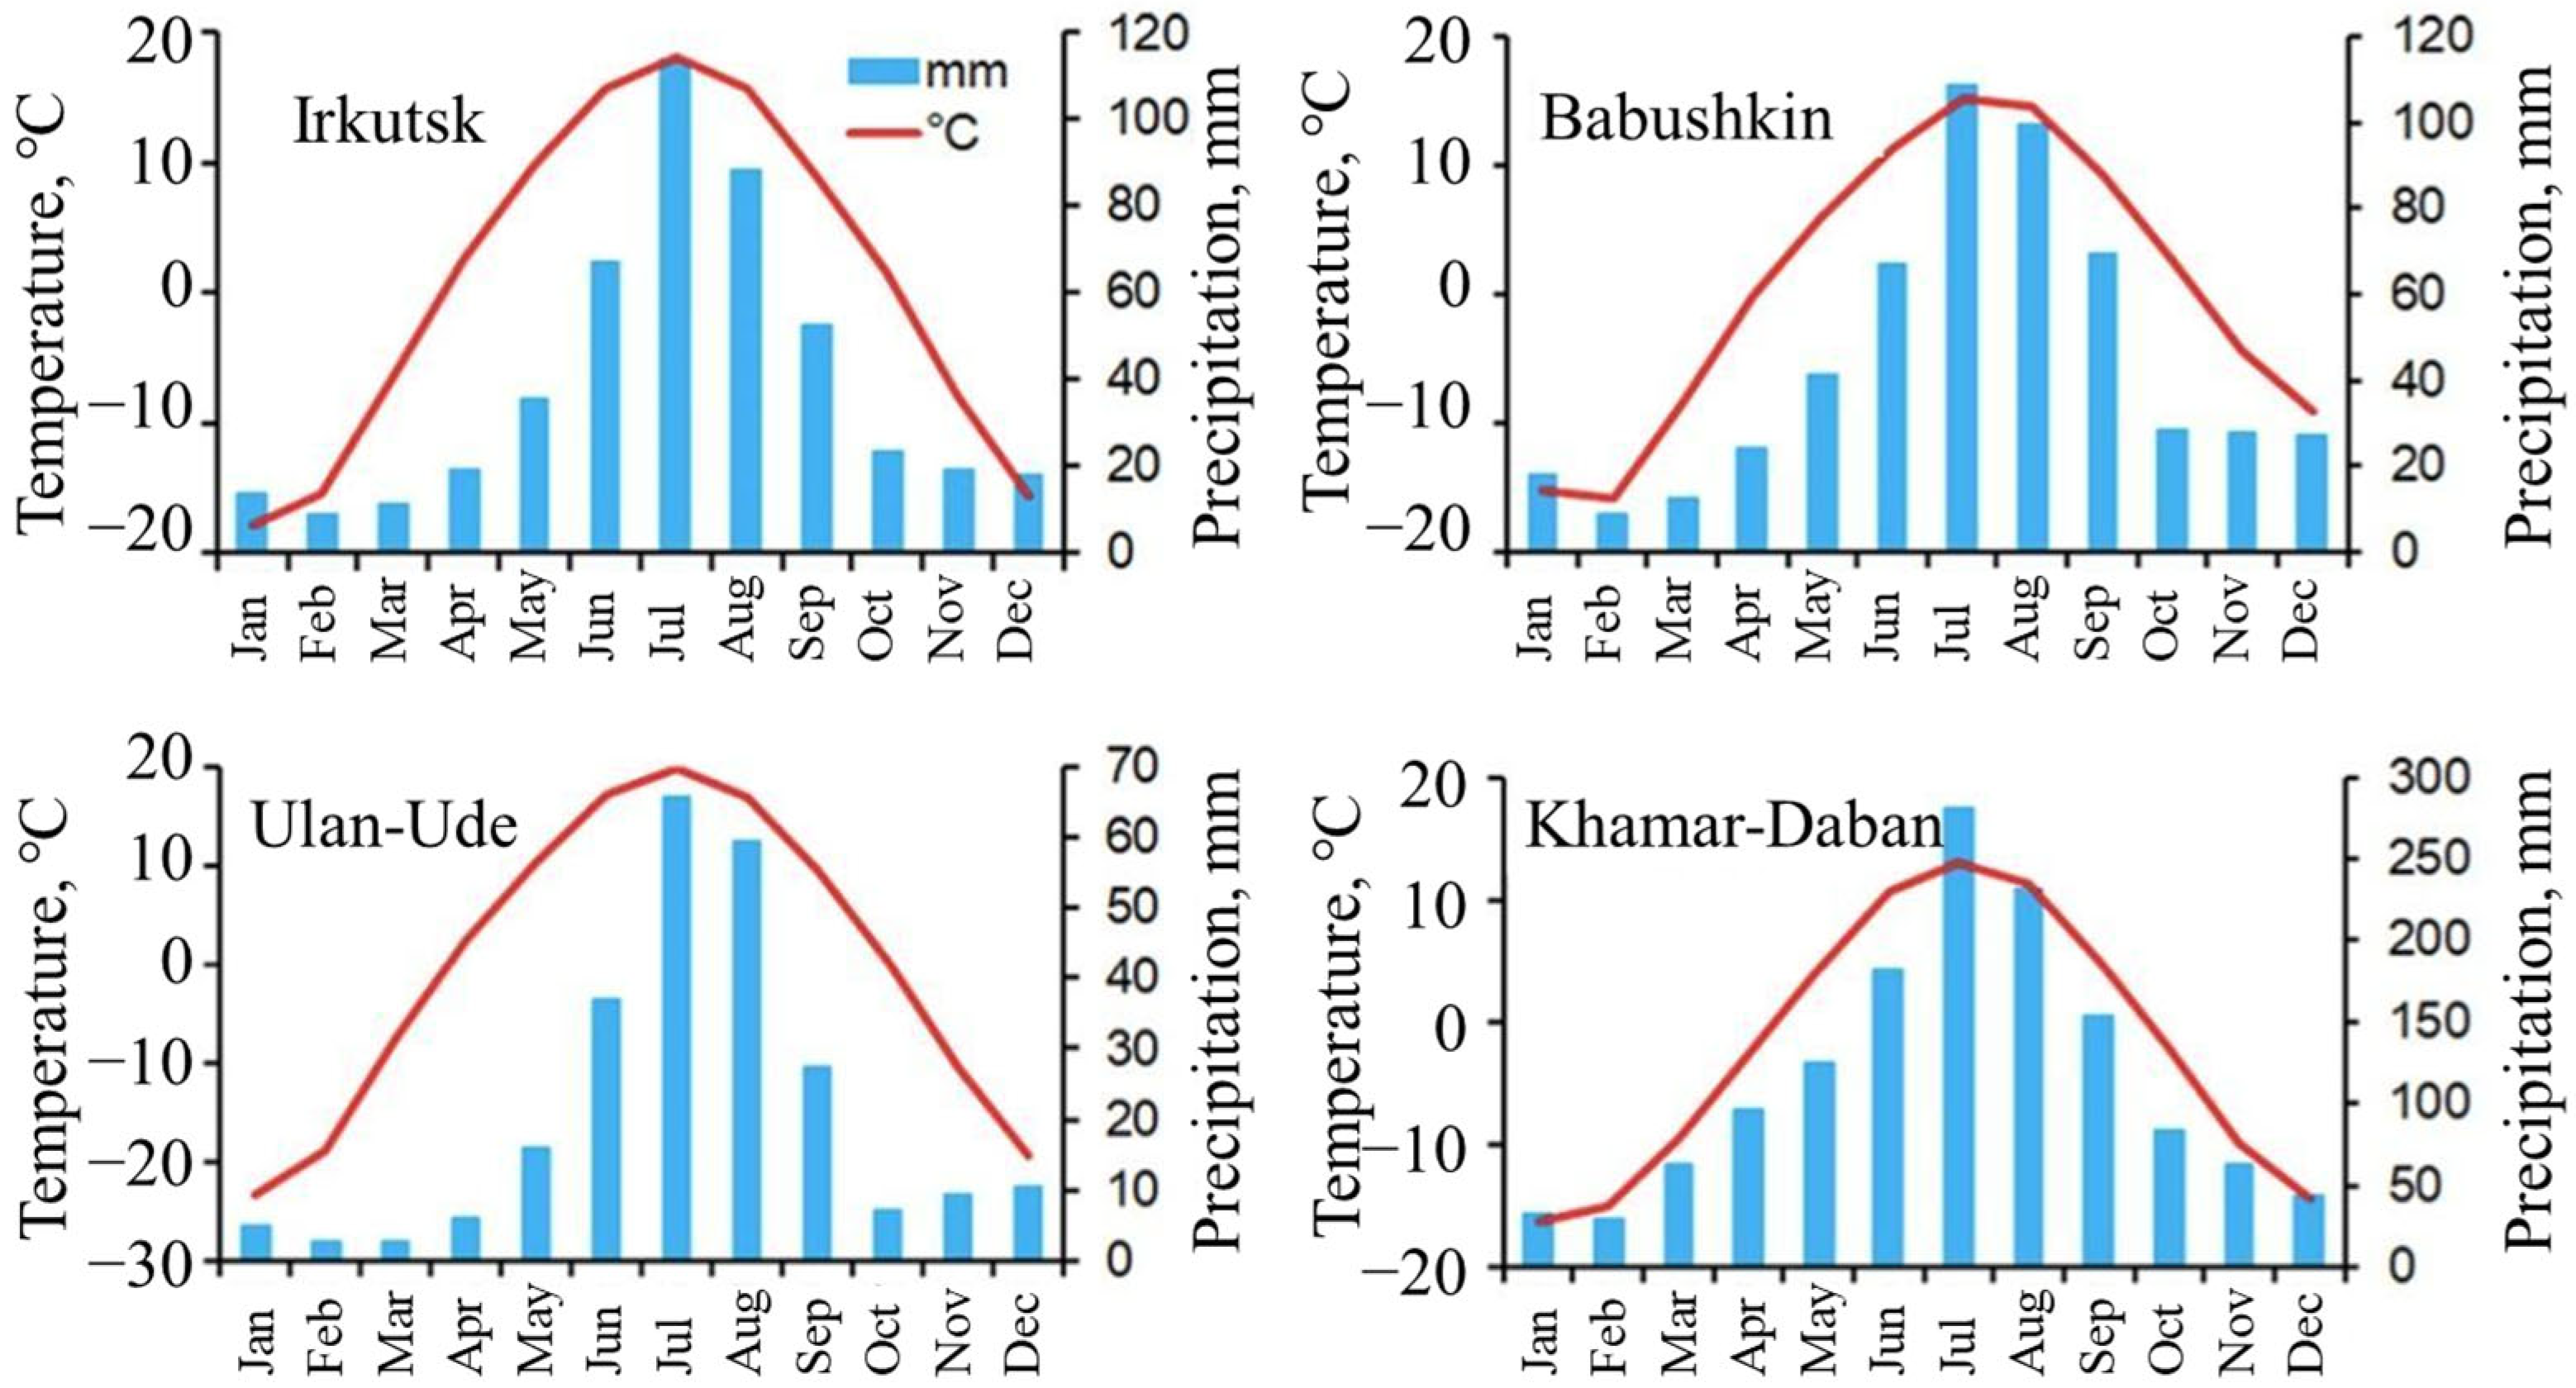
Figure 1. Intra-annual distribution of mean monthly air temperature and monthly precipitation amounts in South Baikal region [39].
Sustainability 17 06062 g001
Figure 2. Location of major stationary sources of atmospheric pollution and location of precipitation monitoring stations in the South Baikal CEZ.
Sustainability 17 06062 g002
Figure 3. Concentrations of major ions in precipitation falling on the western and eastern coasts of South Baikal during the period 2017–2024.
Sustainability 17 06062 g003
Figure 4. Factor loadings (on the ordinate axis) calculated for precipitation sampled at the monitoring stations of the western and eastern coasts of South Baikal in 2017–2024.
Sustainability 17 06062 g004
Figure 5. Back trajectories of air mass transport to the southern coast and Lake Baikal, divided by four main factors of precipitation formation.
Sustainability 17 06062 g005
Figure 6. Classification of atmospheric precipitation in South Baikal based on measurements of its chemical composition and reverse trajectories of air masses, 2017–2024.
Sustainability 17 06062 g006
Figure 7. CWT analysis of SO42− concentration in precipitation falling on the territory of the Southern Baikal region in 2017–2024.
Sustainability 17 06062 g007
Figure 8. CWT analysis of NO3 concentration in atmospheric precipitation falling on the territory of the Southern Baikal region in 2017–2024.
Sustainability 17 06062 g008
Figure 9. CWT analysis of Ca2+ concentration in atmospheric precipitation falling on the territory of the Southern Baikal region in 2017–2024.
Sustainability 17 06062 g009
Figure 10. CWT analysis of K+ concentration in precipitation falling on the territory of the Southern Baikal region in 2017–2024.
Sustainability 17 06062 g010
Figure 11. CWT analysis of HCO3 concentration in precipitation falling on the territory of the Southern Baikal region in 2017–2024.
Sustainability 17 06062 g011
Figure 12. CWT analysis of Cl concentration in precipitation falling on the territory of the Southern Baikal region in 2017–2024.
Sustainability 17 06062 g012
Figure 13. Example of type I precipitation at sampling stations on the west coast and the east coast. (A,C) Calculation of trajectories of air masses that brought precipitation, HYSPLIT model. The calculation of backward trajectories was performed for altitudes of 800 (red), 1500 (green), and 2000 m above the ground (blue line); (B,D) relative content in precipitation, % equivalent.
Sustainability 17 06062 g013
Figure 14. Example of type II precipitation at sampling stations. West coast and east coast (A,C) calculation of trajectories of air masses that brought precipitation, HYSPLIT model. The calculation of backward trajectories was performed for altitudes of 800 (red), 1500 (green), and 2000 m above the ground (blue line); (B,D) relative ion content in precipitation, % equivalent.
Sustainability 17 06062 g014
Figure 15. Example of type IV precipitation at east coast sampling station. (A) Calculation of trajectories of air masses that brought precipitation, HYSPLIT model. The calculation of backward trajectories was performed for altitudes of 800 (red), 1500 (green), and 2000 m above the ground (blue line); (B) relative ion content in precipitation, % equivalent; (C) data from maps and Fire Information for Resource Management System (FIRMS) systems.
Sustainability 17 06062 g015
Disclaimer/Publisher’s Note: The statements, opinions and data contained in all publications are solely those of the individual author(s) and contributor(s) and not of MDPI and/or the editor(s). MDPI and/or the editor(s) disclaim responsibility for any injury to people or property resulting from any ideas, methods, instructions or products referred to in the content.