1. Introduction
The increasing demand for power at the consumer end has led to the automation of power distribution systems and to the prediction of power demand that changes continuously over time [
1]. A continuous and reliable power supply is of central importance for modern infrastructure. Despite that, secondary power distribution networks in developing countries are affected by unexplained blackouts, ignored power outages, excessive power losses, and delayed fault response [
2]. Socio-economic progress is hindered by this problem, and sustainable and adoptable decentralized solutions are being sought. The need for more efficient and reliable power distribution has also made researchers find ways to detect and remove faults more efficiently [
3]. Previously, centralized systems were used for the automation of power transmission and distribution networks. Centralized systems are efficient in handling large networks, but they are not effective in secondary power distribution due to its complexity and diversity [
4]. This problem is more prominent in developing countries, where the distribution system is not well structured or well planned and lacks a proper repair and maintenance system [
5]. The secondary power distribution system is directly linked to the consumer end is most vulnerable to faults; this part of the network experiences surge and non-surge faults, resulting in power downtime [
6].
Recently, significant progress has been made in developing more efficient and reliable techniques to detect, isolate, and restore faults in power distribution systems. Faults in the secondary power distribution system can cause problems at the whole distribution level if they are not resolved in time. Ref. [
7] provides an extensive overview of fault detection, isolation, and restoration techniques. Additionally, it highlights the inability of present techniques to cater to real-time power demand fluctuations. While these techniques have greatly enhanced the efficiency and reliability of primary power distribution systems, none of them focus on the secondary power distribution system, which is more susceptible to faults, power failure, and power theft. Moreover, research is being conducted on the integration of modern communication systems and Artificial Intelligence (AI) algorithms to improve the prediction of load demand and the system’s reaction time to faults [
8,
9,
10]. While this integration has improved the fault detection response, it relies on a centralized data processing model, which reduces the efficiency of the real-time fault management system and produces some unwanted delays. Therefore, an intelligent system is required at secondary distribution nodes to cater all these challenges.
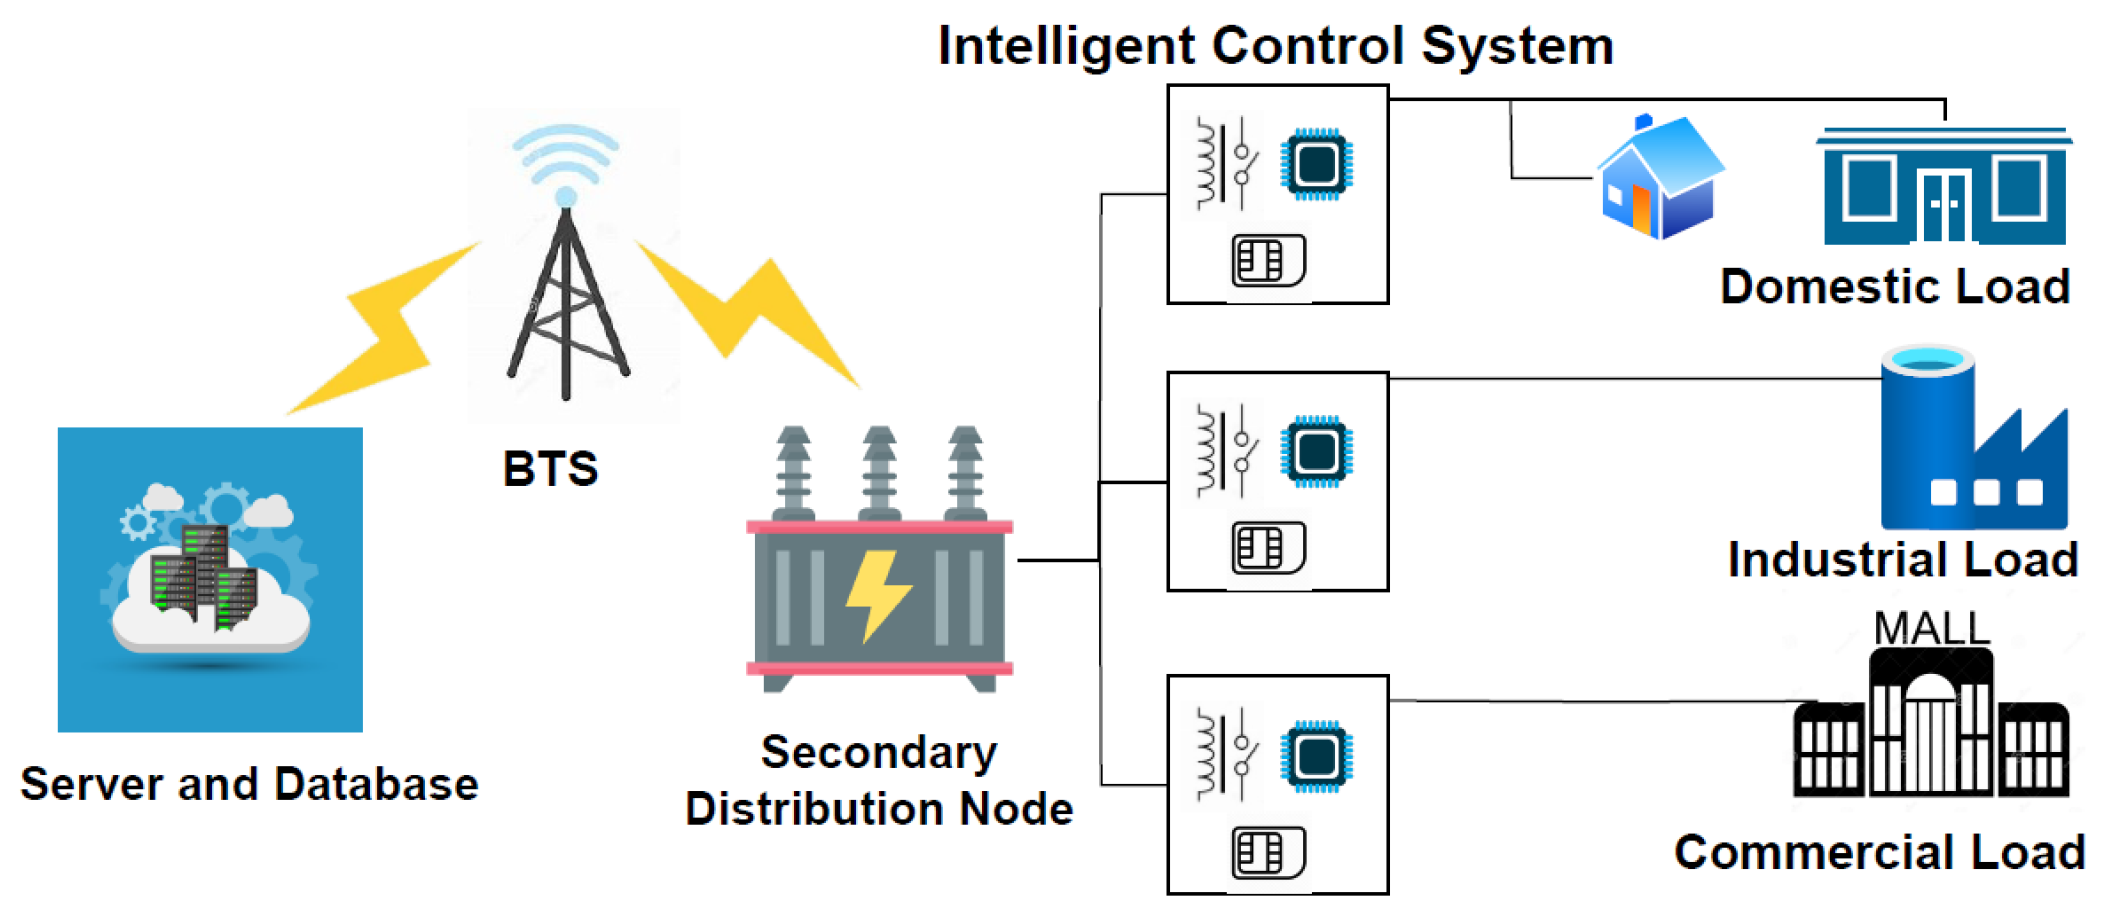
Figure 1 is a pictorial representation of the designed system. The designed intelligent system has processing and control ability, and it is placed at the output of the secondary distribution node. It measures the required power parameters, controls the output relays, and communicates the information using GSM via Hypertext Transfer Protocol (HTTP) to the server. The communication is two-way, as the system receives instructions from the control center in the event of non-surge faults.
By providing a scalable solution, this work proposes a system that overcomes the drawbacks of existing techniques and is particularly well-suited for handling the challenges of secondary power distribution networks. Our system ensures a more dependable supply for end users by enhancing the resilience and efficiency of power distribution networks through distributed processing and real-time power parameter monitoring. The system’s design, implementation, and validation indicate that the decentralized secondary-level power management system is highly effective, as evidenced by simulation and scaled-down model testing. Our research is summarized as follows:
We proposed a decentralized system with distributed processing capabilities for real-time monitoring and processing of power parameters. The proposed system automates the power supply to consumers in secondary power distribution networks.
In our system, sensors and relay-based control switches are connected to a microcontroller to process, communicate, and efficiently perform actions to rectify the surge faults and communicate the non-surge faults with their location to the control center after 90 s for manual fault rectification.
The system continuously updates the database with the real-time power parameters and status of each secondary power distribution node, using GSM and an online server with a sampling rate of 60 s. This high-resolution of power parameter data is used for advanced power management.
Additionally, the proposed system monitors the energy consumption of each transformer, which is crucial for power loss detection and enhancing energy accountability across the distribution network.
The rest of this paper is organized as follows: in
Section 2, we discuss the related work, while
Section 3 describes the overall methods and a prototype of the system model. In
Section 4, we demonstrate the extensive simulation results, and finally
Section 5 concludes this study and describes possible future directions.
2. Literature Review
Baseline schemes for power distribution systems have predominantly relied on centralized automation and data acquisition systems. In these systems, control and data processing of power are centralized, allowing for systematic control from the center. However, such structured control systems introduce single points of failure and latency in fault response, making them less resilient [
11]. In contrast, decentralized systems make decisions at local nodes, enhancing the robustness of the system [
12,
13]. Moreover, centralized systems are vulnerable to failure at the central node, which would cause the collapse of communication in the entire network. However, using a decentralized approach decreases the chances of system-wide failure because problems in one node do not affect the rest of the system [
14]. In addition to enhancing reliability, decentralizing automation allows for a greater degree of scalability. An IoT-based monitoring and management system for distribution substations was developed using low-cost microcontrollers and cloud integration, offering real-time remote data access [
15]. The transformers can be made nodal controllers, capable of scanning, detecting, and managing faults without going through a central node [
16].
Moreover, the implementation of decentralized control systems for power distribution has demonstrated significant advantages, particularly for use in developing countries that face the challenges of unplanned power distribution network expansion. Decentralized systems are more reliable and cost-efficient to maintain because they enable localized fault identification and faster response times [
17]. Additionally, the system cost is reduced by 25% in decentralized and distributed systems when compared to centralized systems for distribution networks of microgrids. Furthermore, decentralized energy resources (DERs) also enhance energy access and security within regions with poor infrastructure, including developing economies [
18,
19]. Conversely, fault detection and identification in every field are very important for reliable services [
20]. Similarly, fault detection in decentralized power distribution systems, single-phase to ground with resonant grounding, can be detected in less than three cycles, enhancing system reliability and reducing downtime [
13]. Similarly, a GSM-based fault detection and localization system in a three-phase power distribution network enables automatic monitoring, fault reporting, and prompt response to system failures [
21]. The fault automation approach using GSM communication improves low-voltage power reliability [
22]. This approach demonstrates that it is possible to provide automated fault rectification with the combination of GSM communication and decentralized decision-making. It is more efficient than traditional centralized monitoring systems, mainly focusing on fault identification rather than fault rectification techniques.
Combining automation with communication networks greatly improves response and fault handling in a decentralized system. Additionally, decentralized systems are easy and more flexible to control, are resilient to failures, and can properly pinpoint the faults [
12]. Decentralized systems offer a robust and affordable alternative to centralized control systems in terms of reliability and economic performance. Additionally, decentralized systems have enhanced scalability and reduced potential failure points, and they allocate decision-making power to the transformers [
17].
Table 1 compares and indicates the superiority of the proposed system over existing centralized systems.
A comprehensive review of AI-based fault localization techniques in power distribution systems is presented in [
28], comparing methods such as neural networks, fuzzy logic, and reinforcement learning. The study also highlights the role of data sources, fault types, and distributed generation in influencing method applicability. AI classification in ring-type distribution is highly promising but offers central processing [
29]. Moreover, while techniques like blockchain and IoT-based models focus on security and detection, they fail to address overhead power losses or bidirectional communication, and need complex load profiling based on AI/ML algorithms [
30]. However, prior decentralized systems have shown limited contribution to secondary power distribution networks, and power converter faults (such as IGBT failures in inverters) are often overlooked. Industrial approaches like fault-tolerant H-bridge topologies [
31] are of great importance for future decentralized systems to avoid component-level failures.
To exploit these gaps, our system detects faults with a mean value of 90 ms and responds with a mean value of 186 ms, respectively. Our system takes advantage of the systematic signature of distribution faults, i.e., current abnormalities that occur uniformly in line-to-line (L-L), line-to-ground (L-G), and overload faults. Because the proposed system measures current continuously, it provides comprehensive protection without requiring complex fault profiling. The proposed system rectifies surge faults within 90 s and communicates persistent faults to the server using GSM/HTTP-based communication. The system provides bidirectional connectivity between the server and the node. The proposed model has been tested only in a lab-controlled environment, and it needs real-world power distribution system validation.
3. Methods and Materials
This research developed a decentralized and distributed control strategy for the secondary power distribution network. The system detects and mitigates power surges and flags non-surge faults, with real-time power parameter monitoring and communication to the server using GSM. The methodology combines validation by simulation on Proteus (8.13) and a scaled-down hardware prototype. This section includes a description of the system architecture, simulation model and hardware prototype, and the working algorithm, as well as a stability analysis.
3.1. System Architecture
The decentralized and distributed intelligent autonomous system for secondary power distribution comprises an Arduino Mega 2560 for processing, input current sensors, voltage sensors, and control relays to regulate the electric supply to the load side. The system measures the current and voltage and formulates the power and energy using its local processing unit. It is programmed to control the output load within safe limits using relay switches according to the designed algorithm.
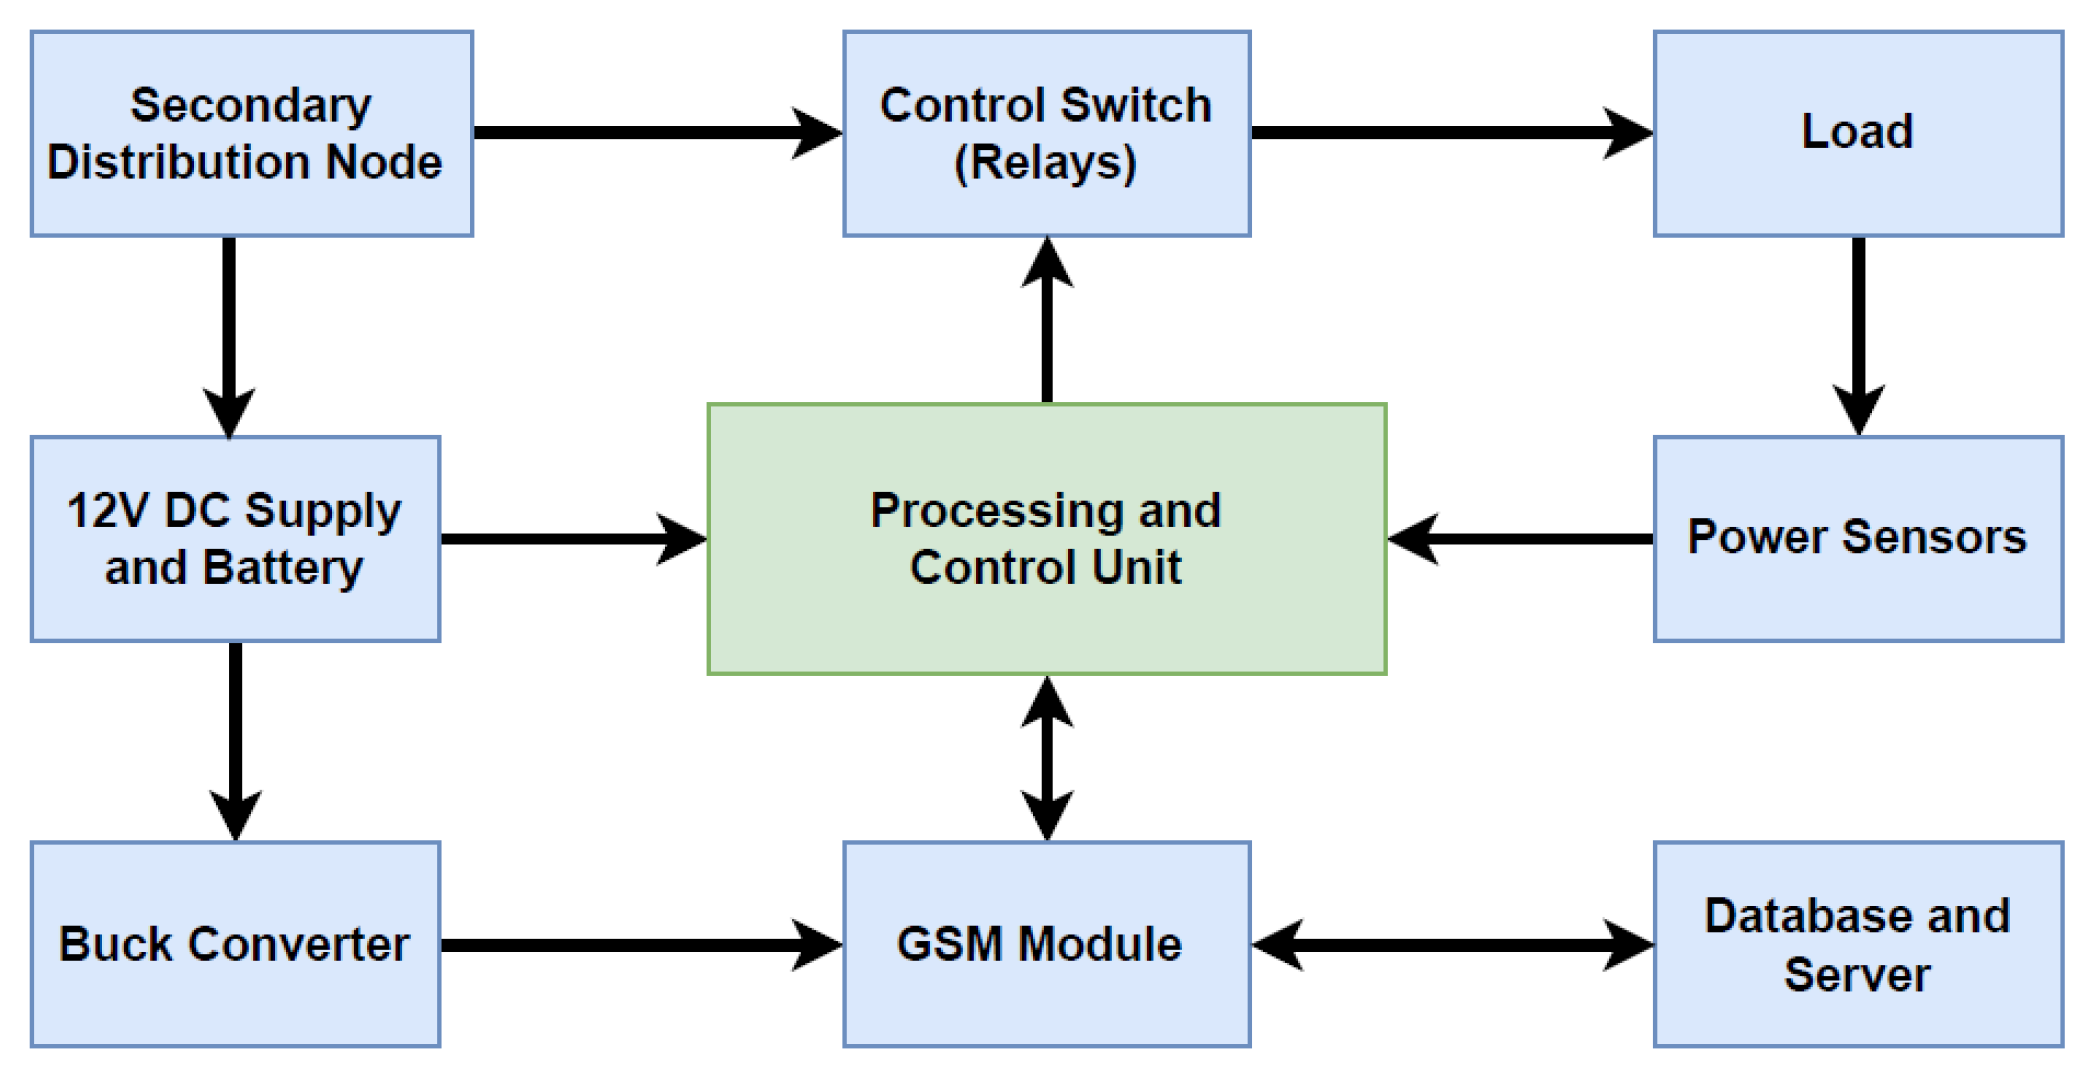
Figure 2 shows the system architecture and hierarchy of connectivity for the proposed system. The distribution node supplies power to the load at the required voltage, while a 12-volt DC power supply is also connected to the distribution side to power up the microcontroller. A buck converter further reduces the 12-volt DC supply to 4.2 volts to power up the GSM module.
3.2. Simulated Model Design
Proteus simulation software allows for accurate emulation of IoT systems and their integrated microcontrollers, replicating the operational behavior of actual hardware. This capability enables us to simulate the proposed model within Proteus for precise and accurate observations. The simulation model includes two virtual terminals. Virtual terminal “A” visualizes power parameters in real time, while virtual terminal “B” shows the server interface.
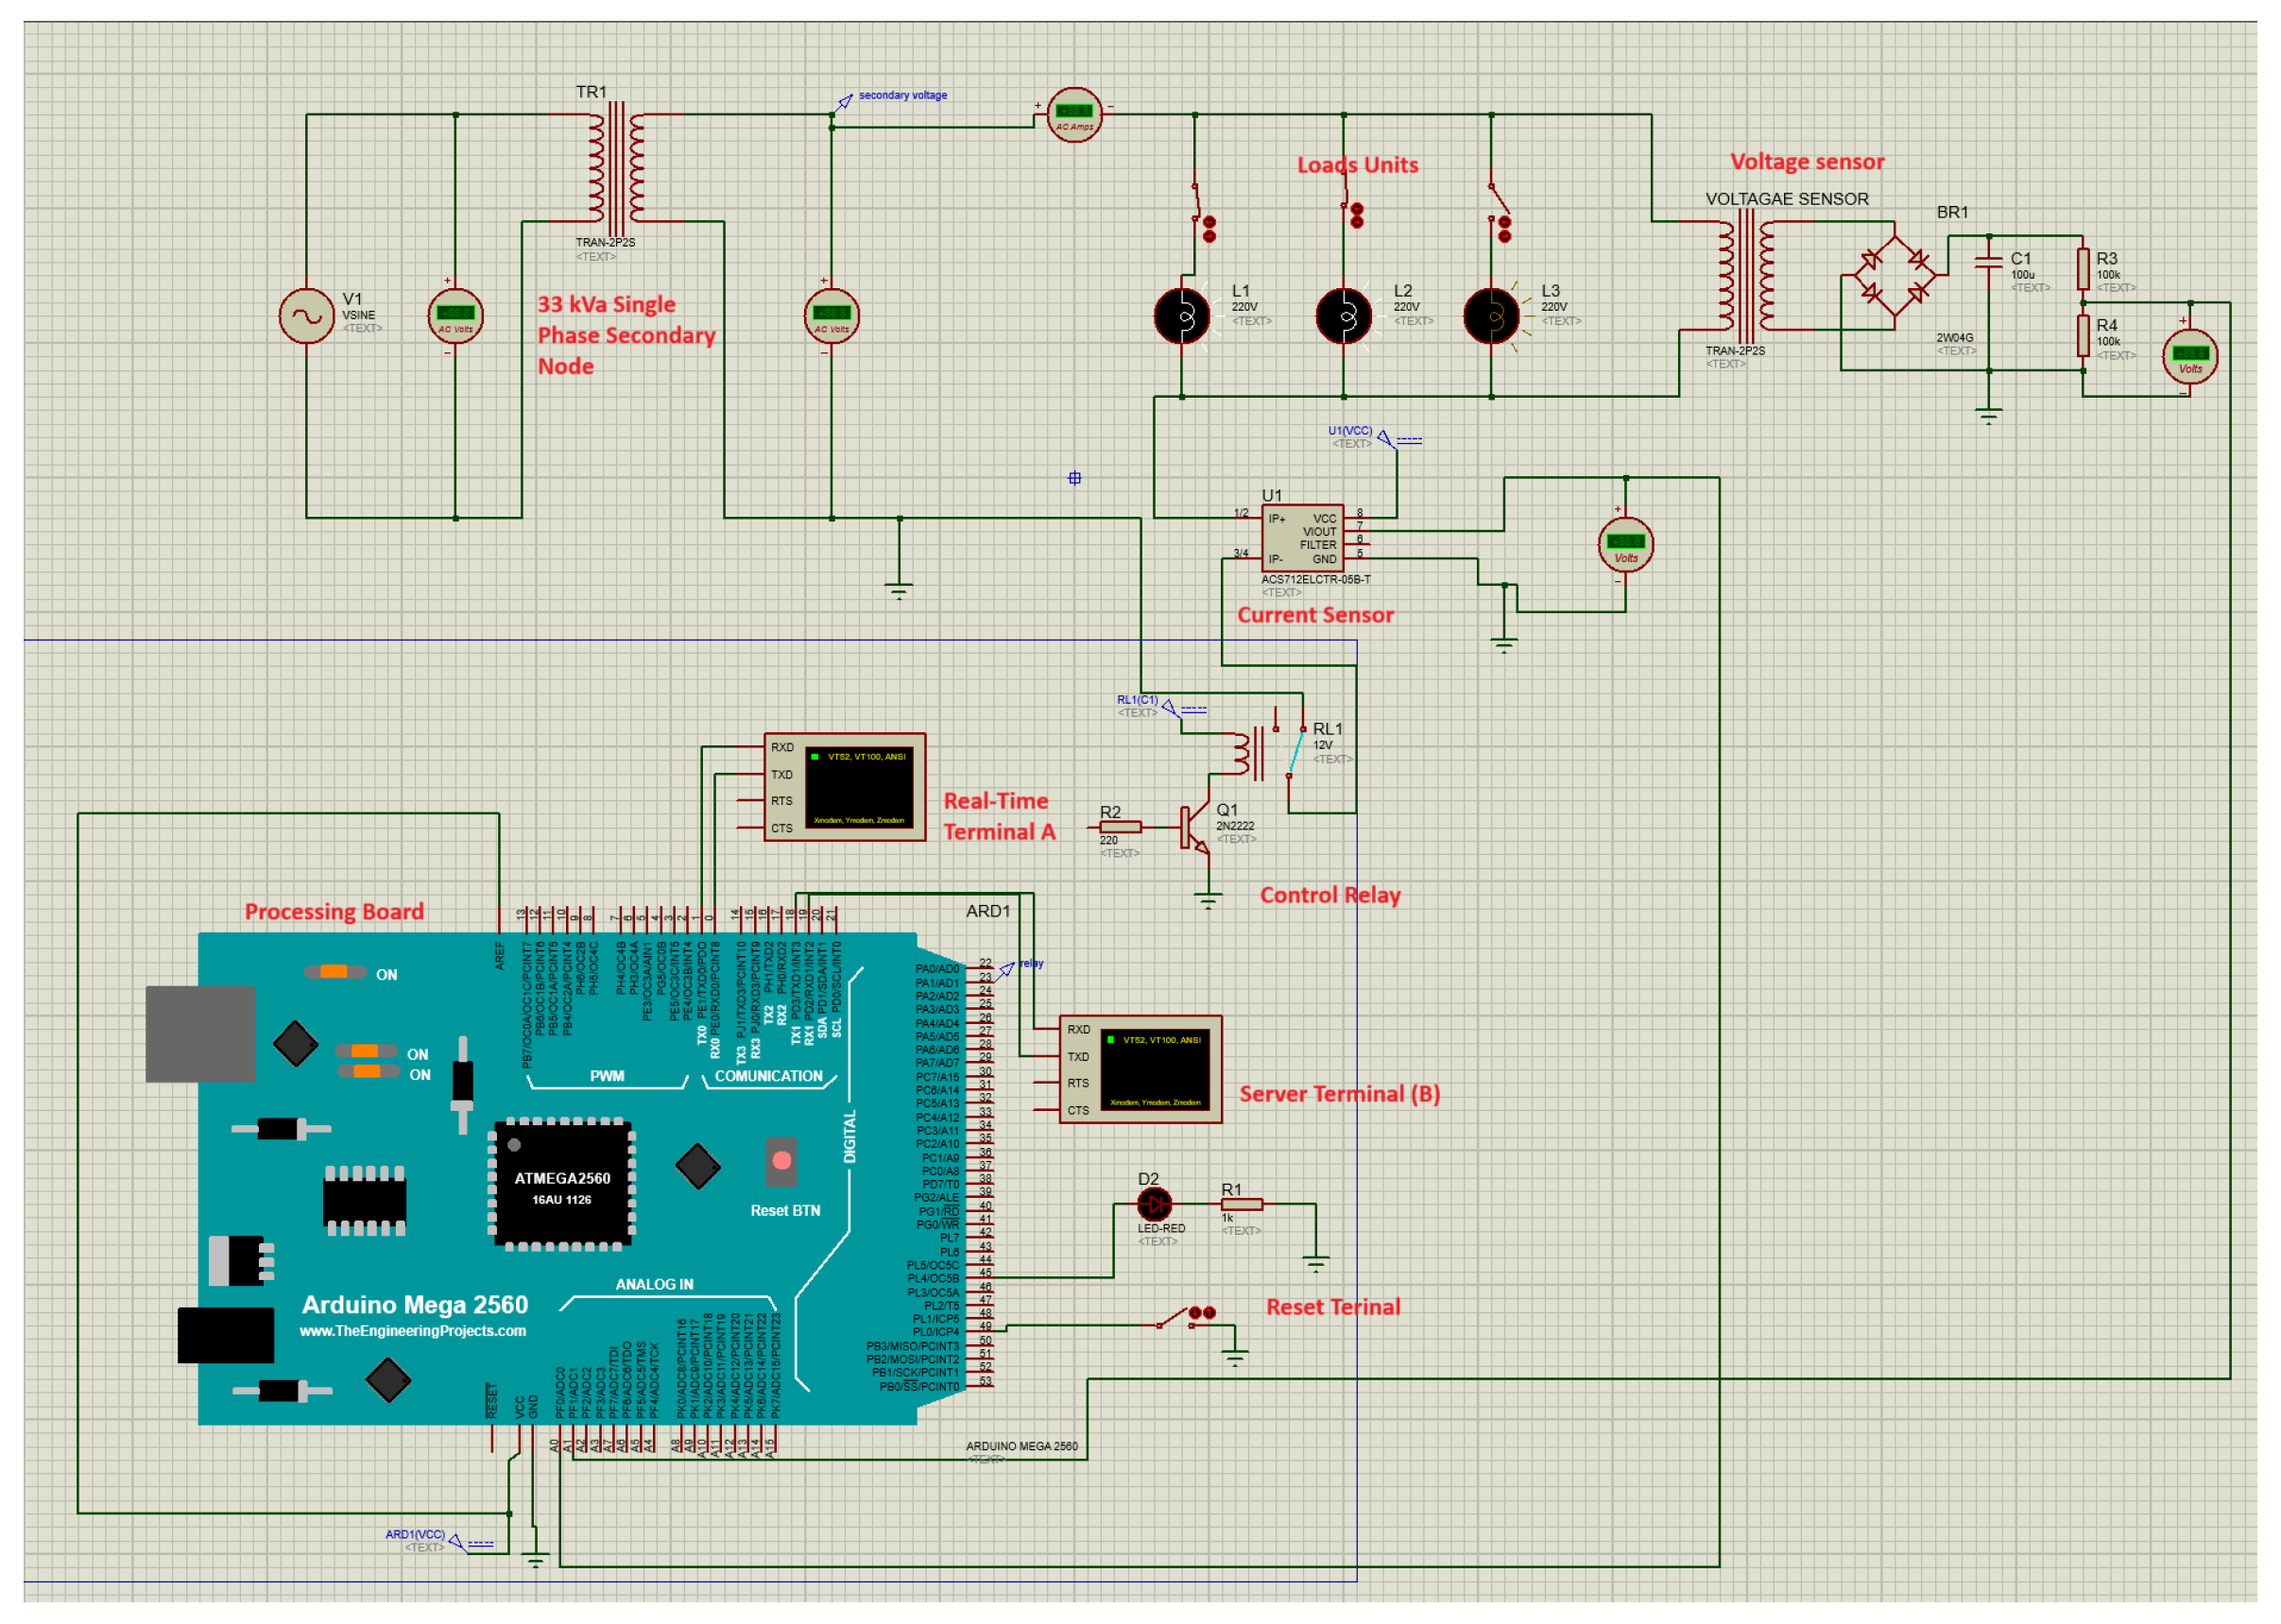
Figure 3 shows the schematic simulation of the designed model. The simulated model features a single phase of a distribution transformer with a capacity of 33 kVA
= 33.33 kVA). The simulation model’s load line is designed with the following parameters: 500 m distribution line with 50 mm
2 cross-sectional area, and the wire material is aluminum with
ohm·m. The transformer’s supply is connected to three units of load, i.e., L1, L2, and L3 (each approximately 15 kW), through control switches to turn the load on or off. Current and voltage measurement sensors on the secondary side of the distribution node feed power parameters to the microcontroller.
3.3. Hardware Prototype Development
A scaled-down hardware model of the proposed system has been designed and implemented to verify the simulation results and test the communication components. The model communicates the required power parameters to the server. This scaled-down model has been built for a 1000-watt safe load with 5% tolerance on the upper limit.
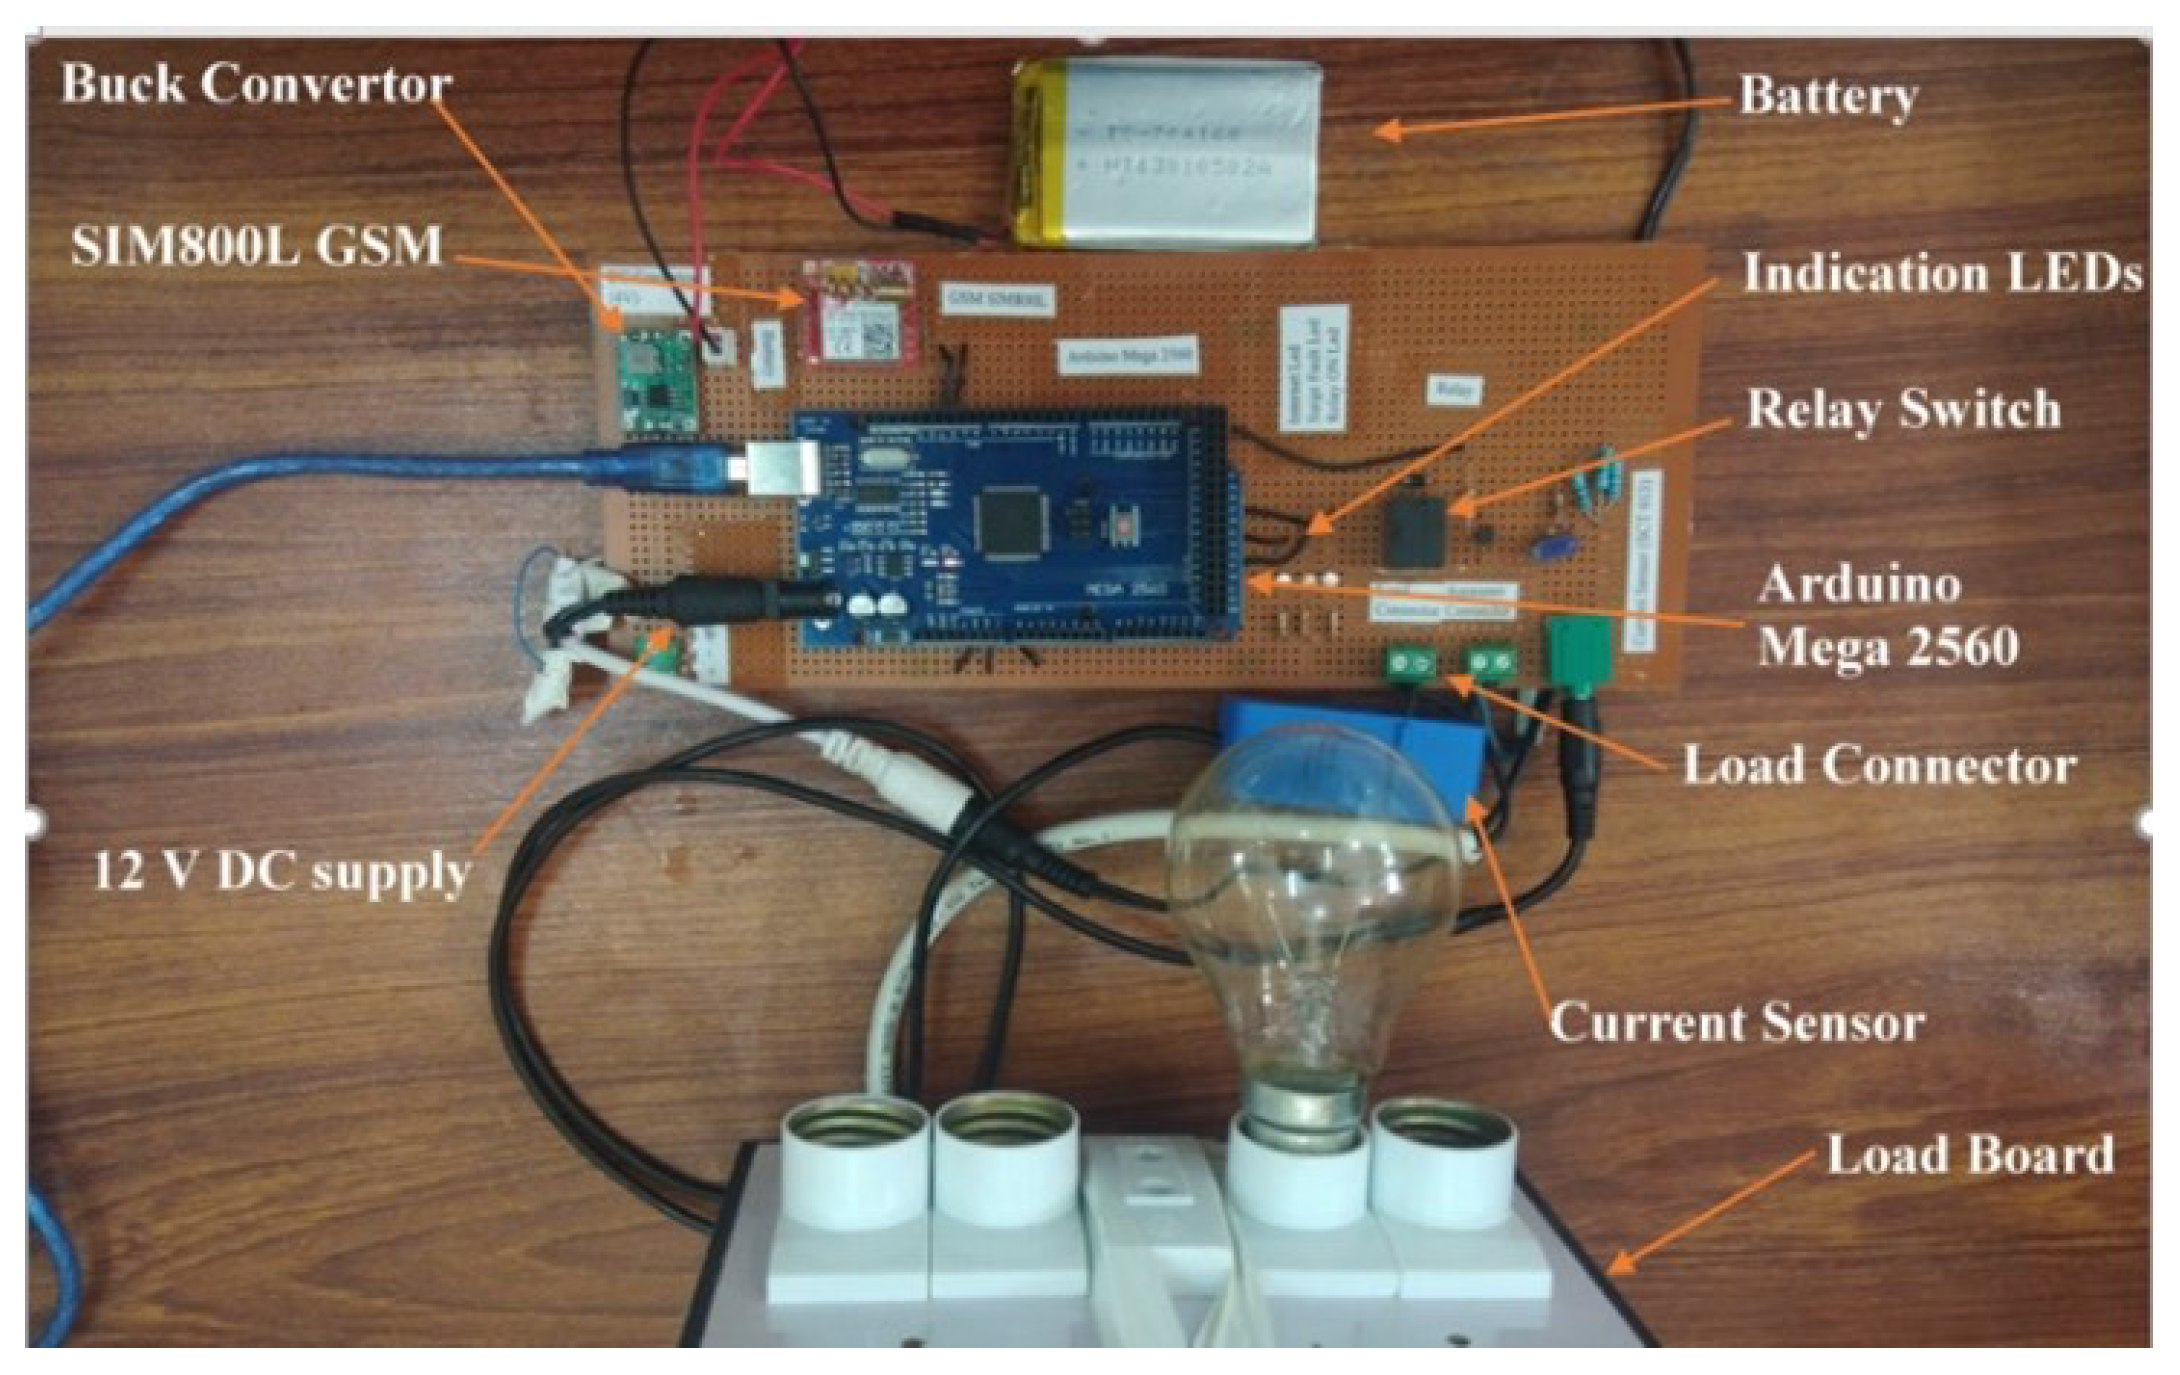
Figure 4 indicates the hardware scaled-down model of the system.
The designed model working algorithm mirrors that of the simulated model, with the addition of communication components, i.e., GSM and server, to validate the bidirectional communication in the real model. A buck converter is added to power the GSM module as it operates on 3.8–4.2 volts. The load board is used for connecting the load. A relay controlled by a microcontroller enables automatic switching of the load, and a current sensor is clamped onto the wire carrying the load current. The model also has indication LEDs for SIM card, fault current, and network check. The scaled-down model is capable of detecting faults, migrating them, and communicating the power parameters and fault status to the server in real time.
3.4. Working Algorithm
The system carries out real-time online processing on the Arduino Mega 2560 microcontroller. It continuously processes live sensor data streams, performing 50 ms control cycles during normal operation. L-L, L-G, and overload faults at the power distribution node can be manifested as abnormalities in current, so the system efficiently addresses these faults. As these faults share common characteristics of high current values, the system’s current threshold-based protection system can handle these faults without the need for comprehensive fault profiling.
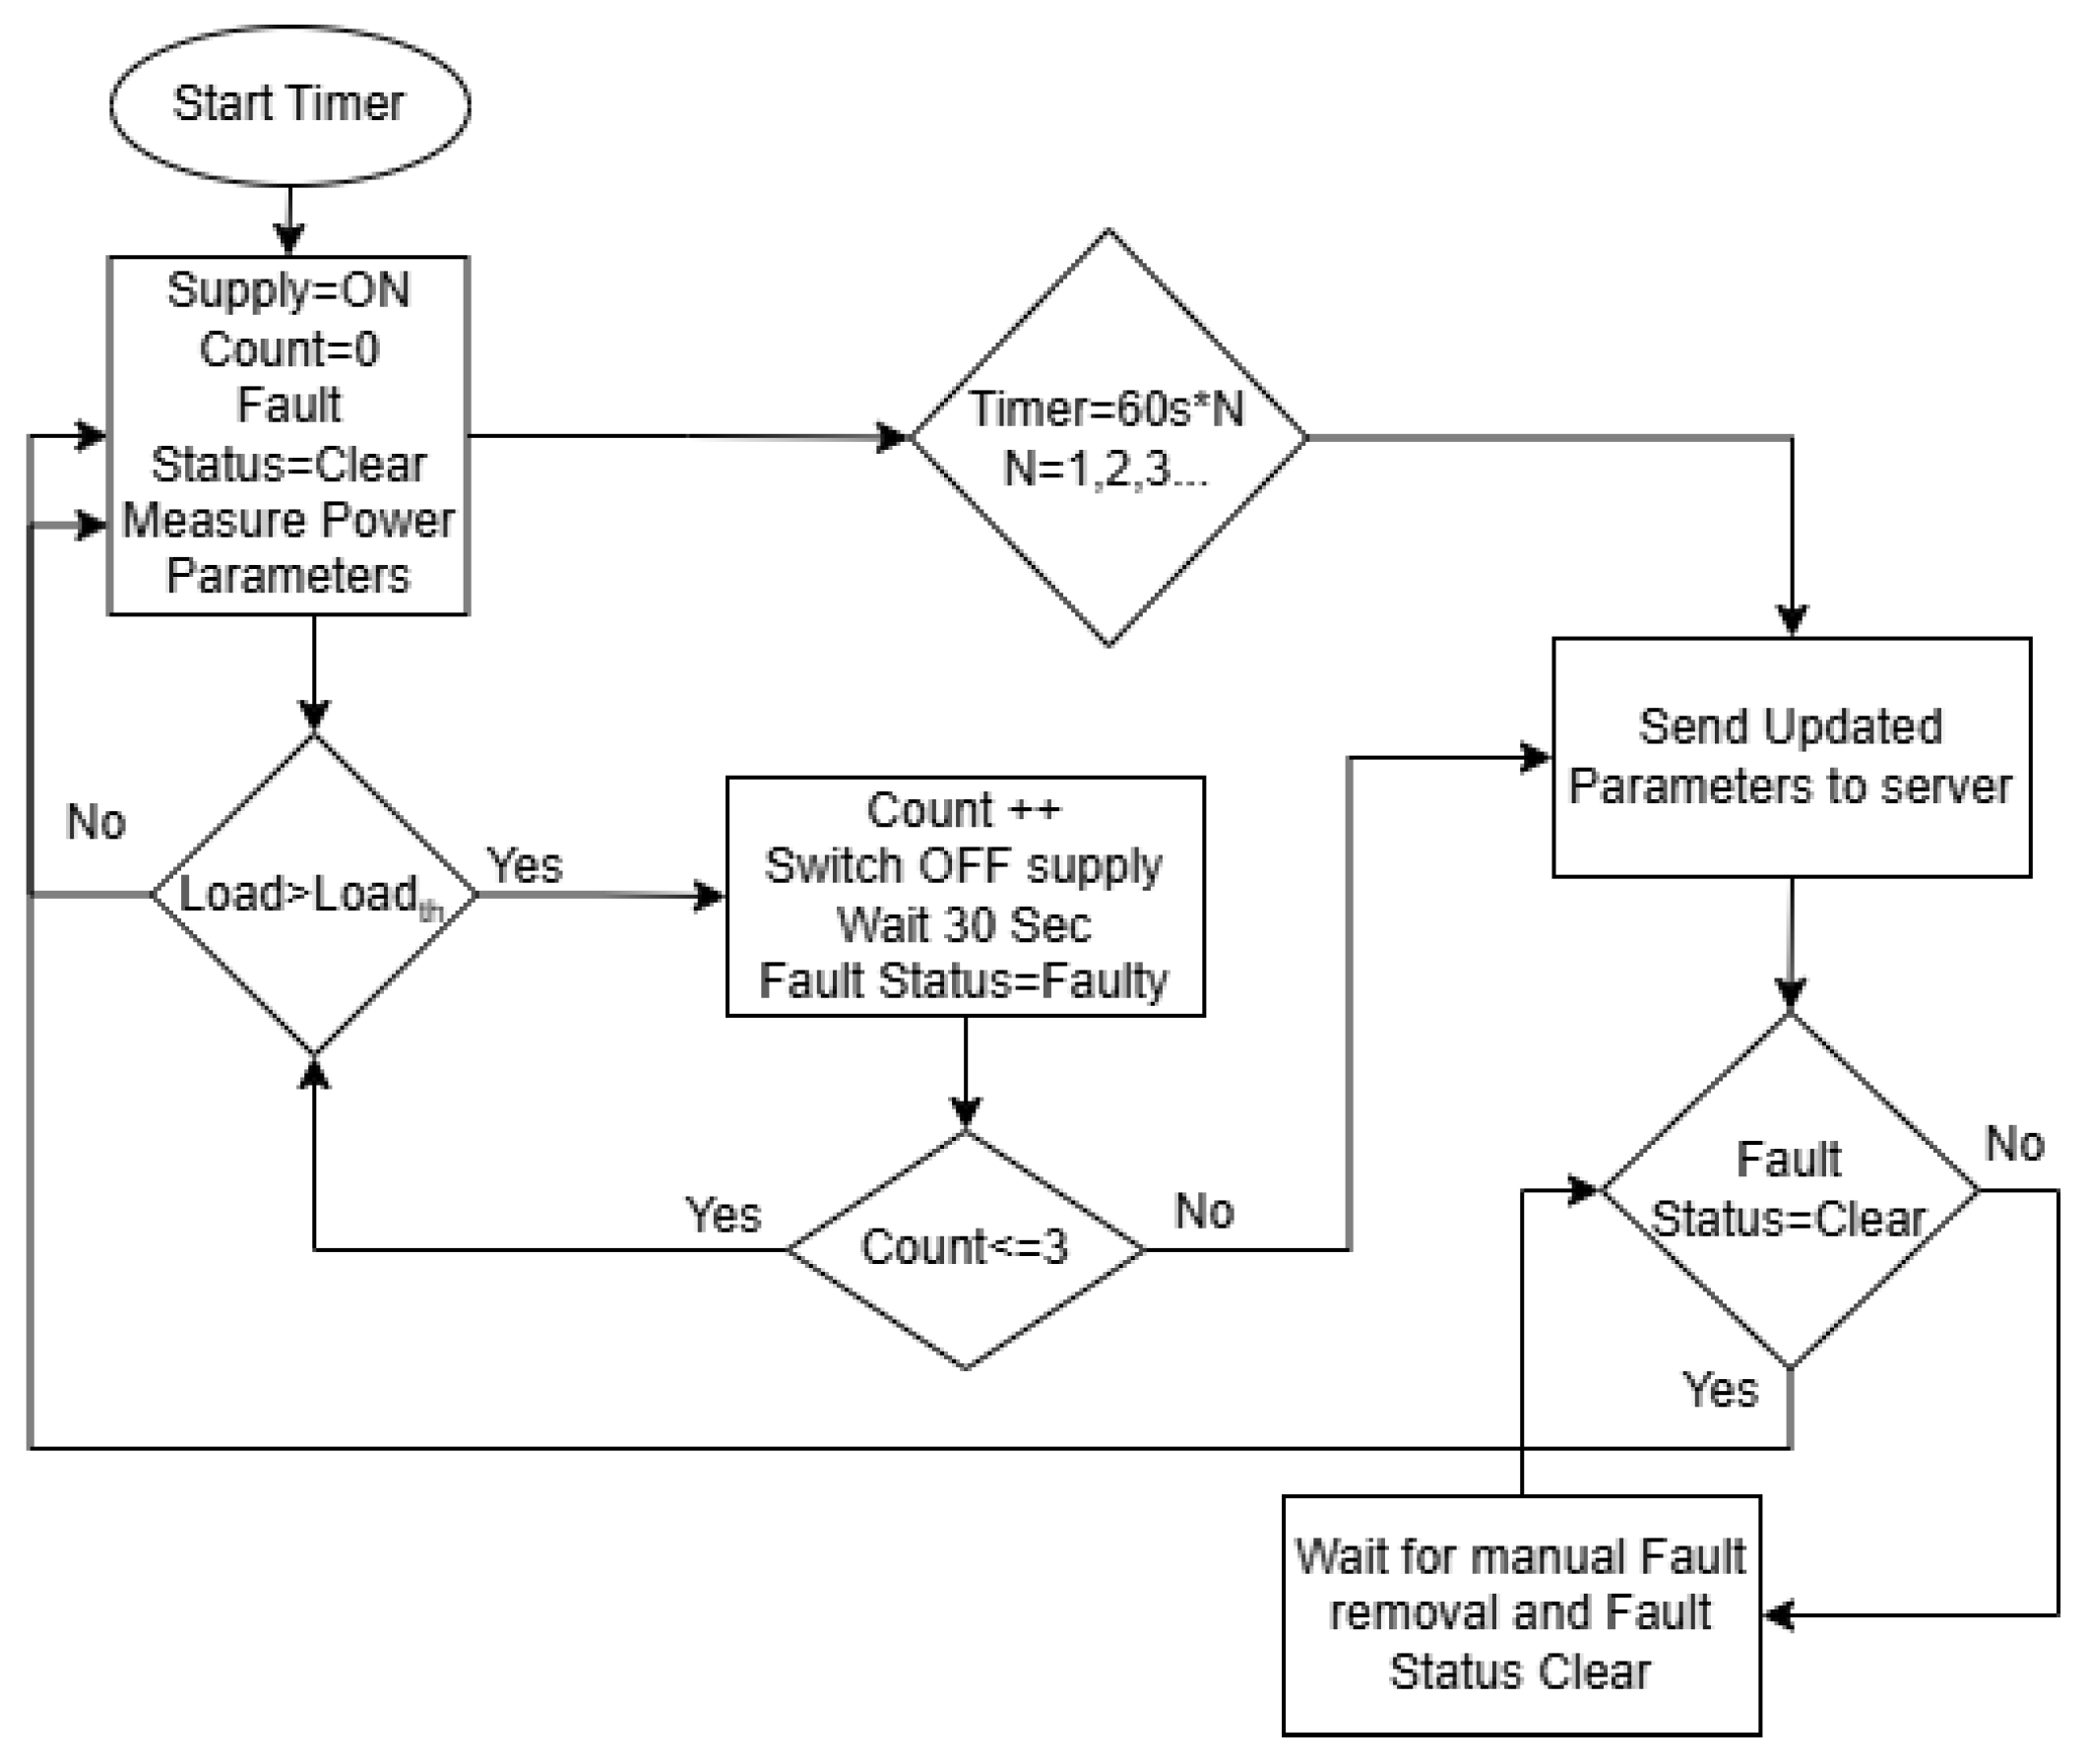
Figure 5 illustrates the working flow of the proposed model and the response of the system under different conditions. The system starts by turning ON the timer and power supply. Initially, the fault status is set to clear. A counter to count the number of times the system tried to clear a surge is set to zero, and finally, the system starts measuring power parameters to keep the system protected. During normal operation, after every 60 s, power parameters are sent to the server using GSM communication.
In the case of overload, the current is higher than the set threshold. As soon as that fault current is detected, the system waits for 10 control cycles, i.e., 500 ms, before triggering the fault mechanism to prevent false flags. (If the overload is more than 3 times the upper threshold, it triggers immediately.) The system then switches off the load using a relay-based control switch, waits for 30 s per IEC 60909, which specifies 30–60 s for temporary fault recovery (
https://kupdf.net/download/iec60909_5b05ba45e2b6f50b4dcf2ffb_pdf, (accessed on 15 May 2025)), and increases the counter by 1. It then checks if the counter is less than or equal to 3; if yes, it turns ON the load again and checks if the load is within the safe limit. The system repeats this loop 3 times, and if the load falls back within the safe limit at any time between loops, the system resets the counter to zero and resumes working smoothly per IEEE Std 1547-2018, 2018 (
https://standards.ieee.org/products-programs/standards-related/interactive-standards/, (accessed on 15 May 2025)). The fault persistence is modeled as
Here, is the power taken by the load at a given time t, is the power a load takes in its steady state, is the peak power taken initially, t is the relay OFF time, i.e., 3 intervals of 30 s, and is the time for which the load takes extra current. For surge faults, . But if the load remains higher than the threshold and the counter goes above 3, this event is flagged as a non-surge fault. The system’s overload stays persistent, , even after 3 tries, so the system waits for manual fault rectification. When the system receives a fault status cleared from the server, it resumes its normal operation.
3.5. State-Space Stability Analysis
To guarantee system stability and reliability under both surge and non-surge fault conditions, a state-space model was developed which applies Lyapunov stability. The analysis considers a single node of a secondary power distribution network with line impedance
and a resistive load
. The state vector is defined as
, where
i represents the line current and
is the load voltage. The governing equations are formulated using Kirchhoff’s voltage law (KVL) and are expressed in the standard state-space form.
Here,
(load equation) and
(relay control). Substituting and rearranging the equation,
For stability analysis, we use a Lyapunov stability analysis as
, where
, and
P is the positive definite matrix.
The stability is defined as
(the derivative of
V should be negative):
This aligns with our system implementation, i.e., that system sets
. The system stability for the load current is defined in
Table 2. The stability analysis provides a strong foundation to ensure the system’s stability under the specific experimental conditions of the designed system. Our analysis ensures stability for critical cases by relay actions, i.e., turning it OFF (fault isolation when overloaded) and ON (stable operation below the threshold current). The system’s design directly supports stability analysis by the control mechanism of relays and threshold current.
4. Results and Discussion
The effectiveness of the proposed decentralized control system is tested through simulation and hardware experiments. This section presents results under three scenarios: normal or safe load, surge fault, and non-surge fault conditions. The aim was to evaluate the system’s real-time monitoring, fault recovery, and inter-system communication functions. In this section, simulation results illustrate the system reacting to different loading and unloading scenarios. Moreover, experimental results from hardware implementation examine the system reliability in the real model, critical response times evaluations, communication in workflows, and fault escalation logic.
4.1. Simulation Results
The proposed system was simulated using Proteus, and the system’s response was observed on virtual terminals “A” and “B” to verify the implications of our methodology. Virtual terminal “A” displays the real-time power parameters being measured with a display sampling rate of 10 samples per minute. Virtual terminal “B” simulates the server with a sampling rate of 1 sample per minute during normal operation and immediately when a non-surge fault is detected. As discussed in the Simulated Model Design subsection, the system is simulated using three units of load, such that two units of load remain within the safe limit and the third behaves as an overload. Here, it is important to note that watts are measured with the formula , so there is no difference between watts and volt-amperes (power factor is considered as 1).
4.1.1. Smooth Working
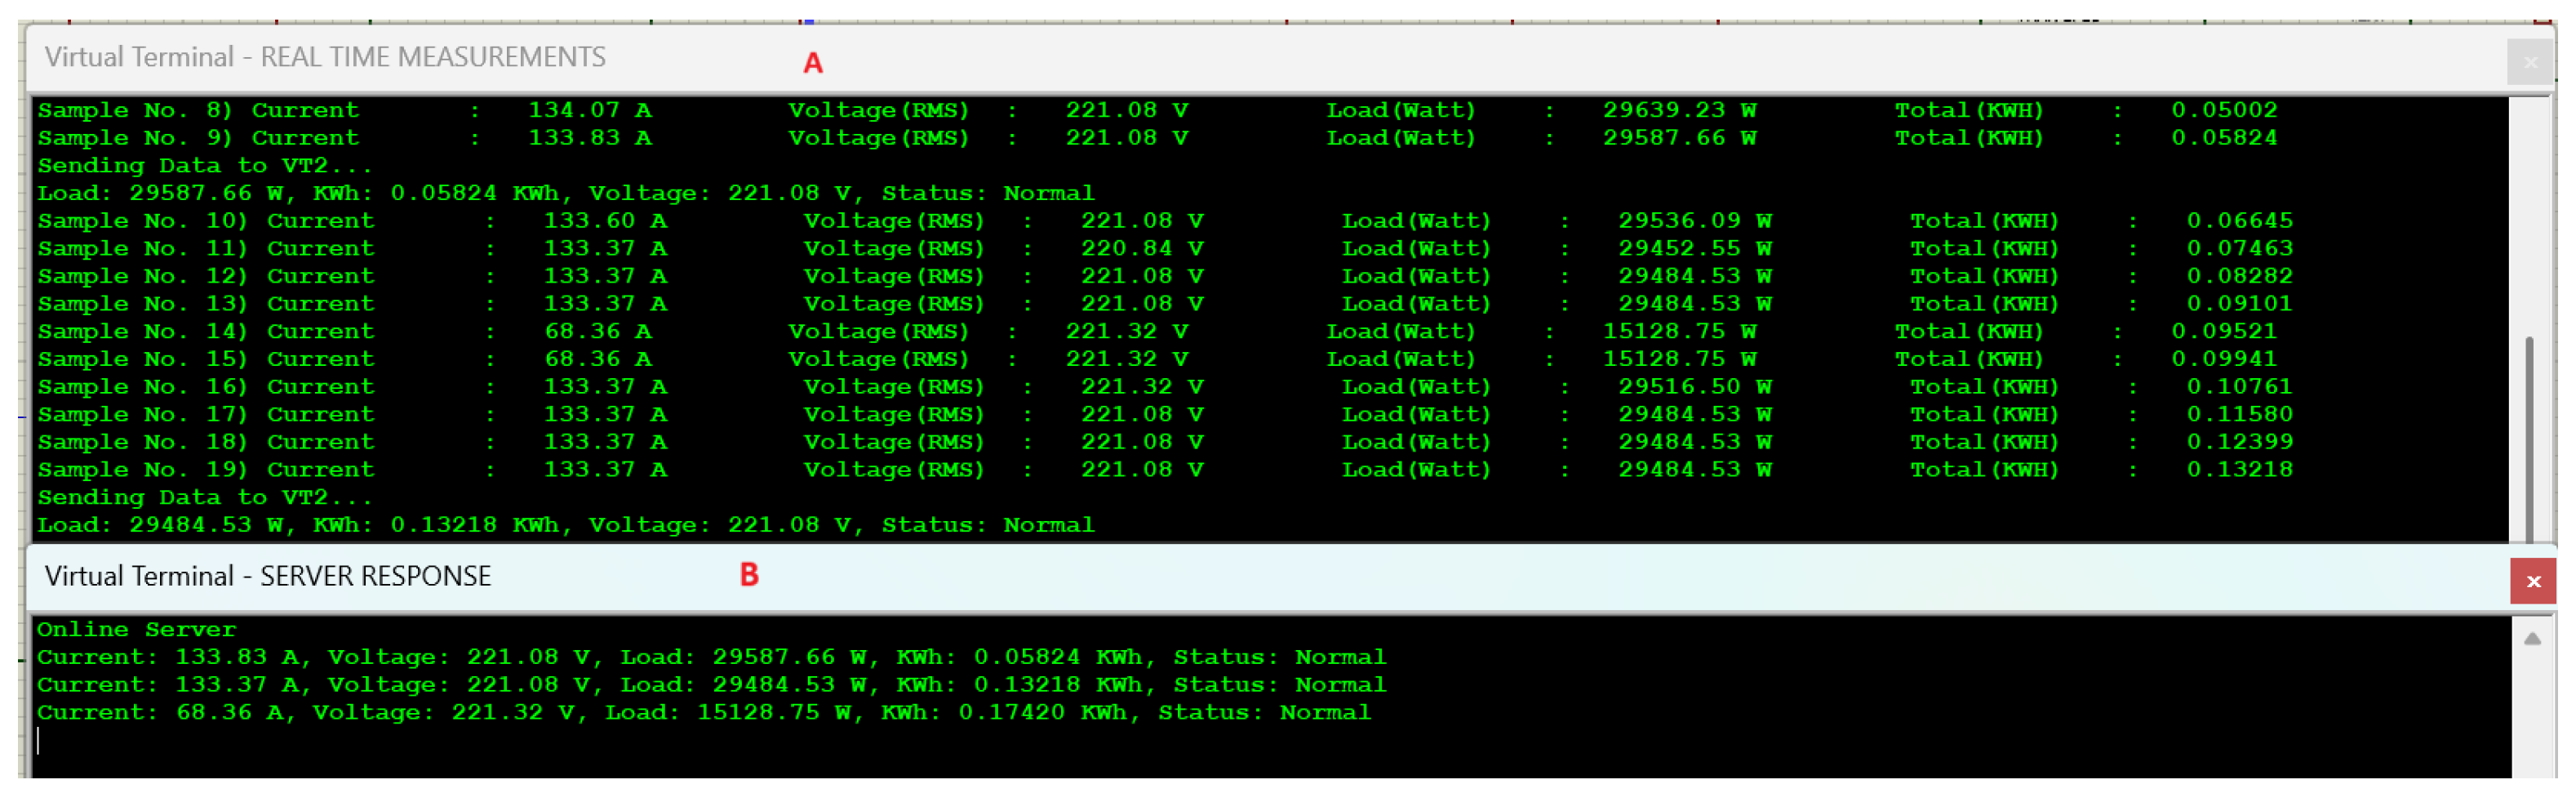
The smooth working section simulates the system within a safe load. Under safe load conditions, the system operates smoothly and communicates power parameters at regular, defined intervals to the server. In
Figure 6, sample numbers 8 to 19 on virtual terminal “A” demonstrate how the load fluctuates yet remains within the safe operational limit, while virtual terminal “B” (server) receives a sample after every 60 s (10 samples per minute on virtual terminal “A”). The relay stays ON (i.e.,
) and the system satisfies the criterion
needed for the system’s stability.
The distributed power satisfies the condition
, and the total energy at time
t is given by
where
is the distributed power,
is the energy at time
t, and
is the threshold distributed power.
4.1.2. Surge Fault
Surge faults are categorized as short-lived faults, caused by L-L, L-G, or overload events in the distribution network, which disappear after a defined interval.
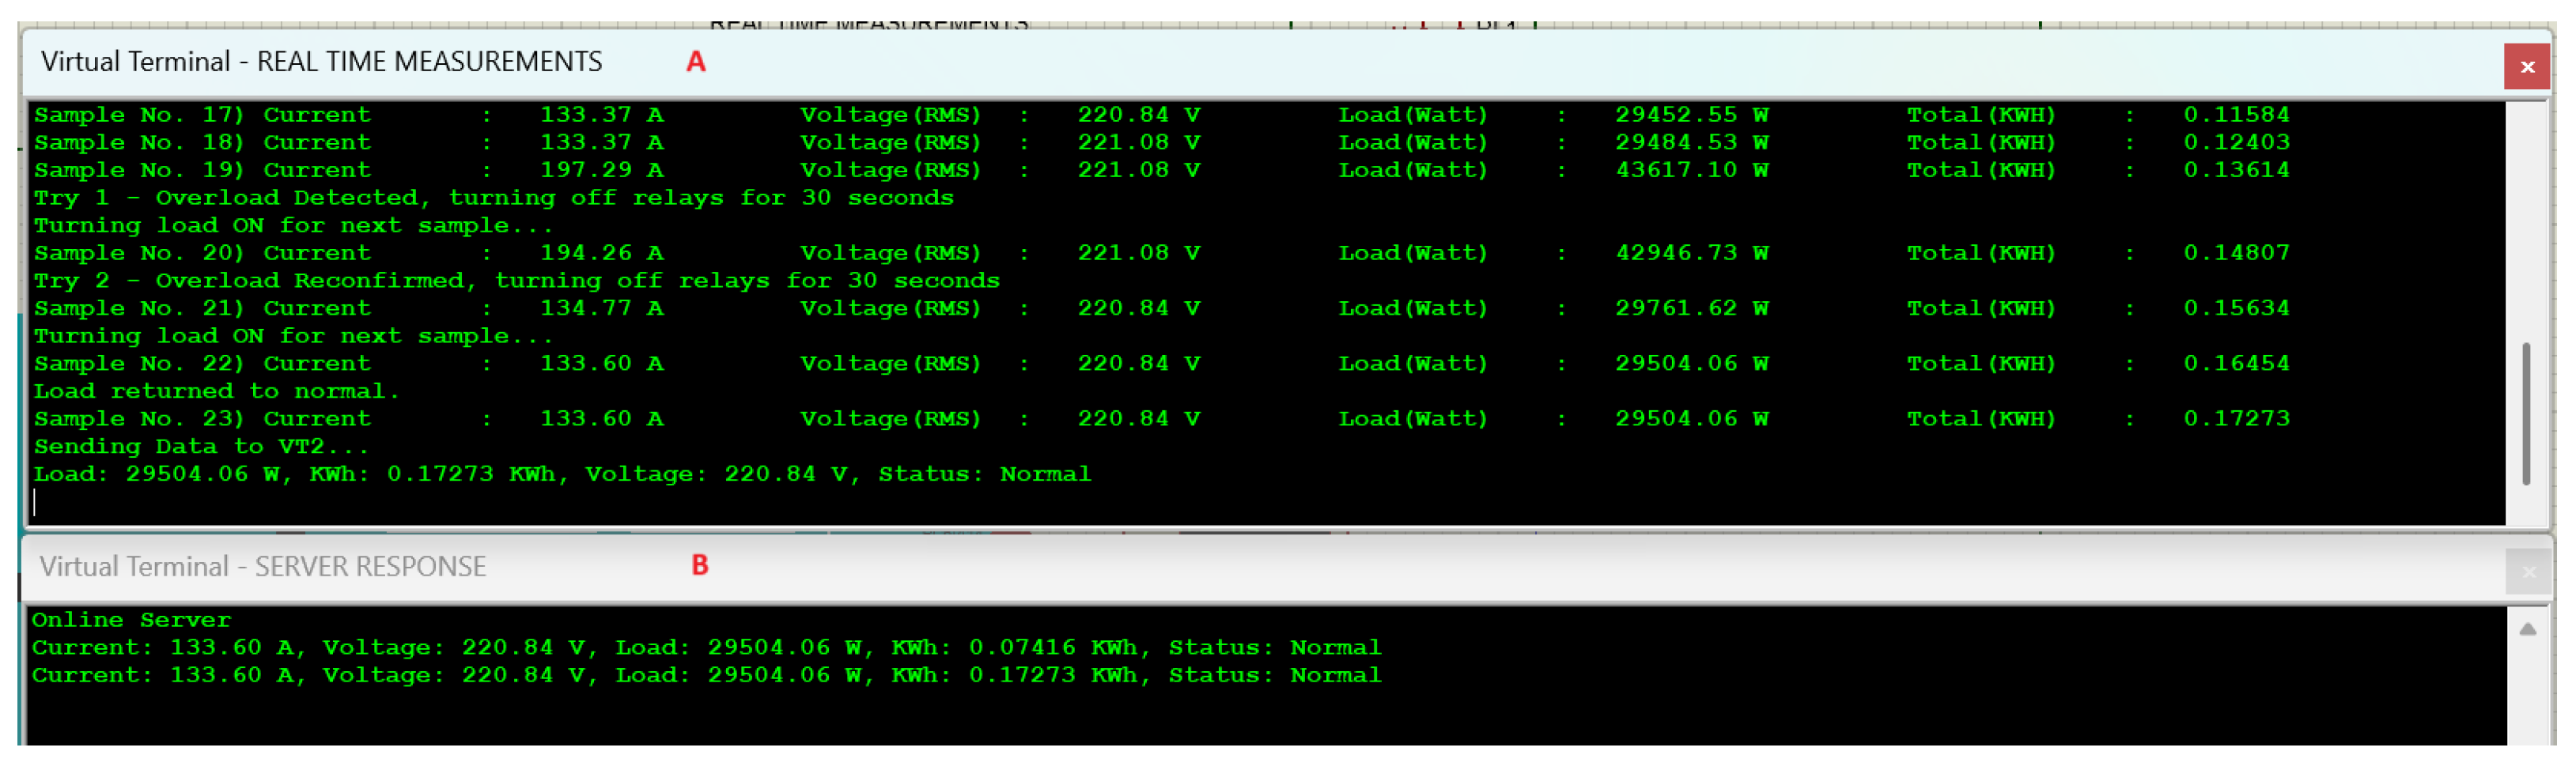
Figure 7 shows that “Sample No. 19” in the system experienced an overload and responded by turning OFF the relay (i.e.,
) and achieving system stability. The system waited 30 s to make the first try to retain power, but as can be seen at “Sample No. 20”, the system was still in overload, so it attempted a second try and successfully restored the power supply; then, the overload status disappeared (Sample No. 21). Referring to Equation (
1), the system waited for
t time, as explained in the working algorithm. Here,
(duration of overload) was less than
t as the system’s load returned to the safe limit within
t, allowing the system to regain stability with the load still ON.
4.1.3. Non-Surge Fault
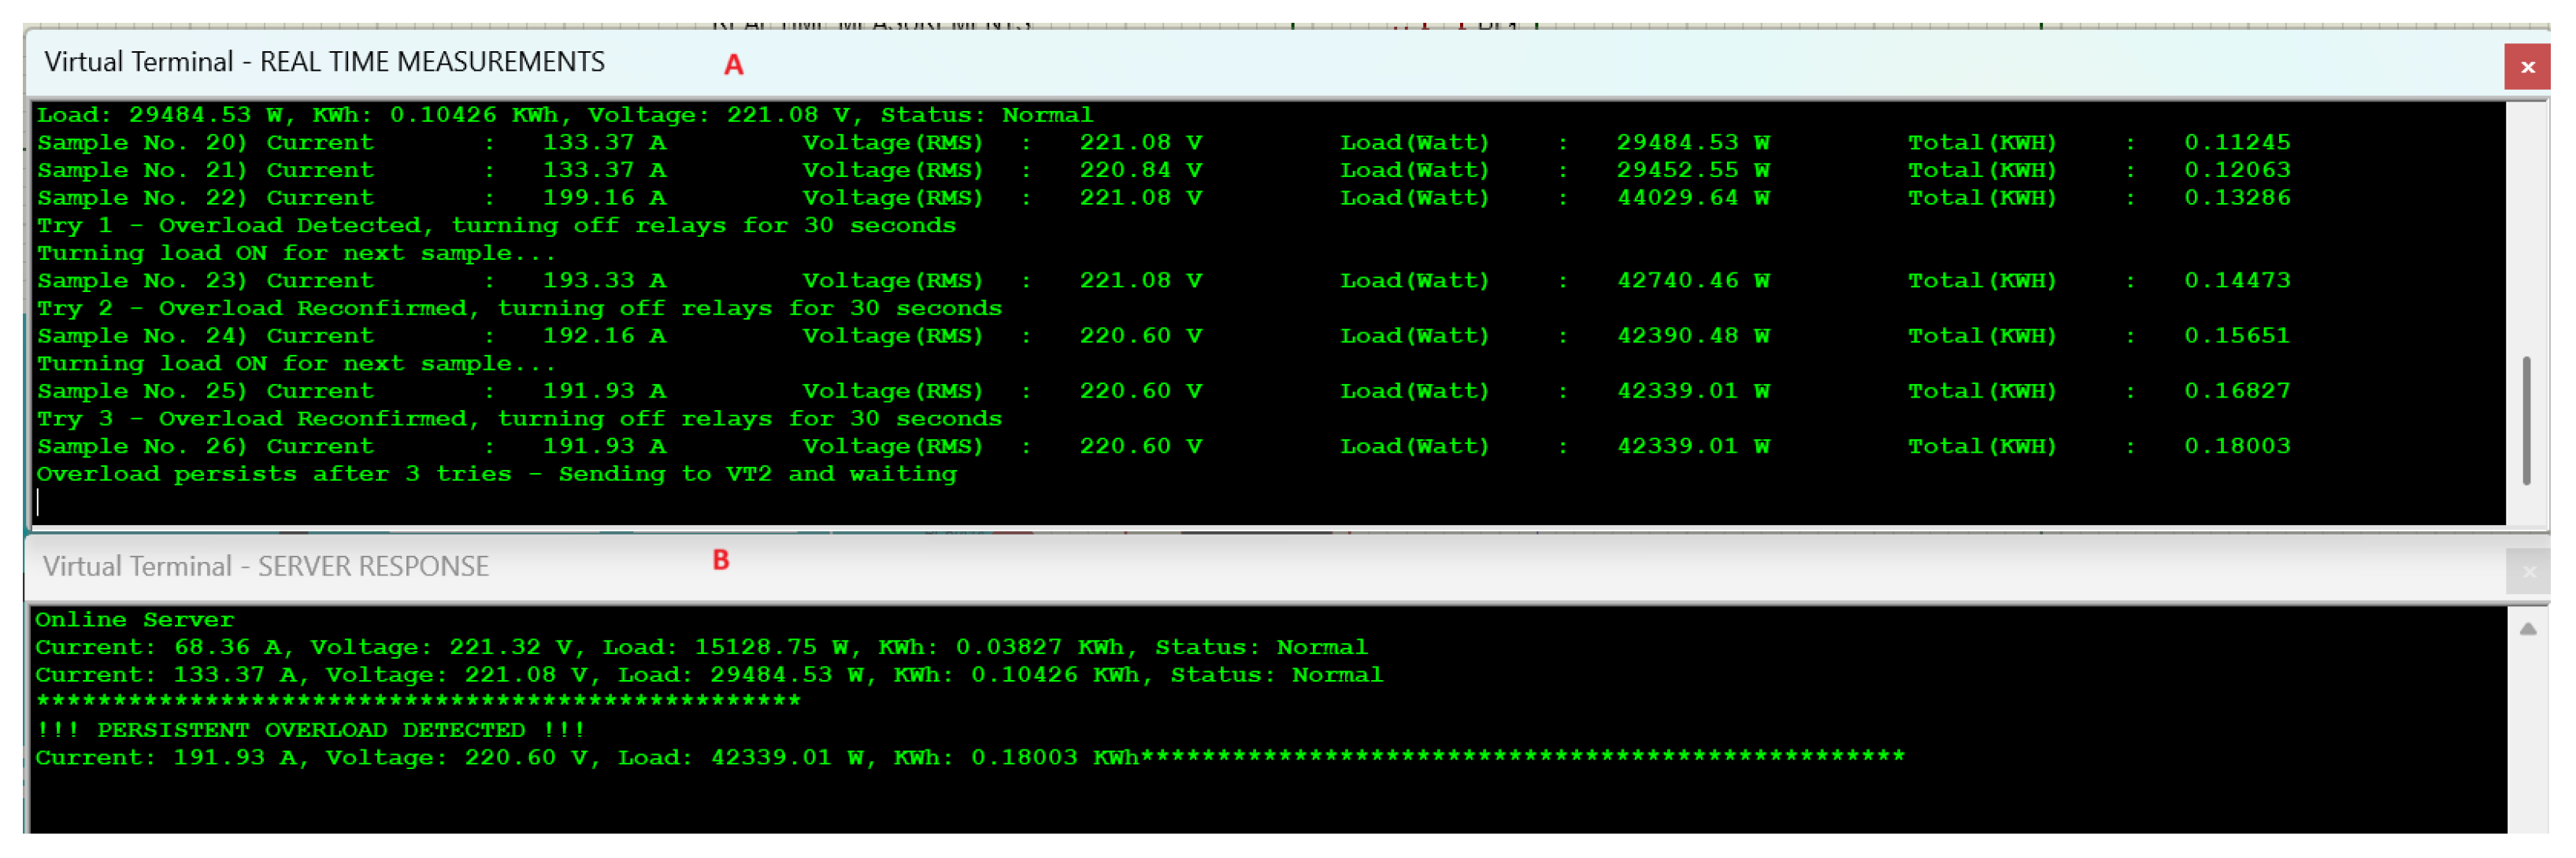
Non-surge faults are categorized as persistent faults caused by L-L, L-G, or overload events in the distribution network. When the designed system encounters this kind of overload, it reports the fault status to the server to keep the system safe. It turns OFF the load side and waits for manual instruction to restore the power.
Figure 8 shows that at “Sample No. 22” on virtual terminal “A”, the system experienced an overload, causing instability and triggering the relay to switch OFF to stabilize the system. The system tried to rectify the fault, but as shown from “Sample Nos. 23–26”, it remained overloaded for all three tries. As defined in the working algorithm, the system declared it as a non-surge fault (virtual terminal A), and the server terminal received the fault status.
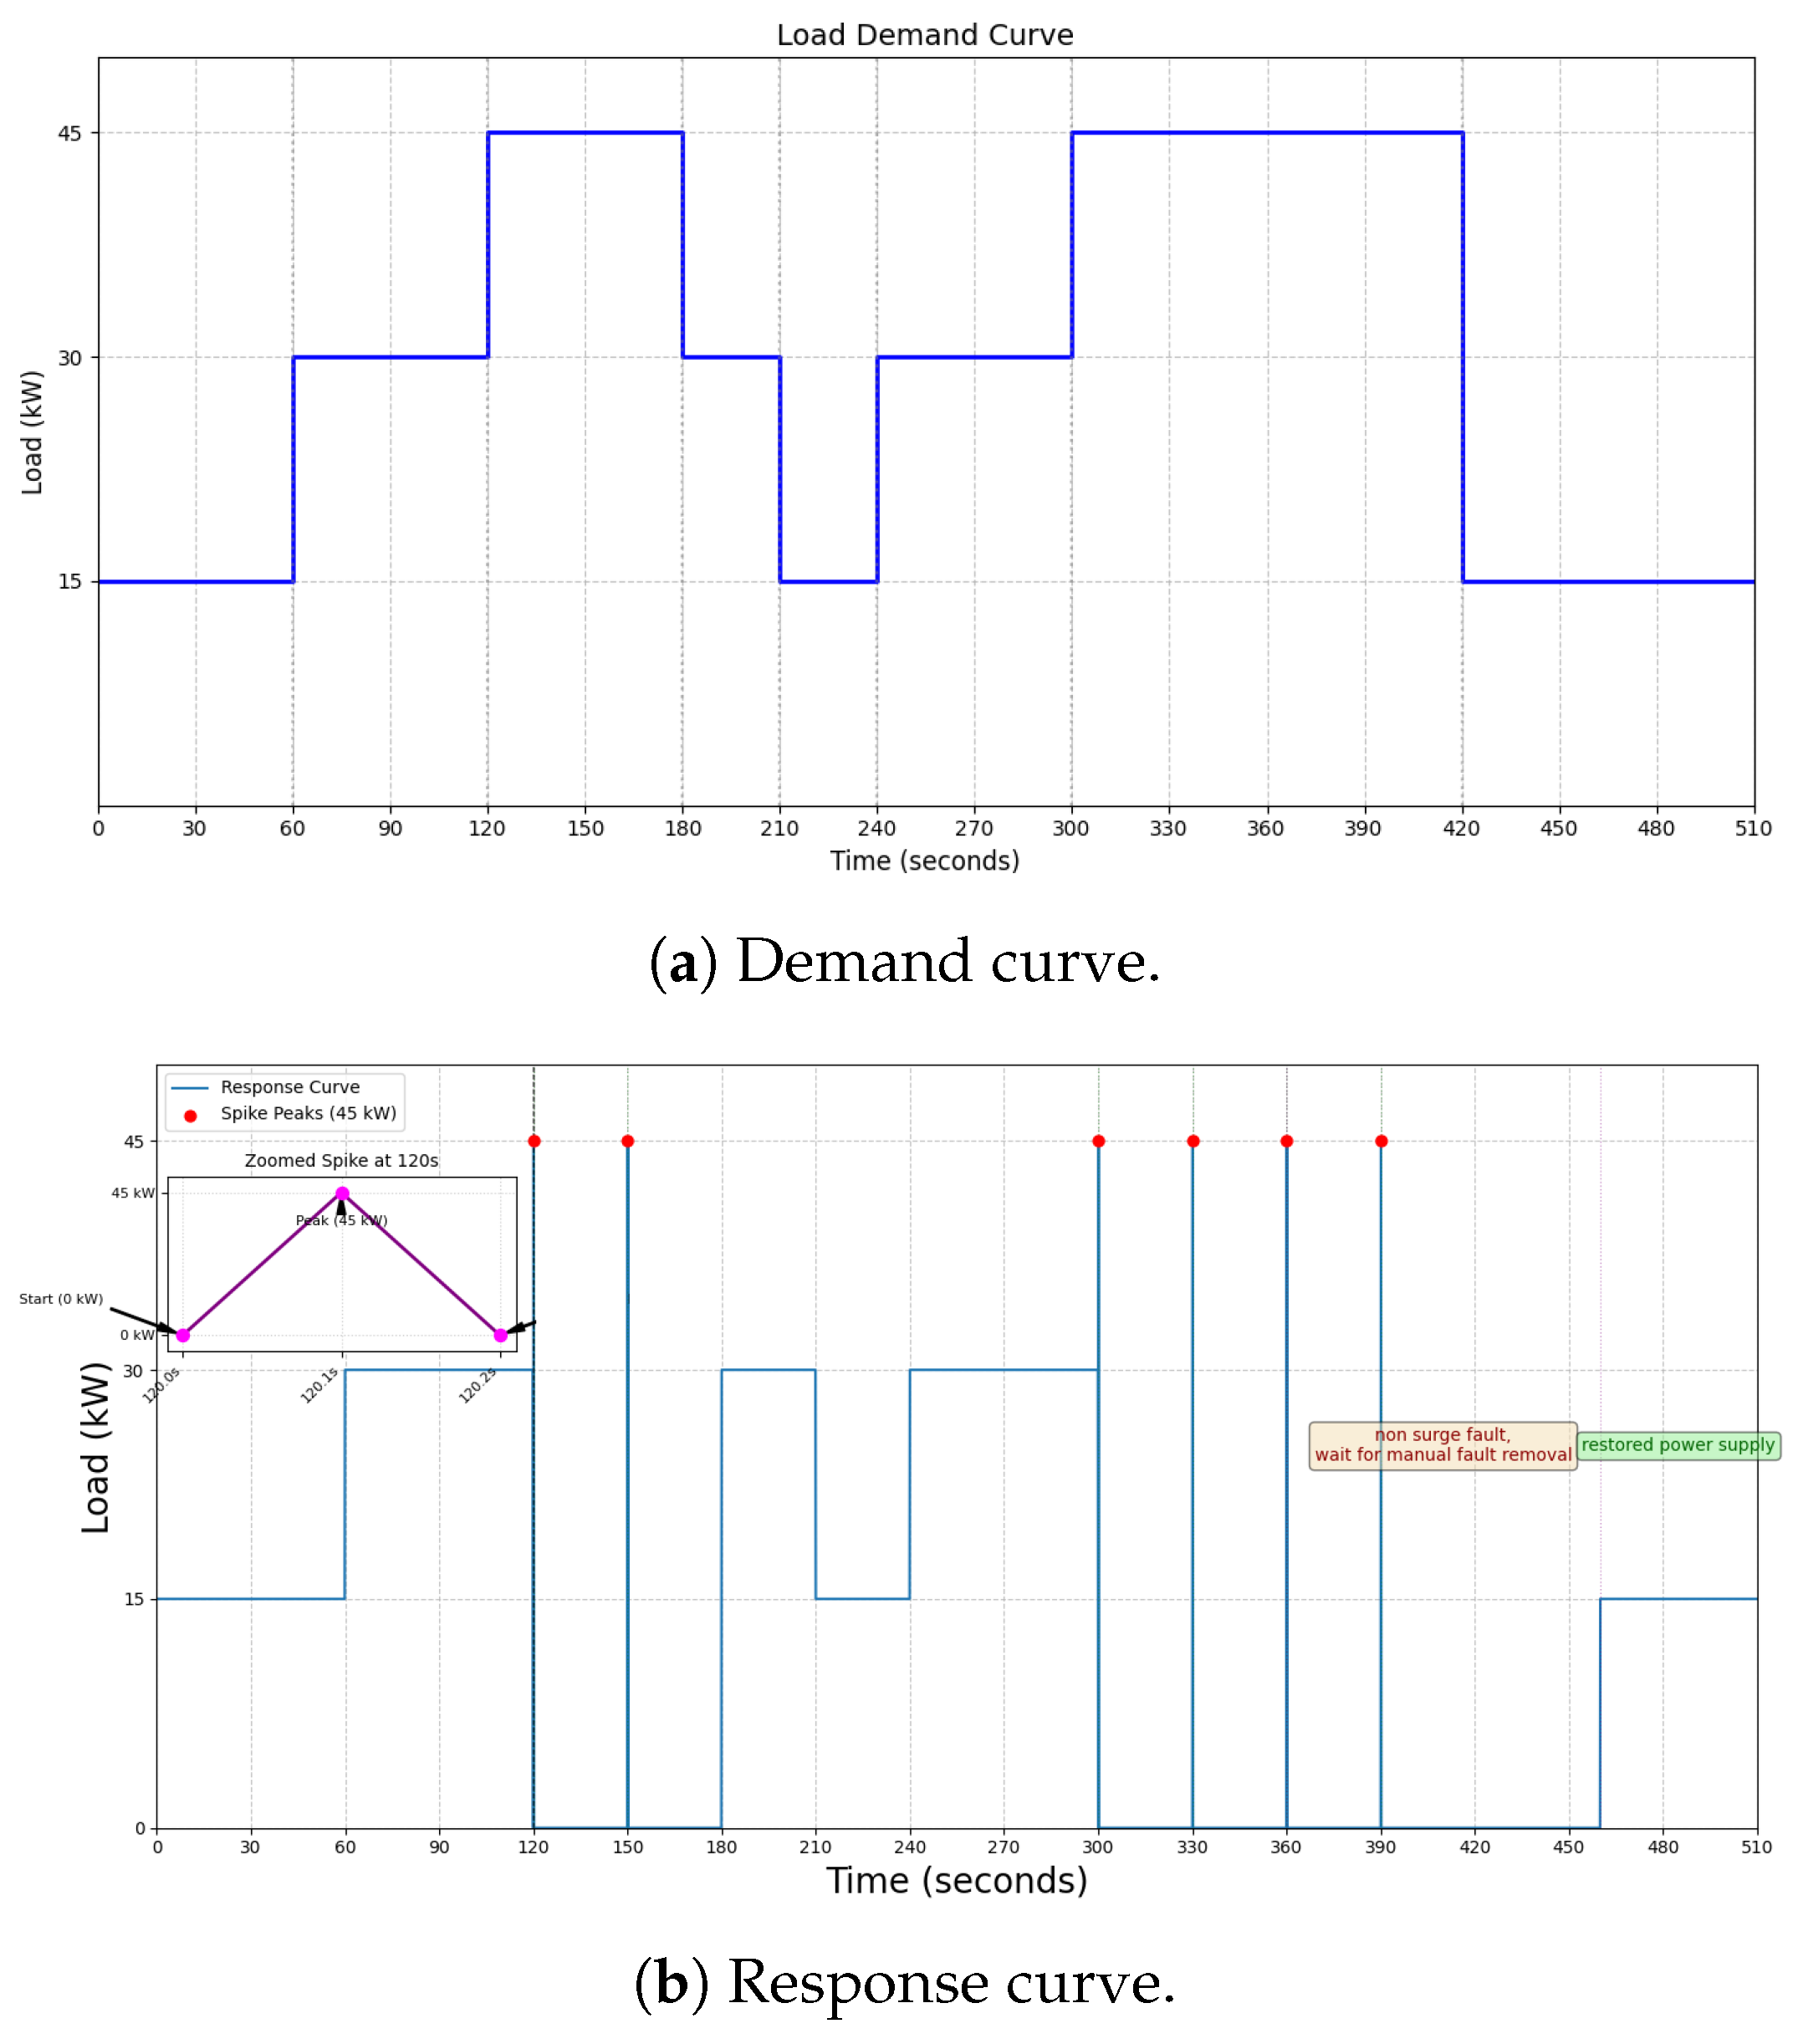
The demand and response curve plotted against time for simulation results shows how the system responds to different demands of loads.
Figure 9a shows the demand curve in kW, and
Figure 9b shows the response curve of the system response to fluctuating load demand. The simulation duration of 510 s was specifically chosen to capture the complete system response for all workflows: steady state (0–120 s), surge fault recovery (120–180 s), non-surge fault escalation (300–390 s), and post-recovery stability (420–510 s). This allows for complete analysis of fault-handling cycles, stresses on the algorithms, and resets of the system. The response curve clearly shows that the system successfully achieves the stability conditions mentioned in
Table 2. The system supplies the load within safe defined limits and turns OFF the supply to the load when its overload causes the system’s instability, which completely justifies our working algorithm.
4.2. Experimental Results
A scaled-down model of the proposed system is implemented to test the real-time response in a physical environment. The experimental setup is tested under different conditions of load (under a safe limit, surge fault, and non-surge fault) to verify its designed operations. The safe threshold of the load is set to 1050 watts, representing a nominal load value of 1000 watts plus 5% tolerance, considering the intrinsic errors of sensors. Moreover, communication components like GSM and the server database are tested using this physically scaled-down model of the system. The system uses an Arduino as a processing board; the Arduino IDE provides the user with a virtual display on a PC to observe the response of hardware models in real time. The hardware model of our system is tested using the same algorithm and conditions but at a scaled-down level with the best available resources. The scaled-down model shows promising results to verify the validity of the methodology in the real model, and it also satisfies the stability analysis.
4.2.1. Smooth Working
During smooth working experimentation, the load is kept within safe, defined load limits, i.e., 1050 kW. The system continues to measure the power parameters and remains in a stable state. To test the transient inrush immunity of the system, inductive loads are also tested to verify the system’s smooth operation.
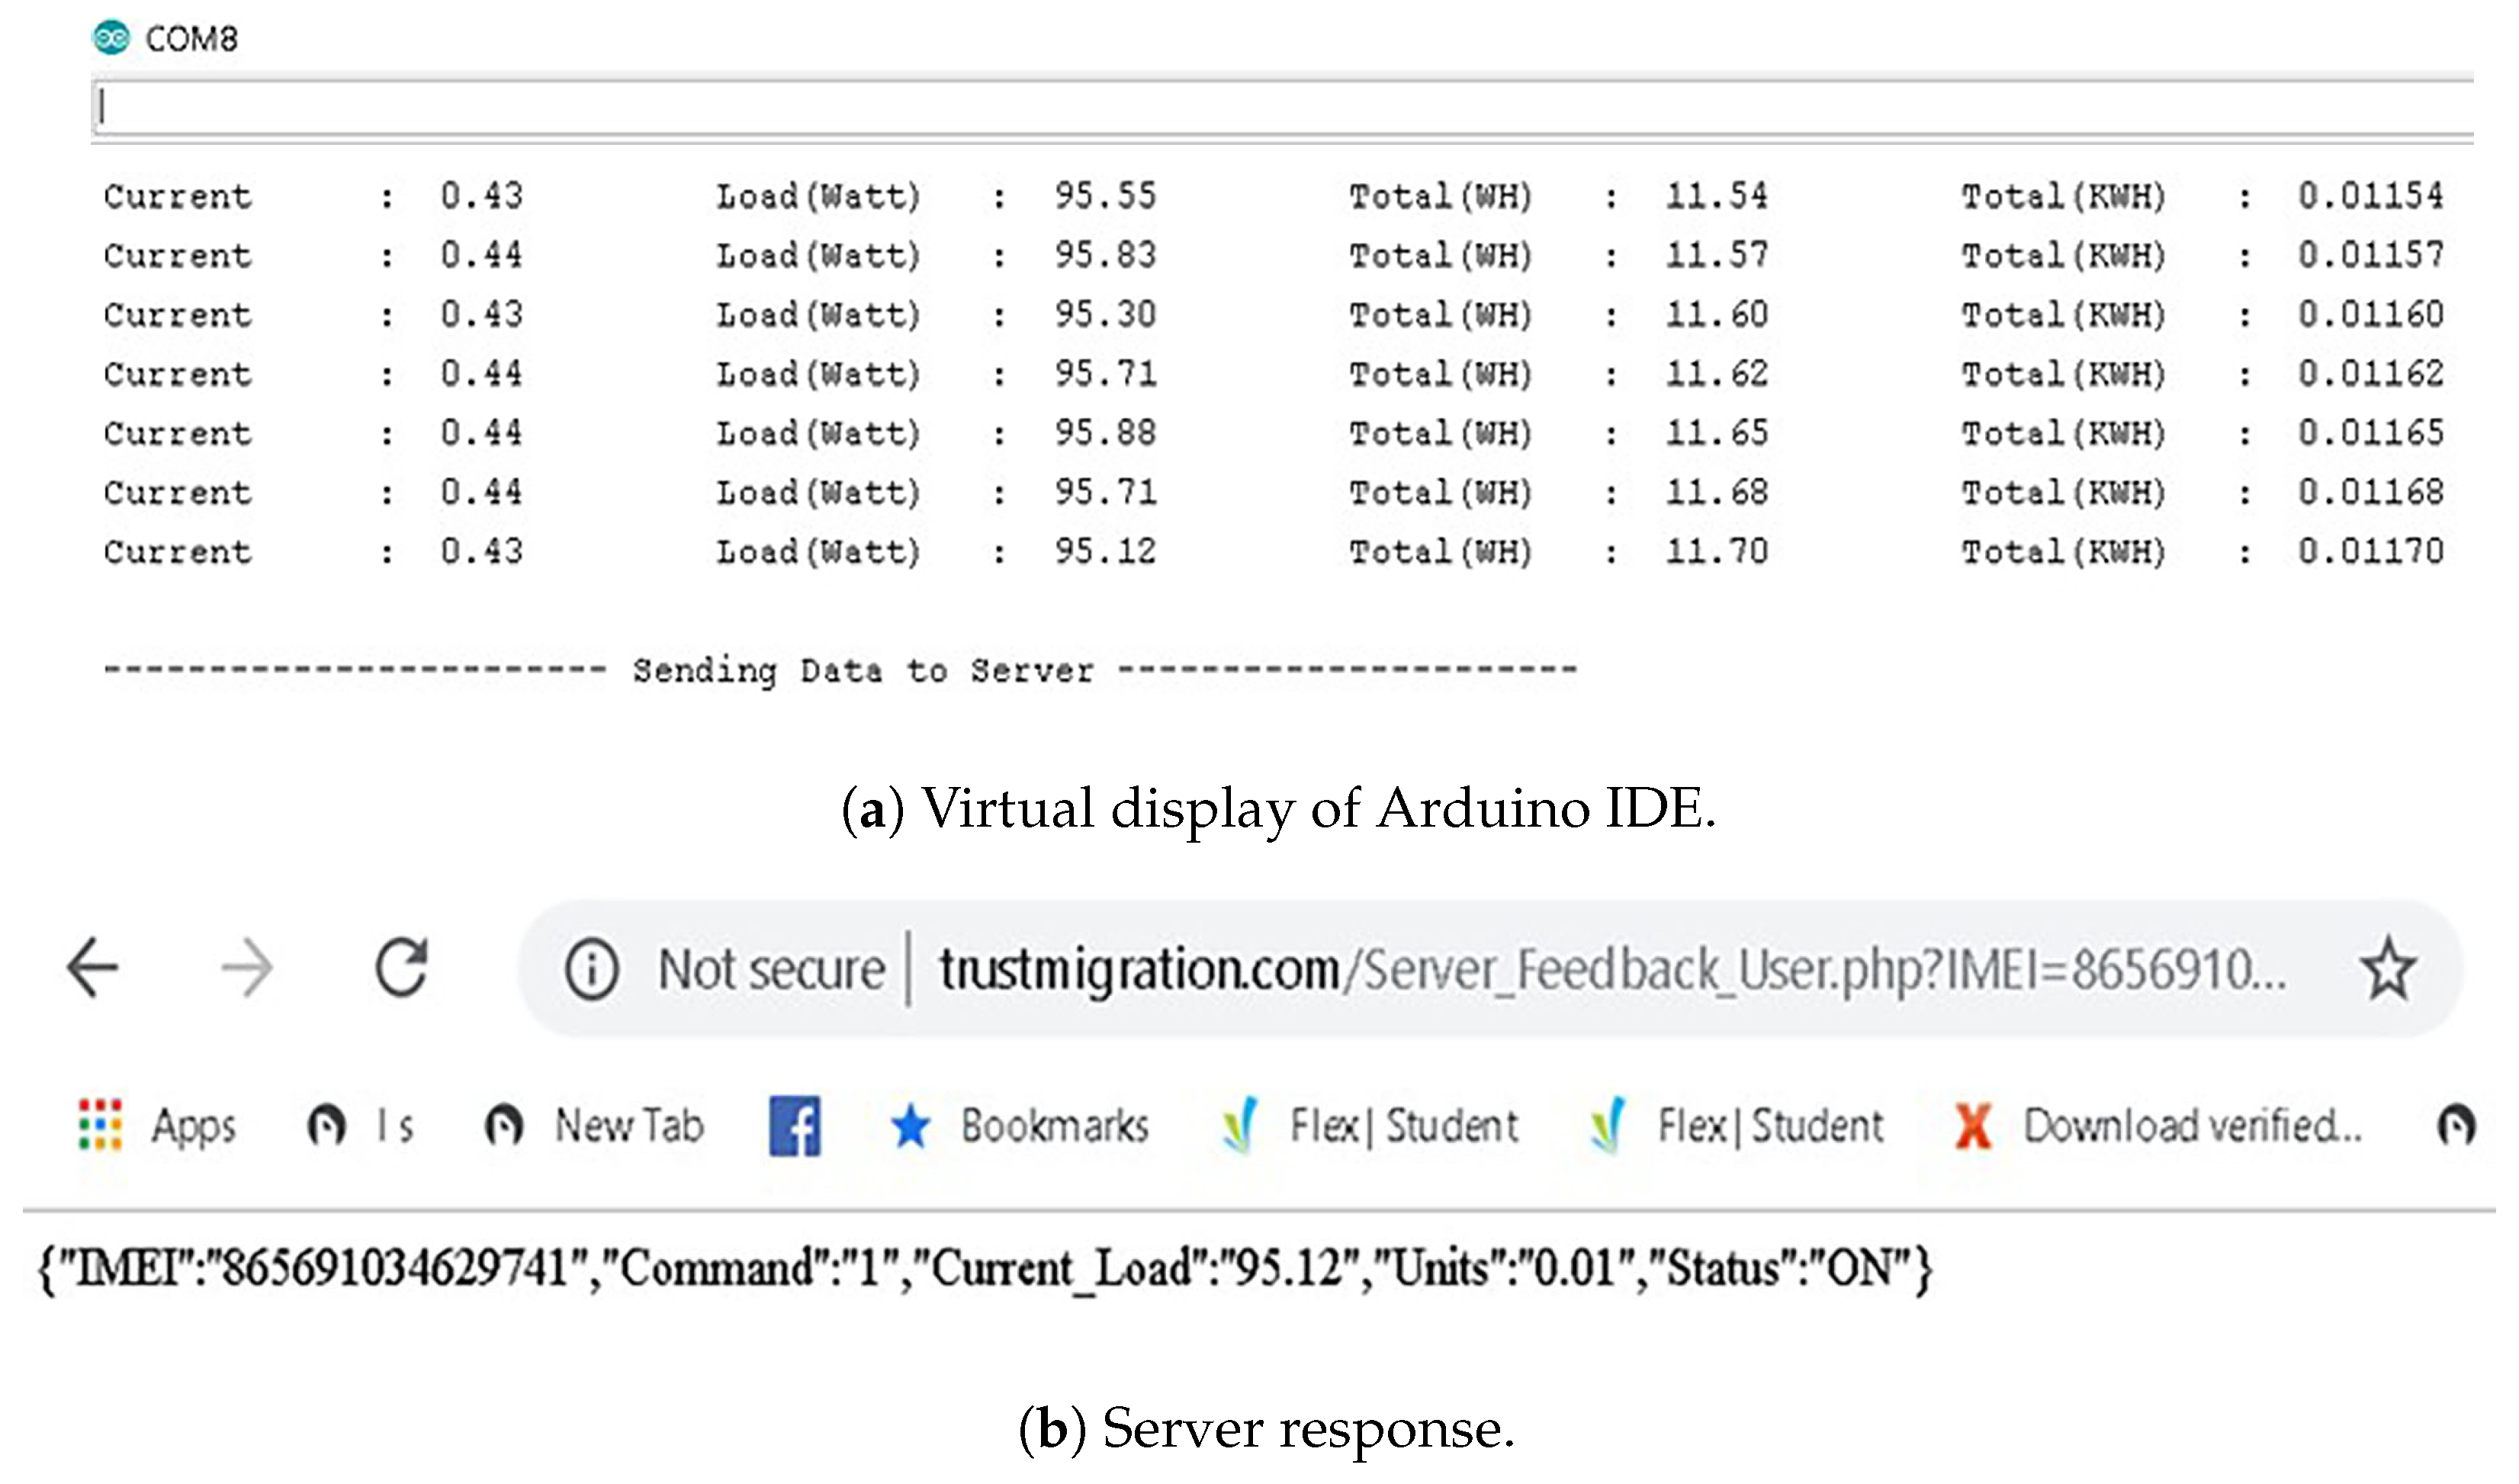
Figure 10a shows the response on the virtual display of the Arduino IDE, and
Figure 10b shows the server’s response in real time. The virtual display verifies that the system continues to measure power parameters, and after 60 s, it sends the information to the server. The server sends an acknowledgment signal upon receiving the collected data. “Command 1” on the server refers to data received under normal operation, and “Status” is the node’s current status, which is “ON” in this condition.
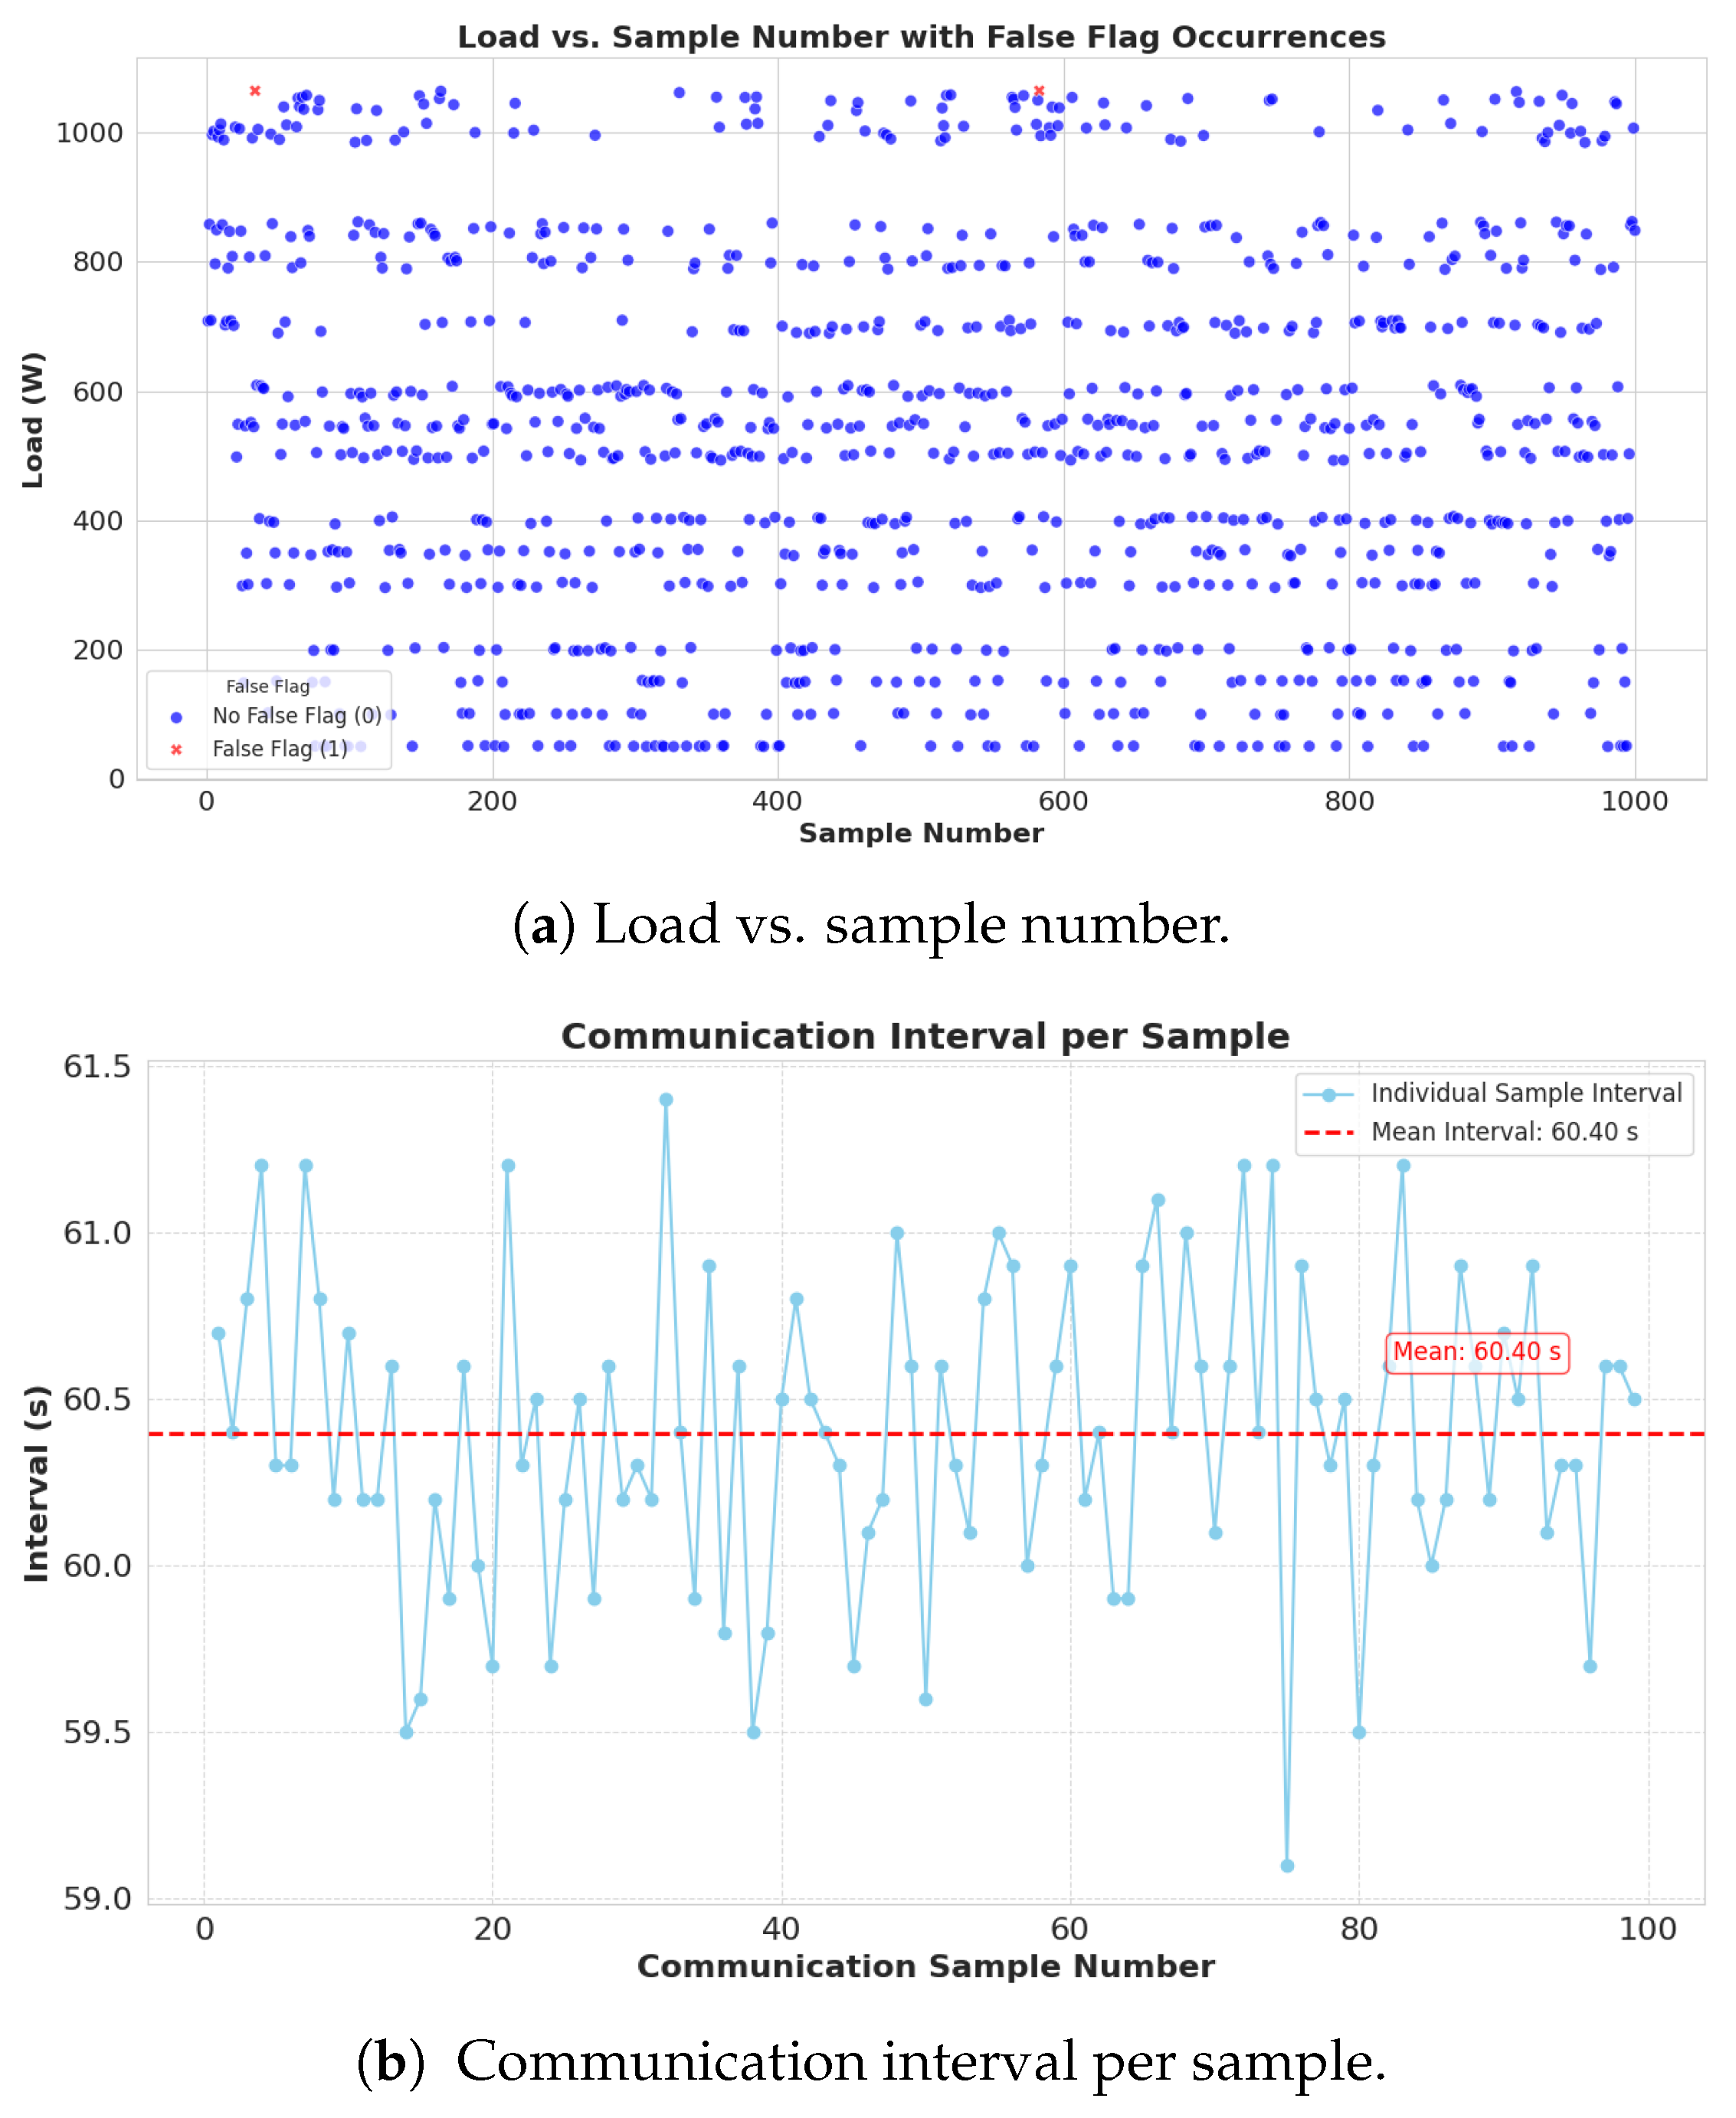
To further validate the performance of the system in smooth operation, six load values were generated and programmed to switch ON and OFF randomly. It was tested for 1000 samples, with each sample having an interval of 6 s. Through this extended experimentation, load values remained within the safe limit of the system.
Figure 11a plots the “Sample Number” vs. “ Load (w)”, showing that two false flags were triggered in 1000 samples of time, and all the flags were triggered at the upper threshold. Experimental results confirm 99.8% accuracy of the proposed model in real-world testing during smooth operation. Furthermore,
Figure 11b shows the time taken by the system to send each sample to the server. The experimentation confirms that it sends a sample to the server with an average interval of 60.4 s, verifying that the frequency of data received at the server during experimentation is closely aligned with the designed 60 s interval.
4.2.2. Surge Fault
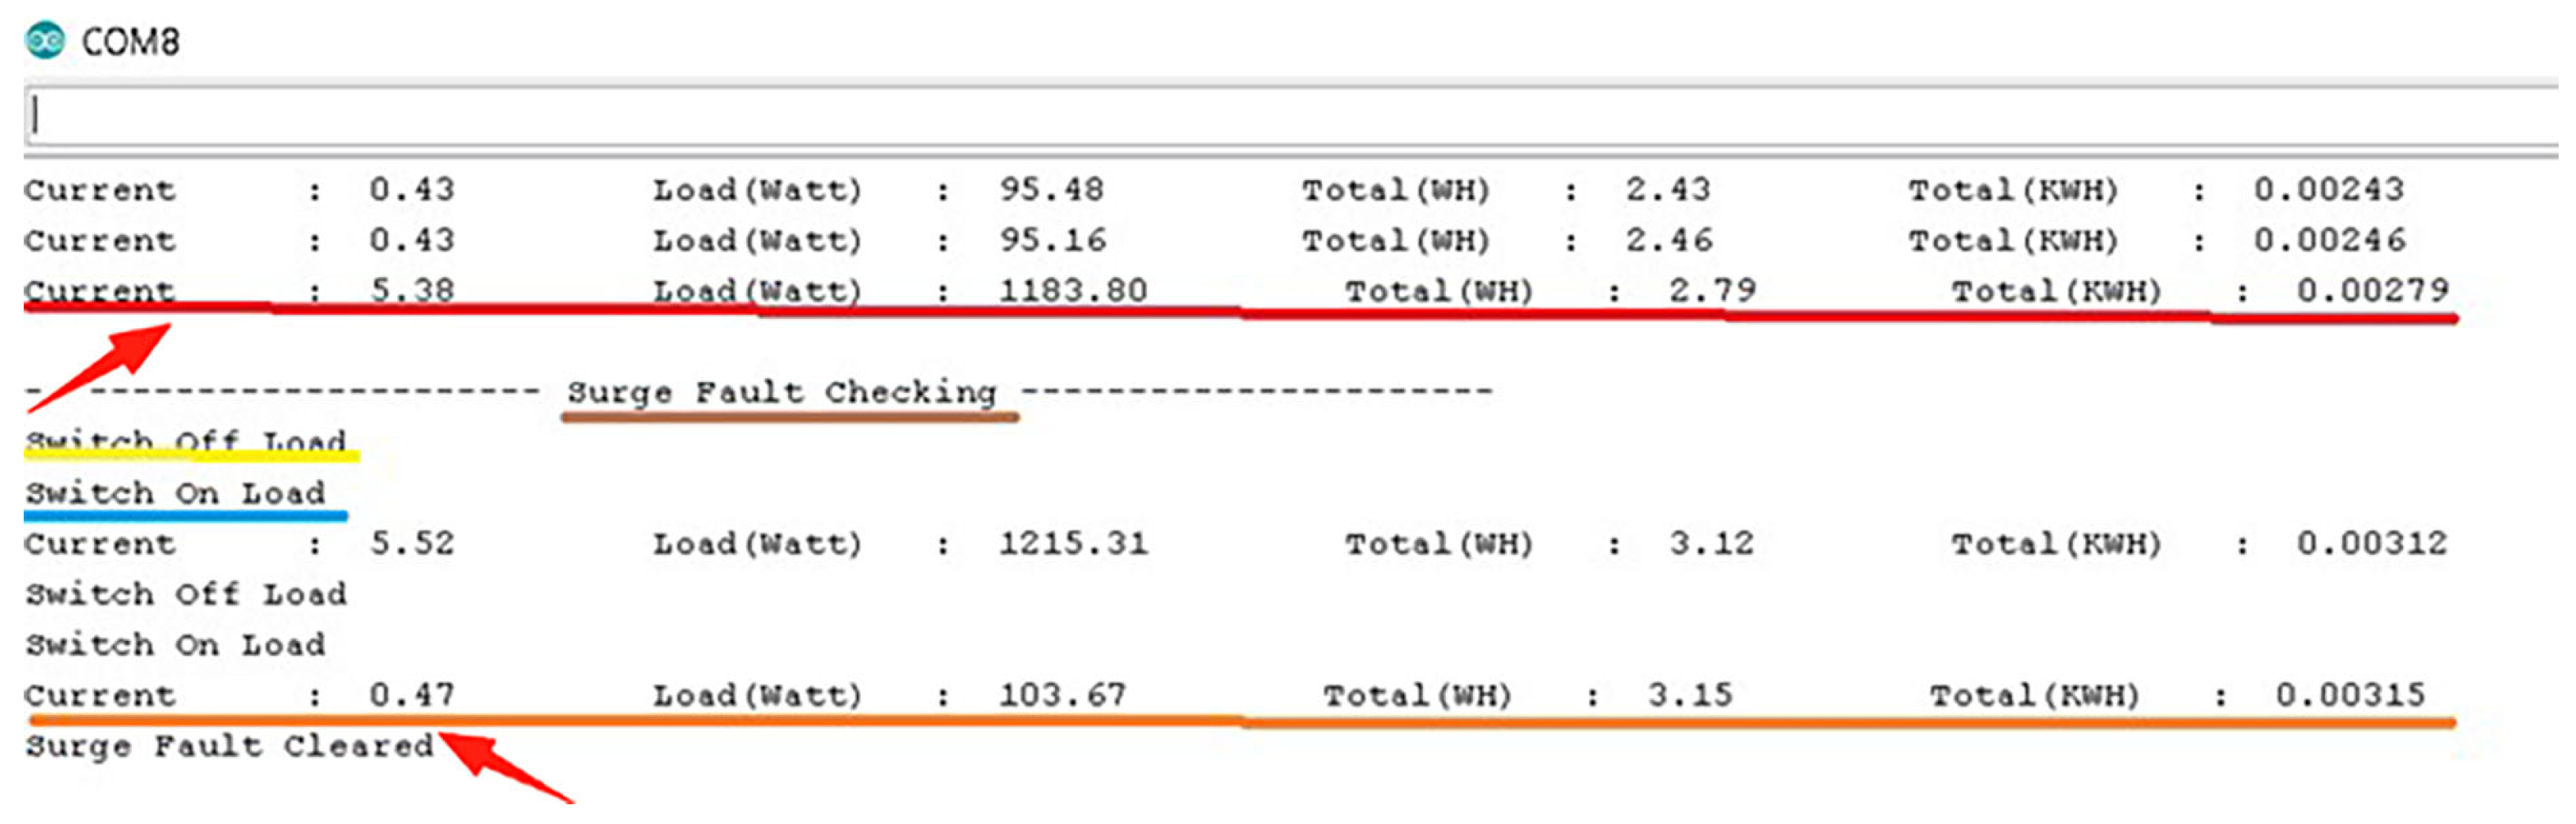
To test the system under surge fault conditions, an overload is generated for a short interval of time and then removed.
Figure 12 shows that the virtual terminal of the Arduino experienced an overload (marked with a red arrow) and it turned OFF the load, waited for 30 s, and again turned it ON. It still showed an overload, so the system gave a second try. This time the load successfully returned to the safe limit, and virtual terminal displayed the message “Surge Fault Cleared”, allowing the system to resume smooth operation. So the system detected, responded to, and cleared a surge fault automatically, validating the designed algorithm for the system.
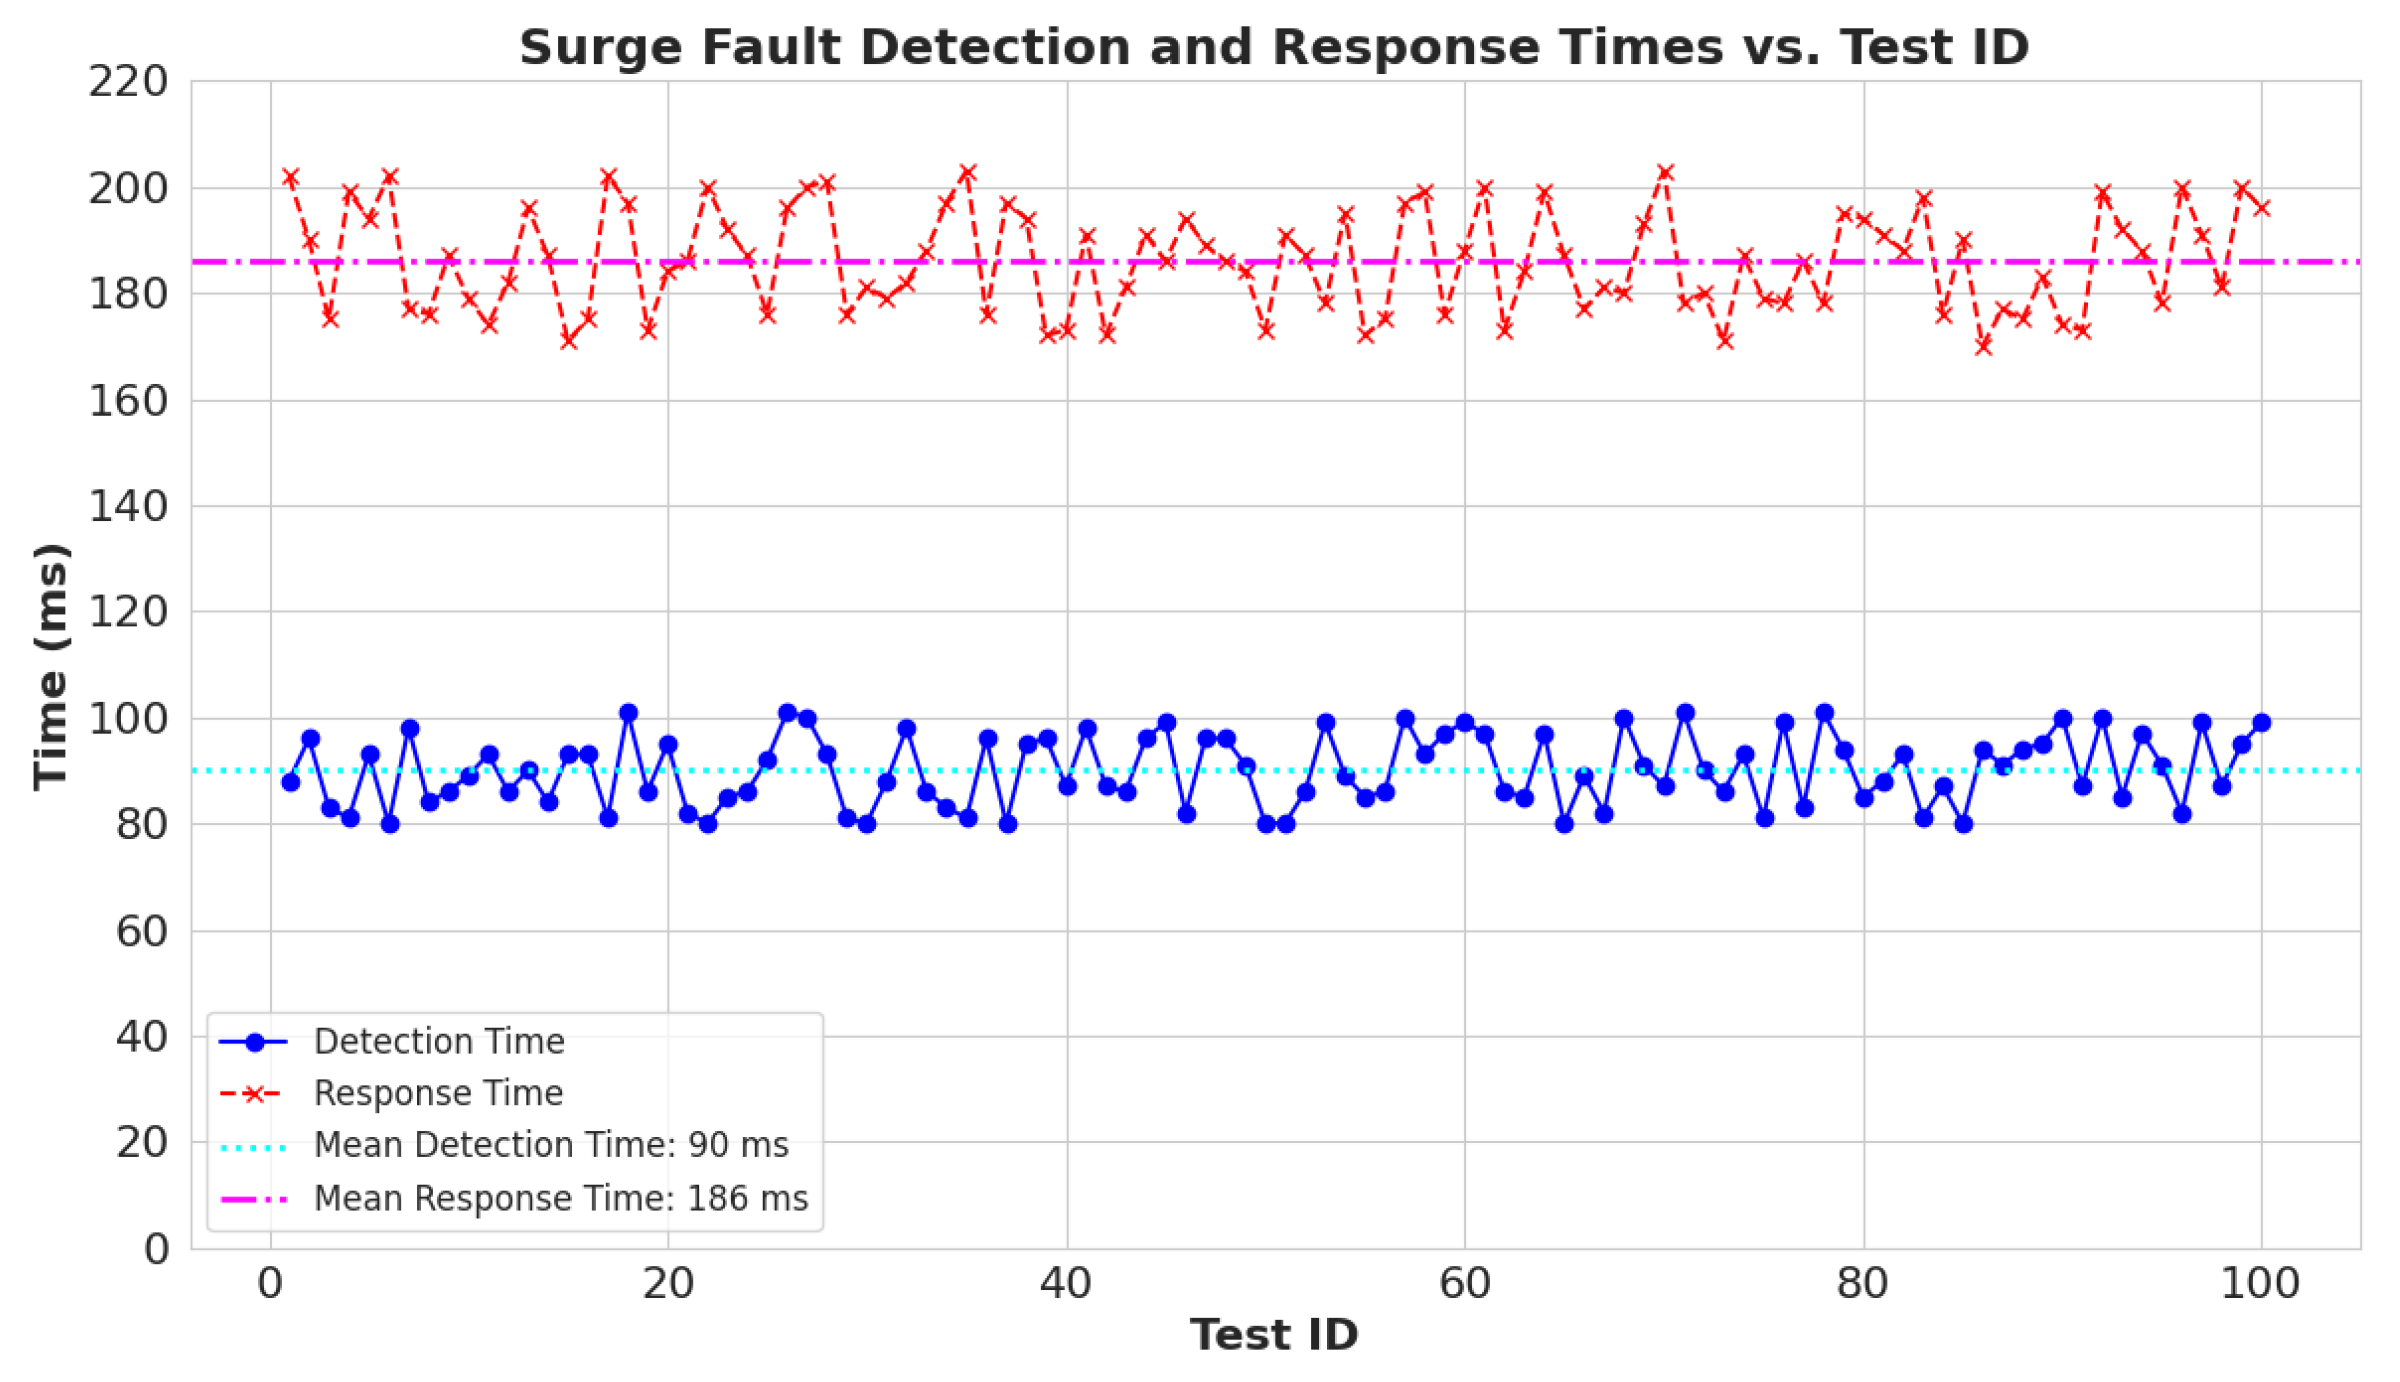
To empirically test the surge fault detection and response of the system, 100 surge faults are generated, and the detection and response times are observed. Our system has a 20 Hz (making a 50 ms loop cycle) refresh rate for the sensors’ values. The detection and response time of each surge sample is plotted to visualize the experimental results of the system during the surge fault conditions.
Figure 13 illustrates the system’s time of detection and response to a fault in milliseconds. The experiment confirms that the mean detection time is 90 ms and the mean response time is 186 ms, confirming the system’s real-time detection and on-node resolution action in case of surge faults.
4.2.3. Non-Surge Fault
Persistent faults are generated to verify the working system under non-surge fault conditions. Persistent faults that are not resolved by the system’s auto recovery (three attempts) are communicated to the control center for operator-supervised intervention. This ensures the safety of the system, as critical faults are handled by trained professionals. The system is kept OFF until the fault is manually resolved and the system receives a command from the server to start normal operation again.
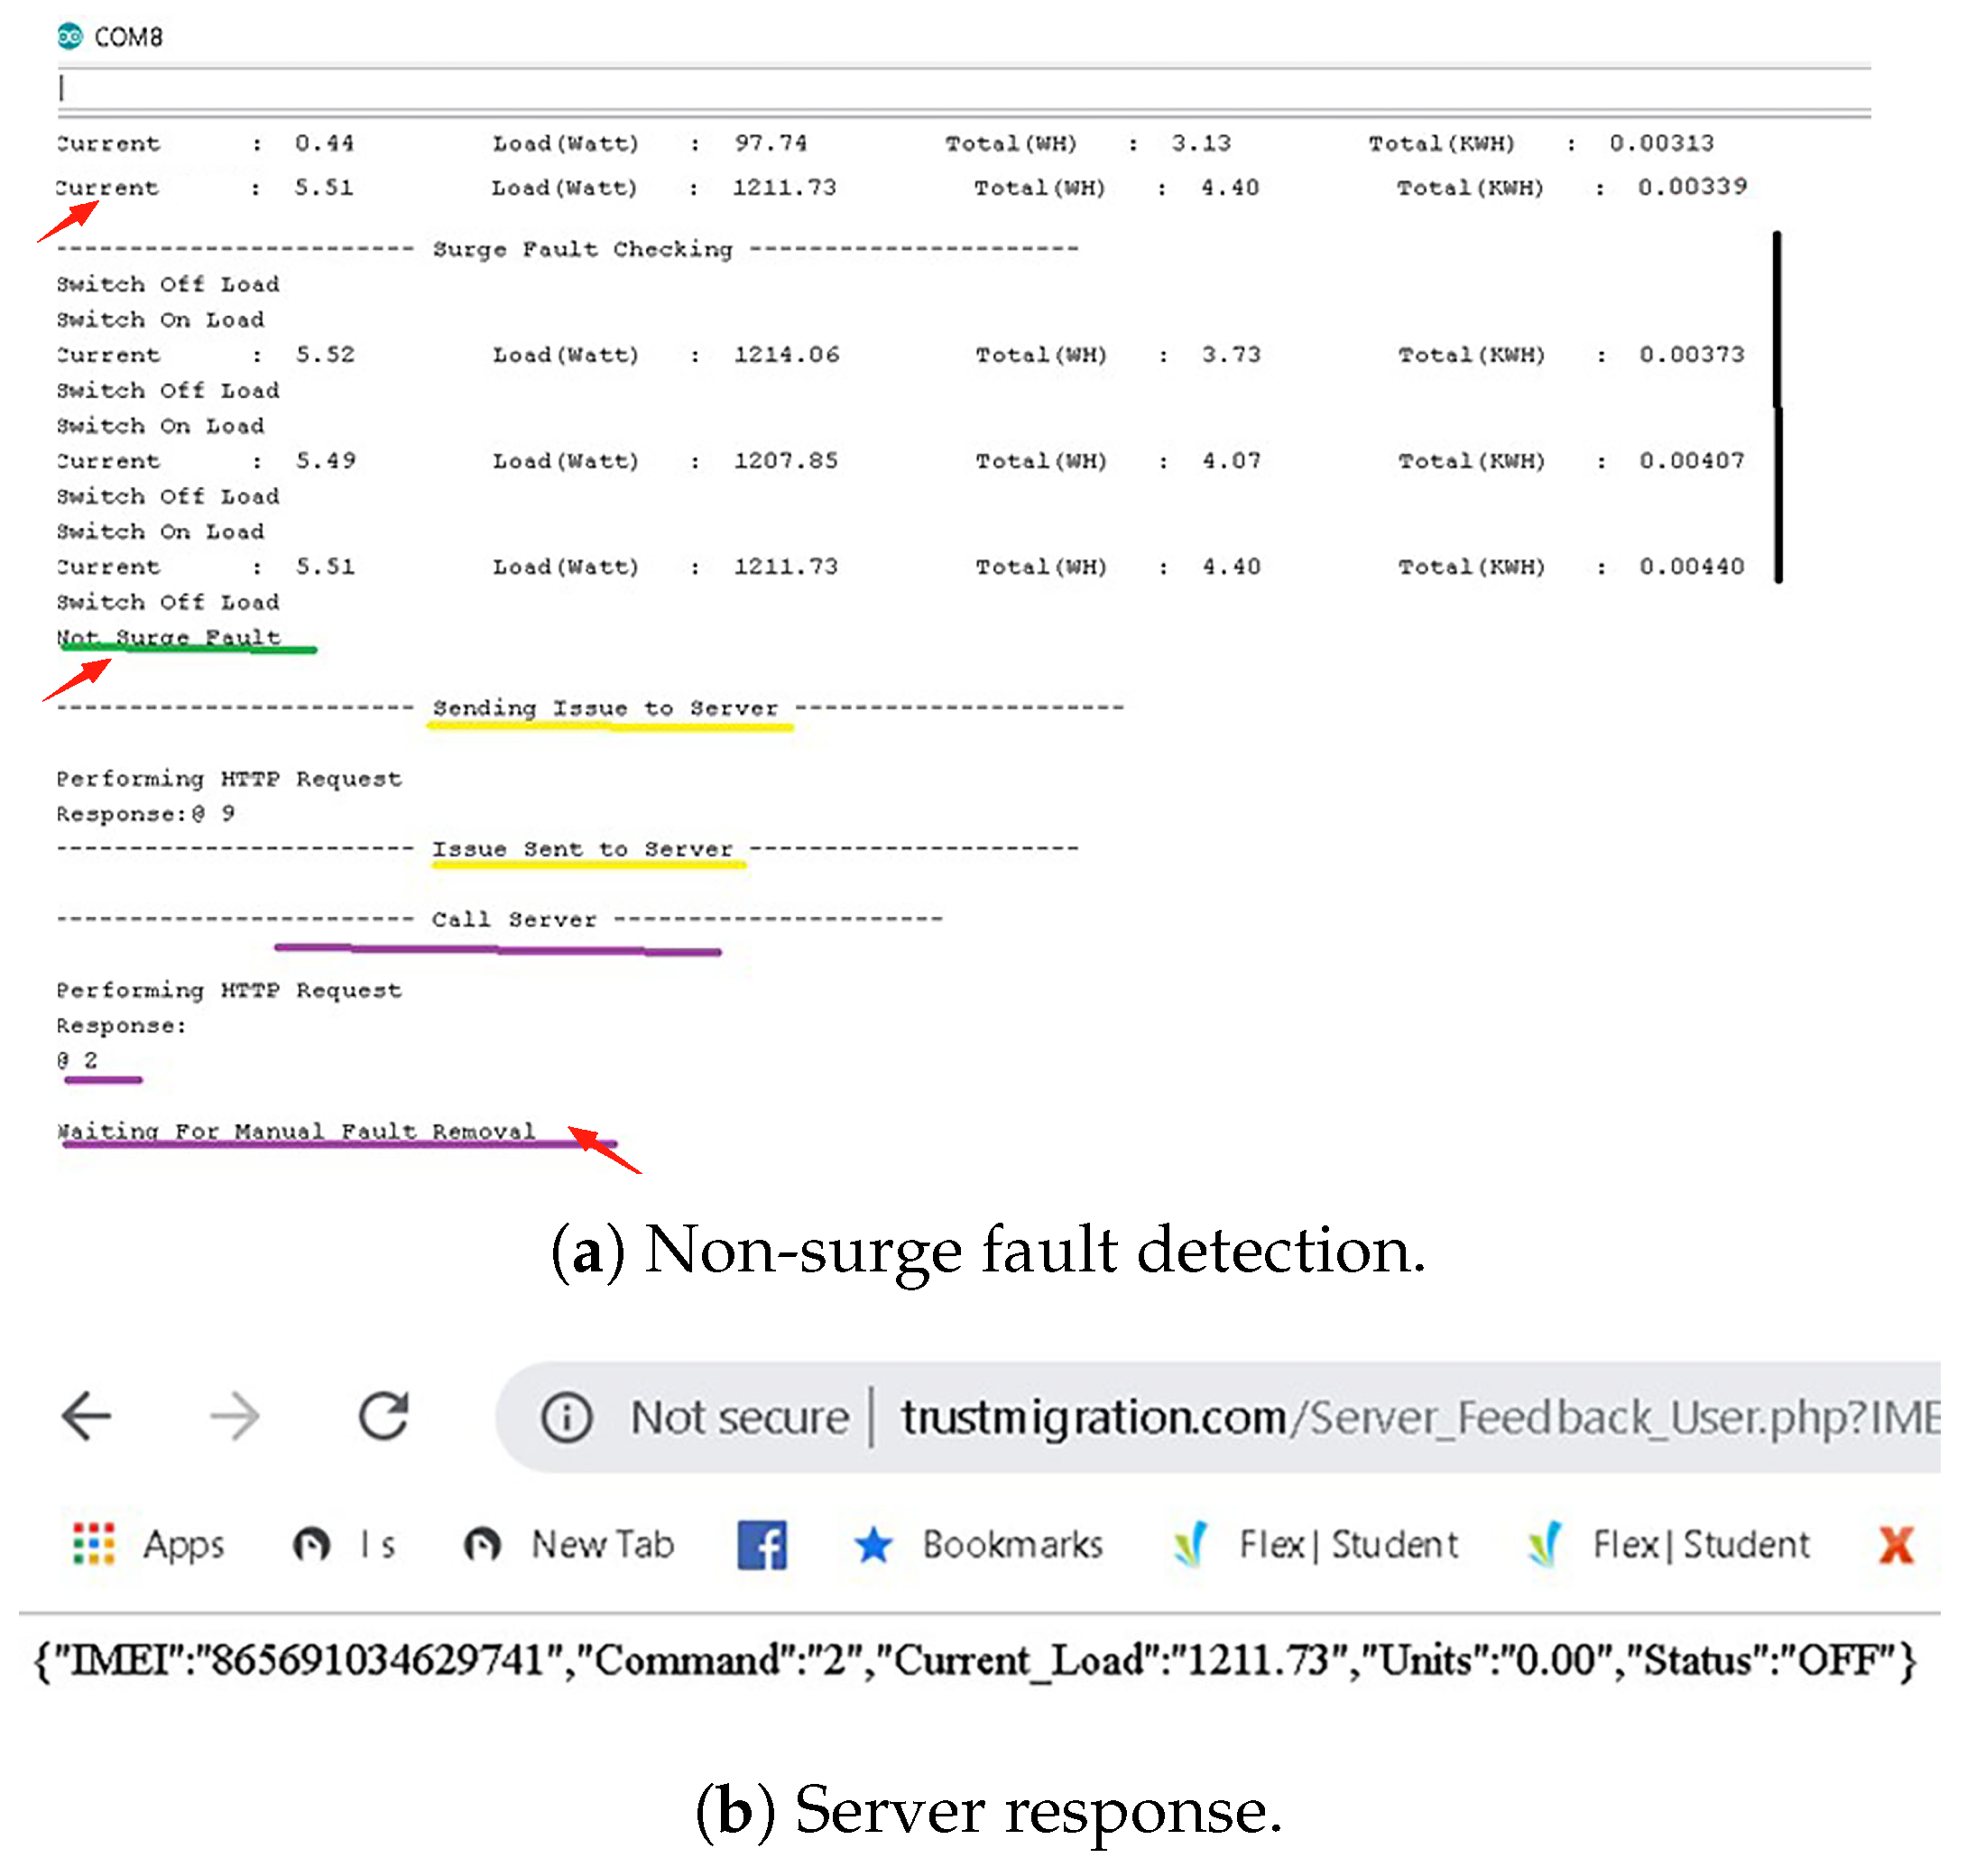
Figure 14a shows that the system experienced an overload (marked with red arrows) and made three attempts with a 30 s interval to restore power, but the system remained overloaded. After three attempts and 90 s, the system sent the issue to the server and got a response of “2” (marked in purple), which means the fault status was successfully updated to the server and the system was currently waiting for manual fault rectification.
Figure 14b shows the real-time server response on a web page. This demonstrates that the server received the critical information send by hardware model, i.e., information on the overload and the status of the system (OFF) with the unique IMEI of that system. Once the overload was removed, remote instruction was sent using an HTTP link to the server.
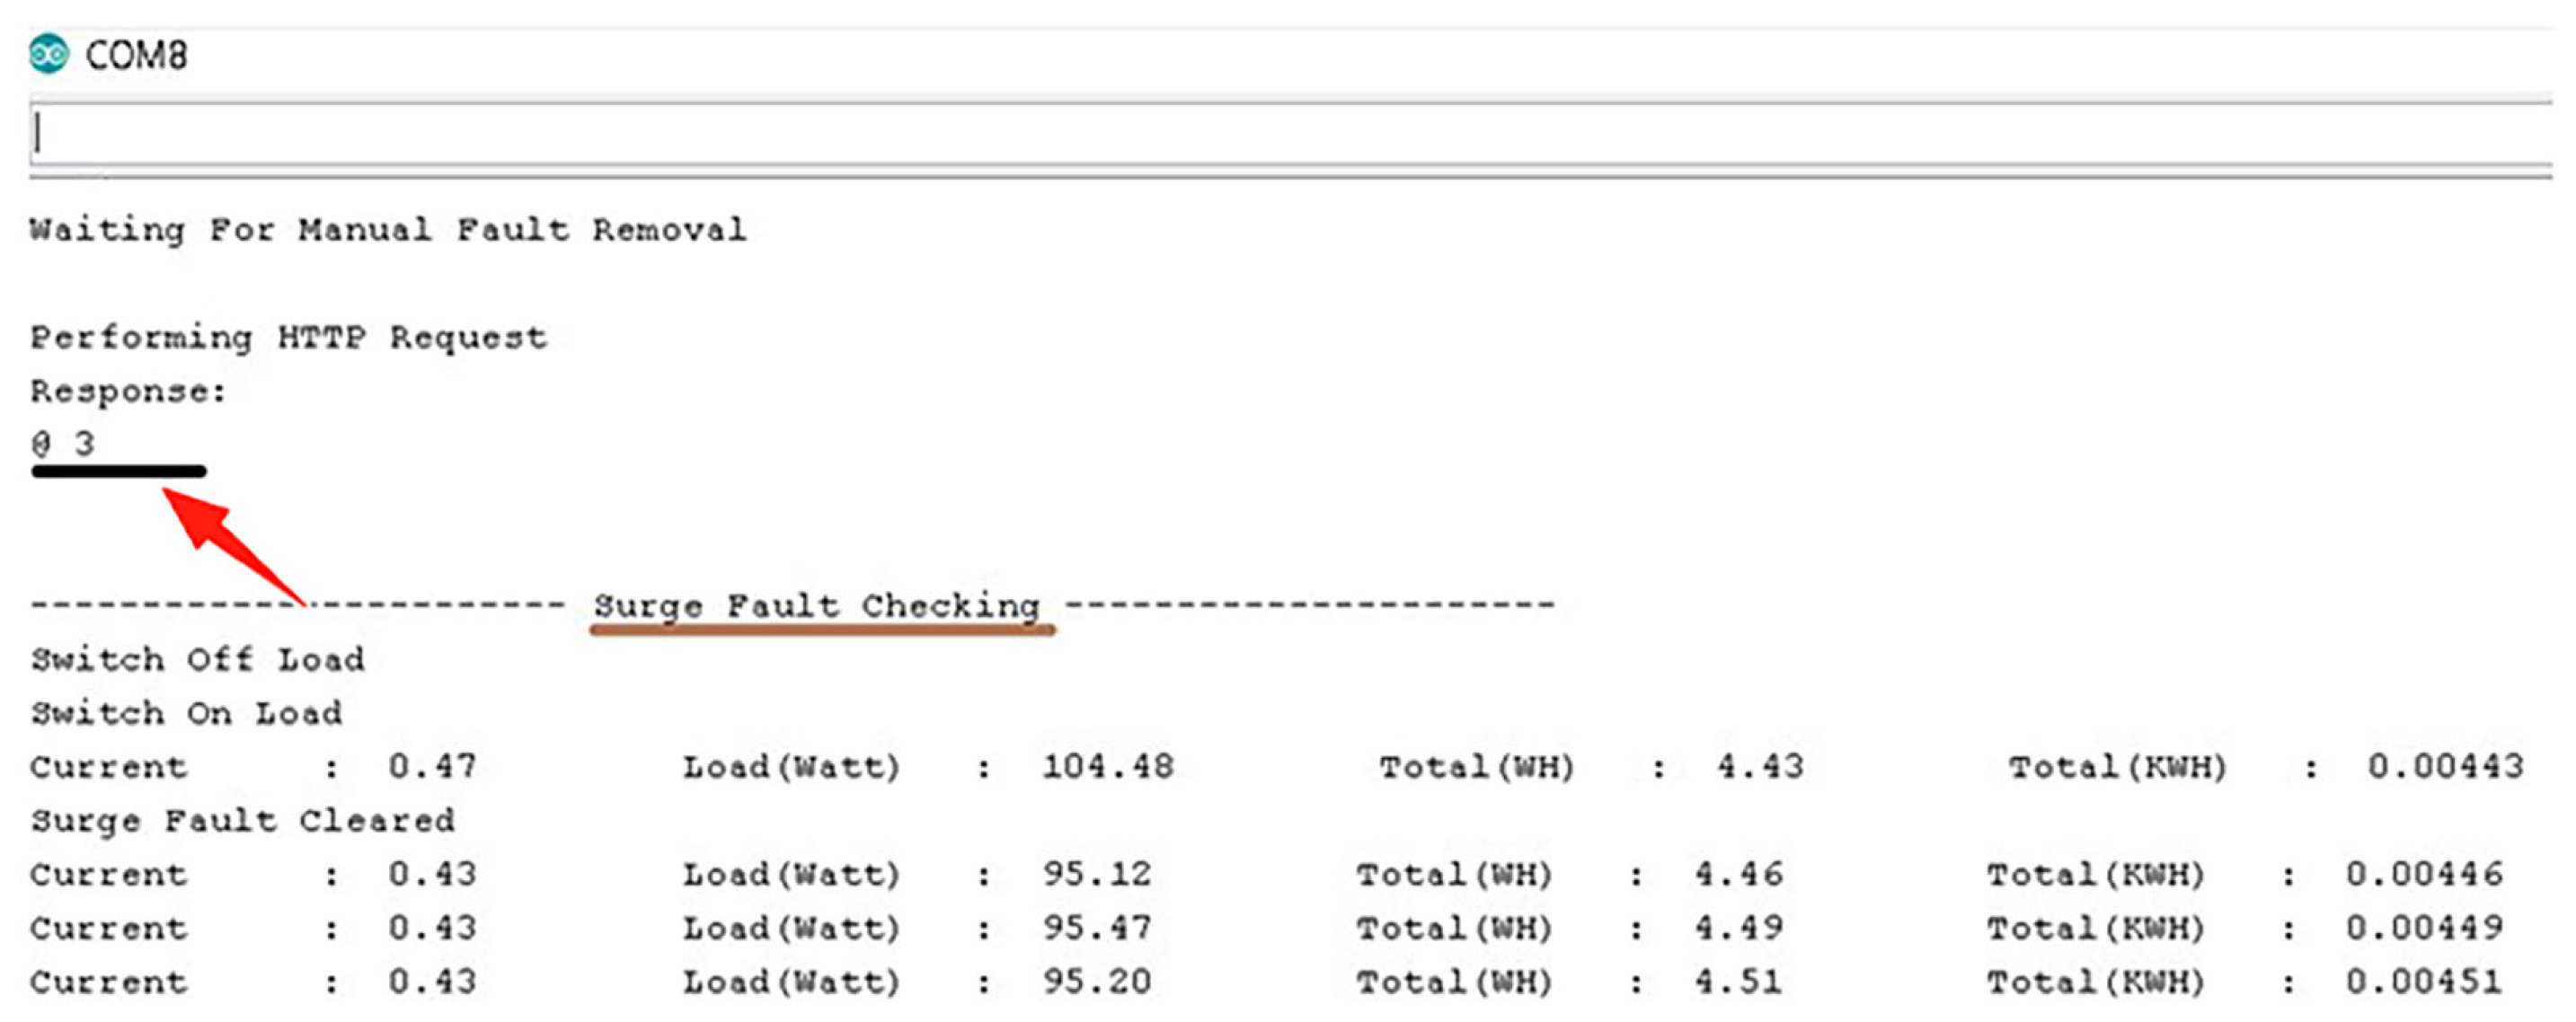
Figure 15 shows the system waiting for manual fault rectification. As soon as it received a response from the server (a response of 3, marked with a red arrow, means fault removed), the system first checked if it was still overloaded and then turned ON the power supply.
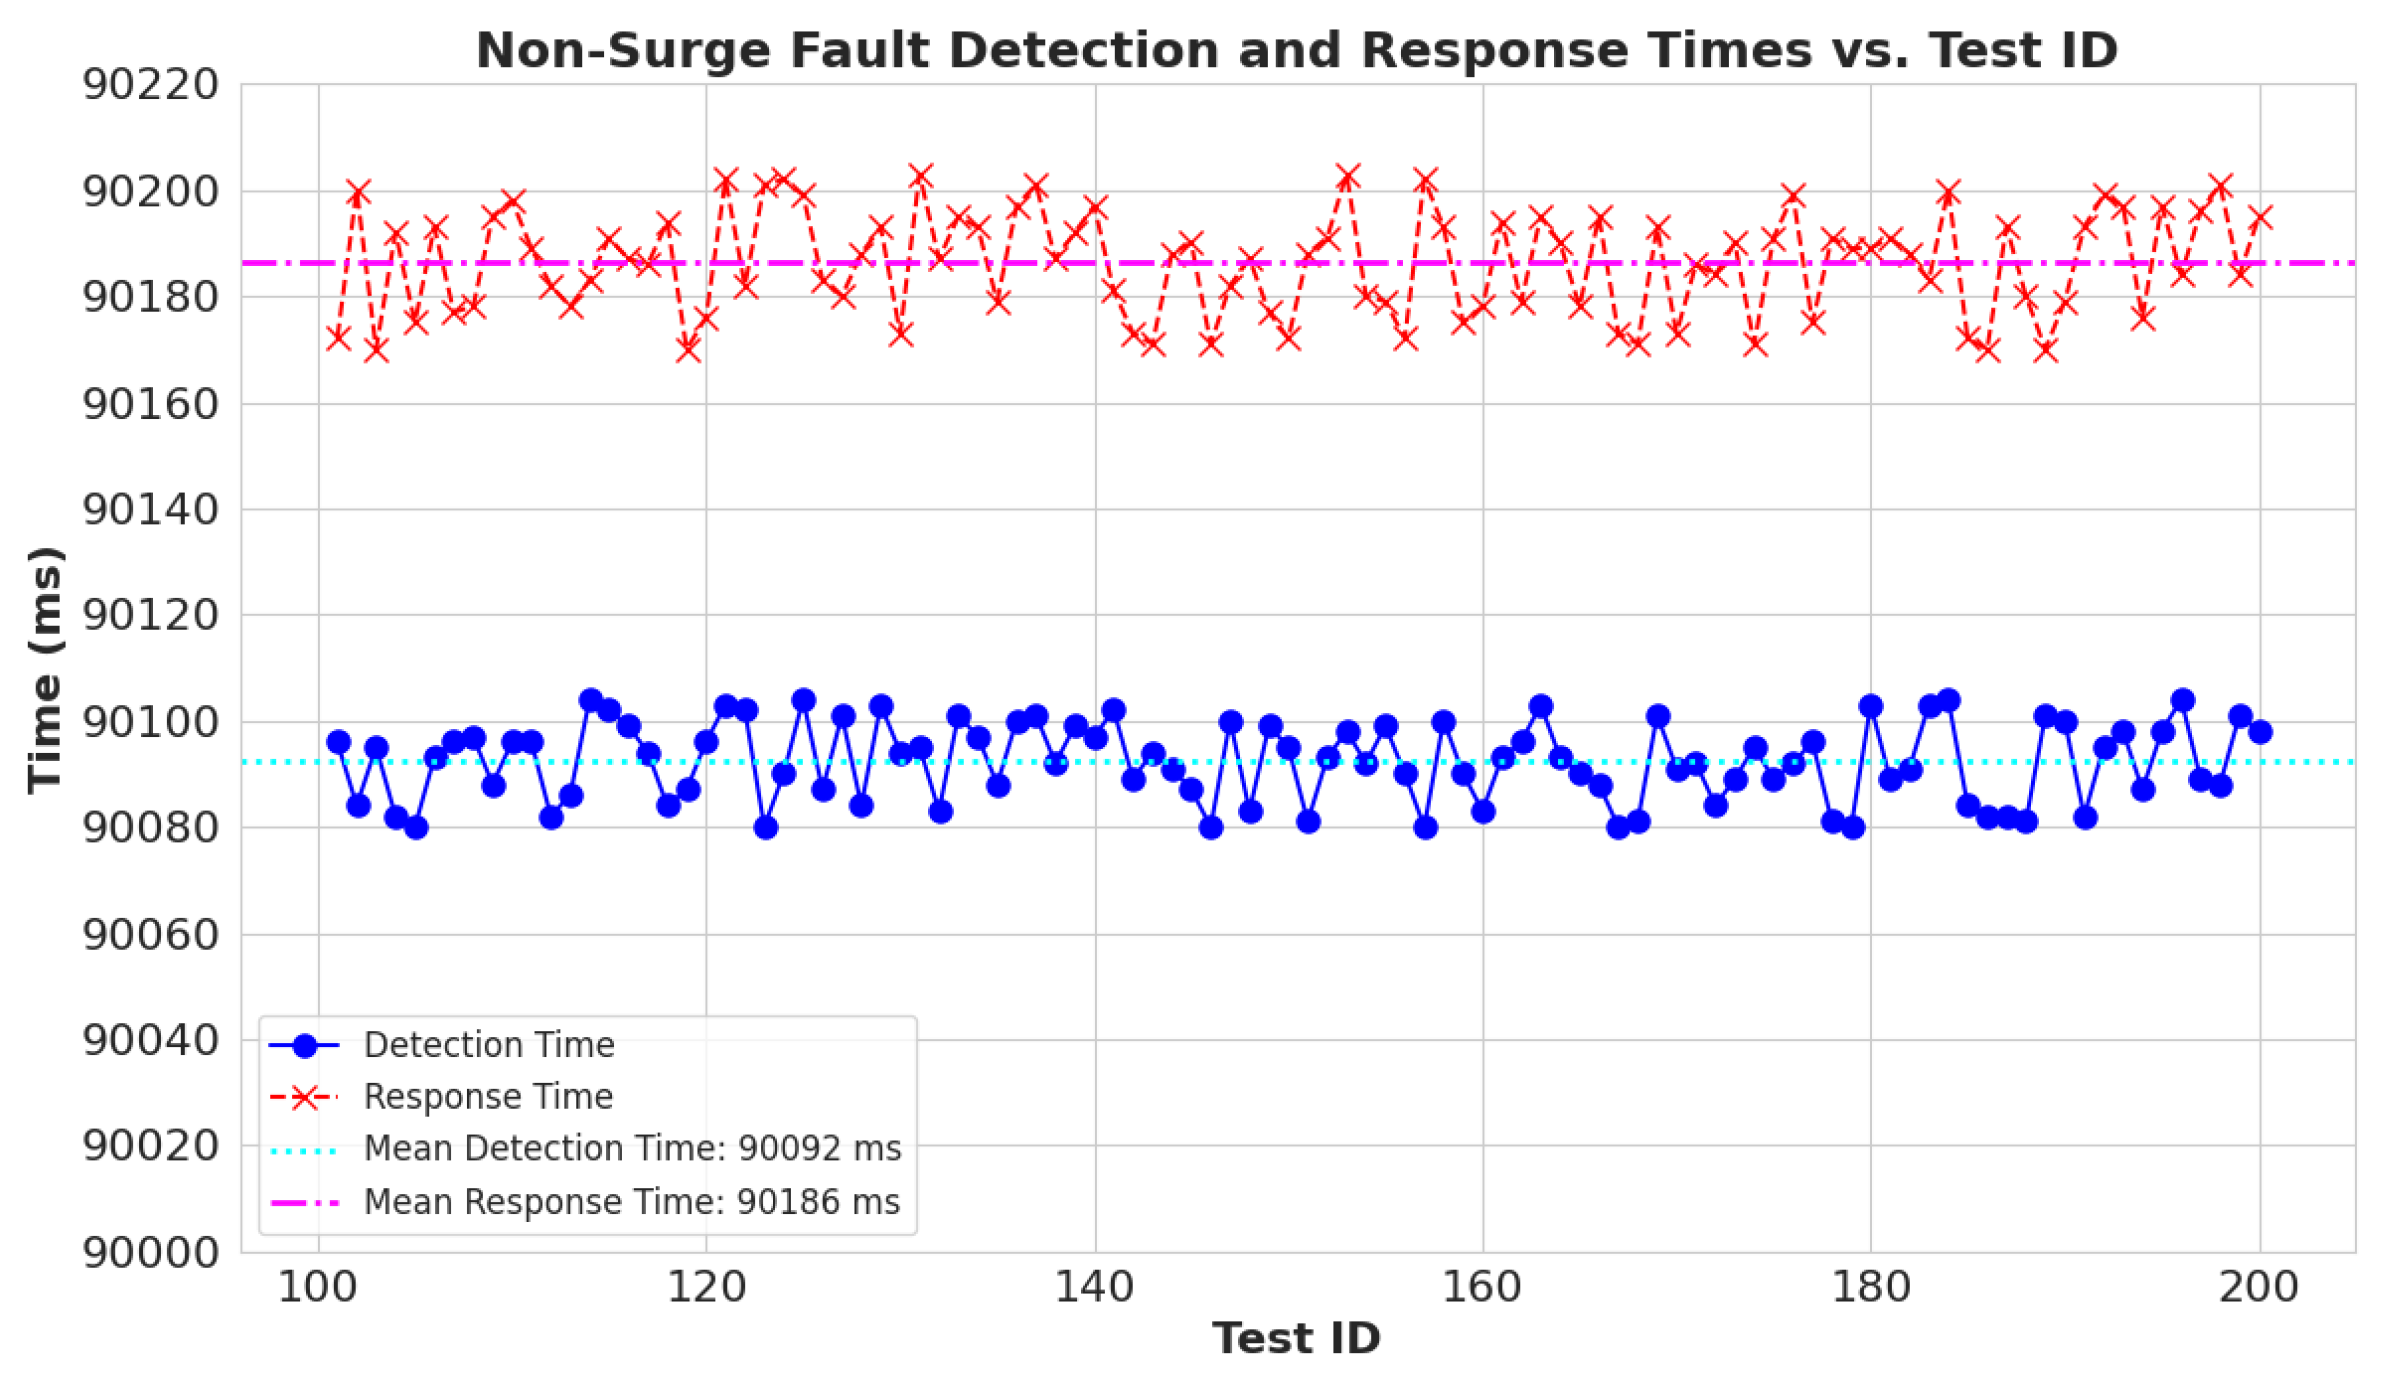
To check the robustness of the system, an experiment is designed to generate 100 non-surge faults, and their detection and response time are observed. As the system tries to restore power within three attempts, the detection and response time for non-surge faults is measured after 90 s.
Figure 16 is the plot of the non-surge sample vs. its detection and response time (triggering server response). The figure validates that the average detection time is 92 ms and the average response time is 186 ms.
4.3. Simulation vs. Experimental Results
Table 3 summarizes the results from both the simulated model and the scaled-down hardware model. It provides a comprehensive and comparative analysis of results. The key performance metrics and operational characteristics are presented in the table.
5. Conclusions and Future Work
This research work focuses on the development of an intelligent decentralized system with distributed processing capability for secondary power distribution nodes. The research aims to develop a novel strategy that can detect and resolve surge faults in a node and communicate non-surge faults to the server. It monitors the critical power parameters in real time and uploads the data to the server. This work focuses on developing a decentralized IoT-based system. It uses a simple yet effective method to profile the faults in terms of overload current (short-lived, persistent). The superiority of the proposed system model over traditional controlled distribution systems is demonstrated by both simulation and hardware results. We also verified its ability to continuously monitor and communicate power parameters at specified intervals, achieving fault detection in 90 ms (92 ms for non-surge faults) and a response in 186 ms. Results also verified the mitigation of the surges in 90 s and communicated the non-surge fault after 90 seconds.
The proposed scheme makes the system a reliable solution for microgrids, as dynamic data-driven AI models can be a great solution for decentralized energy production with renewable sources for a greater environmental impact, even in dynamic energy trends. Future work will deal with overcoming limitations, like the implementation of the system in a real-world setting, detailed fault profiling, addressing the stability of the system in the real-world environment, and handling various nodes’ communication simultaneously. Future research will also address sustainable maintenance protocols and component failure resilience.


 ,
, 
