Article

Co-Benefits of Carbon Pricing and Electricity Market Liberalization: A CGE Case Study

1
Jiaxing Hengchuang Electric Power Design & Institute Co., Ltd., Jiaxing 314100, China
2
School of Economics and Finance, Xi’an Jiaotong University, Xi’an 710049, China
3
School of Economics, Xi’an University of Finance and Economics, Xi’an 710003, China
*
Author to whom correspondence should be addressed.
Sustainability 2025, 17(13), 5992; https://doi.org/10.3390/su17135992
Submission received: 22 May 2025 / Revised: 24 June 2025 / Accepted: 27 June 2025 / Published: 30 June 2025
(This article belongs to the Section Economic and Business Aspects of Sustainability)

Abstract

This study explores how carbon pricing and electricity market liberalization jointly contribute to China’s sustainable energy transition. Using a dynamic computable general equilibrium (CGE) model (CEEEA2.0), we simulate three policy scenarios—business as usual, emissions trading scheme (ETS) with regulated electricity prices, and ETS with market-based pricing—under a unified emissions cap. The results demonstrate that electricity market liberalization enhances carbon pricing efficiency by eliminating price distortions, leading to a 0.06% increase in GDP and a 12% reduction in emission abatement costs. However, liberalization also raises electricity and consumer prices, disproportionately affecting rural and low-income households. These findings underscore the need to balance economic efficiency and social equity in sustainability-oriented energy reforms. Our analysis emphasizes the importance of designing inclusive and just transition policies to ensure that carbon mitigation efforts support long-term environmental, economic, and social sustainability goals.

1. Introduction

In recent years, China has made significant progress in building market-based instruments for environmental governance [1,2]. A key milestone is the launch of the national emissions trading scheme (ETS) in 2021, initially covering the power sector and set to gradually expand to other high-emission industries [3,4]. Parallel to this development, China is also pushing forward with electricity market reforms aimed at liberalizing power pricing, improving dispatch efficiency, and integrating more renewable energy [5,6,7]. While these two reform trajectories—carbon pricing and electricity market liberalization—are being advanced simultaneously, their interaction and combined effects on economic and environmental outcomes remain underexplored.
Understanding the interplay between ETS and electricity market reform is crucial, yet the current literature reveals several analytical gaps. First, many studies assess the impacts of carbon pricing in isolation, assuming static or exogenous electricity prices, thereby overlooking how power market structure influences carbon cost pass-through [8,9,10]. Second, models that do integrate both policies often lack macroeconomic closure or long-term dynamics, limiting their ability to capture intertemporal trade-offs and structural adjustments [11,12]. Third, few analyses evaluate how electricity price distortions under regulation may inflate mitigation costs or redistribute carbon burdens across sectors and households [13]. As a result, policymakers face uncertainty about whether these two policies—ETS and power market reform—are complementary, conflicting, or conditionally beneficial. Against this backdrop, this paper makes a timely contribution by quantitatively examining the co-benefits and trade-offs of carbon pricing and electricity market liberalization under a unified modeling framework.
The primary objective of this study is to assess the economic and welfare implications of integrating carbon pricing and electricity market reform under a unified policy framework. Against this backdrop, our study addresses a critical gap by analyzing the combined effects of carbon pricing and electricity market liberalization within a unified economic–environmental modeling framework. By examining how different market structures influence mitigation costs, carbon prices, and household welfare under a common emissions cap, this research provides valuable insights for policymakers aiming to design coordinated and cost-effective climate and energy policies in China and other emerging economies.
The remainder of the paper is structured as follows: Section 2 provides a literature review and the contribution of the paper. Section 3 introduces the model structure, data sources, and scenario design. Section 4 presents the simulation results, comparing macroeconomic outcomes, sectoral adjustments, and household welfare across scenarios. Section 5 concludes the paper and outlines directions for future research.

2. Literature Review

2.1. Review of ETS, Power Market Liberalization, and Interactions

A substantial body of research has examined the effectiveness of carbon pricing mechanisms—particularly ETS—as market-based instruments for mitigating greenhouse gas emissions. ETS allows governments to set a cap on total emissions while enabling firms to trade allowances, thereby achieving emission reduction targets at the lowest possible cost [14]. Empirical evidence from the European Union Emissions Trading Scheme (EU-ETS), the largest carbon market globally, has demonstrated that ETS can generate meaningful emissions reductions while maintaining economic competitiveness, especially when allowance allocation and market design are carefully structured [15,16]. In the context of developing economies, however, the effectiveness of ETS remains a subject of ongoing investigation, particularly regarding institutional capacity, sectoral coverage, and price volatility. In China, the establishment of a national ETS in 2021 marks a significant milestone in the country’s climate governance framework. Initially covering only the power sector, China’s ETS is expected to gradually expand to other energy-intensive industries, including cement, steel, and chemicals [17]. Early assessments of China’s pilot ETS programs suggest that while trading volumes were limited, the schemes helped raise awareness of carbon pricing and encouraged some abatement behavior [18]. Nevertheless, key design features—such as allowance allocation, coverage expansion, and market linkage—remain under development. Recent studies emphasize the importance of allocation rules (e.g., grandfathering vs. benchmarking) and the integration of ETS with broader energy policy reforms [19,20]. Despite progress, China’s ETS research remains fragmented, with limited analysis on how carbon markets interact with other structural factors such as electricity pricing, regulatory distortions, or institutional constraints.
Electricity market liberalization has been widely pursued in many countries as a means to improve resource allocation, enhance competition, and integrate renewable energy [21,22]. Liberalized power markets allow prices to reflect marginal generation costs, enabling more efficient dispatch and investment signals [23]. In liberalized systems such as the EU and the U.S., empirical evidence suggests that market-based pricing improves operational efficiency and facilitates the deployment of low-carbon energy sources [24,25,26]. In contrast, China’s electricity sector has long been characterized by administered pricing, cross-subsidies, and centralized dispatch, which have created substantial distortions in energy use and investment decisions [27,28]. Fixed retail prices and cost-plus pricing for thermal power have suppressed price signals, limiting incentives for efficiency improvements or renewable integration. Several studies have highlighted that electricity pricing reform—such as the shift toward marginal-cost pricing or spot markets—is essential for unlocking the full potential of carbon pricing instruments [29]. However, quantitative analysis of how electricity market structures affect the performance of carbon markets remains scarce, particularly in the context of developing economies like China.
Despite the growing attention to both carbon pricing and electricity market reform, the interaction between the two policies remains an underexplored but critical area. Electricity prices serve as the primary transmission channel through which carbon prices influence economic behavior. If electricity prices are regulated or subsidized, carbon costs may not be fully passed through to end-users, weakening price signals and reducing incentives for abatement [30]. This interaction is particularly important in countries like China, where the power sector is both a major emitter and subject to pricing controls.
Recent research suggests that electricity market liberalization can enhance the effectiveness of ETS by enabling carbon costs to influence power generation choices and downstream consumption [31]. Simulation-based studies show that power markets with competitive pricing structures tend to achieve emissions reductions at lower economic costs, due to more flexible dispatch and reduced reliance on high-carbon generation [29,32]. However, few studies explicitly model this interaction within a general equilibrium framework. As a result, the broader macroeconomic and distributional consequences of combining ETS with electricity market reform remain poorly understood.

2.2. Marginal Contributions on Research Design and Findings

Despite the growing literature on carbon pricing and electricity sector reform, few studies have quantitatively assessed their interactive effects within an integrated and dynamic macroeconomic framework. Most existing analyses either treat electricity prices as exogenous and fixed or focus on carbon pricing in isolation, thereby overlooking the crucial feedback mechanisms between power market structures, carbon cost pass-through, and economy-wide adjustment. Moreover, many studies that include electricity market reforms lack consistent emissions constraints, making it difficult to compare policy outcomes in terms of efficiency and equity.
This study contributes to the literature in four key ways. First, we implement a unified carbon reduction pathway across scenarios, allowing a clean and rigorous comparison of how different electricity pricing regimes affect economic outcomes under the same emissions cap. Second, we explicitly model regulated versus liberalized electricity pricing mechanisms within a recursive dynamic CGE framework, which better captures how carbon prices are transmitted to downstream sectors under different institutional designs. Third, the model incorporates detailed household heterogeneity, enabling a disaggregated analysis of distributional effects, particularly the regressive impacts on rural residents. Fourth, the study jointly assesses efficiency–equity trade-offs associated with policy combinations, providing novel empirical insights into how electricity market liberalization can enhance carbon pricing effectiveness while raising fairness concerns.
Together, these features move beyond prior applications of CEEEA-type models and contribute new empirical evidence on the co-benefits, trade-offs, and policy implications of integrating carbon pricing with electricity market reform in large emerging economies like China.

3. Methodology

3.1. CEEEA2.0 Model

This study employs the computable general equilibrium model CEEEA/CGE 2.0 [33], a newly developed dynamic CGE model implemented in GAMS using the MCP solver. The model is designed to assess the comprehensive economic and environmental impacts of energy and carbon policies in China. It consists of six interlinked modules: (1) the production block, (2) the income and expenditure block, (3) the trade block, (4) the energy–environment block, (5) the market-clearing and macroeconomic closure block, and (6) the macro-indicator block. Among these, the first five constitute the model’s core computational structure, while the sixth provides extensive outputs for analysis.
The production module is built upon a seven-layer nested production function that combines CES and Leontief technologies. Intermediate inputs are aggregated via Leontief technology, while all other inputs (labor, capital, and energy) are modeled using CES functions. The energy input is disaggregated into primary energy (coal, oil, natural gas, and renewables) and secondary energy (electricity and refined oil/gas), and substitution elasticities differ across energy processing and non-energy sectors to better reflect industrial rigidity in input structures. A key innovation lies in the distinction between general-purpose and sector-specific capital, modeled via CES aggregation. General capital can flow freely across sectors, while specific capital is fixed, enhancing the realism of factor mobility and industrial adjustment.
In this study, the electric power sector is modeled as a nested CES structure that reflects the current composition of China’s electricity generation. At the top level, electricity is produced from thermal power (mainly coal-fired) and a composite of renewable sources. The renewable composite further includes hydropower, wind, nuclear, and solar power as substitutable inputs. This structure captures the evolving mix of China’s electricity supply, where coal still dominates but renewable sources—especially hydropower and wind—are increasingly important due to decarbonization efforts.
The income and expenditure block captures financial flows among households, firms, governments, and the rest of the world. Households earn income from labor and capital, make tax payments, and allocate the remaining income between consumption and savings. Household consumption behavior follows a Linear Expenditure System (LES) derived from the Stone–Geary utility function, which allows the model to replicate long-run Engel effects—such as declining food shares and rising service consumption with income growth—that cannot be captured by standard CES or Cobb–Douglas specifications.
The trade block introduces the Armington assumption to differentiate between domestic and imported goods. CES functions model the substitution between domestic and imported products, while CET functions represent the allocation of production between domestic sales and exports. Import prices include tariffs, and domestic taxes are incorporated in export pricing. These details ensure that relative price changes under policy shocks are accurately captured in trade decisions.
The energy–environment block links economic activity with energy use and carbon emissions. It calculates direct and indirect CO2 emissions using energy input data and emission coefficients, accounting for electricity-related emissions by tracing the source mix of power generation. For energy-producing sectors, the model subtracts carbon embodied in secondary energy supplied to other sectors to avoid double counting. The model incorporates energy and environmental policy costs directly into production functions, thereby affecting both the cost structure and input choices of firms. Non-energy CO2 emissions (e.g., from cement production) are excluded due to data limitations and complexity in full life-cycle emission accounting.
Market clearing and macroeconomic closure are based on neoclassical assumptions of perfect competition, full employment of labor and capital, and flexible prices. This makes the model especially suitable for long-term simulations. The equilibrium condition is verified using the Walras dummy variables and consistency checks on GDP computed via both income and expenditure approaches.
The macro-indicator module calculates real GDP, CPI, PPI, total and sectoral energy consumption, renewable energy shares, and embodied carbon emissions. Embodied emissions are estimated by integrating input–output techniques within the CGE framework. The model follows the Leontief inverse approach to track carbon emissions embodied in production, consumption, and trade. It classifies emissions into four types: emissions from domestic production for domestic use, emissions from domestic production for export, emissions from foreign production for domestic use, and emissions from foreign production for foreign use. Based on these, it derives indicators such as embodied emissions in exports/imports and the net trade balance of carbon. The basic structure of the model is illustrated in Figure 1 (please note that the power structure is not presented in the paper).
Social welfare impacts are measured using Equivalent Variation (EV) and Compensated Variation (CV). Both approaches quantify the monetary change in household utility caused by policy shocks, with EV based on base-period prices and CV on current prices. The model’s household utility function is based on the Stone–Geary specification, making welfare indicators consistent with consumption behavior.
Finally, the model incorporates a recursive dynamic strategy. First, dynamic parameters such as total factor productivity (TFP), energy efficiency (AEEI), and electricity efficiency are calibrated using exogenously projected GDP, CO2 emissions, and electricity demand. These parameters are then used in forward simulations as exogenous inputs to generate endogenous trajectories of economic and environmental indicators. In addition to technological change, the model also incorporates demographic trends and capital stock accumulation (via the perpetual inventory method) as drivers of long-term growth. Overall, CEEEA/CGE 2.0 offers a comprehensive and flexible platform for simulating the economic and environmental impacts of policy reforms, particularly in analyzing the co-benefits of carbon pricing and electricity market liberalization over the 2018–2040 horizon.

3.2. Data

The data used in this study are primarily derived from China’s Input–Output (I-O) Table published by the National Bureau of Statistics (NBS, https://data.stats.gov.cn/ifnormal.htm?u=/files/html/quickSearch/trcc/trcc09.html&h=740 (accessed on 10 March 2025)), which includes detailed information on intermediate inputs among all sectors, capital and labor inputs, and production taxes, as well as investment, consumption, imports, and exports of various products. Data related to the interaction between the government and households—such as tax revenues from residents and household savings—are sourced from the China Statistical Yearbook (https://www.stats.gov.cn/sj/ndsj/2019/indexeh.htm) (accessed on 10 March 2025). Industry-level energy input data are obtained from the China Energy Statistical Yearbook 2019 (http://202.106.125.35/csydkns/navi/HomePage.aspx?id=N2018070147&name=YCXME&floor=1, special permission required) (accessed on 10 March 2025), while sectoral and household carbon emissions are calculated based on energy consumption using emission factors provided by the IPCC guidelines.
It is important to note that this study only considers CO2 emissions from energy consumption. Emissions from biological respiration, land-use change, cement production, and other non-energy sources are excluded due to data limitations and the complexity of life-cycle accounting. Furthermore, based on the sector classification in the China I-O Table, we reclassify the sectors into the categories listed in Table 1. The corresponding abbreviations and full names of sectors are provided below. The data and code are available at https://github.com/Zhijie-Jia/CEEEA2.0-CGE (accessed on 10 March 2025).

3.3. Dynamics

To assess the long-term impacts of emissions trading and renewable energy policies on the economy, environment, and energy system, we transform the static CGE model into a dynamic recursive CGE framework. In the long run, neoclassical macroeconomic closure assumptions are more appropriate than Keynesian or Lewis-type closures, as all markets (factors and goods) are assumed to clear, with both prices and quantities endogenously determined.
Economic growth is constrained by resource endowments, primarily labor and capital. Therefore, in the dynamic setting, we incorporate assumptions on technological progress, autonomous energy efficiency improvement (AEEI), labor force growth, and capital accumulation. The calibration methods and reference values for these dynamic parameters follow previous approaches [33,35].
Long-term structural transformation in the model is captured through heterogeneous total factor productivity (TFP) growth rates across sectors. This assumption reflects the varying growth potentials of different industries, enabling the model to endogenously adjust sectoral output shares over time. As sectors with higher productivity gains expand, the industrial structure gradually shifts, which is crucial for simulating long-term policy impacts. Moreover, changes in relative prices and household incomes under policy shocks induce shifts in consumption patterns, further contributing to structural change. Although urbanization is not explicitly modeled, the expansion of urban-oriented sectors such as services and construction provides an indirect reflection of this trend.
It is worth noting that the dynamic parameters in the model, such as TFP and energy efficiency trends, are calibrated using historical data on China’s GDP, energy use, and carbon emissions. Therefore, the baseline scenario implicitly reflects the observed trajectories of key macroeconomic and environmental indicators, serving as an internal empirical validation of the model’s projections.

3.4. Scenario Settings

We consider three long-term policy scenarios to evaluate the macroeconomic and distributional effects of carbon pricing and electricity market reform in China:
Business as Usual (BaU): This scenario assumes the continuation of existing development trends without the implementation of carbon pricing instruments such as emissions trading or carbon taxes. However, heterogeneous sectoral technological progress and autonomous energy efficiency improvements are incorporated. Energy structure and electricity pricing remain under the current regulatory framework.
ETS-Regulated: Building upon the BaU baseline, this scenario introduces a national ETS. Before 2030, the ETS covers only the power sector, consistent with the current scope of China’s national carbon market. After 2030, the ETS expands to include all eight major energy-intensive industries—electricity, petrochemicals, chemicals, building materials, steel, non-ferrous metals, pulp and paper, and aviation—as outlined in China’s 2016 initial ETS roadmap by the National Development and Reform Commission (NDRC). A total of 18 high-emission subsectors (e.g., oil refining, ethylene, and calcium carbide) are included. Emission allowances are allocated based on sectoral carbon intensity benchmarks using the grandfathering method [36]. Electricity prices remain regulated under existing cost-based pricing rules.
ETS-Liberalization: This scenario builds on the ETS-Regulated framework but further assumes the liberalization of electricity markets, allowing electricity prices to be determined by market supply and demand. This price liberalization removes distortions in electricity pricing and allows the carbon cost to be fully passed through to electricity users. As a result, electricity prices reflect both generation cost structures and carbon prices. This scenario captures the interaction between carbon pricing and market-based electricity reforms, enabling a more realistic assessment of mitigation costs, price signals, and structural adjustment pressures.
All three scenarios follow a common emissions reduction pathway to isolate the effects of market design. In doing so, the analysis focuses not on the quantity of emissions reduced but on the efficiency, price impact, and welfare implications of achieving the same climate target under different policy and market structures. For example, by comparing real GDP performance across scenarios with equal emissions, we can determine which policy achieves the best economic outcome while maintaining the same mitigation effectiveness.

4. Results and Discussion

4.1. Results

4.1.1. Impact on GDP and CO2 Emissions

Figure 2a illustrates that GDP increases steadily across all three scenarios (BAU, ETS-Regulated, and ETS-Liberalization), though with notable differences. In both ETS scenarios, GDP levels are consistently lower than in the BAU scenario, and the gap gradually widens over time, though it remains within 1%. Compared to ETS-Regulated, the ETS-Liberalization scenario exhibits a slightly lower GDP in the short term, suggesting a modest initial negative impact from electricity market liberalization. This can be attributed to market adjustments, the reallocation of production factors, and the pass-through of carbon costs to the production sector. However, in the long run—specifically after 2032—GDP in the ETS-Liberalization scenario surpasses that in the ETS-Regulated case.
As shown in Figure 2b, carbon emissions are highest under the BAU scenario, with a pronounced upward trajectory that only peaks around 2036. Both ETS scenarios significantly reduce emissions, with sharper declines observed after 2025. This outcome stems from the model’s assumption that the ETS is designed to follow a predetermined emissions trajectory. In other words, the government is assumed to adjust the allocation of allowances to ensure emissions remain on target. As a result, carbon emissions in ETS-Regulated and ETS-Liberalization are held constant along the same trajectory. This alignment provides a unified benchmark for comparing other indicators, particularly under the assumption of equivalent emissions reductions.
Figure 2c shows that the average mitigation cost (measured in CNY per ton of CO2) increases over time in both ETS scenarios. However, costs in the ETS-Liberalization scenario are consistently lower than those in the ETS-Regulated case, with the gap widening after 2030. This finding suggests that electricity market liberalization helps reduce the unit cost of carbon abatement, thereby improving mitigation efficiency.
In summary, electricity market liberalization contributes to reducing the economic cost of emissions reduction in the long run. This outcome is driven by three key mechanisms: (1) Clearer market signals: Market-based electricity prices more accurately reflect carbon costs, incentivizing firms and investors to shift away from carbon-intensive technologies and toward cleaner energy and low-carbon industries. (2) More efficient resource allocation: Firms in a liberalized market make decisions based on true marginal costs and returns, reallocating capital and labor from high-carbon sectors to low- or zero-carbon sectors, thereby enhancing economy-wide mitigation efficiency. (3) Stronger innovation incentives: Competitive market conditions stimulate continuous technological innovation, leading to improvements in energy efficiency and emissions reduction technologies, which further lower the average cost of mitigation.

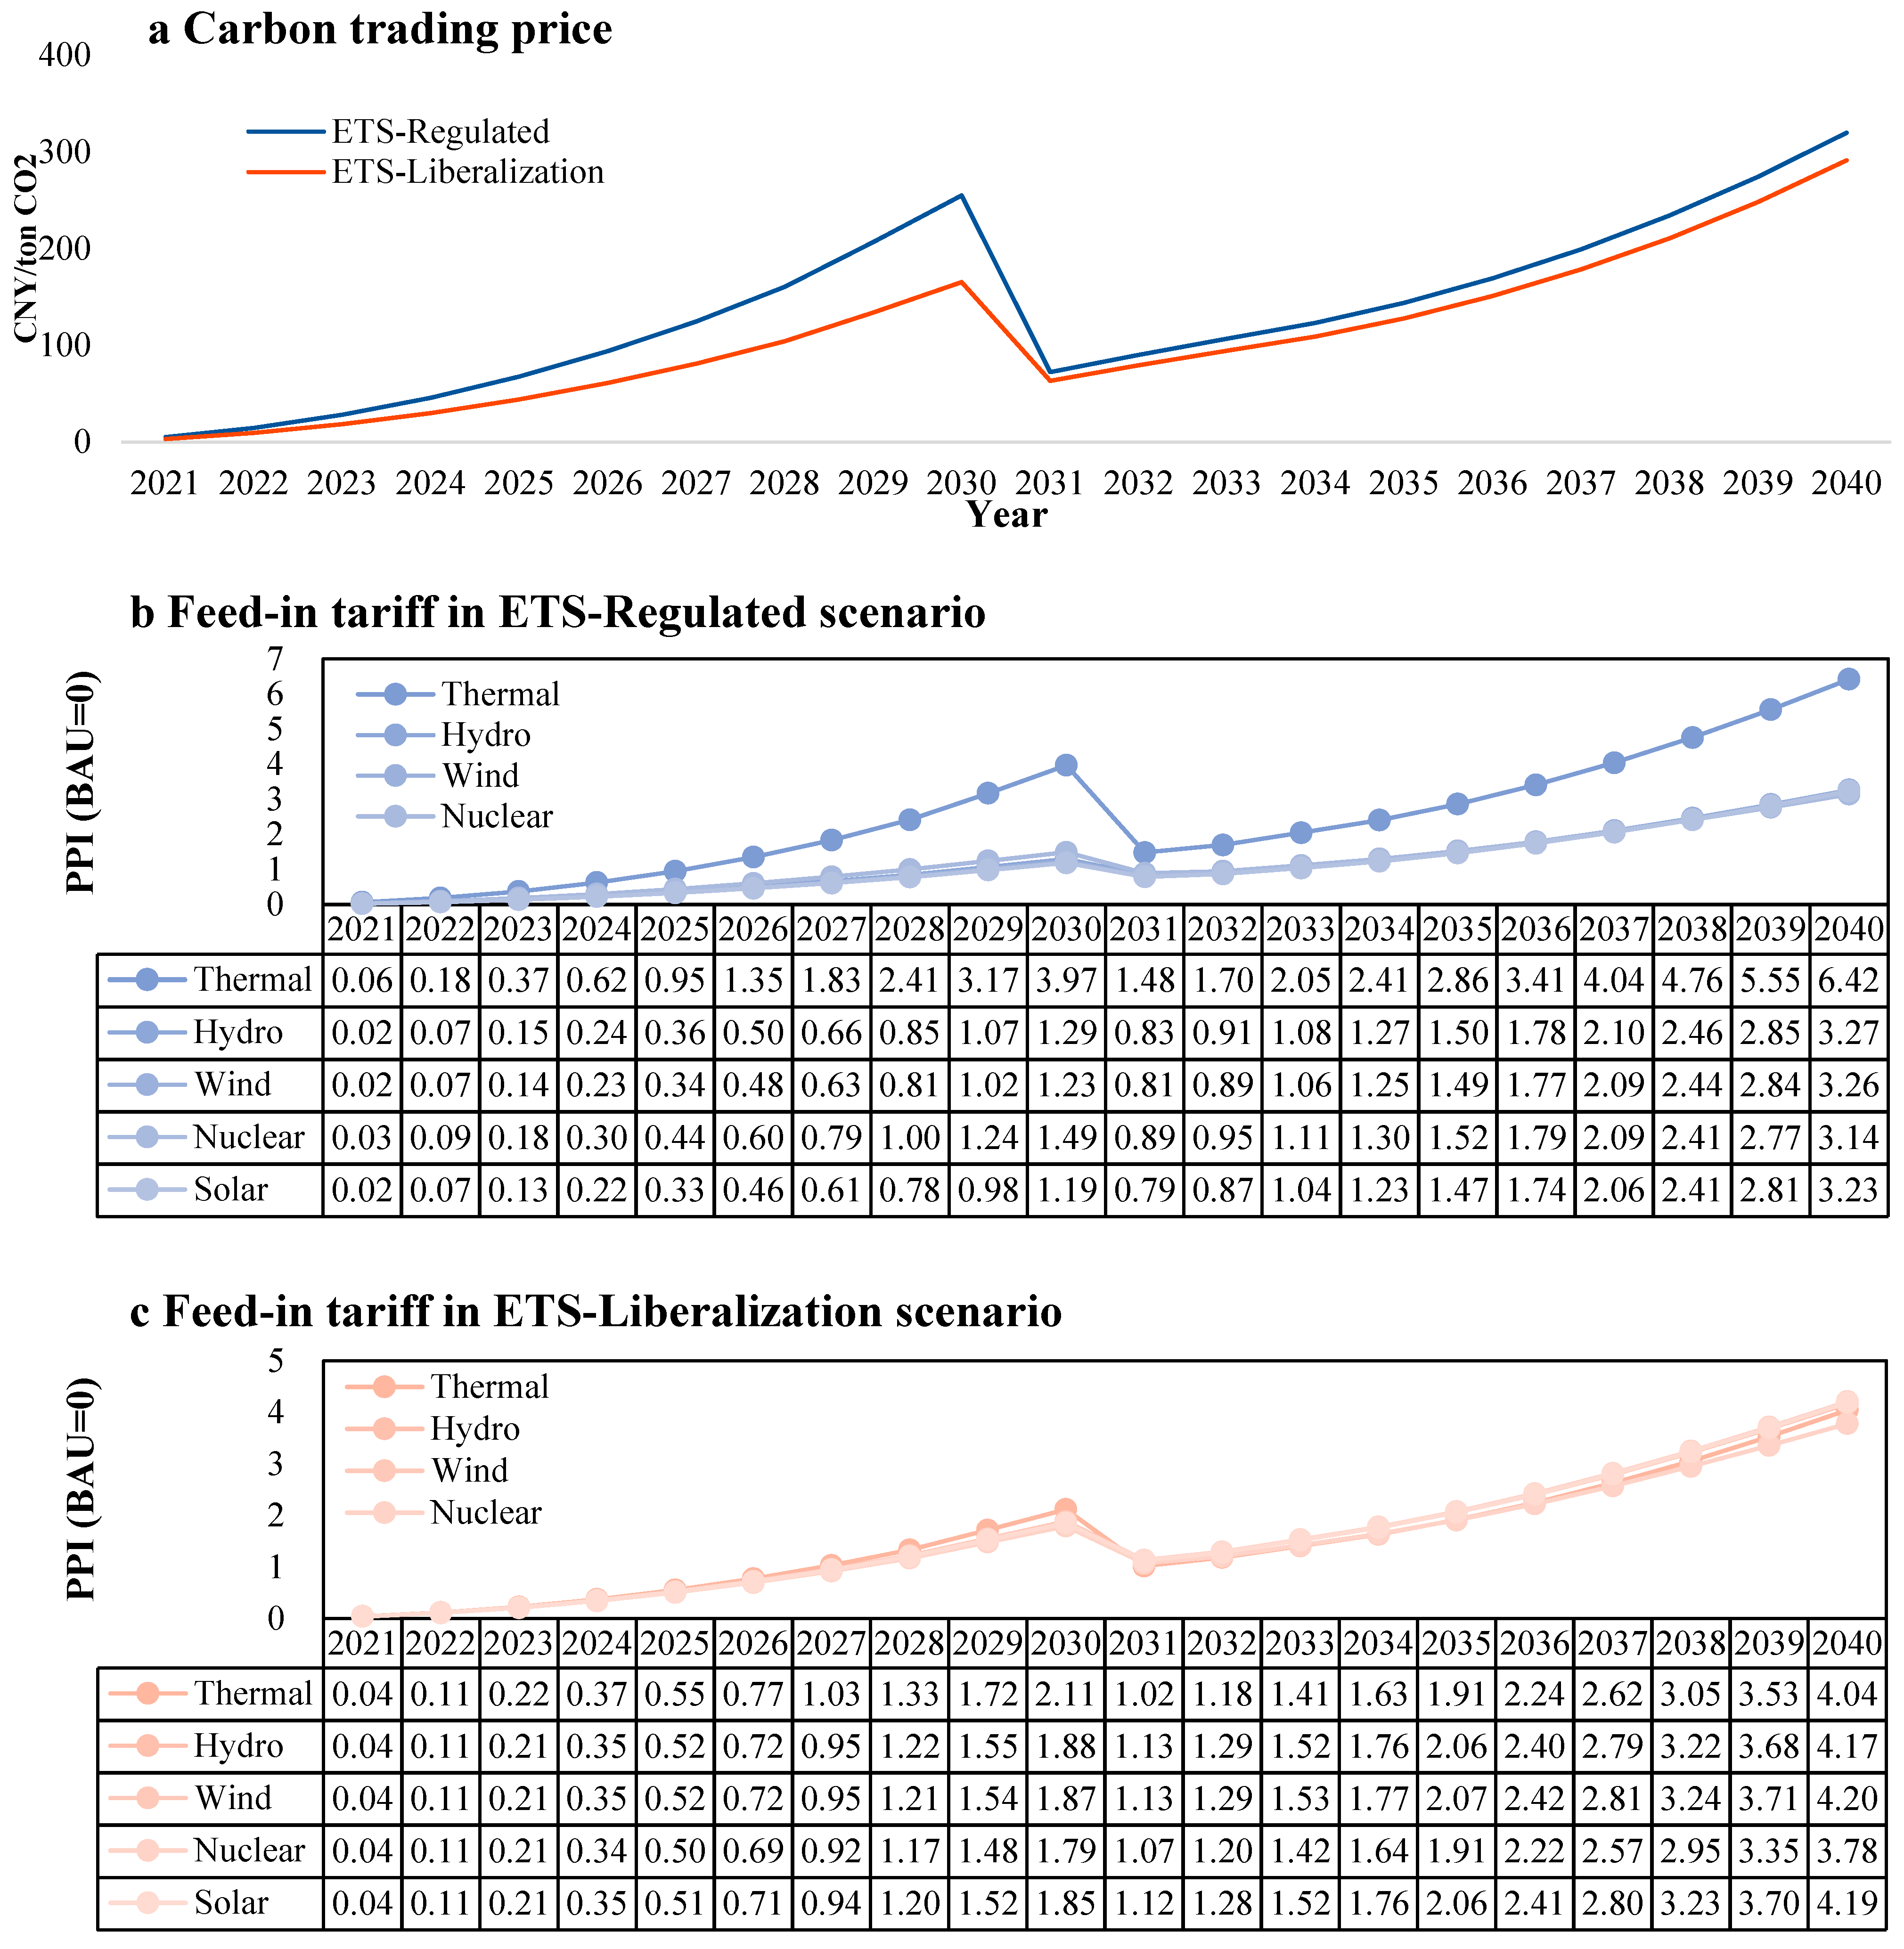
4.1.2. Impact on Carbon Trading Price and Feed-In Tariffs

As shown in Figure 3a, carbon prices (CNY per ton of CO2) exhibit a steadily increasing trend under both ETS scenarios, with a noticeable jump around 2030. In the ETS-Regulated scenario, carbon prices are generally higher, especially before 2030, where a sharp rise is followed by a temporary dip and a subsequent renewed increase. In contrast, the ETS-Liberalization scenario shows a slower growth rate in carbon prices, which consistently remain lower than those in the regulated case, with the gap widening after 2030. The decline in carbon prices around 2030 is primarily due to the model assumption that all major energy-intensive sectors are incorporated into the ETS starting that year. These newly added sectors—such as cement and building materials—typically have lower marginal abatement costs than the power sector, thereby exerting downward pressure on the overall carbon price. However, as emissions constraints continue to tighten over time, carbon prices resume their upward trajectory. The results suggest that a liberalized electricity market, by allowing electricity prices to adjust flexibly to market supply and demand, enables power producers to choose more cost-effective and autonomous abatement strategies through internal dispatch and efficiency improvements. This reduces the reliance on high carbon prices to meet emissions targets and thus lowers the pressure on the carbon market.
Figure 3b,c further illustrate the evolution of feed-in tariffs (FiTs) across different power sources under the two scenarios. In the ETS-Regulated scenario, electricity prices for all generation types—including thermal, wind, hydro, nuclear, and solar—rise steadily, with particularly sharp increases for thermal, wind, and solar power after 2030. Thermal power exhibits the steepest price growth. In contrast, under the ETS-Liberalization scenario, the upward trend in electricity prices is more moderate. The price curves across all five power types become more aligned, and the gap between thermal and renewable electricity prices narrows considerably.
This divergence can be explained by the functioning of a liberalized power market: (1) Market-based pricing mechanisms allow generation units to face real cost structures and competition, with marginal-cost-based pricing leading to more efficient resource allocation and limited price escalation. (2) Reduced cross-subsidy pressure: Liberalization weakens the reliance on fixed subsidies for renewables, allowing renewable electricity prices to gradually converge with market values and smoothing out their price increases.
Overall, compared to the regulated market structure, the ETS-Liberalization scenario demonstrates greater flexibility and lower cost pressure in both carbon and electricity pricing. Liberalization helps moderate the rise in carbon prices, alleviating the mitigation burden on firms. It also curbs excessive electricity price increases, reflecting improved cost control and pricing efficiency. In the long run, a liberalized market design not only enhances the operational efficiency of the power system but also contributes to a more sustainable and cost-effective decarbonization pathway.

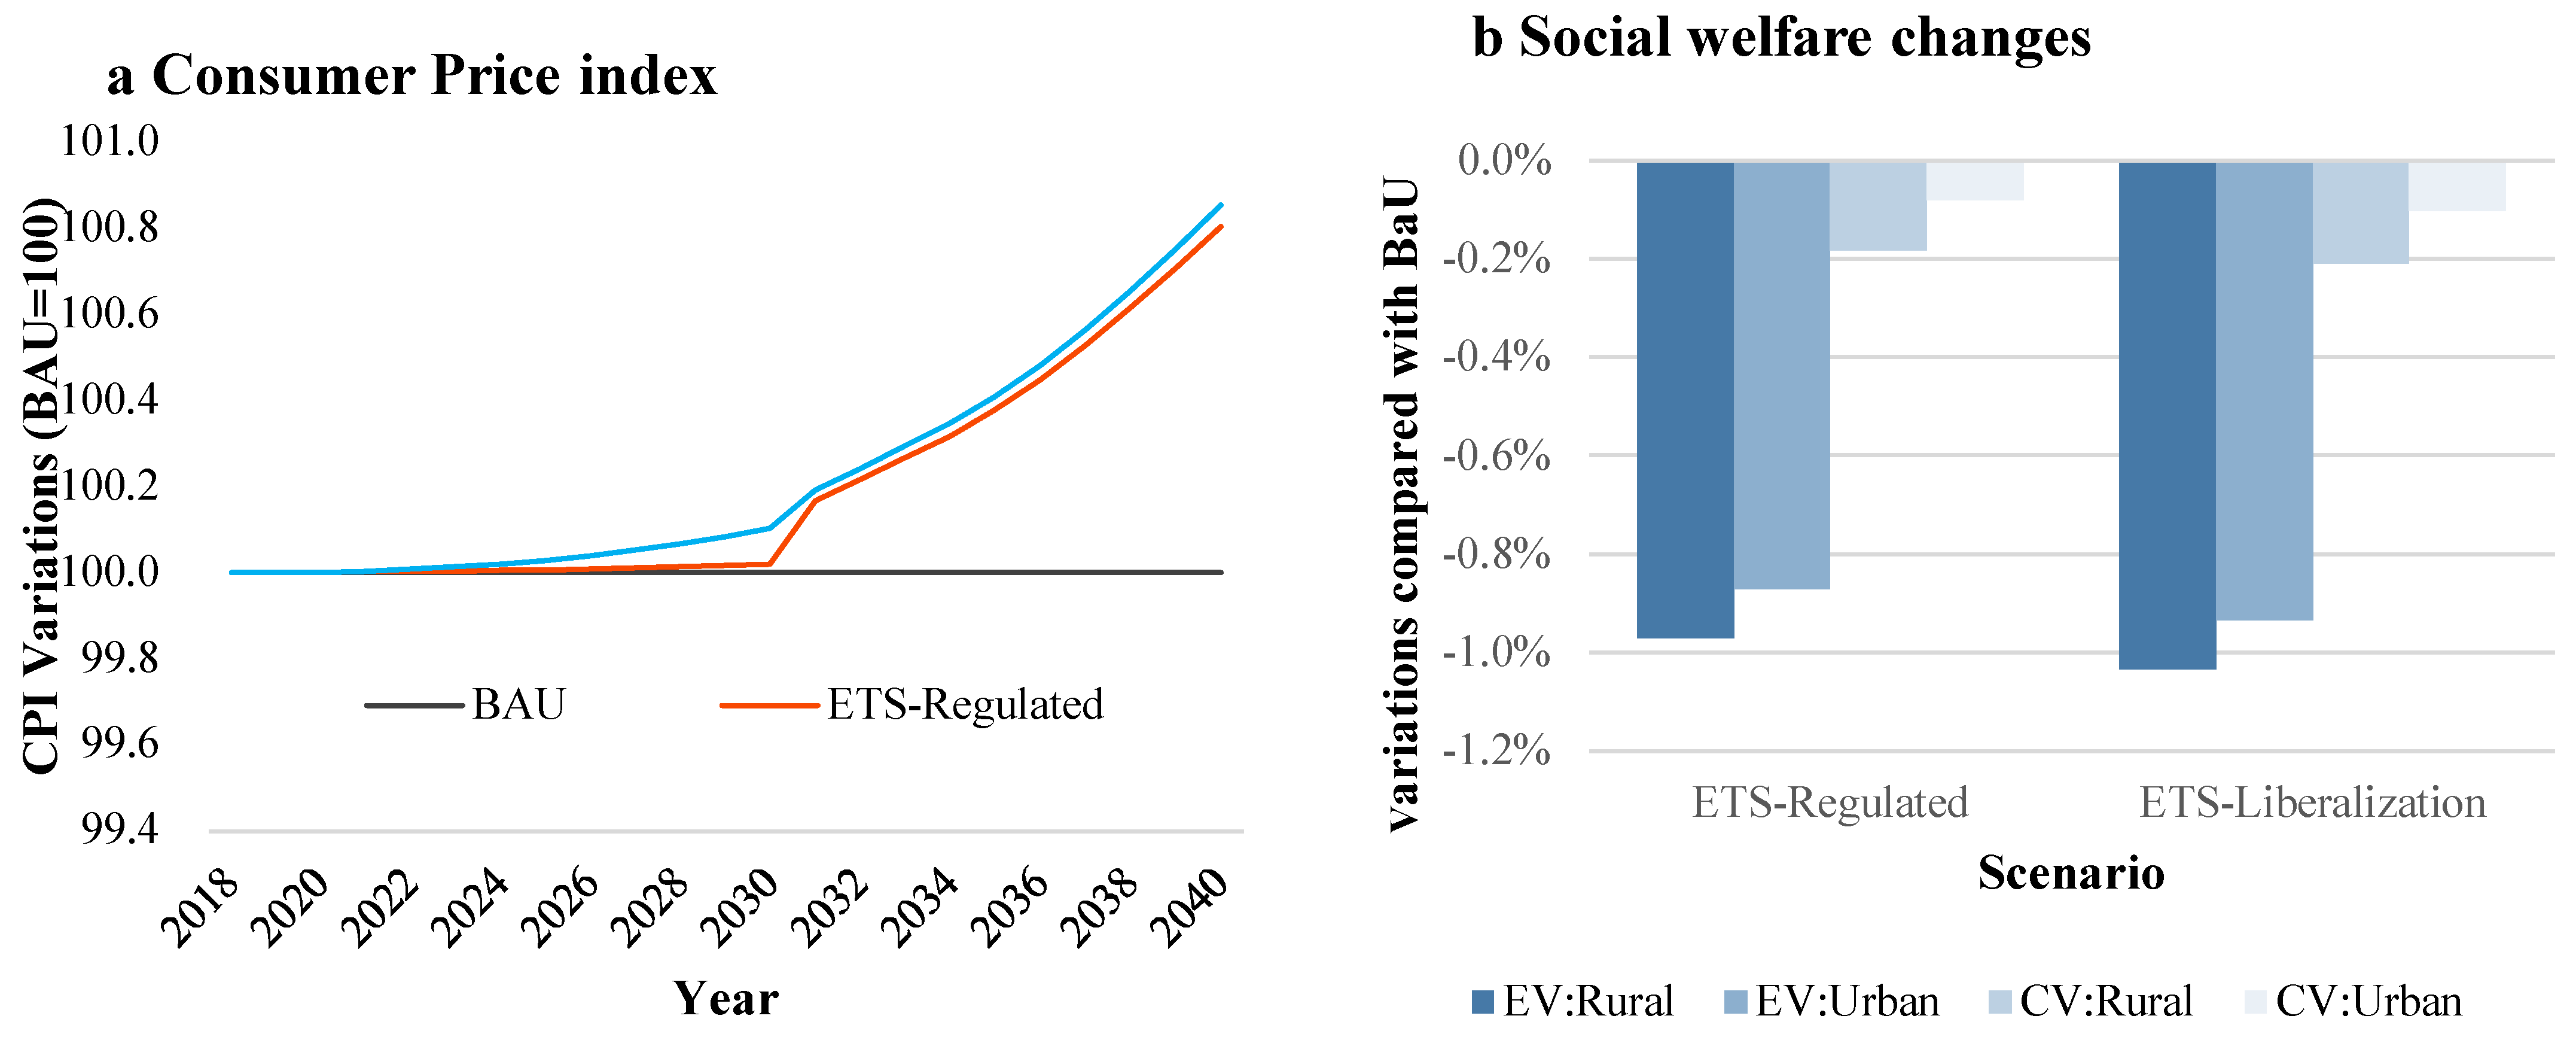
4.1.3. Impact on CPI and Social Welfare

As shown in Figure 4a, the Consumer Price Index (CPI) remains flat in the BaU scenario, serving as the reference level. In both ETS scenarios, the CPI increases over time; however, the ETS-Liberalization scenario results in a noticeably higher rise, particularly after 2030. By 2040, the CPI in the liberalization scenario exceeds that in the regulated scenario by approximately 0.05 percentage points. The underlying reason lies in the electricity pricing mechanism: in the ETS-Regulated case, government-imposed price ceilings suppress the cost of high-carbon, high-cost electricity (e.g., coal-fired power), thereby keeping overall electricity prices artificially low and buffering the transmission of carbon costs to consumers. In contrast, the ETS-Liberalization scenario allows electricity prices to reflect actual production costs. As a result, high-carbon electricity becomes more expensive, and consumers shoulder a larger portion of energy-related costs, which in turn pushes up overall consumer prices.
Figure 4b presents the comparative welfare impacts across urban and rural households, measured by Equivalent Variation (EV) and Compensating Variation (CV) relative to the BAU baseline. While welfare declines in all ETS scenarios, the losses are consistently larger under ETS-Liberalization. Rural residents are especially affected, with EV-based welfare losses approaching −1.2%. Urban households experience milder losses, though they also suffer more under market liberalization. This difference stems from the price transmission mechanism: in a liberalized market, carbon costs are more directly passed through electricity prices to end-users. Rural households, with lower incomes and higher energy expenditure shares, are more vulnerable to these price increases and thus face greater welfare deterioration.
Importantly, both EV and CV indicators confirm the robustness of this result. Given their theoretical properties—EV tends to overestimate welfare loss, while CV underestimates it—it is reasonable to infer that the actual welfare impact by 2040 likely falls between −0.1% and −1.1%. The total results are also in line with those of Jia et al. (2022) [37].

4.1.4. Impact on Commodity Market

The ETS significantly affects a wide range of industries, especially those in the energy and energy-intensive sectors (Figure 5). The overall impact propagates through upstream and downstream links in the industrial value chain, exhibiting chain-like fluctuations across sectors [38]. Sectors experiencing notable declines in consumption include the following: (1) Coal-related industries: Coal mining (COL) consumption falls by approximately 30% to 40%, reflecting the sharp contraction in coal demand during the energy transition, and coal processing (COLP) drops by about 20% to 30%, primarily driven by declining upstream coal supply. (2) Steel and building materials: Steel (STL) demand decreases by around 20%, likely due to weakening construction demand and the substitution of green materials. Building materials (BMTLs) are down by about 3%, possibly reflecting a slowdown in real estate and infrastructure investment. Sectors showing stable or increasing consumption include the following: (1) Other mining (OMIN) consumption is stable, possibly due to increased demand for strategic minerals such as lithium and cobalt. (2) Light industry (LGT) demand remains stable, possibly due to the relatively low sensitivity of household consumption to changes in the prices of light industrial goods. These patterns primarily result from the ETS-induced suppression of high-carbon sectors, combined with the substitution of fossil fuels by renewables such as wind, solar, and nuclear power.
In terms of prices, several energy-related sectors experience declines: (1) Coal mining (COL) prices fall by 4% to 5%, driven by both falling demand and persistent overcapacity. (2) Coal processing (COLP) experiences a sharper decline (8% to 10%), mainly due to lower energy demand caused by ETS. Conversely, most energy-intensive industries experience price increases, such as steel (STL) price increases of about 5%, reflecting the upward pressure from carbon costs; refined oil (REFO) shows relatively small price fluctuations (within 1%), possibly due to the buffering effect of global crude oil prices, as China heavily relies on oil imports.
Under the ETS-Liberalization scenario, the impacts on consumption and prices differ significantly from those under the ETS-Regulated case. Using ETS-Regulated as a baseline, electricity market liberalization generally boosts industrial output. The key mechanism is that liberalization removes pricing distortions—higher electricity prices suppress power demand, which lowers the carbon price. A lower carbon price, in turn, reduces compliance costs for energy-intensive industries, thereby raising their output and reducing their prices.
However, the dynamics are different for renewable energy sectors. Both output and prices increase. This results from the model’s assumption that under regulation, thermal power prices are fixed at relatively low levels, encouraging higher consumption. Once liberalized, coal-fired power loses its price advantage, leading to a substitution effect where renewables gain market share, resulting in simultaneous increases in both generation and electricity prices for renewables.

4.1.5. Sensitivity Analysis

To address the uncertainty associated with key structural parameters in the model, we conducted a sensitivity analysis focusing on the Constant Elasticity of Substitution (CES) between capital, labor, and energy in production. The CES elasticity determines the degree of substitutability among production inputs, thereby affecting the responsiveness of firms to relative price changes such as those induced by carbon pricing or electricity market liberalization.
We vary the sectoral CES elasticity parameters symmetrically by ±20% around the baseline values used in the core simulation, which are drawn from widely used CGE and IAM literature (e.g., GTAP and EPPA models). Specifically, for energy-intensive sectors such as electricity, steel, and chemicals, the baseline CES elasticity is 0.5. We test lower (0.4) and higher (0.6) elasticity values to simulate less and more flexible input substitution behavior, respectively.
Each scenario—BaU, ETS-Regulated, and ETS-Liberalization—is recalculated under these alternative CES settings while keeping all other parameters unchanged. This design allows us to isolate the impact of substitution elasticity on key model outcomes.
Figure 6 summarizes the sensitivity ranges for real GDP during 2030–2040 under different CES elasticity assumptions. Under both ETS scenarios, higher CES elasticity (i.e., easier substitution) leads to slightly higher GDP outcomes, as firms can more efficiently adapt to carbon pricing by switching away from expensive inputs. However, the GDP gap between ETS-Regulated and ETS-Liberalization remains robust. And liberalization cases seem to be less sensitive to elasticity.
Average mitigation costs rise under lower CES elasticity (i.e., rigid production structures), but the cost advantage of ETS-Liberalization persists across all settings. This confirms that electricity market liberalization improves cost-efficiency even when production flexibility is limited. The 2040 carbon price is not sensitive to CES assumptions but follows the same pattern: prices are consistently lower under the ETS-Liberalization scenario, reflecting more flexible abatement strategies and reduced pressure on the carbon market. Due to space limitations, this article will no longer present a sensitivity analysis of carbon emissions, emission reduction costs, and carbon prices in the form of charts.

4.2. Discussions

This subsection provides an integrated interpretation of the model results, highlighting the underlying mechanisms through which electricity market reform interacts with carbon pricing to shape macroeconomic and distributional outcomes. While the previous sections have presented numerical results across different scenarios, here we aim to draw broader insights from the simulated patterns.
Under a unified emissions cap, the ETS-Liberalization scenario demonstrates lower carbon prices and welfare losses compared to the ETS-Regulated scenario. This difference arises primarily from improved price signals and more efficient dispatch in a liberalized electricity market, which enhances the substitution of renewables for thermal generation. In effect, market-based pricing enables the carbon constraint to be met at a lower economic cost by aligning marginal abatement across sectors.
Moreover, the results suggest that electricity market reform can reduce the carbon cost pass-through to downstream industries and households, thereby mitigating the regressive effects of carbon pricing. In regulated markets, price distortions tend to shield electricity users from true carbon costs, which results in inefficient allocation and higher abatement burdens on other sectors.
These findings underscore the importance of aligning power sector reform with climate policy design. Policymakers should consider the sequencing and coordination of electricity liberalization and emissions trading to minimize efficiency losses and unintended distributional consequences. The model results provide empirical grounding for such policy integration, especially in large emerging economies undergoing structural reform.

5. Conclusions and Policy Implications

5.1. Conclusions

This study employs the China Energy–Environment–Economy Analysis Model 2.0, a dynamic recursive computable general equilibrium model integrating energy and environmental modules, to assess the macroeconomic and welfare impacts of carbon pricing policies under alternative electricity market structures. By simulating long-term scenarios with and without electricity market liberalization, we systematically evaluate the co-benefits and trade-offs of combining carbon emissions trading with electricity price reforms.
The analysis is grounded in detailed national datasets, including the Chinese input–output tables, energy balance sheets, and statistical yearbooks, which collectively capture the complex interdependencies between industries, households, government, and external trade. Carbon emissions are estimated based on sectoral fossil energy consumption following IPCC guidelines, focusing solely on energy-related CO2 emissions. A set of 21 reclassified sectors, including major fossil-based and renewable energy producers, allows for a nuanced interpretation of structural shifts under decarbonization pressures.
Our results show that introducing an ETS, especially when combined with electricity market liberalization, can lead to substantial efficiency gains. When electricity prices are regulated, carbon costs are partially absorbed by state-owned grid operators, which dampens the price signal to consumers and distorts energy use decisions. This leads to higher electricity consumption, greater demand for emissions permits, and elevated carbon prices in order to meet fixed reduction targets. The result is a steeper rise in consumer prices, a higher overall mitigation cost, and downward pressure on GDP.
Conversely, under a liberalized electricity market, carbon pricing operates more effectively. The cost of carbon is reflected in power prices, which encourages downstream sectors to improve energy efficiency and shift to low-carbon production. This reduces permit demand, lowers average abatement costs, and improves overall economic efficiency. Our simulations reveal that GDP under the ETS-Liberalization scenario is consistently higher than that under the ETS-Regulated scenario, while achieving the same emissions reduction pathway.
However, the study also highlights important distributional concerns. Market liberalization results in higher electricity prices, which are passed directly to consumers. Consequently, the CPI rises more sharply under the liberalized regime. Furthermore, social welfare indicators show that rural and low-income households bear a disproportionately larger welfare loss under ETS-Liberalization compared to ETS-Regulated. This suggests that while the co-benefits of carbon pricing and market reforms are evident at the macro level, they may be regressive at the micro level.

5.2. Policy Implications

Electricity Market Reform as a Complement to Carbon Pricing. The findings confirm that electricity market liberalization can enhance the effectiveness of carbon pricing by eliminating price distortions and enabling more accurate emission cost internalization. Policymakers should view market reform not as a competing priority but as a complementary instrument to carbon markets.
Designing Equitable Transition Strategies. The regressive impact of rising electricity prices on household welfare—especially in rural areas—requires the implementation of well-targeted compensation policies. Options include using carbon revenues to fund direct transfers, electricity rebates, or subsidies for energy-efficient appliances in vulnerable communities.
Phased and Adaptive Implementation. A gradual approach to market liberalization, paired with continuous monitoring of price and welfare impacts, can help mitigate transitional shocks. Policymakers should also consider dynamic policy adjustment mechanisms that respond to real-time inflation or inequality indicators.
Integrated Carbon and Energy Policy Planning. The success of China’s long-term decarbonization goals hinges on integrated policy design. Carbon pricing, electricity reform, and complementary social protection measures must be planned jointly rather than in silos.

5.3. Limitations

This study adopts a computable general equilibrium framework based on the assumptions of perfect competition and full compliance with ETS policies. While this allows for consistent long-term projections, it does not capture short-term implementation challenges observed in China’s pilot ETS programs, such as permit overallocation, weak enforcement, or surplus carryover. These limitations may lead to optimistic estimates of policy effectiveness. Future research could incorporate institutional frictions and transition dynamics to provide a more nuanced assessment.
Furthermore, the current model is constructed at the national level and applies average parameters for energy structure, industrial composition, and household characteristics. However, in a country as geographically and economically diverse as China, regional disparities—such as differences in resource endowments, carbon intensity, and income levels—can significantly influence policy outcomes. The current model is constructed at the national level and applies average parameters for energy structure, industrial composition, and household characteristics. However, in a country as geographically and economically diverse as China, regional disparities—such as differences in resource endowments, carbon intensity, and income levels—can significantly influence policy outcomes.

Author Contributions

Conceptualization, S.W. and S.H.; methodology, S.H.; software, N.Y. and Y.C.; formal analysis, Q.X.; investigation, D.Z. and X.Y.; writing—original draft preparation, X.Y. and Q.X.; writing—review and editing, S.W. and S.H.; visualization, Y.C. All authors have read and agreed to the published version of the manuscript.

Funding

This research was funded by the provincial management industrial unit of State Grid Zhejiang Electric Power Co., Ltd. (project title: Research on Optimization and key technologies of Carbon Asset Management in power grid industry units for low-carbon policy; project number: CF058305002024003).

Institutional Review Board Statement

Not applicable.

Informed Consent Statement

Not applicable.

Data Availability Statement

Data will be available upon request.

Acknowledgments

During the preparation of this work, the authors used ChatGPT 4.0 in order to improve language and readability, with caution. After using this service, the authors reviewed and edited the content as needed and take full responsibility for the content of the publication.

Conflicts of Interest

Authors Ning Yan, Shenhai Huang, Yan Chen and Daini Zhang were employed by the company Jiaxing Hengchuang Electric Power Design & Institute Co., Ltd. The remaining authors declare that the research was conducted in the absence of any commercial or financial relationships that could be construed as a potential conflict of interest.

References

  1. Huang, J.; Xu, X.; Zhao, T. The Moderating Effect of Clean Technology Innovation in the Process of Environmental Regulation Affecting Employment: Panel Data Analysis Based on 22 Industrial Sectors in China. J. Clean. Prod. 2023, 414, 137672. [Google Scholar] [CrossRef]
  2. Chen, S.; Liang, E.; Liu, C. “Size-Dependent” Environmental Regulations and Spatial Labor Allocation. J. Environ. Econ. Manag. 2025, 132, 103158. [Google Scholar] [CrossRef]
  3. Yu, X.; Wu, Z.; Wang, Q.; Sang, X.; Zhou, D. Exploring the Investment Strategy of Power Enterprises under the Nationwide Carbon Emissions Trading Mechanism: A Scenario-Based System Dynamics Approach. Energy Policy 2020, 140. [Google Scholar] [CrossRef]
  4. Song, Y.; Liang, D.; Liu, T.; Song, X. How China’s Current Carbon Trading Policy Affects Carbon Price? An Investigation of the Shanghai Emission Trading Scheme Pilot. J. Clean. Prod. 2018, 181, 374–384. [Google Scholar] [CrossRef]
  5. Zhang, W.; Chen, C.; Li, M. Impacts of Electricity Market Reforms: From the Perspective of Economic-Energy-Environment System Synergies. J. Clean. Prod. 2025, 509, 145603. [Google Scholar] [CrossRef]
  6. Cheng, Y.; Chung, M.; Tsang, K. Electricity Market Reforms for Energy Transition: Lessons from China. Energies 2023, 16, 905. [Google Scholar] [CrossRef]
  7. Jia, Z.; Lin, B.; Wen, S. Electricity Market Reform: The Perspective of Price Regulation and Carbon Neutrality. Appl. Energy 2022, 328, 120164. [Google Scholar] [CrossRef]
  8. Stepanyan, D.; Heidecke, C.; Osterburg, B.; Gocht, A. Impacts of National vs. European Carbon Pricing on Agriculture. Environ. Res. Lett. 2023, 18, 074016. [Google Scholar] [CrossRef]
  9. Meng, S.; Siriwardana, M.; Shen, Y. The Impact of a National Carbon Price on China. J. Asia Pac. Econ. 2021, 26, 601–618. [Google Scholar] [CrossRef]
  10. Koo, B. Examining the Impacts of Feed-in-Tariff and the Clean Development Mechanism on Korea’s Renewable Energy Projects through Comparative Investment Analysis. Energy Policy 2017, 104, 144–154. [Google Scholar] [CrossRef]
  11. Liu, X.; Jin, Z. An Analysis of the Interactions between Electricity, Fossil Fuel and Carbon Market Prices in Guangdong, China. Energy Sustain. Dev. 2020, 55, 82–94. [Google Scholar] [CrossRef]
  12. Qi, L.; Lin, X.; Shi, X.; Zhang, Y.; Pan, H.; Sharp, B. Feed-in Tariffs and the Carbon Emission Trading Scheme under China’s Peak Emission Target: A Dynamic CGE Analysis for the Development of Renewable Electricity. J. Environ. Manag. 2023, 335, 117535. [Google Scholar] [CrossRef] [PubMed]
  13. Yao, Y.F.; Liang, Q.-M.; Yang, D.-W.; Liao, H.; Wei, Y.-M. How China’s Current Energy Pricing Mechanisms Will Impact Its Marginal Carbon Abatement Costs? Mitig. Adapt. Strateg. Glob. Change 2016, 21, 799–821. [Google Scholar] [CrossRef]
  14. Goulder, L.H.; Scheins, A.R. Carbon Taxes Versus Cap and Trade: A Critical Review. Clim. Change Econ. 2013, 4, 1350010. [Google Scholar] [CrossRef]
  15. Martin, R.; Muûls, M.; de Preux, L.B.; Wagner, U.J. Industry Compensation under Relocation Risk: A Firm-Level Analysis of the EU Emissions Trading Scheme. Am. Econ. Rev. 2014, 104, 2482–2508. [Google Scholar] [CrossRef]
  16. Günther, C.; Pahle, M.; Govorukha, K.; Osorio, S.; Fotiou, T. Carbon Prices on the Rise? Shedding Light on the Emerging Second EU Emissions Trading System (EU ETS 2). Clim. Policy 2025, 1–12. [Google Scholar] [CrossRef]
  17. Song, X.; Pan, C.; Yuan, H.; Wang, Z. Does Emission Trading System (ETS) Deserve Further Promotion in the Building Sector? Evidence from China. Renew. Energy 2024, 237, 121713. [Google Scholar] [CrossRef]
  18. Hughes, L.; Meckling, J. The Politics of Renewable Energy Trade: The US-China Solar Dispute. Energy Policy 2017, 105, 256–262. [Google Scholar] [CrossRef]
  19. Huang, S.; Du, C.; Jin, X.; Zhang, D.; Wen, S.; Wang, Y.; Cheng, Z.; Jia, Z. The Boundary of Porter Hypothesis: The Energy and Economic Impact of China’s Carbon Neutrality Target in 2060. Energies 2022, 15, 9162. [Google Scholar] [CrossRef]
  20. Lin, B.; Jia, Z. Can Carbon Tax Complement Emission Trading Scheme? The Impact of Carbon Tax on Economy, Energy and Environment in China. Clim. Change Econ. 2020, 11, 2041002. [Google Scholar] [CrossRef]
  21. Silva, P.F.; Ferreira da Costa, V.B.; Dias, B.H.; Soares, T.A.; Bonatto, B.D.; Balestrassi, P.P. Socioeconomic Impact of Brazilian Electricity Market Liberalization: Forecasting and Optimized Tariff Analysis. Energy 2024, 313, 133992. [Google Scholar] [CrossRef]
  22. Ali, H.; Phoumin, H.; Suryadi, B.; Farooque, A.A.; Yaqub, R. Assessing ASEAN’s Liberalized Electricity Markets: The Case of Singapore and the Philippines. Sustainability 2022, 14, 11307. [Google Scholar] [CrossRef]
  23. Newbery, D. Electricity Liberalisation in Britain: The Quest for a Satisfactory Wholesale Market Design. Energy J. 2005, 26, 43–70. [Google Scholar] [CrossRef]
  24. Pollitt, M.G. The Role of Policy in Energy Transitions: Lessons from the Energy Liberalisation Era. Energy Policy 2012, 50, 128–137. [Google Scholar] [CrossRef]
  25. Arcelay, I.; Goti, A.; Oyarbide-Zubillaga, A.; Akyazi, T.; Alberdi, E.; Garcia-Bringas, P. Definition of the Future Skills Needs of Job Profiles in the Renewable Energy Sector. Energies 2021, 14, 2609. [Google Scholar] [CrossRef]
  26. Acworth, W.; de Oca, M.M.; Boute, A.; Piantieri, C.; Matthes, F.C. Emissions Trading in Regulated Electricity Markets. Clim. Policy 2020, 20, 60–70. [Google Scholar] [CrossRef]
  27. Li, R.; Hu, Y.; Wang, X.; Zhang, B.; Chen, H. Estimating the Impacts of a New Power System on Electricity Prices under Dual Carbon Targets. J. Clean. Prod. 2024, 438, 140583. [Google Scholar] [CrossRef]
  28. Nie, Y.; Zhang, G.; Zhong, L.; Su, B.; Xi, X. Urban—rural Disparities in Household Energy and Electricity Consumption under the Influence of Electricity Price Reform Policies. Energy Policy 2024, 184, 113868. [Google Scholar] [CrossRef]
  29. Zhao, X.; Hu, S.; Wang, H.; Haowei, C.; Wenbin, Z.; Wenjie, L. Energy, Economic, and Environmental Impacts of Electricity Market-Oriented Reform and the Carbon Emissions Trading: A Recursive Dynamic CGE Model in China. Energy 2024, 298, 131416. [Google Scholar] [CrossRef]
  30. Sijm, J.; Neuhoff, K.; Chen, Y. CO2 Cost Pass-through and Windfall Profits in the Power Sector. Clim. Policy 2006, 6, 49–72. [Google Scholar] [CrossRef]
  31. Bojnec, Š.; Križaj, A. Electricity Markets during the Liberalization: The Case of a European Union Country. Energies 2021, 14, 4317. [Google Scholar] [CrossRef]
  32. Zhang, K.; Yao, Y.-F.; Liang, Q.-M.; Saren, G. How Should China Prioritize the Deregulation of Electricity Prices in the Context of Carbon Pricing? A Computable General Equilibrium Analysis. Energy Econ. 2021, 96, 105187. [Google Scholar] [CrossRef]
  33. Jia, Z.; Lin, B. CEEEA2.0 Model: A Dynamic CGE Model for Energy-Environment-Economy Analysis with Available Data and Code. Energy Econ. 2022, 112, 106117. [Google Scholar] [CrossRef]
  34. Huang, S.; Du, C.; Jin, X.; Zhang, D.; Wen, S.; Jia, Z. The Impact of Carbon Emission Trading on Renewable Energy: A Comparative Analysis Based on the CGE Model. Sustainability 2023, 15, 12649. [Google Scholar] [CrossRef]
  35. Jia, Z.; Wu, R.; Liu, Y.; Wen, S.; Lin, B. Can Carbon Tariffs Based on Domestic Embedded Carbon Emissions Reduce More Carbon Leakages? Ecol. Econ. 2024, 220, 108163. [Google Scholar] [CrossRef]
  36. Jia, Z.; Liu, Y.; Lin, B. The Impossible Triangle of Carbon Mitigation Policy. Energy Policy 2024, 189, 114107. [Google Scholar] [CrossRef]
  37. Jia, Z.; Wen, S.; Liu, Y. China’s Urban-Rural Inequality Caused by Carbon Neutrality: A Perspective from Carbon Footprint and Decomposed Social Welfare. Energy Econ. 2022, 113, 106193. [Google Scholar] [CrossRef]
  38. Jia, Z. The Hidden Benefit: Emission Trading Scheme and Business Performance of Downstream Enterprises. Energy Econ. 2023, 117, 106488. [Google Scholar] [CrossRef]
Figure 1. Structure of the CEEEA2.0 model. Note: This image was drawn by the authors.
Sustainability 17 05992 g001
Figure 2. Impact on GDP, annual CO2 emissions, and average mitigation cost. (a) Real GDP trajectories under BAU, ETS-Regulated, and ETS-Liberalization scenarios; (b) carbon emissions paths across scenarios (identical for both ETS scenarios by design); and (c) average carbon mitigation costs (CNY per ton of CO2) over time. All scenarios follow the same emissions trajectory; differences in outcomes reflect market structure and policy interactions. GDP is the real GDP at the 2018 price level.
Sustainability 17 05992 g002aSustainability 17 05992 g002b
Figure 3. Impact on carbon trading prices and feed-in tariffs during 2021–2040. (a) Carbon prices (CNY/t CO2) under ETS-Regulated and ETS-Liberalization scenarios; (b) feed-in tariffs under ETS-Regulated; and (c) feed-in tariffs under ETS-Liberalization. All prices are real prices anchored to the 2018 price level.
Sustainability 17 05992 g003
Figure 4. Impact on CPI and social welfare. (a) Evolution of the Consumer Price Index (CPI) under BaU, ETS-Regulated, and ETS-Liberalization scenarios; (b) welfare losses of rural and urban residents relative to BaU, measured by Equivalent Variation (EV) and Compensating Variation (CV).
Sustainability 17 05992 g004
Figure 5. Impact on consumption and price of goods and services. (a) Percentage change in sectoral consumption under ETS scenarios; (b) percentage change in sectoral prices under ETS scenarios.
Sustainability 17 05992 g005
Figure 6. Sensitivity analysis of GDP.
Sustainability 17 05992 g006
Table 1. Sector classification.
AbbreviationsSector’s Full Name
AGRAgriculture
COLCoal mining
COLPCoal processing
O_GOil and gas exploitation
REFORefined oil
REFGRefined gas
OMINOther mining
LGTLight industry
CMCChemicals
BMTLBuilding material
STLSteel
MTL_PMetal product
MFTManufacturing
THPThermal power
HYPHydropower
WDPWind power
NCPNuclear power
SOPSolar power
CSTConstruction
TSPTTransportation
SERServices
Note: The classification is the same as the previous paper [34].
Disclaimer/Publisher’s Note: The statements, opinions and data contained in all publications are solely those of the individual author(s) and contributor(s) and not of MDPI and/or the editor(s). MDPI and/or the editor(s) disclaim responsibility for any injury to people or property resulting from any ideas, methods, instructions or products referred to in the content.

