Article

Risk Assessment of Geological Hazards in Dawukou, Shizuishan City Based on the Information Value Model

1
Ningxia Hui Autonomous Region Land and Resources Survey and Monitoring Institute, Ningxia 750002, China
2
Chinese Academy of Geological Sciences, Beijing 100037, China
*
Authors to whom correspondence should be addressed.
Sustainability 2025, 17(13), 5990; https://doi.org/10.3390/su17135990
Submission received: 3 June 2025 / Revised: 20 June 2025 / Accepted: 20 June 2025 / Published: 30 June 2025

Abstract

Geological hazards pose significant threats to ecological stability, human lives, and infrastructure, necessitating precise and robust risk assessment methodologies. This study evaluates geological hazard risks in Dawukou District, Shizuishan City, Ningxia Hui Autonomous Region, using the information value (IV) model. The study systematically identifies susceptibility, hazard, and vulnerability factors influencing geological disaster risks by integrating diverse datasets encompassing geological conditions, meteorological parameters, and anthropogenic activities. The key findings reveal that hilly landforms, slope gradients, and vegetation indices are the dominant contributors to hazard development. Additional factors, including lithology, fault proximity, and precipitation, were also found to play critical roles. The results categorize the district into four risk zones: high-risk areas (1.55% of the total area), moderate-risk areas (10.16%), Low-risk areas (23.32%), and very-low-risk areas (64.97%). These zones exhibit a strong spatial correlation with geomorphic features, tectonic activity, and human engineering interventions, such as mining and infrastructure development. High-risk zones are concentrated near mining regions and fault lines with steep slopes, while low-risk zones are predominantly in flat plains and urban centers. The reliability of the risk assessment was validated through cross-referenced geological hazard occurrence data and Receiver Operating Characteristic (ROC) curve analysis, achieving a high predictive accuracy (AUC = 0.88). The study provides actionable insights for disaster prevention, mitigation strategies, and urban planning, offering a scientific basis for resource allocation and sustainable development. The methodology and findings serve as a replicable framework for geological hazard risk assessments in similar regions facing diverse environmental and anthropogenic challenges.

1. Introduction

Geological hazards, including landslides, debris flows, and rock collapses, pose significant threats to human life, property, and ecological systems [1,2,3,4,5,6]. These natural disasters result from the intricate interplay of geological, hydrological, and anthropogenic factors, creating complex conditions that challenge prediction and mitigation efforts [7,8]. Effective geological hazard management is essential for sustainable development, as it ensures the safety of human settlements and infrastructure while preserving ecological integrity [9,10]. Over the past decade, the frequency and intensity of geological hazards have increased globally, driven by climate change, urbanization, and intensified resource extraction activities [11,12,13]. This trend has underscored the urgent need for precise and robust risk assessment methodologies to guide preventive measures, disaster mitigation strategies, and policymaking.
The Dawukou District in Shizuishan City, situated in the Ningxia Hui Autonomous Region of Northwest China, is a compelling geological hazard risk assessment case study (Figure 1) [14,15]. The district has diverse geological settings, active tectonic movements, and complex terrain, including steep slopes, hilly landforms, and fragile ecological systems. These factors, coupled with intensive human activities, such as mining, urban expansion, and infrastructure development, have led to a high prevalence of geological hazards in the region. Frequent landslides, debris flows, and slope collapses have posed significant risks to local communities, economic stability, and environmental health [3,5,16]. The unique geological and environmental characteristics of Dawukou highlight the importance of developing tailored and accurate risk assessment methodologies [17,18].
The information value (IV) model has emerged as a widely adopted and effective tool among various geological hazard risk assessment approaches [19,20]. The IV model provides an objective and quantitative framework for identifying and mapping hazard-prone zones by statistically analyzing the relationship between hazard occurrences and influencing factors [21,22,23]. This method evaluates the contribution of various geological, environmental, and anthropogenic factors to hazard susceptibility, facilitating and delineating high-risk areas. The IV model has been successfully applied in numerous regions worldwide, demonstrating its adaptability to different geological contexts and its precision in hazard prediction [24,25,26]. However, its application in Dawukou District, where complex interactions between unique geological and environmental factors occur, remains underexplored.
This study applies the IV model to assess geological hazard risks in Dawukou District, focusing on integrating datasets encompassing geological conditions, hydrological parameters, and anthropogenic activities. Key objectives of the study include identifying the dominant factors contributing to geological hazards, delineating high-risk zones, and validating the results using statistical and spatial analysis techniques. Factors such as slope gradient, lithology, proximity to fault zones, vegetation cover, and rainfall patterns are analyzed to understand their role in hazard susceptibility. By integrating these diverse datasets, the study seeks to provide a comprehensive understanding of hazard distribution and its underlying drivers.
The findings of this research aim to inform the development of targeted mitigation strategies, including slope stabilization, vegetation restoration, and real-time monitoring systems [27,28,29,30]. Additionally, the results provide a scientific basis for regional urban planning, infrastructure design, and resource management, ensuring that development activities consider geological hazard risks. By addressing the specific challenges Dawukou District faces, this study contributes to the broader geological hazard risk assessment and disaster management field. Furthermore, the methodological framework developed in this study can serve as a reference for assessing geological hazards in other regions with similar environmental and anthropogenic complexities [31,32,33].
However, the integration of susceptibility, hazard, and vulnerability factors using the IV model has not been previously applied to the Dawukou District, which features a complex interaction of tectonic activity, intensive mining, and fragile ecological conditions. Additionally, previous studies in similar regions have rarely combined quantitative IV modeling with field-based validation and a multi-factor hazard framework.
This study addresses these gaps by applying an integrated IV-based methodology tailored to Dawukou’s unique geological and environmental context, offering new insights into risk zoning for sustainable urban development. Ultimately, this work supports proactive disaster risk reduction, promoting resilience and sustainable development in hazard-prone areas.

2. Geological Context

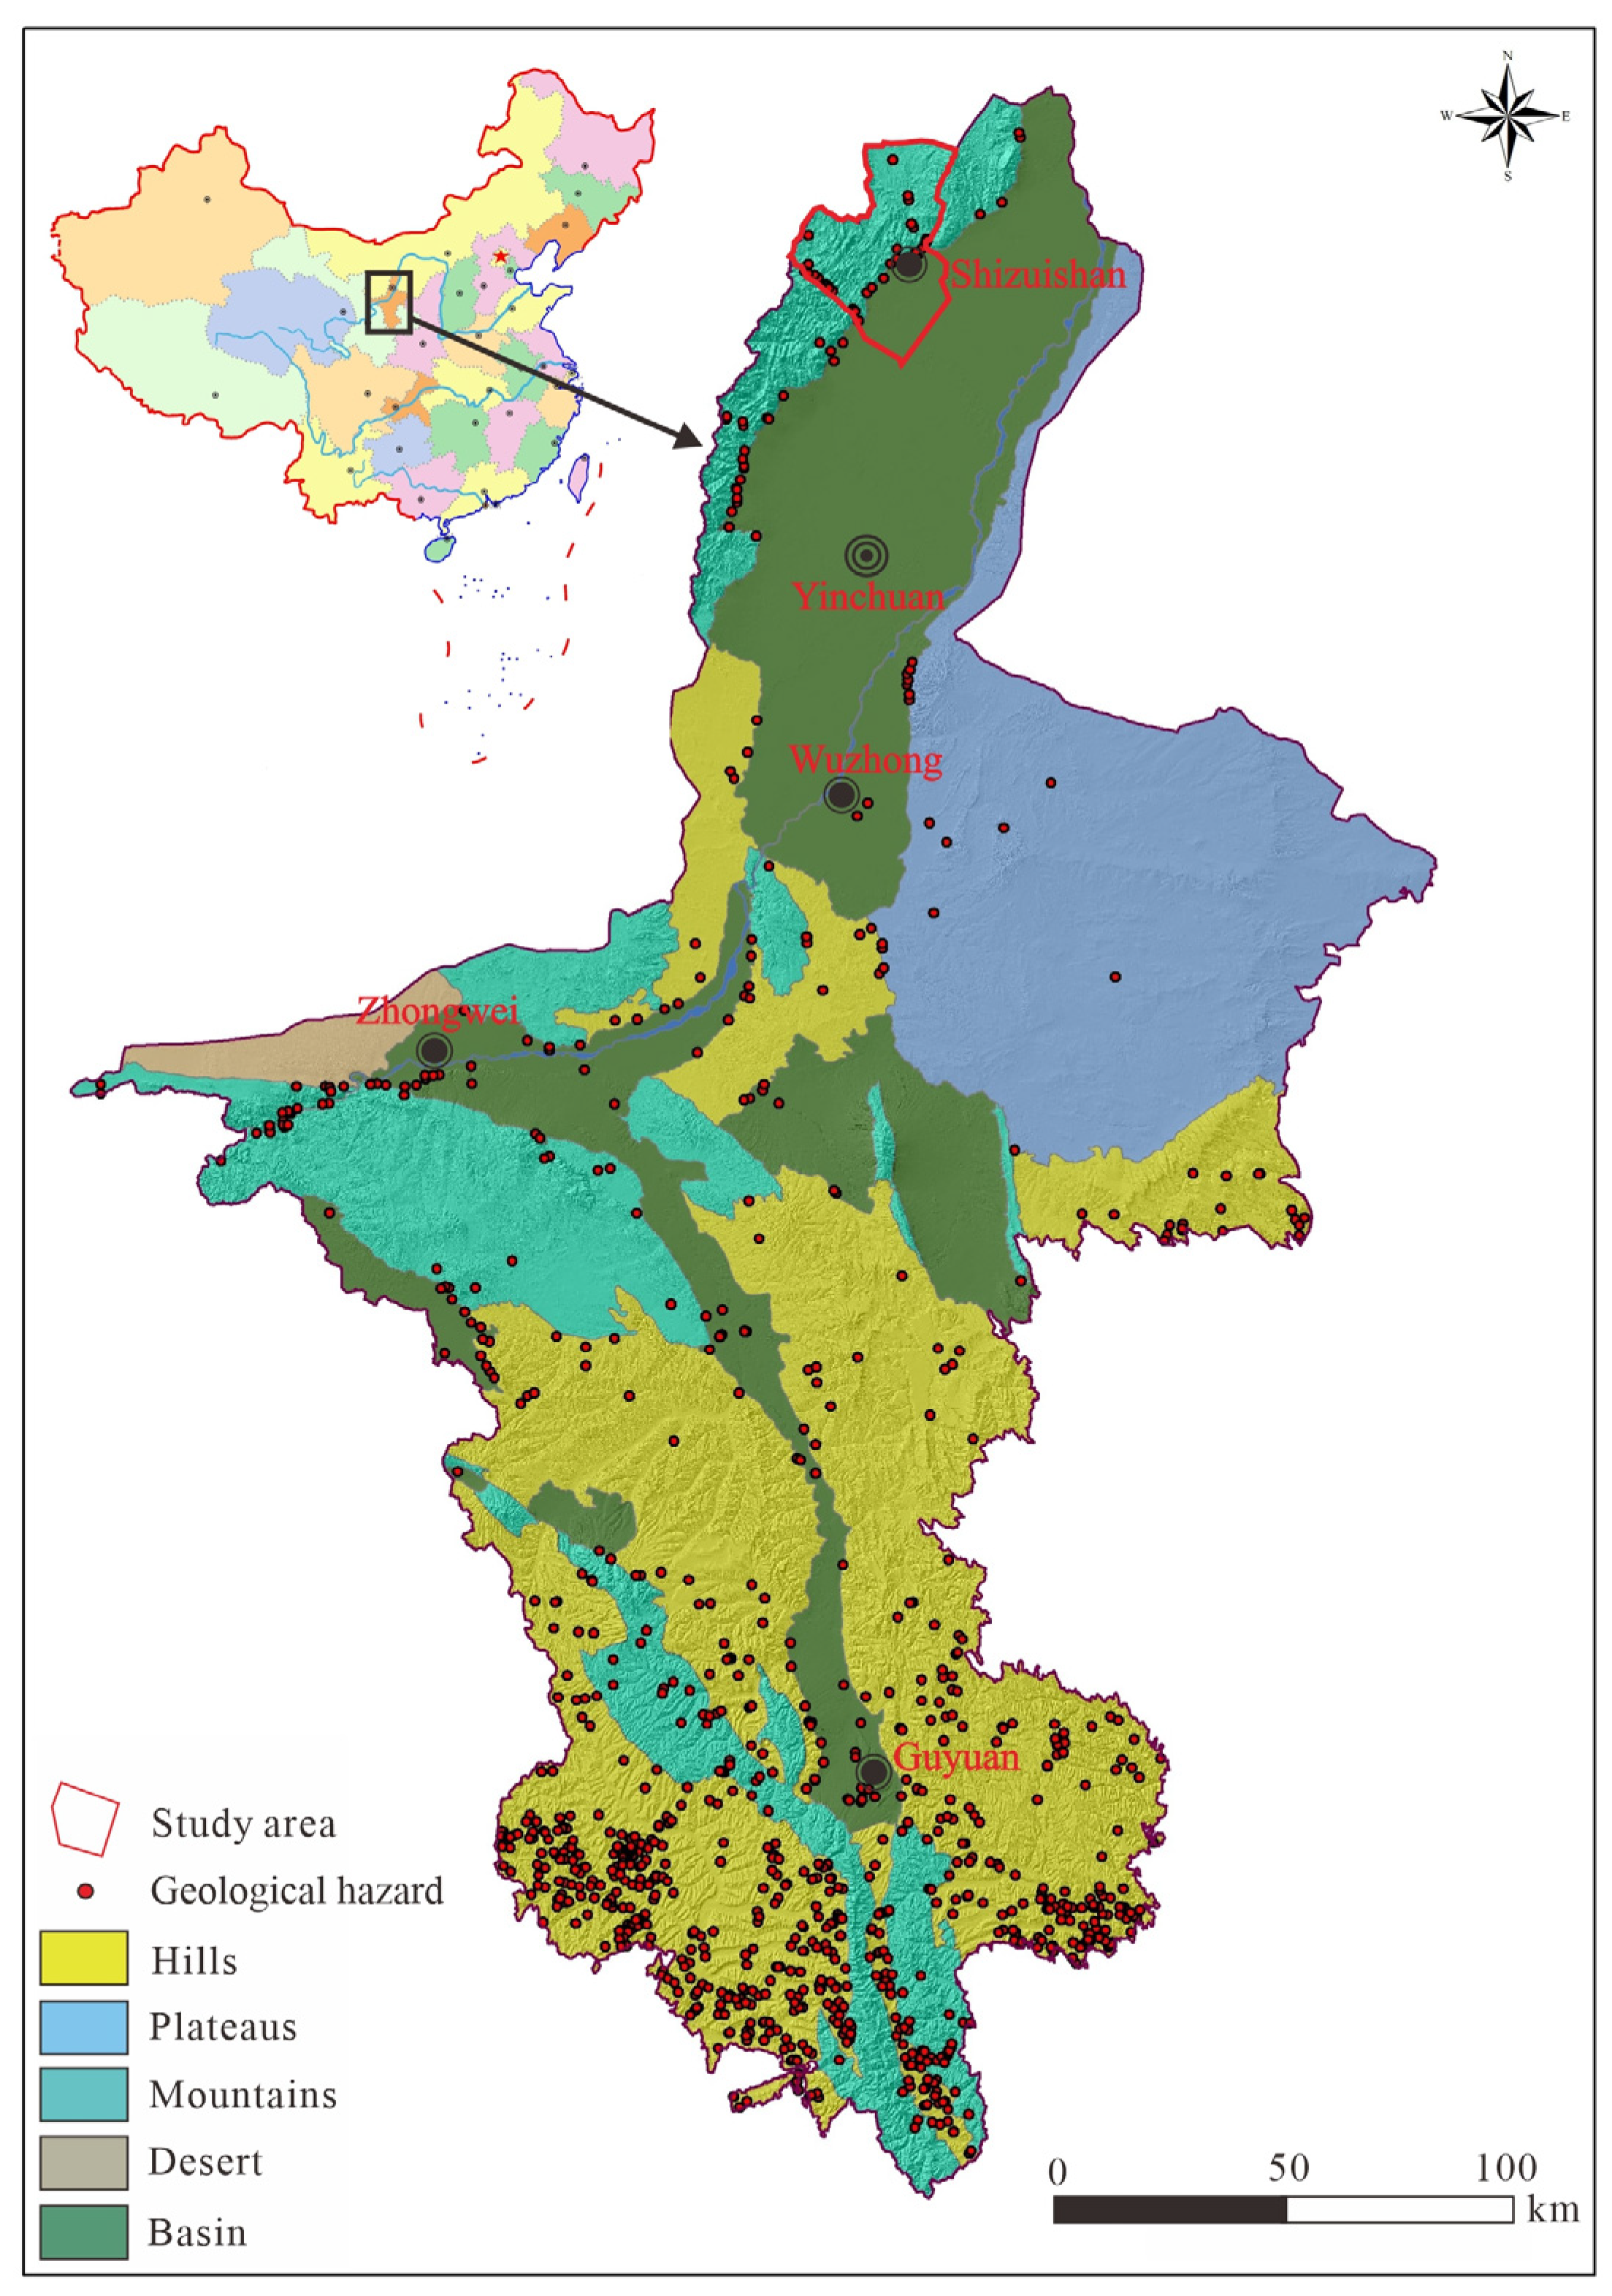
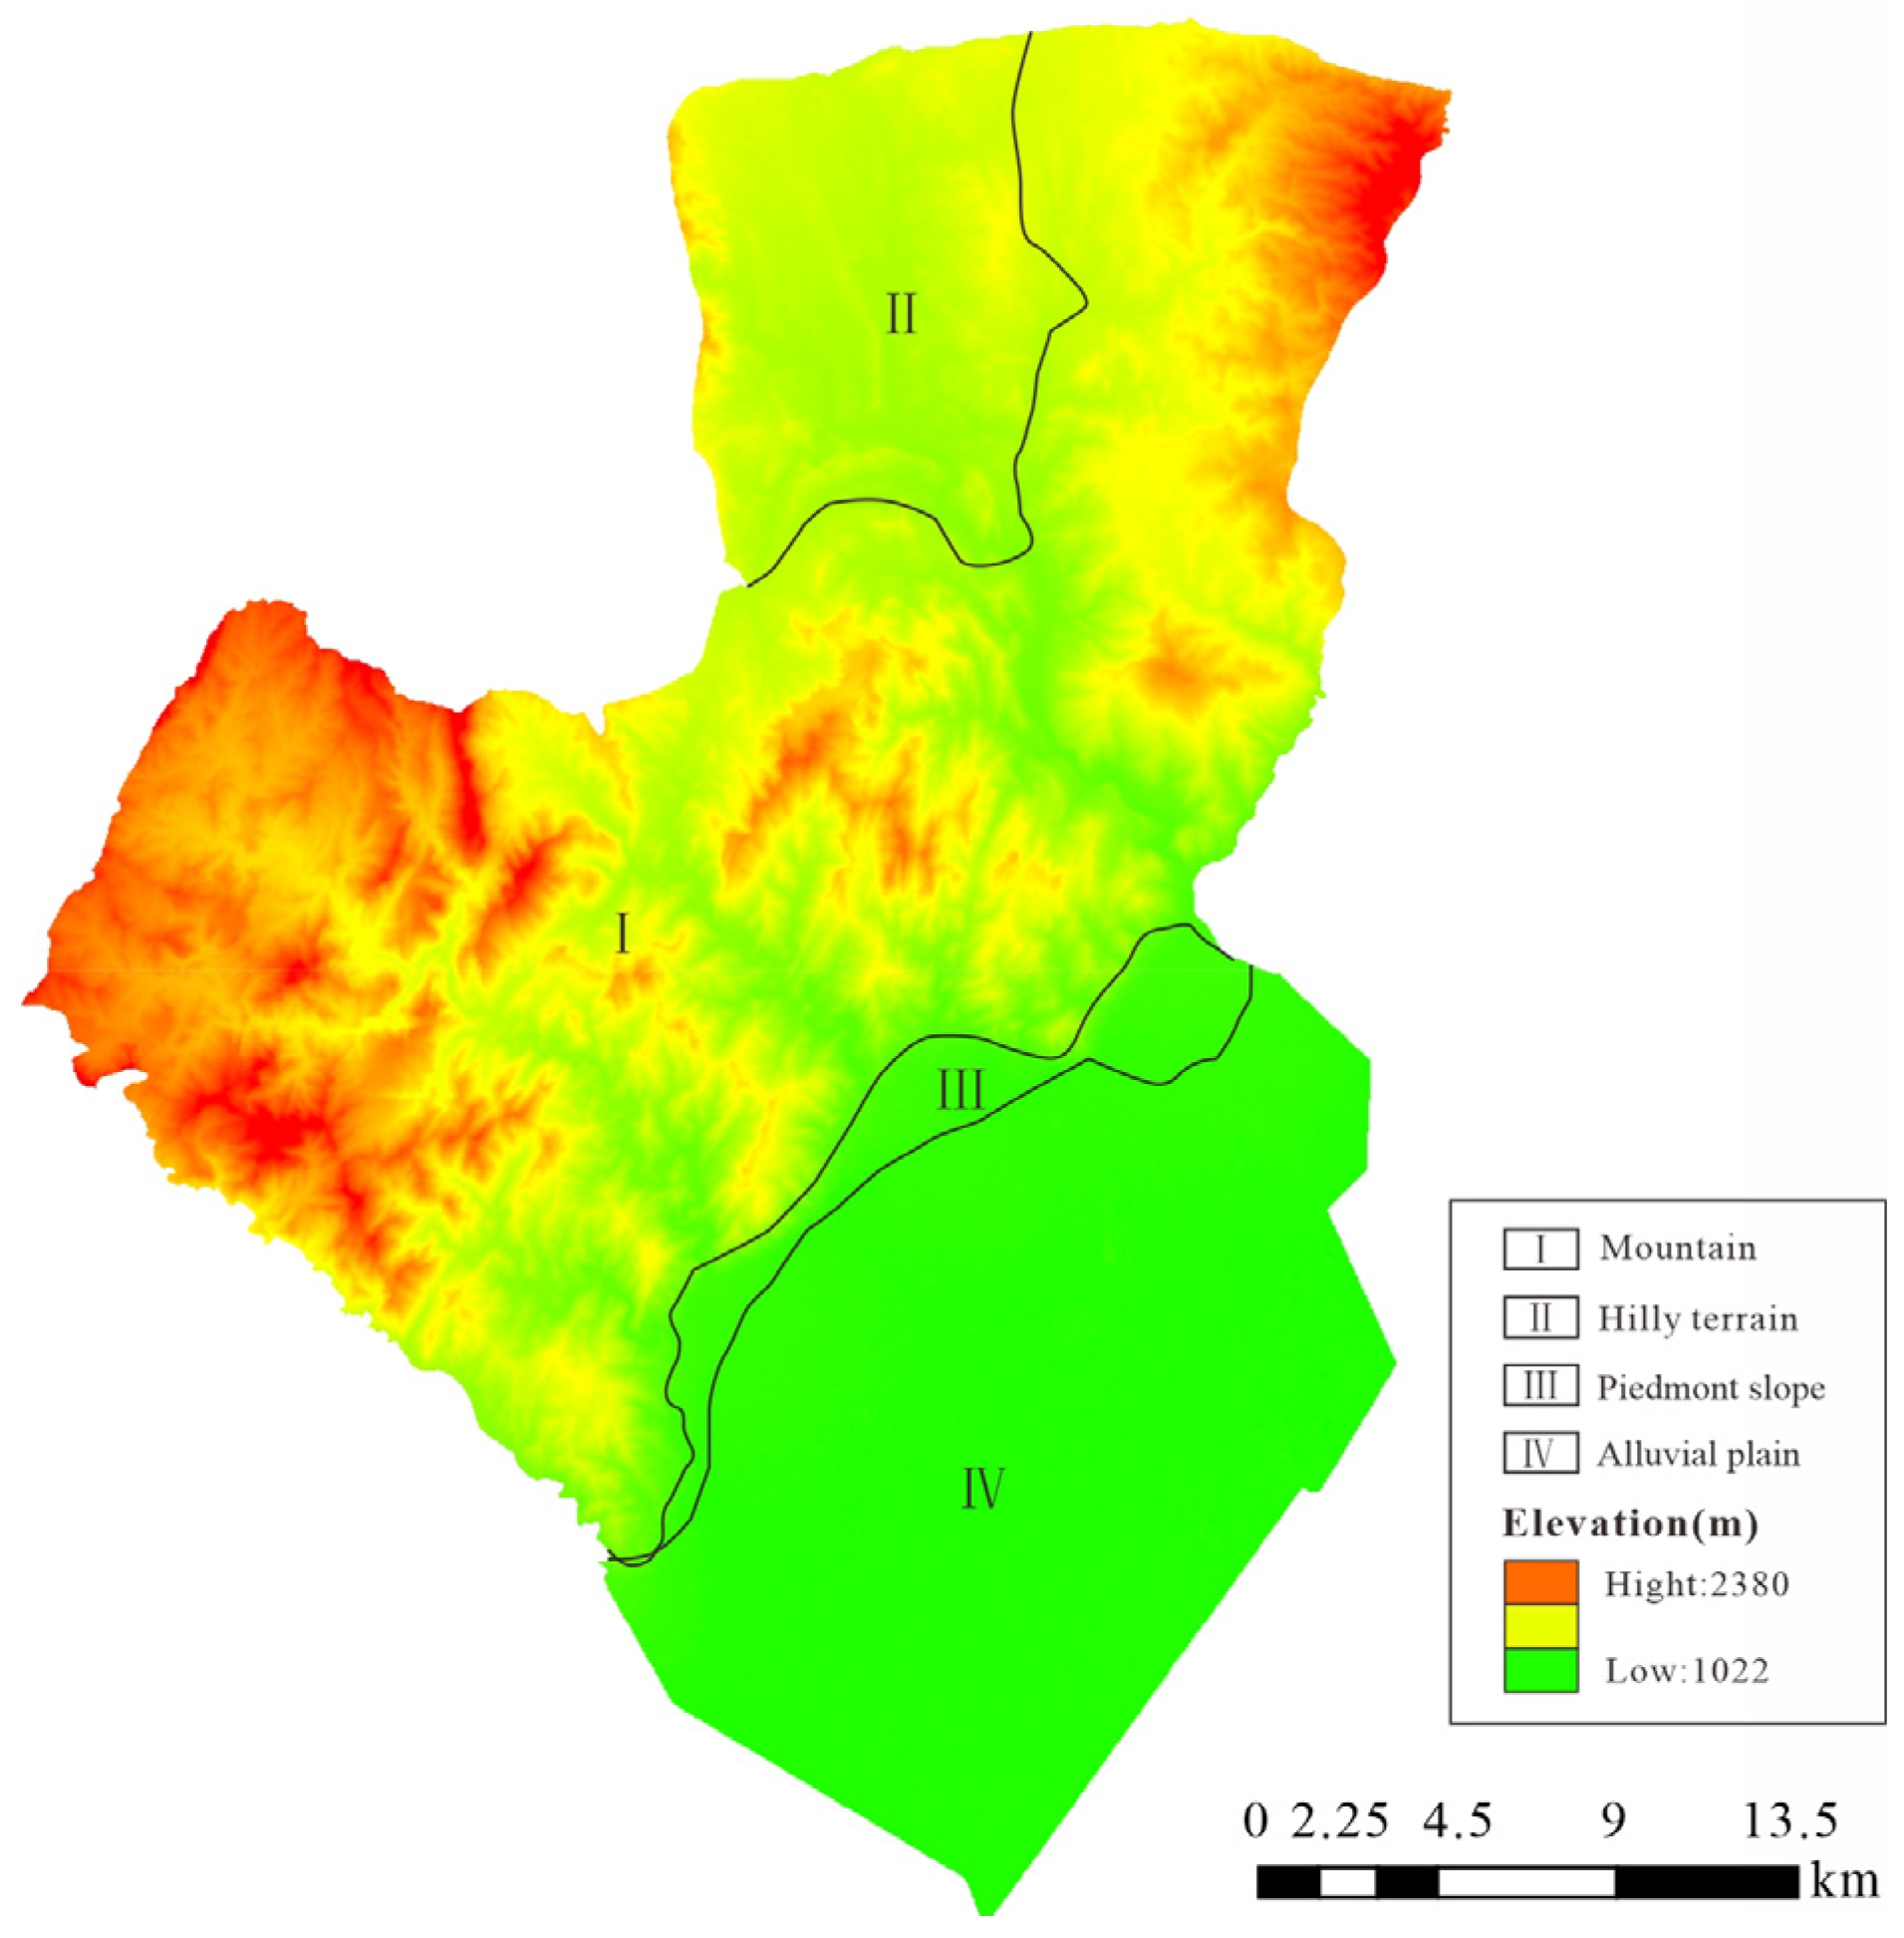
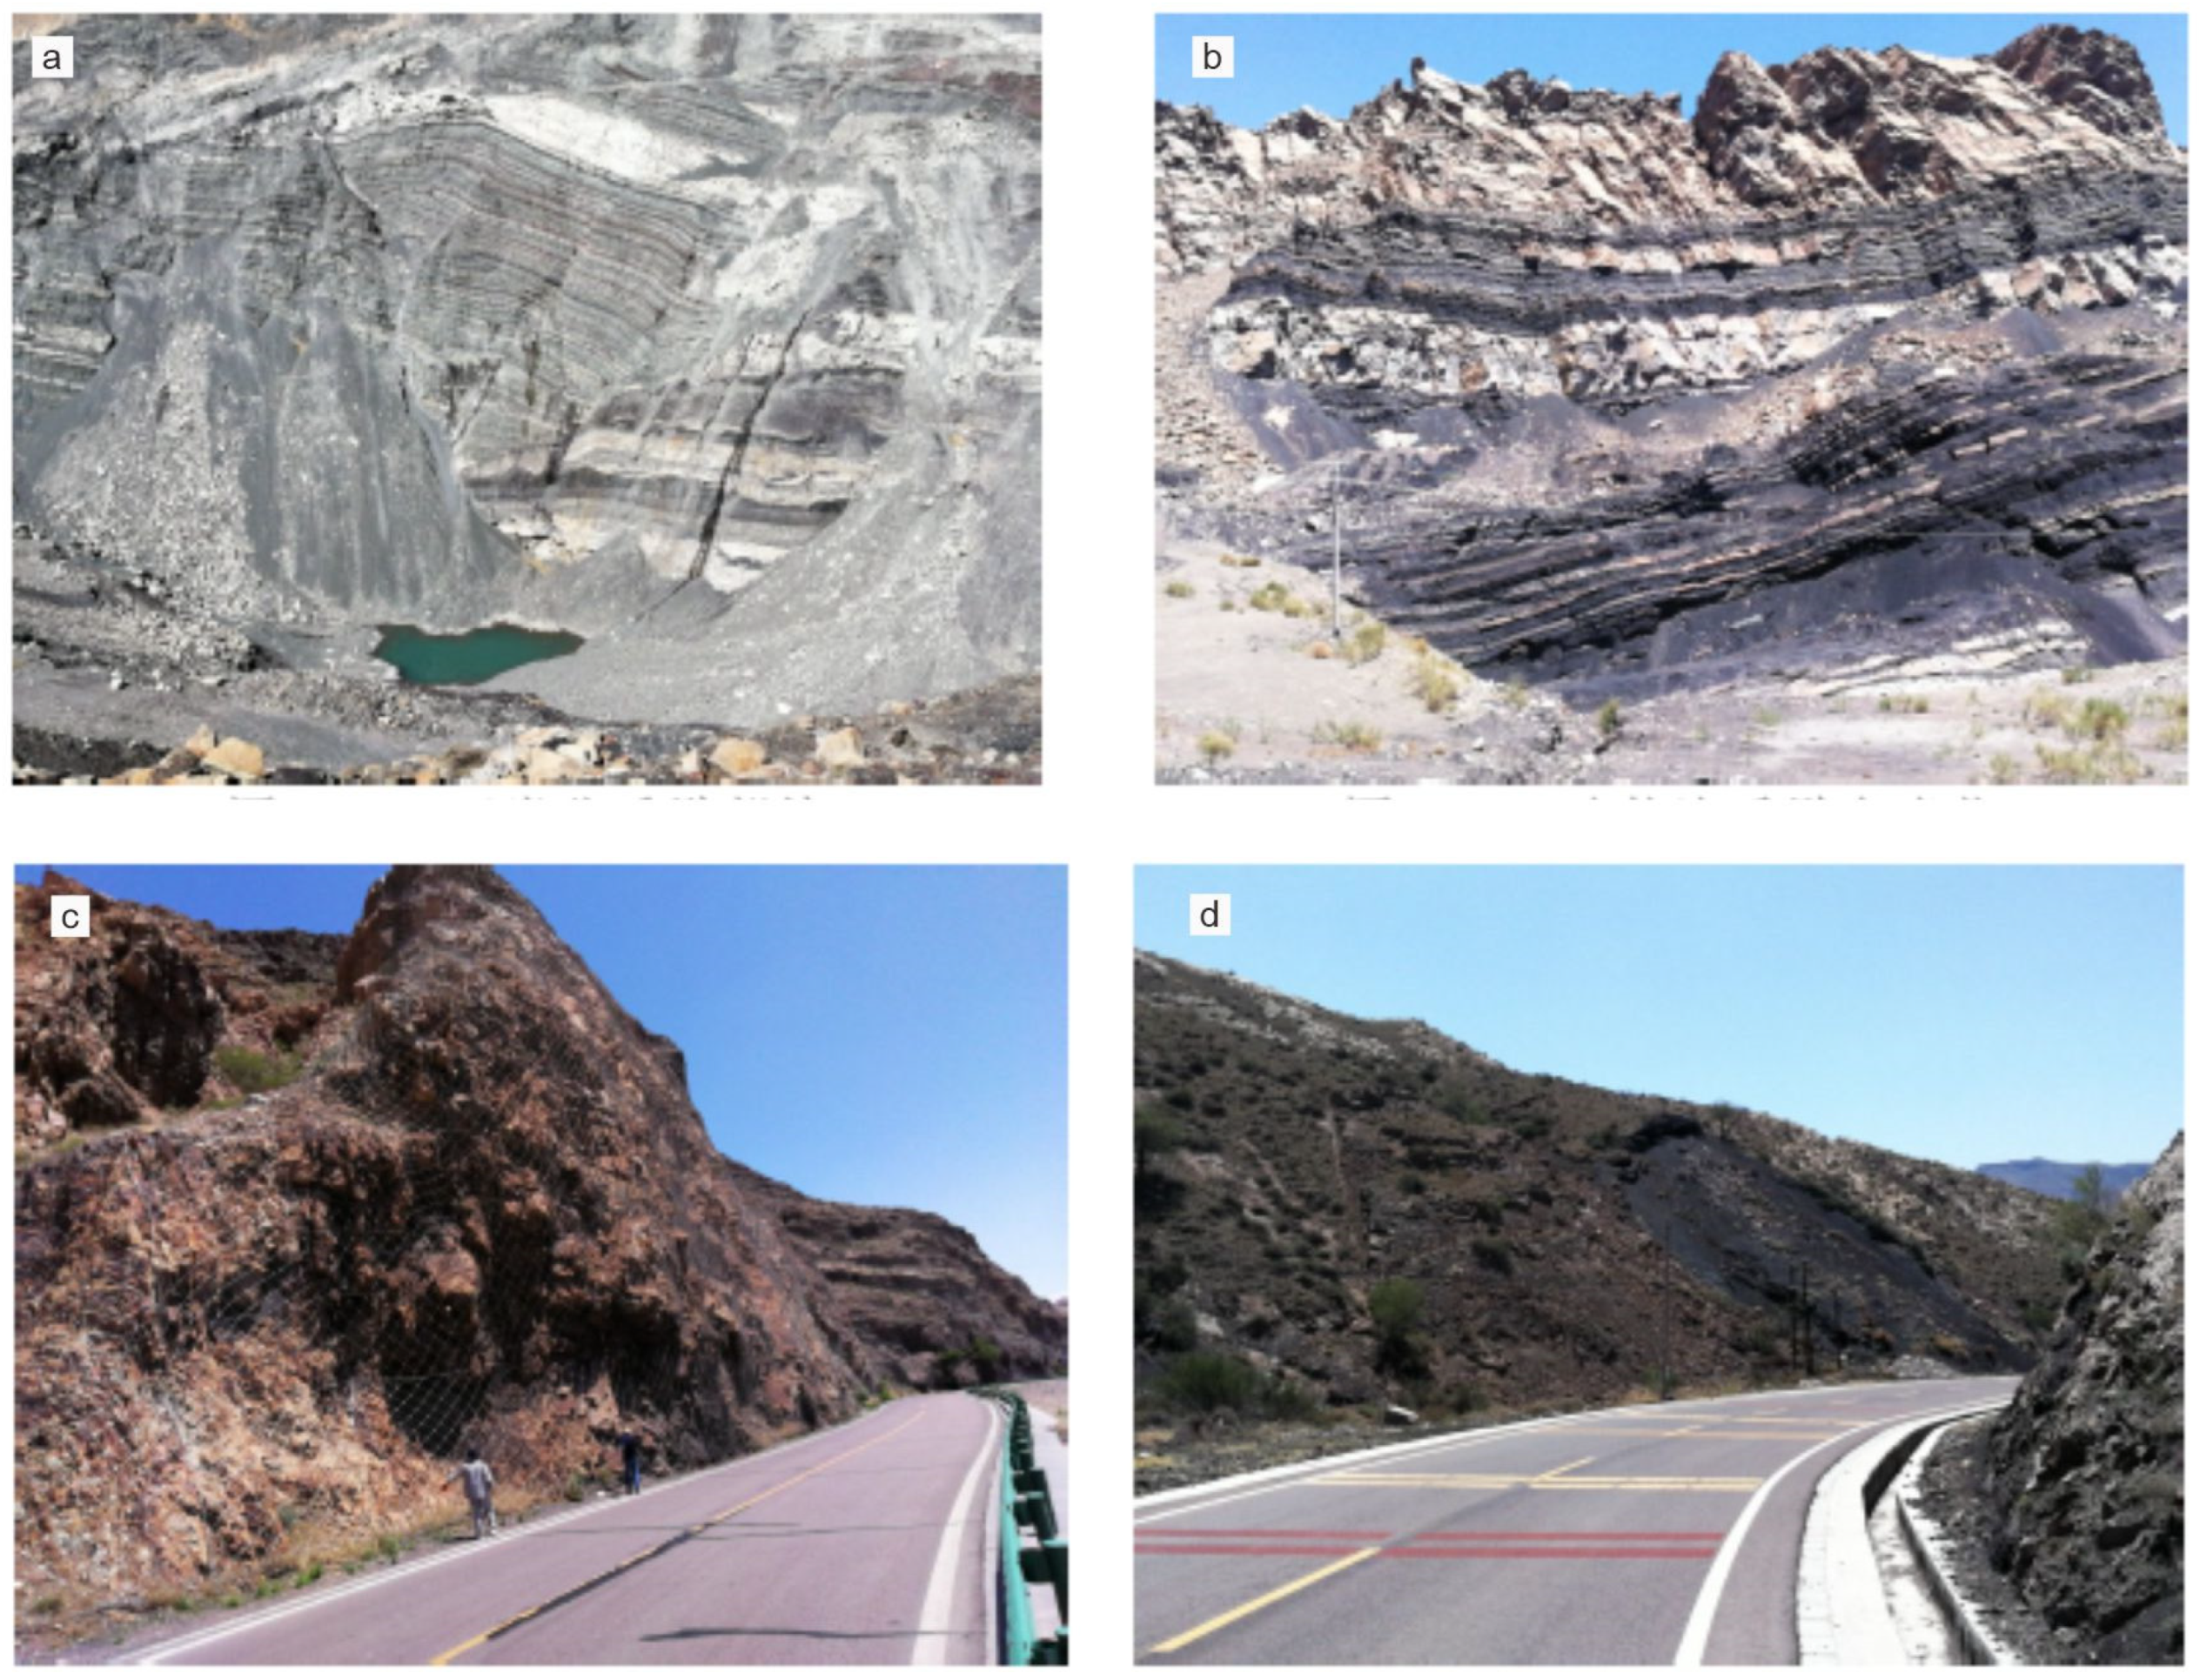
2.1. Topographical and Geological Setting

Dawukou District, located in Shizuishan City, Ningxia Hui Autonomous Region, occupies a key geological position at the junction of the Alxa Block and the Ordos Block [34,35]. This tectonic setting is characterized by active faulting and structural deformation, significantly influencing the region’s geological hazards [36,37]. The terrain is diverse, encompassing hilly landscapes, mountainous areas, and plains, with pronounced elevation differences (Figure 2). Steep slopes and dissected valleys dominate the hilly and mountainous areas, creating favorable conditions for landslides and debris flows. The region’s geology primarily comprises sedimentary rocks, such as sandstone, mudstone, and limestone, interspersed with localized igneous intrusions. The variability in rock type and its mechanical properties, such as weathering resistance and fracture density, contributes to differing levels of slope stability. Tectonic activities, evidenced by fault scarps and neotectonic movements, exacerbate the area’s vulnerability to geological hazards [38,39].

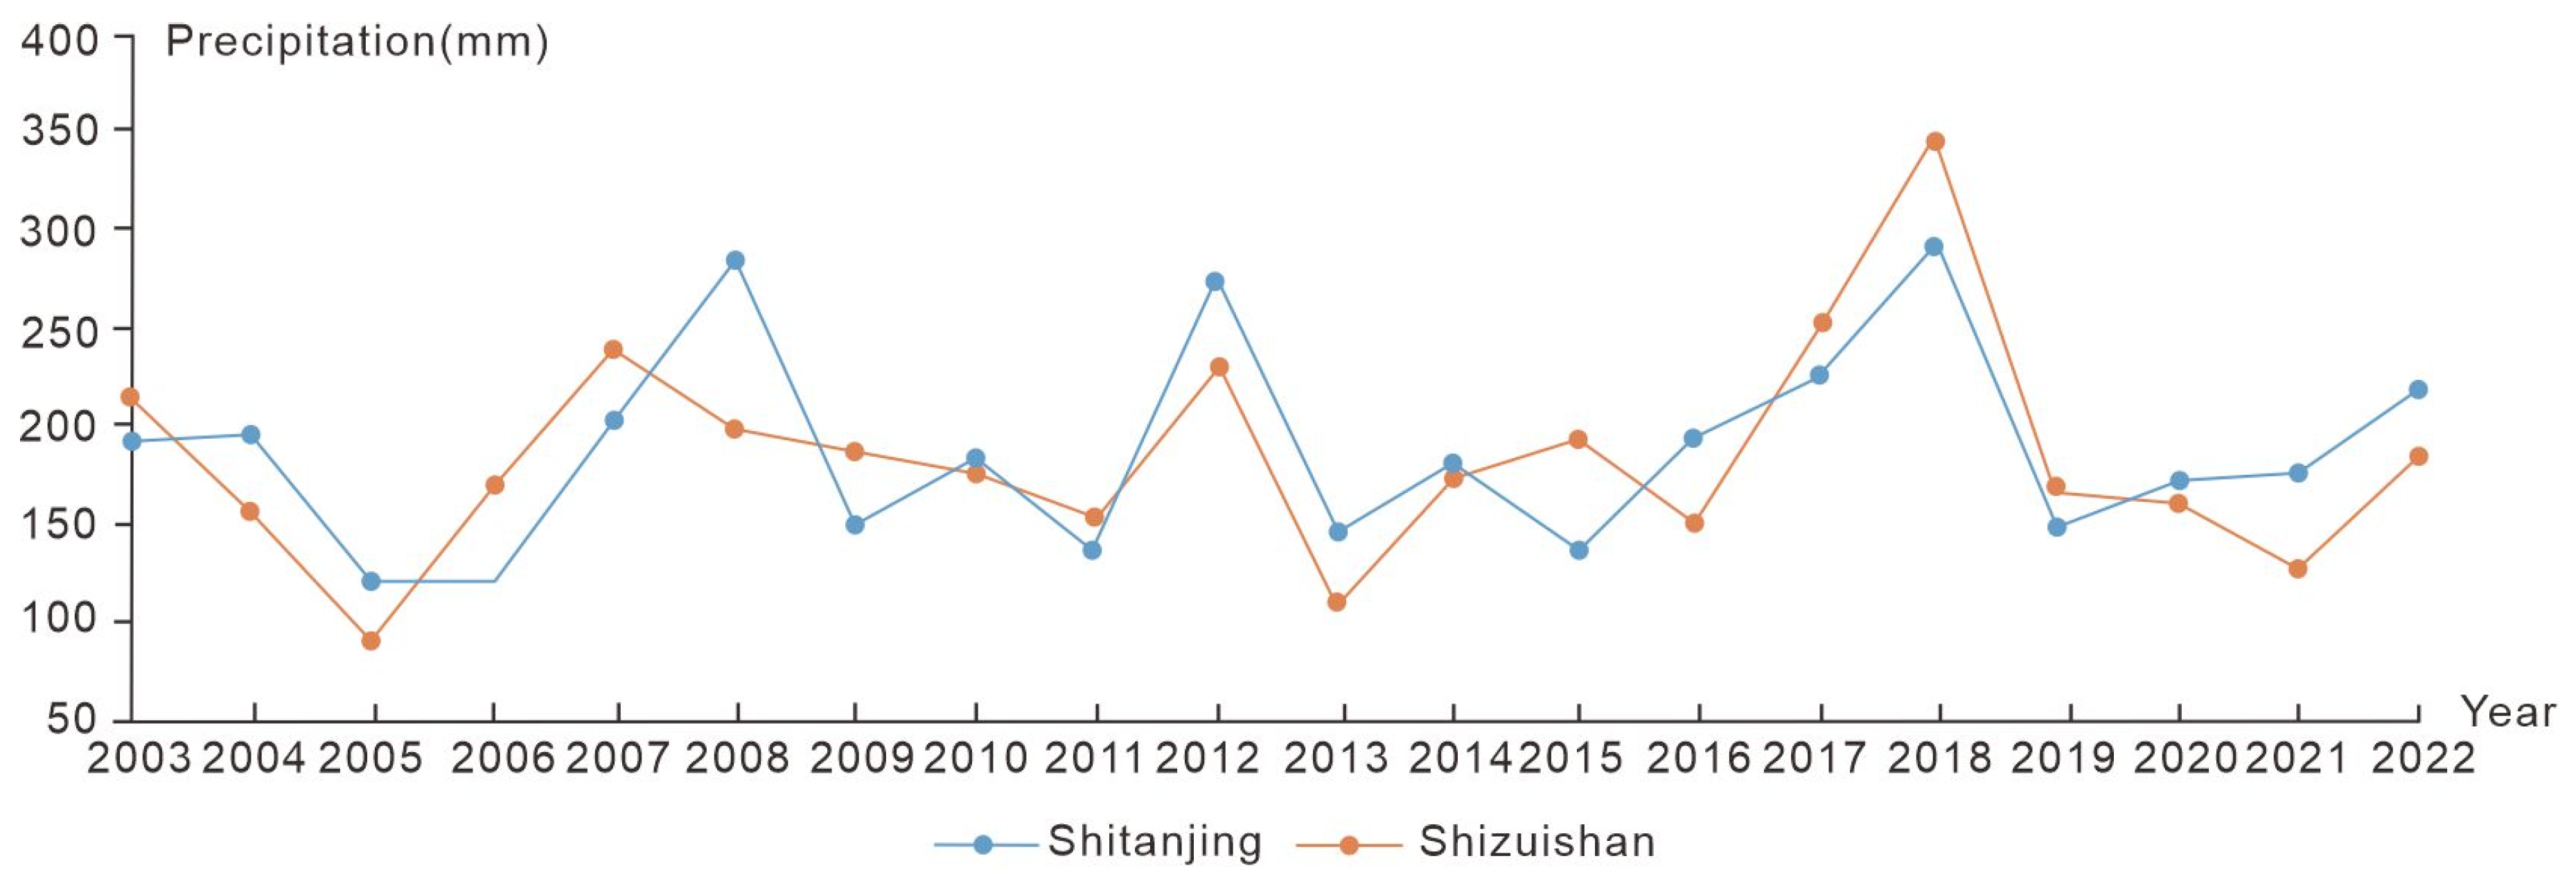
2.2. Hydrology and Climatic Influences

Hydrological processes and climatic conditions are critical factors influencing the development of geological hazards in Dawukou [40,41]. The district experiences a semi-arid climate, with an average annual precipitation of 180–200 mm (Figure 3). The precipitation data are derived from two key meteorological stations, Shitanjing (within the district) and Shizuishan (adjacent urban area), to capture localized rainfall variations. Although the overall rainfall is low, intense and localized storm events can result in rapid water accumulation on slopes, leading to saturation and triggering landslides and debris flows. Additionally, groundwater seepage along fault zones and in highly fractured rock masses further destabilizes the slopes, increasing their susceptibility to failure [42,43]. Seasonal variability, including prolonged dry periods followed by sudden intense rainfall, amplifies the potential for hazards by creating conditions conducive to slope erosion and mass movement. The combination of topographic and hydrological factors plays a pivotal role in geological disasters’ spatial and temporal occurrence [44,45].

2.3. Human Impact and Hazard Distribution

Human activities have significantly altered the geological and environmental stability of Dawukou [17,18]. Mining operations, a significant economic activity in the district, have created large spoil heaps, high and steep exposed slopes, and open pits (Figure 4). Figure 4 illustrates representative field conditions reflecting human-induced geological disturbances across the study area. These anthropogenic modifications disturb the natural equilibrium of the terrain, increasing the likelihood of slope failures. Additionally, infrastructure development, such as road construction and urban expansion, exacerbates erosion and increases slope loading, further destabilizing vulnerable areas. The spatial distribution of geological hazards, including landslides and debris flows, closely aligns with areas of active human intervention, steep slopes, and proximity to fault zones [46]. Historical records and field investigations highlight that these hazards frequently occur near mining sites, transportation corridors, and densely populated regions, posing significant risks to local communities, infrastructure, and ecosystems. Understanding the interplay between natural and anthropogenic factors is crucial for implementing effective risk mitigation and disaster prevention strategies [47,48].

3. Methodology and Data Sources

3.1. Methodology

This study employs the information value (IV) model to assess geological hazard risks in Dawukou District. The IV model is a widely recognized quantitative method in hazard risk assessment due to its objectivity and simplicity. The IV model provides a robust framework for identifying and mapping hazard-prone areas by analyzing the statistical relationship between geological hazard occurrences and contributing factors [49]. This method integrates spatial data and statistical techniques, ensuring accurate and reproducible results. Its capability to incorporate diverse datasets, including geological, hydrological, and anthropogenic parameters, makes it highly effective in complex environmental settings, such as Dawukou District.

3.1.1. Information Value (IV) Model

The information value (IV) model quantifies the relationship between geological hazards and influencing factors by calculating each factor’s intervals’ statistical information value (IV). The underlying principle is that geological hazards are more likely to occur under specific conditions represented by distinct ranges or intervals of contributing factors, such as slope gradient, lithology, or proximity to fault zones. The formula used to calculate the IV for a given factor x i is as follows:
I ( x i , D ) = l n ( N i / S i N / S )
where I ( x i , D) represents the information value of factor x i contributing to geological hazards (D). N i and S i denote the number of hazard occurrences and the spatial area of factor x i within interval i, respectively. N and S represent the total hazard occurrences and the study area.
Factors with positive information values (I > 0) indicate a higher likelihood of hazard occurrences in that interval, while negative values (I < 0) suggest a lower likelihood. Zero (I = 0) denotes that the interval does not significantly influence hazard occurrence.

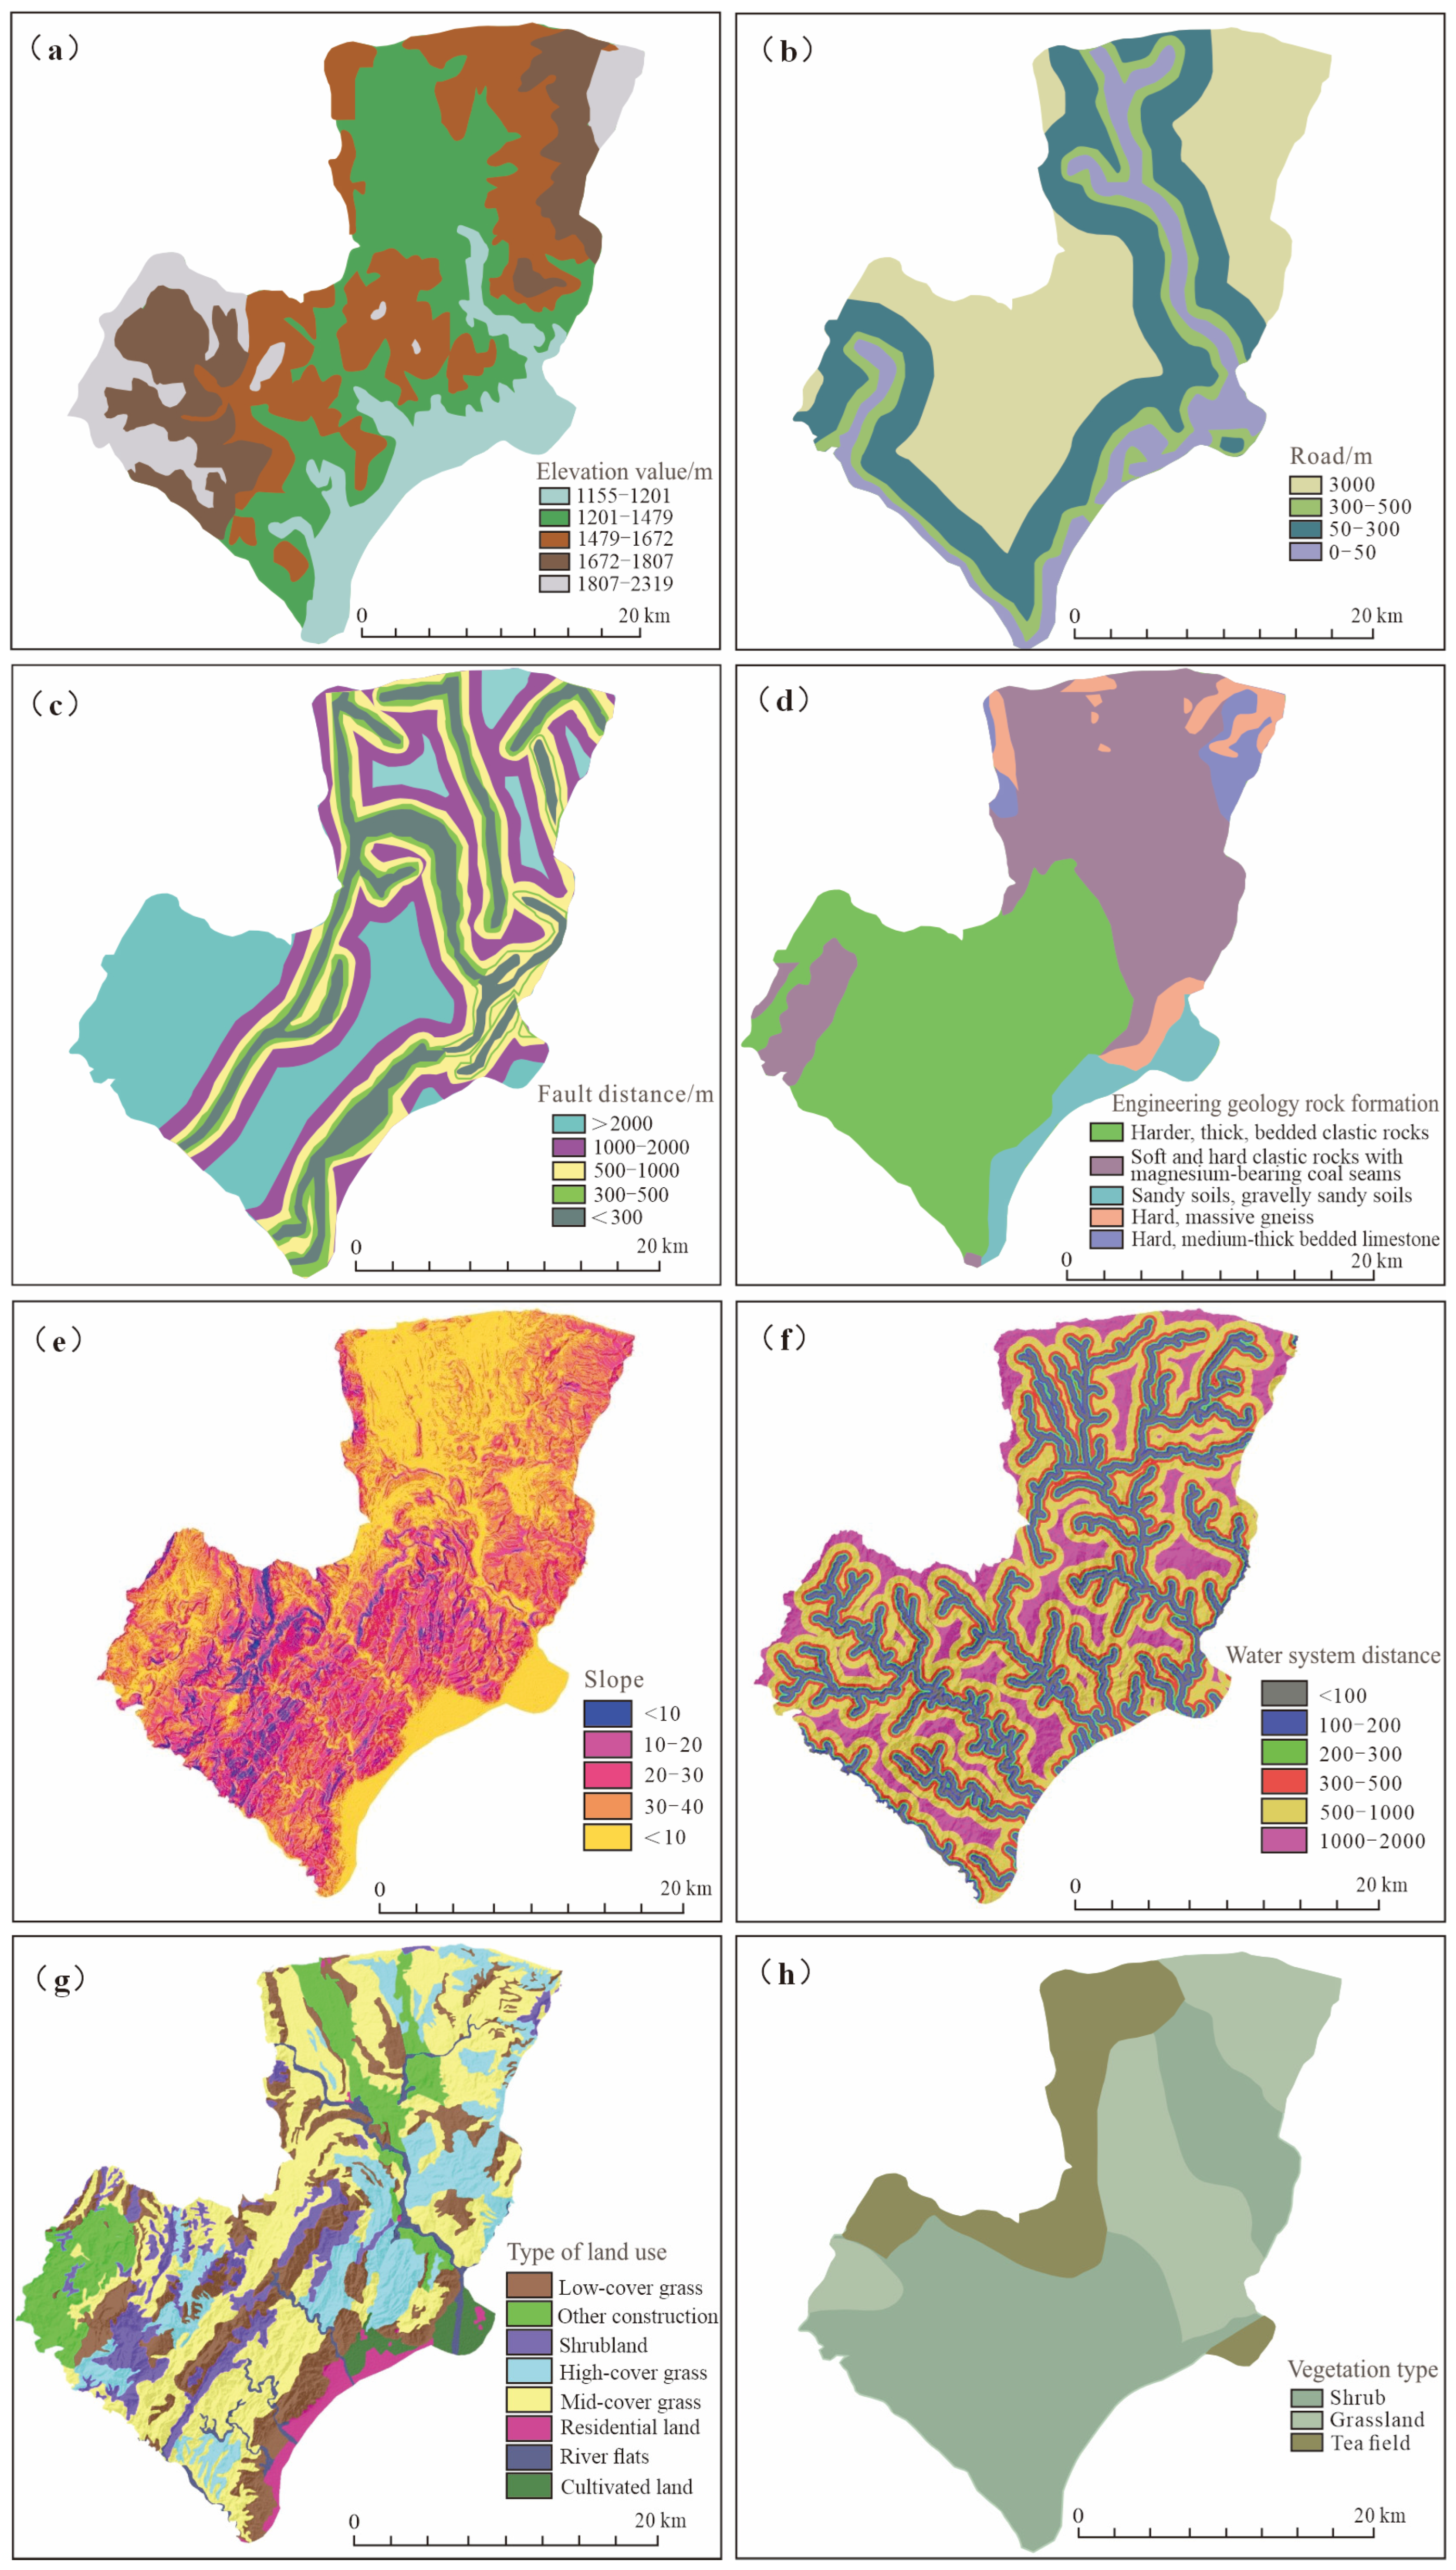
3.1.2. Factor Selection and Weighting

To accurately assess geological hazard risk, this study selects key contributing factors based on a combination of geomorphological theory, empirical studies, and regional geological context. The selected variables—slope gradient, lithology, fault proximity, precipitation, vegetation index (NDVI), and indicators of human activity—are widely recognized in landslide and debris flow susceptibility research as dominant conditioning elements. Previous studies have demonstrated that slope instability is strongly linked to steep terrain, weak lithology, and proximity to fault lines, which promote ground deformation and reduce shear strength [50]. Vegetation cover and precipitation are known to influence soil saturation and erosion resistance, acting as dynamic triggers of hazard initiation [25]. The relative importance of these factors was further evaluated in this study using a combination of statistical correlation analysis and expert judgment [35,51].
To accurately assess risk, the study identifies critical factors influencing geological hazards based on geological, hydrological, and anthropogenic datasets. Factors include slope gradient, lithology, fault proximity, vegetation index (NDVI), precipitation, and human activities [50]. These factors are analyzed for their relative importance, and weights are assigned using statistical correlations and expert judgment.

3.1.3. Risk Zonation

The IV values for all factors are combined to generate a spatial risk map of Dawukou District. The study area is divided into grid cells (25 m × 25 m), each receiving a cumulative IV score. Cells are categorized into high, moderate, low, and very-low-risk zones based on cumulative IV thresholds.

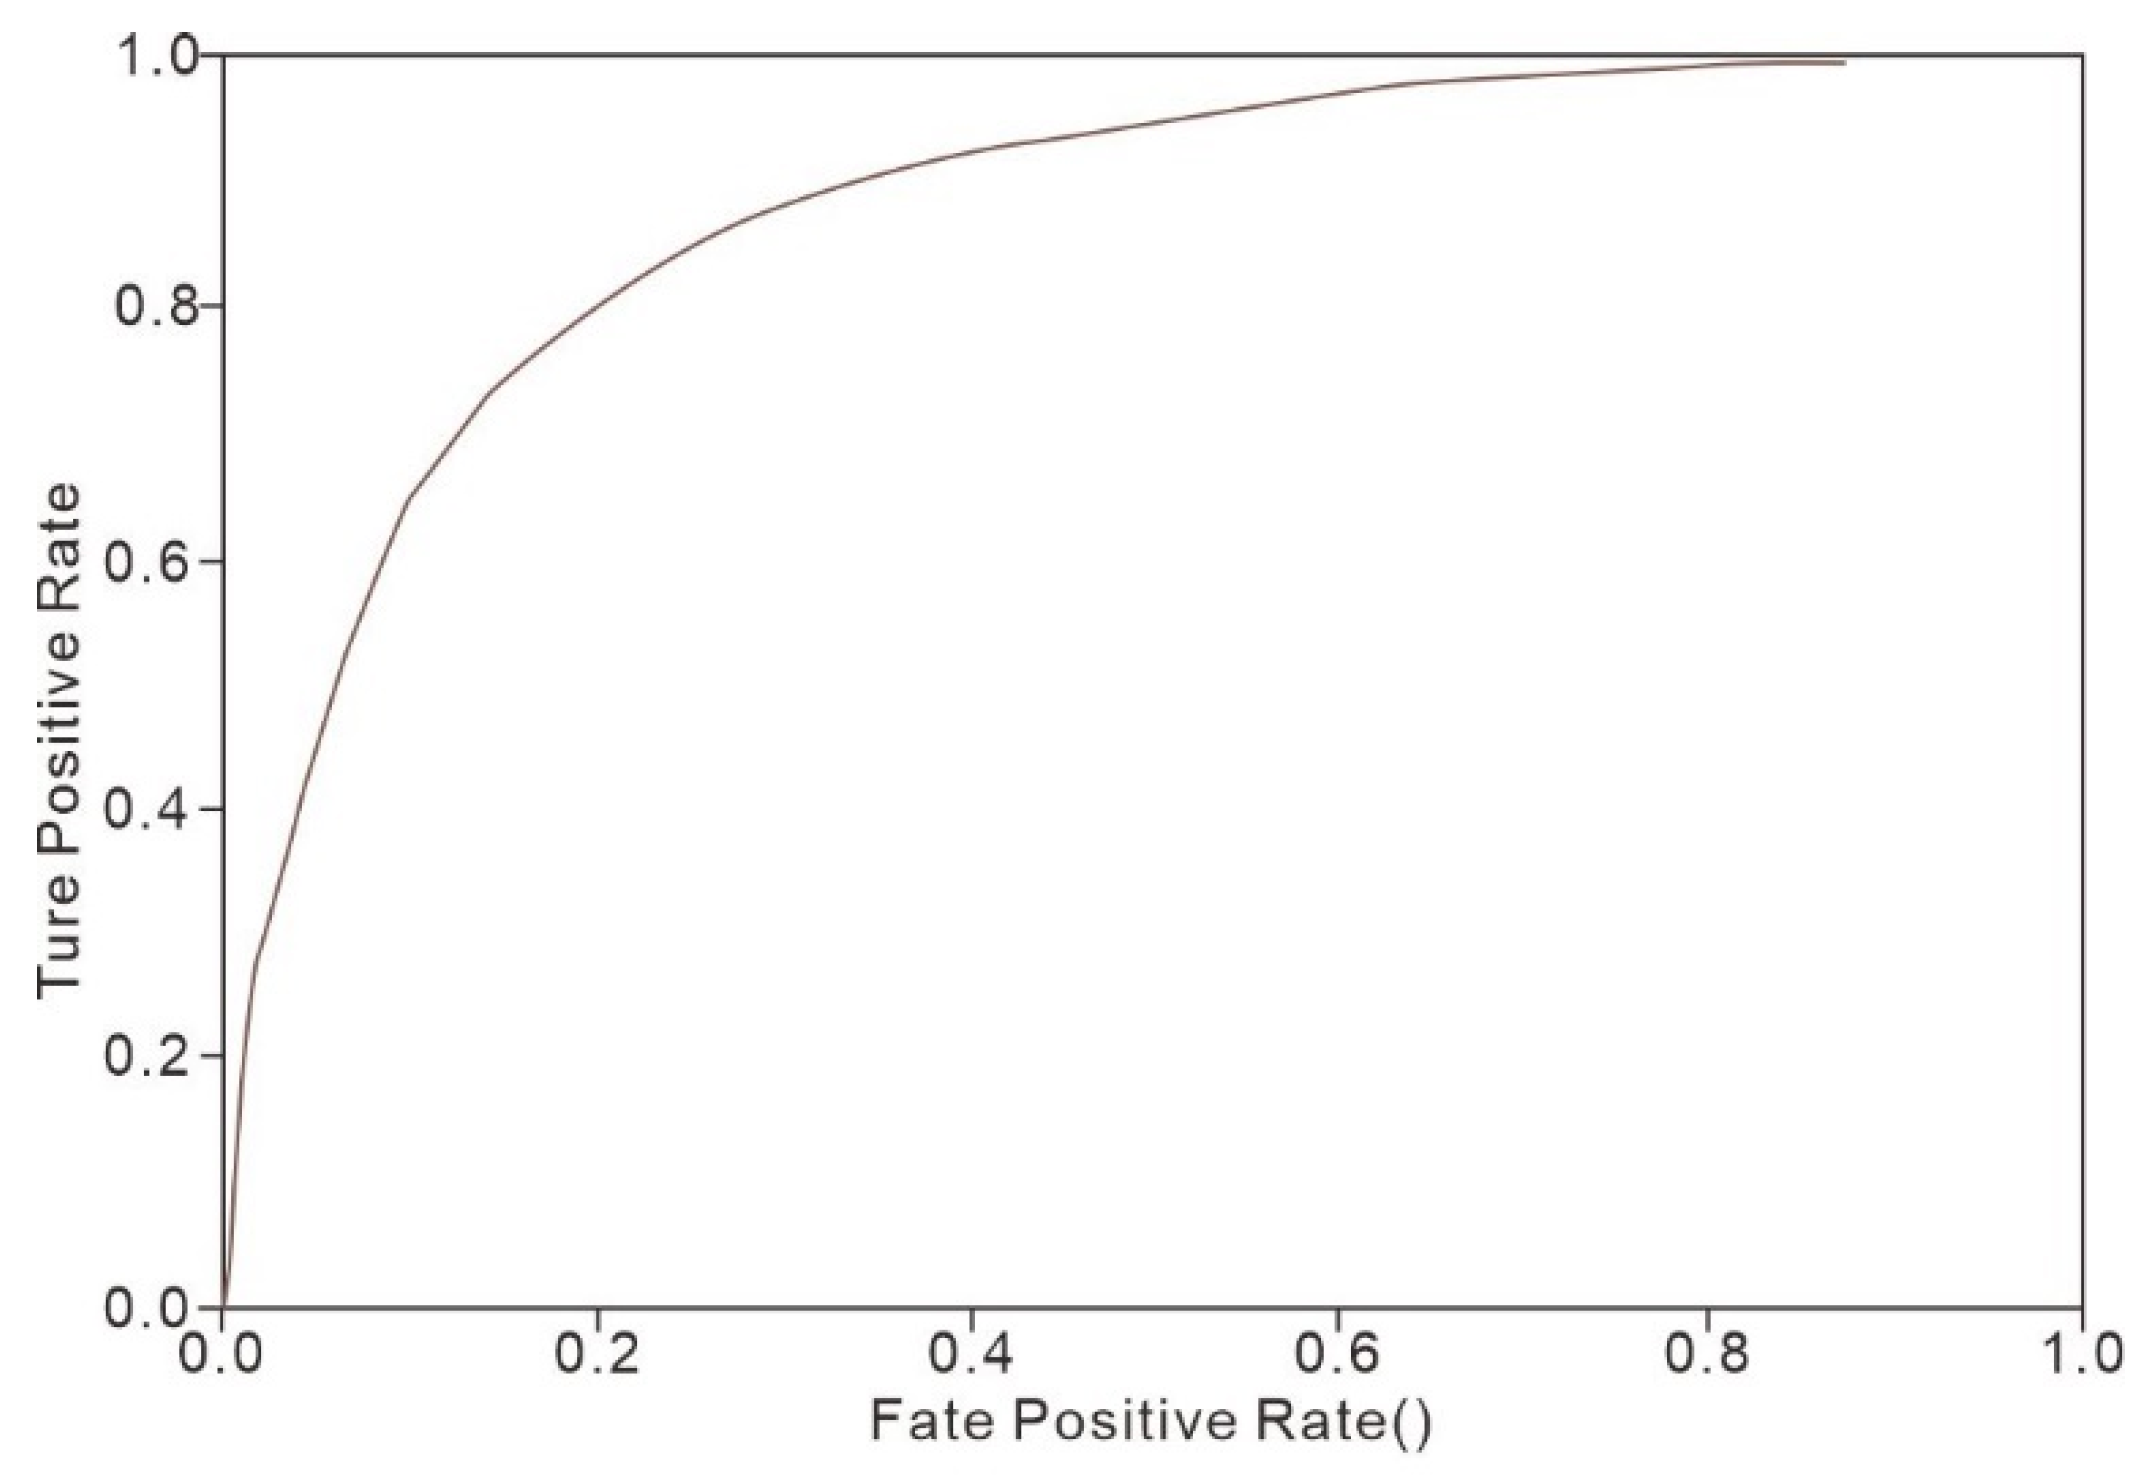
3.1.4. Model Validation Methodology

The accuracy of the IV model is validated using Receiver Operating Characteristic (ROC) curve analysis and field verification [52,53]. The model’s predictions are cross-checked against recorded geological hazard occurrences to ensure reliability.
Susceptibility scores were derived by summing the IV values of all contributing factors for each grid cell. The AUC value of 0.88 was calculated by comparing the binary presence/absence of historical hazard points with model-predicted risk scores using ROC curve analysis. The ROC curve was generated using the scikit-learn library in Python (version 3.9.13) based on 500 known hazard locations and 500 randomly selected non-hazard locations.

3.2. Data Sources

Comprehensive datasets from multiple sources were utilized to construct an accurate and reliable geological hazard risk assessment framework (Figure 5). The primary data categories, their sources, usage relevance to the susceptibility analysis, and temporal coverage are summarized in Table 1.
Table 1 has been enhanced to improve data transparency and reproducibility. A new column has been added to indicate whether each dataset was employed in the susceptibility modeling. Core variables—such as slope, lithology, NDVI, precipitation, and fault proximity—were selected based on their demonstrated statistical correlation with historical geological hazard occurrences. Other datasets, including population and PGA data, while critical for contextual analysis, were excluded from the susceptibility model due to lower spatial resolution or indirect influence. Furthermore, the temporal range of each dataset is now explicitly stated, ensuring clarity regarding data validity and representativeness.
The eight conditioning parameters used for susceptibility analysis include elevation, distance to roads, distance to faults, engineering geological rock formations, slope, distance to water systems, land use types, and vegetation types (as shown in Figure 5).

3.2.1. Geological Data

Lithology and Fault Zones: Geological maps (1:50,000 scale) were from the Ningxia Geological Survey Institute. Topographic Data: DEM (Digital Elevation Model) data were from the ASTER GDEM (30 m resolution) obtained via the China GeoCloud Platform.

3.2.2. Hydrological and Climatic Data

Rainfall Data: Meteorological records were from the Ningxia Climate Monitoring Station. Water Systems: Hydrological network maps were derived from OpenStreetMap.

3.2.3. Environmental Data

Vegetation Cover: NDVI values were extracted from Landsat-8 OLI imagery with a spatial resolution of 30 m and a temporal resolution of 2022 cloud-free composite imagery. Cloud masking and standard preprocessing were applied to remove outliers and ensure data consistency.

3.2.4. Anthropogenic Data

Land Use and Infrastructure: Spatial data on urban development, road networks, and mining activities were from the Ningxia Land Resource Monitoring Bureau. Population Density: Census data were from the Ningxia Statistics Bureau.

3.2.5. Geological Hazard Records

Historical geological hazard points and event data were from the Ningxia Geological Hazard Monitoring System.

3.3. Data Processing and Analysis

The data processing and analysis phase began with the comprehensive standardization and integration of all collected datasets, ensuring both spatial and attribute consistency across multiple sources. Geographic Information System (GIS) tools—primarily ArcGIS 10.6—were employed to handle spatial data, including geological maps, DEMs (Digital Elevation Models), NDVI layers, and rainfall distributions.
DEM data were clipped to the study boundary, reprojected to the WGS84 UTM Zone 48N coordinate system, and resampled to a uniform spatial resolution of 25 m × 25 m to ensure compatibility across layers. Using the Spatial Analyst extension, slope and aspect were derived from the DEM. NDVI values were calculated from Landsat-8 imagery using the Raster Calculator tool. Rainfall data were spatially interpolated using Inverse Distance Weighting (IDW) to generate continuous precipitation rasters.
All thematic layers—geological, hydrological, and anthropogenic—were converted to raster format and spatially aligned. Attribute normalization was applied to unify classification schemes across lithological units, vegetation indices, fault proximity, and other factors. Secondary spatial variables, such as buffer distances to roads and faults, were extracted using standard GIS operations. These preparatory steps provided a robust foundation for seamless integration into the information value (IV) model framework, ensuring accurate susceptibility mapping and minimizing data anomalies or spatial misalignments.
The core analytical phase involved calculating the contribution of each influencing factor to geological hazard occurrences using the IV model, implemented in Python for computational efficiency. Each factor was categorized into discrete intervals (e.g., slope ranges, NDVI classes), and the information value (IV) was computed for every interval. Python scripts automated these calculations across the study area, enabling the processing of large datasets with minimal error and ensuring reproducibility. The resulting IV values were re-integrated into GIS to generate spatially explicit hazard susceptibility layers for each factor. These layers were then summed to derive cumulative risk scores, classified into four distinct risk levels: very low, low, moderate, and high. The risk maps were validated against historical hazard occurrence data using Receiver Operating Characteristic (ROC) curve analysis, achieving a high Area Under the Curve (AUC) score of 0.88 [54,55]. AUC values were calculated individually for each factor based on their predictive performance using ROC curve analysis against observed hazard locations. Cross-validation with field data further confirmed the model’s predictive accuracy (Table 2). This comprehensive process captured the complex interplay between natural and anthropogenic factors and provided actionable insights for targeted risk mitigation and urban planning in Dawukou District. The overall workflow of the susceptibility modeling and risk zoning process follows a sequential procedure: data preparation → factor standardization → information value (IV) calculation → cumulative scoring → risk classification → ROC-based model validation. This clear and repeatable process ensures replicability and transparency, supporting the reproducibility of the analysis for similar studies.

4. Results

4.1. Susceptibility Evaluation

The susceptibility to geological hazards in Dawukou District was evaluated using the information value (IV) model, which quantitatively analyzed the relationships between hazard occurrences and influencing factors. The analysis identified five key factors contributing to hazard susceptibility: slope gradient, lithology, fault proximity, vegetation index (NDVI), and precipitation. Each factor was assessed to determine its relative influence on hazard development, enabling a comprehensive understanding of geological hazard susceptibility across the study area.

4.1.1. Influence of Key Factors

Slope Gradient: Slope gradient emerged as the most critical factor influencing geological hazard susceptibility. Areas with slopes exceeding 15° were found to have the highest susceptibility due to the combined effects of gravitational force and surface runoff. Steep slopes promote mass movement, including landslides and debris flows, particularly during intense rainfall. A significant concentration of hazards was observed on slopes ranging between 10° and 20°, which accounted for a substantial portion of the high-susceptibility zones. These gradients create conditions conducive to soil erosion and water accumulation, further destabilizing slopes.
Lithology: The region’s geological composition was vital in determining susceptibility. Weakly cemented rocks, such as mudstones and shales, exhibited the highest IV values due to their low mechanical strength and susceptibility to weathering. Additionally, heavily fractured zones, particularly near fault lines, contributed significantly to instability. Stronger lithological units, such as sandstone and limestone, demonstrated lower susceptibility but were not immune to hazards in steep topography or high rainfall areas.
Fault Proximity: Proximity to major fault lines strongly predicted hazard susceptibility. Areas within 500 m of active fault zones exhibited significantly higher susceptibility, as fault zones act as structural weaknesses facilitating slope failure. These areas are also subject to frequent tectonic activity, including seismic events, which can trigger landslides and other geological hazards. The Helan Mountain fault system was particularly influential, with elevated hazard susceptibility observed along its vicinity.
Vegetation Index (NDVI): The normalized difference vegetation index (NDVI) was used to assess vegetation cover, influencing soil stability and erosion resistance. Areas with low vegetation cover correlated strongly with high hazard susceptibility, as limited root systems fail to stabilize the soil and slopes. In contrast, regions with dense vegetation demonstrated lower susceptibility due to the protective effects of plant cover, which reduces surface runoff and binds soil particles.
Precipitation: Intense, localized rainfall events were identified as critical triggering factors for geological hazards. Regions receiving higher precipitation exhibited elevated susceptibility, particularly on steep slopes and areas with weak lithology. Precipitation contributes to slope saturation, increasing pore water pressure and reducing shear strength, which can lead to landslides and debris flows (Table 3).

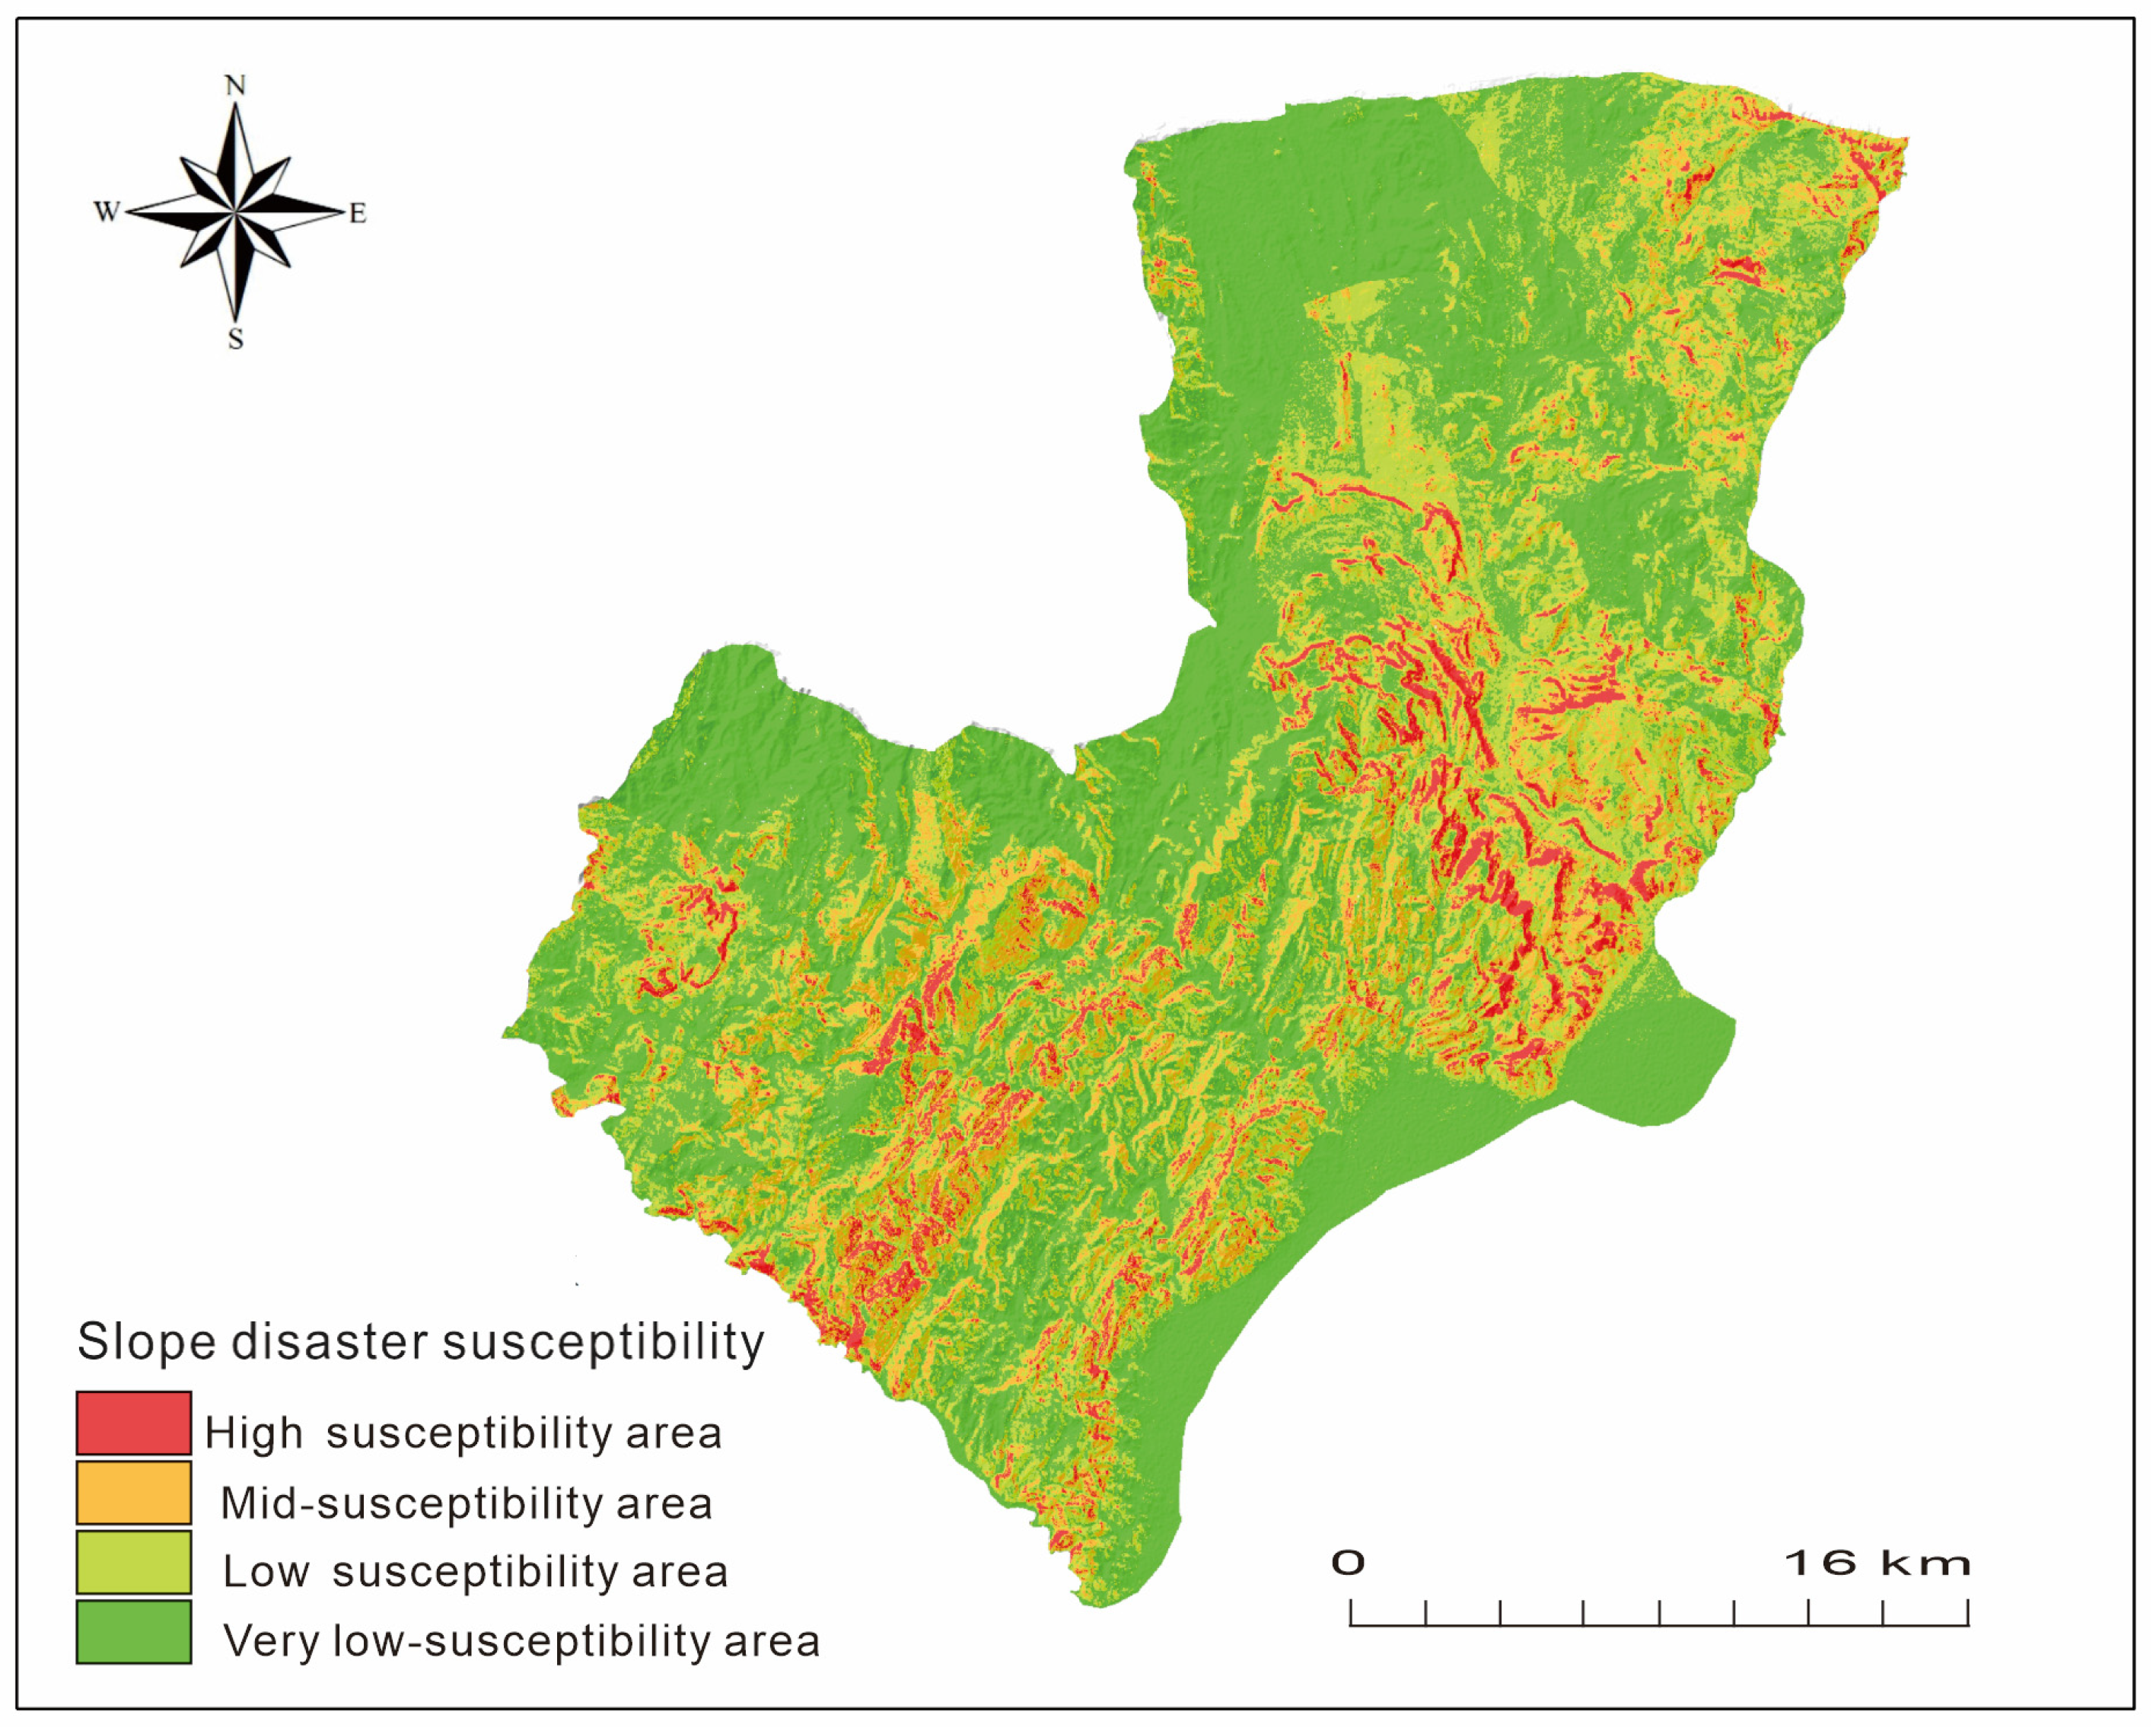
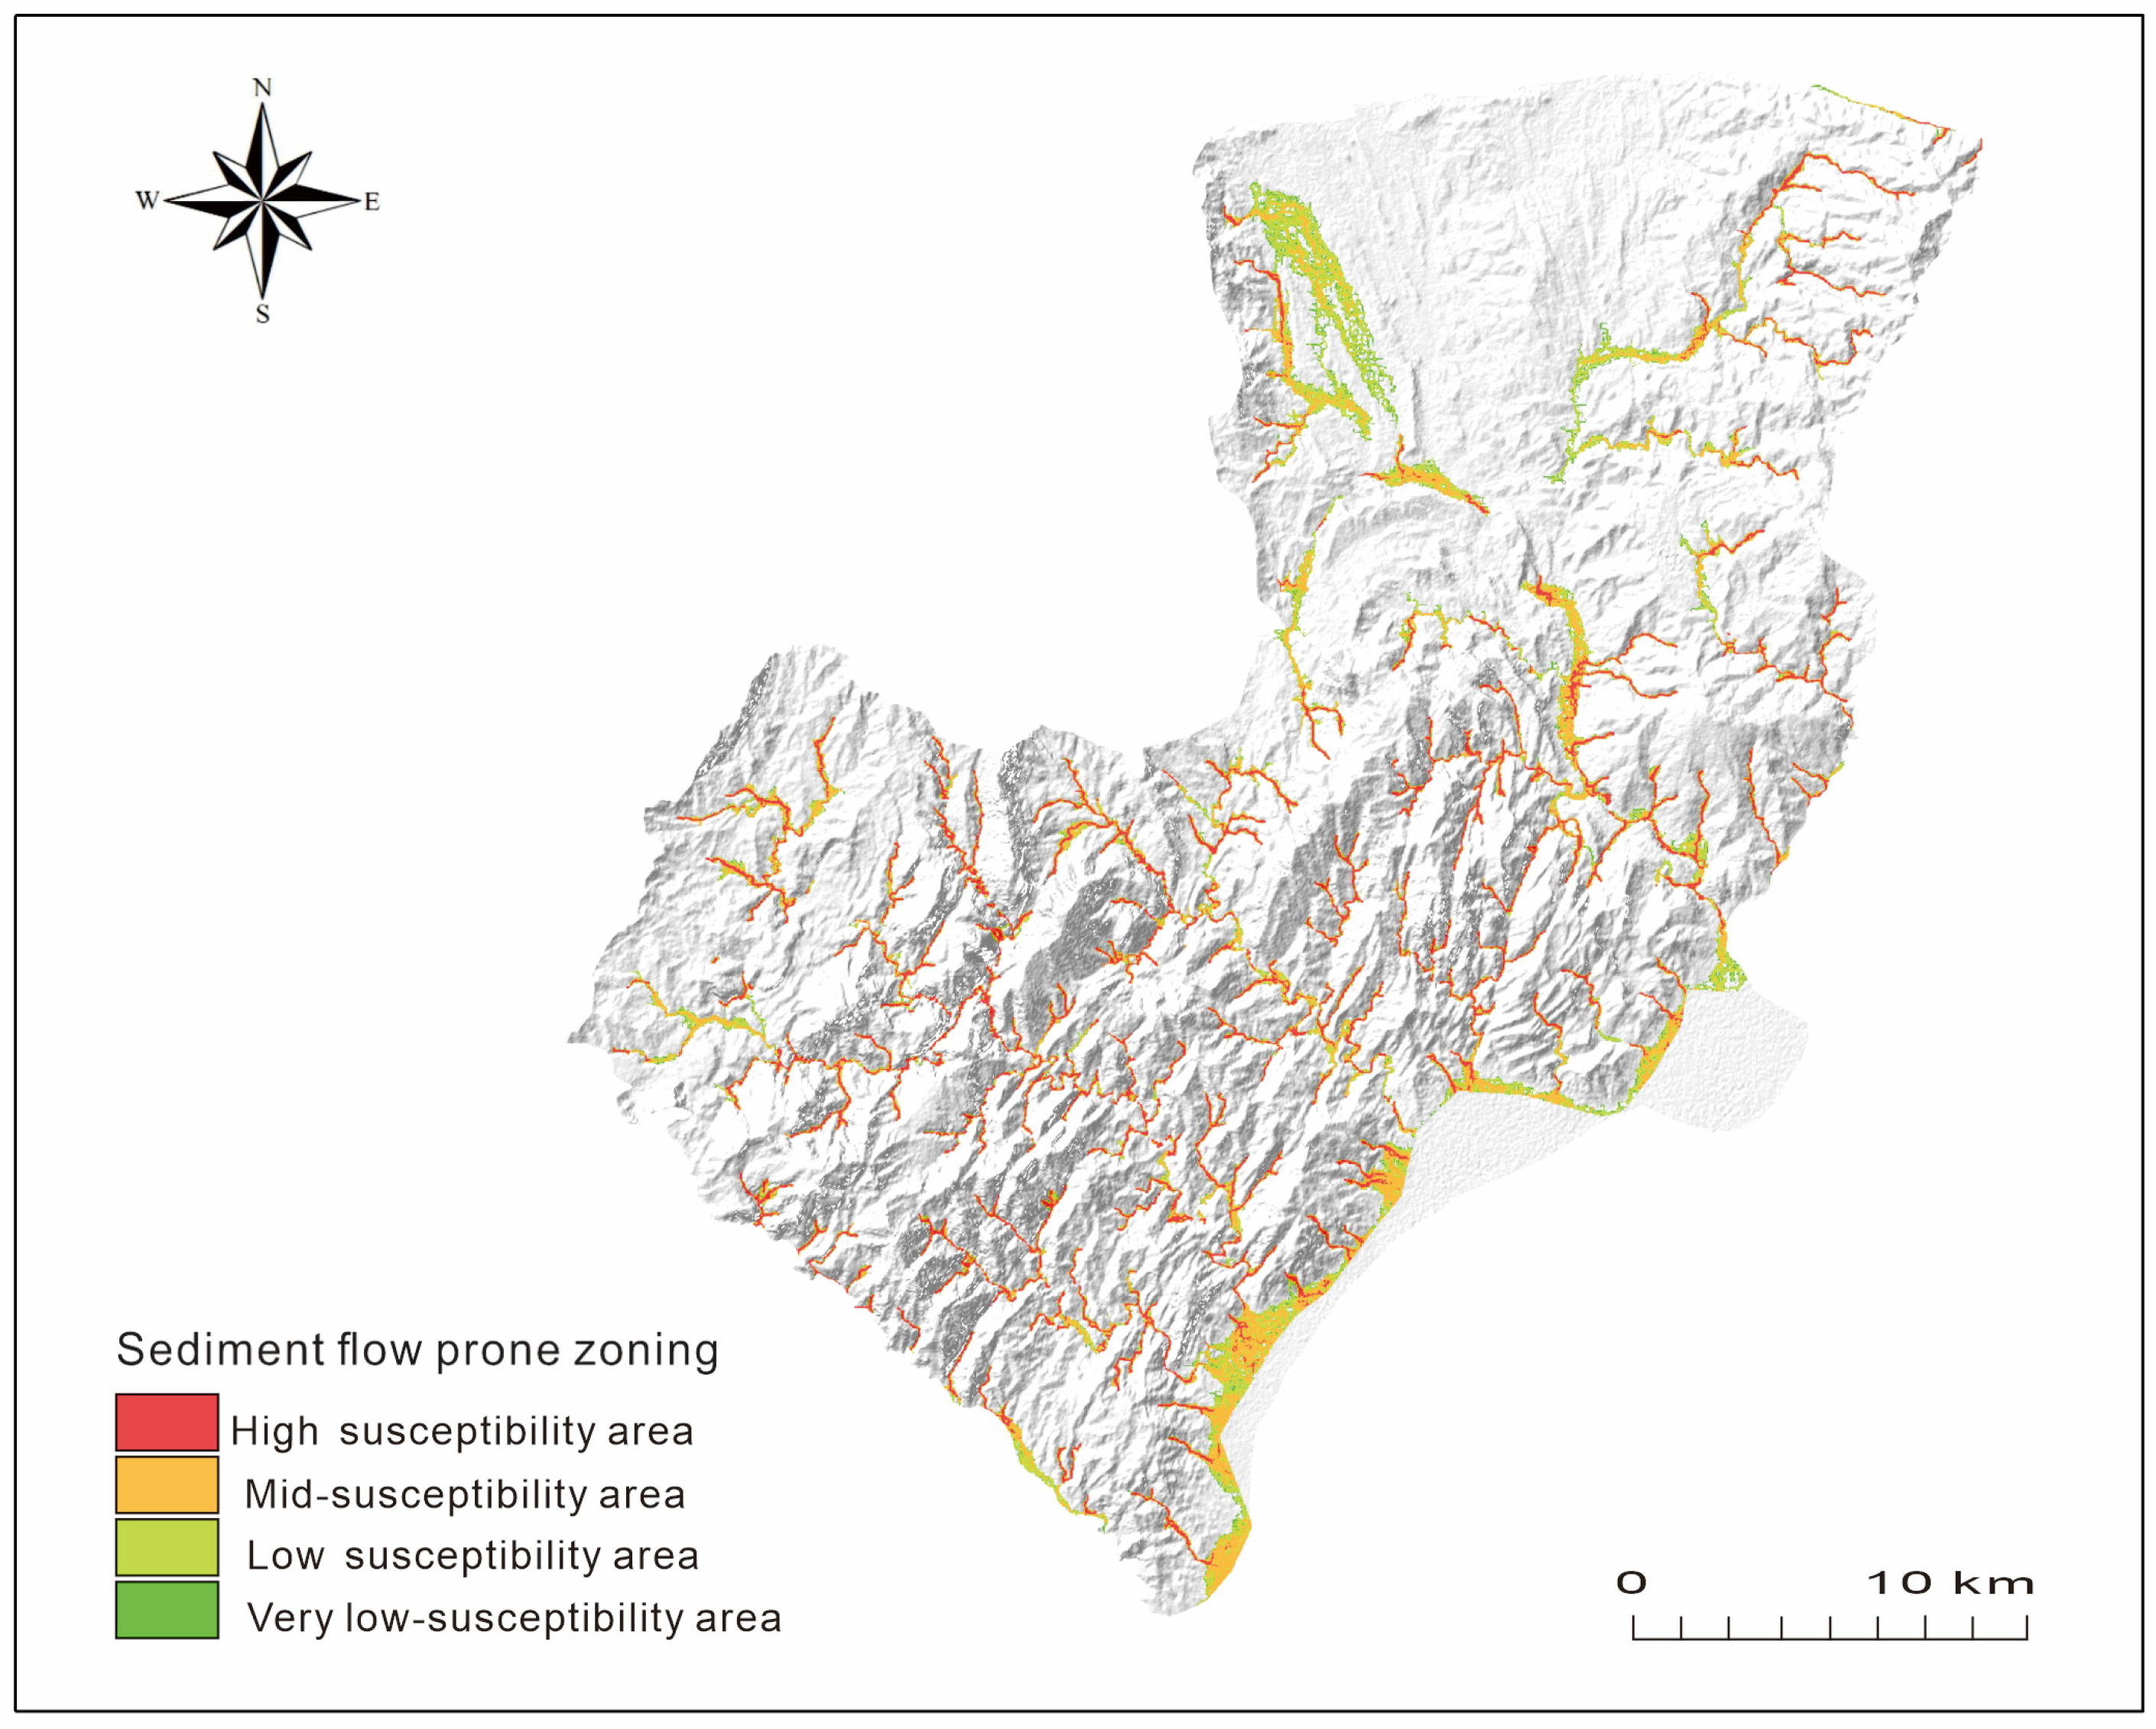
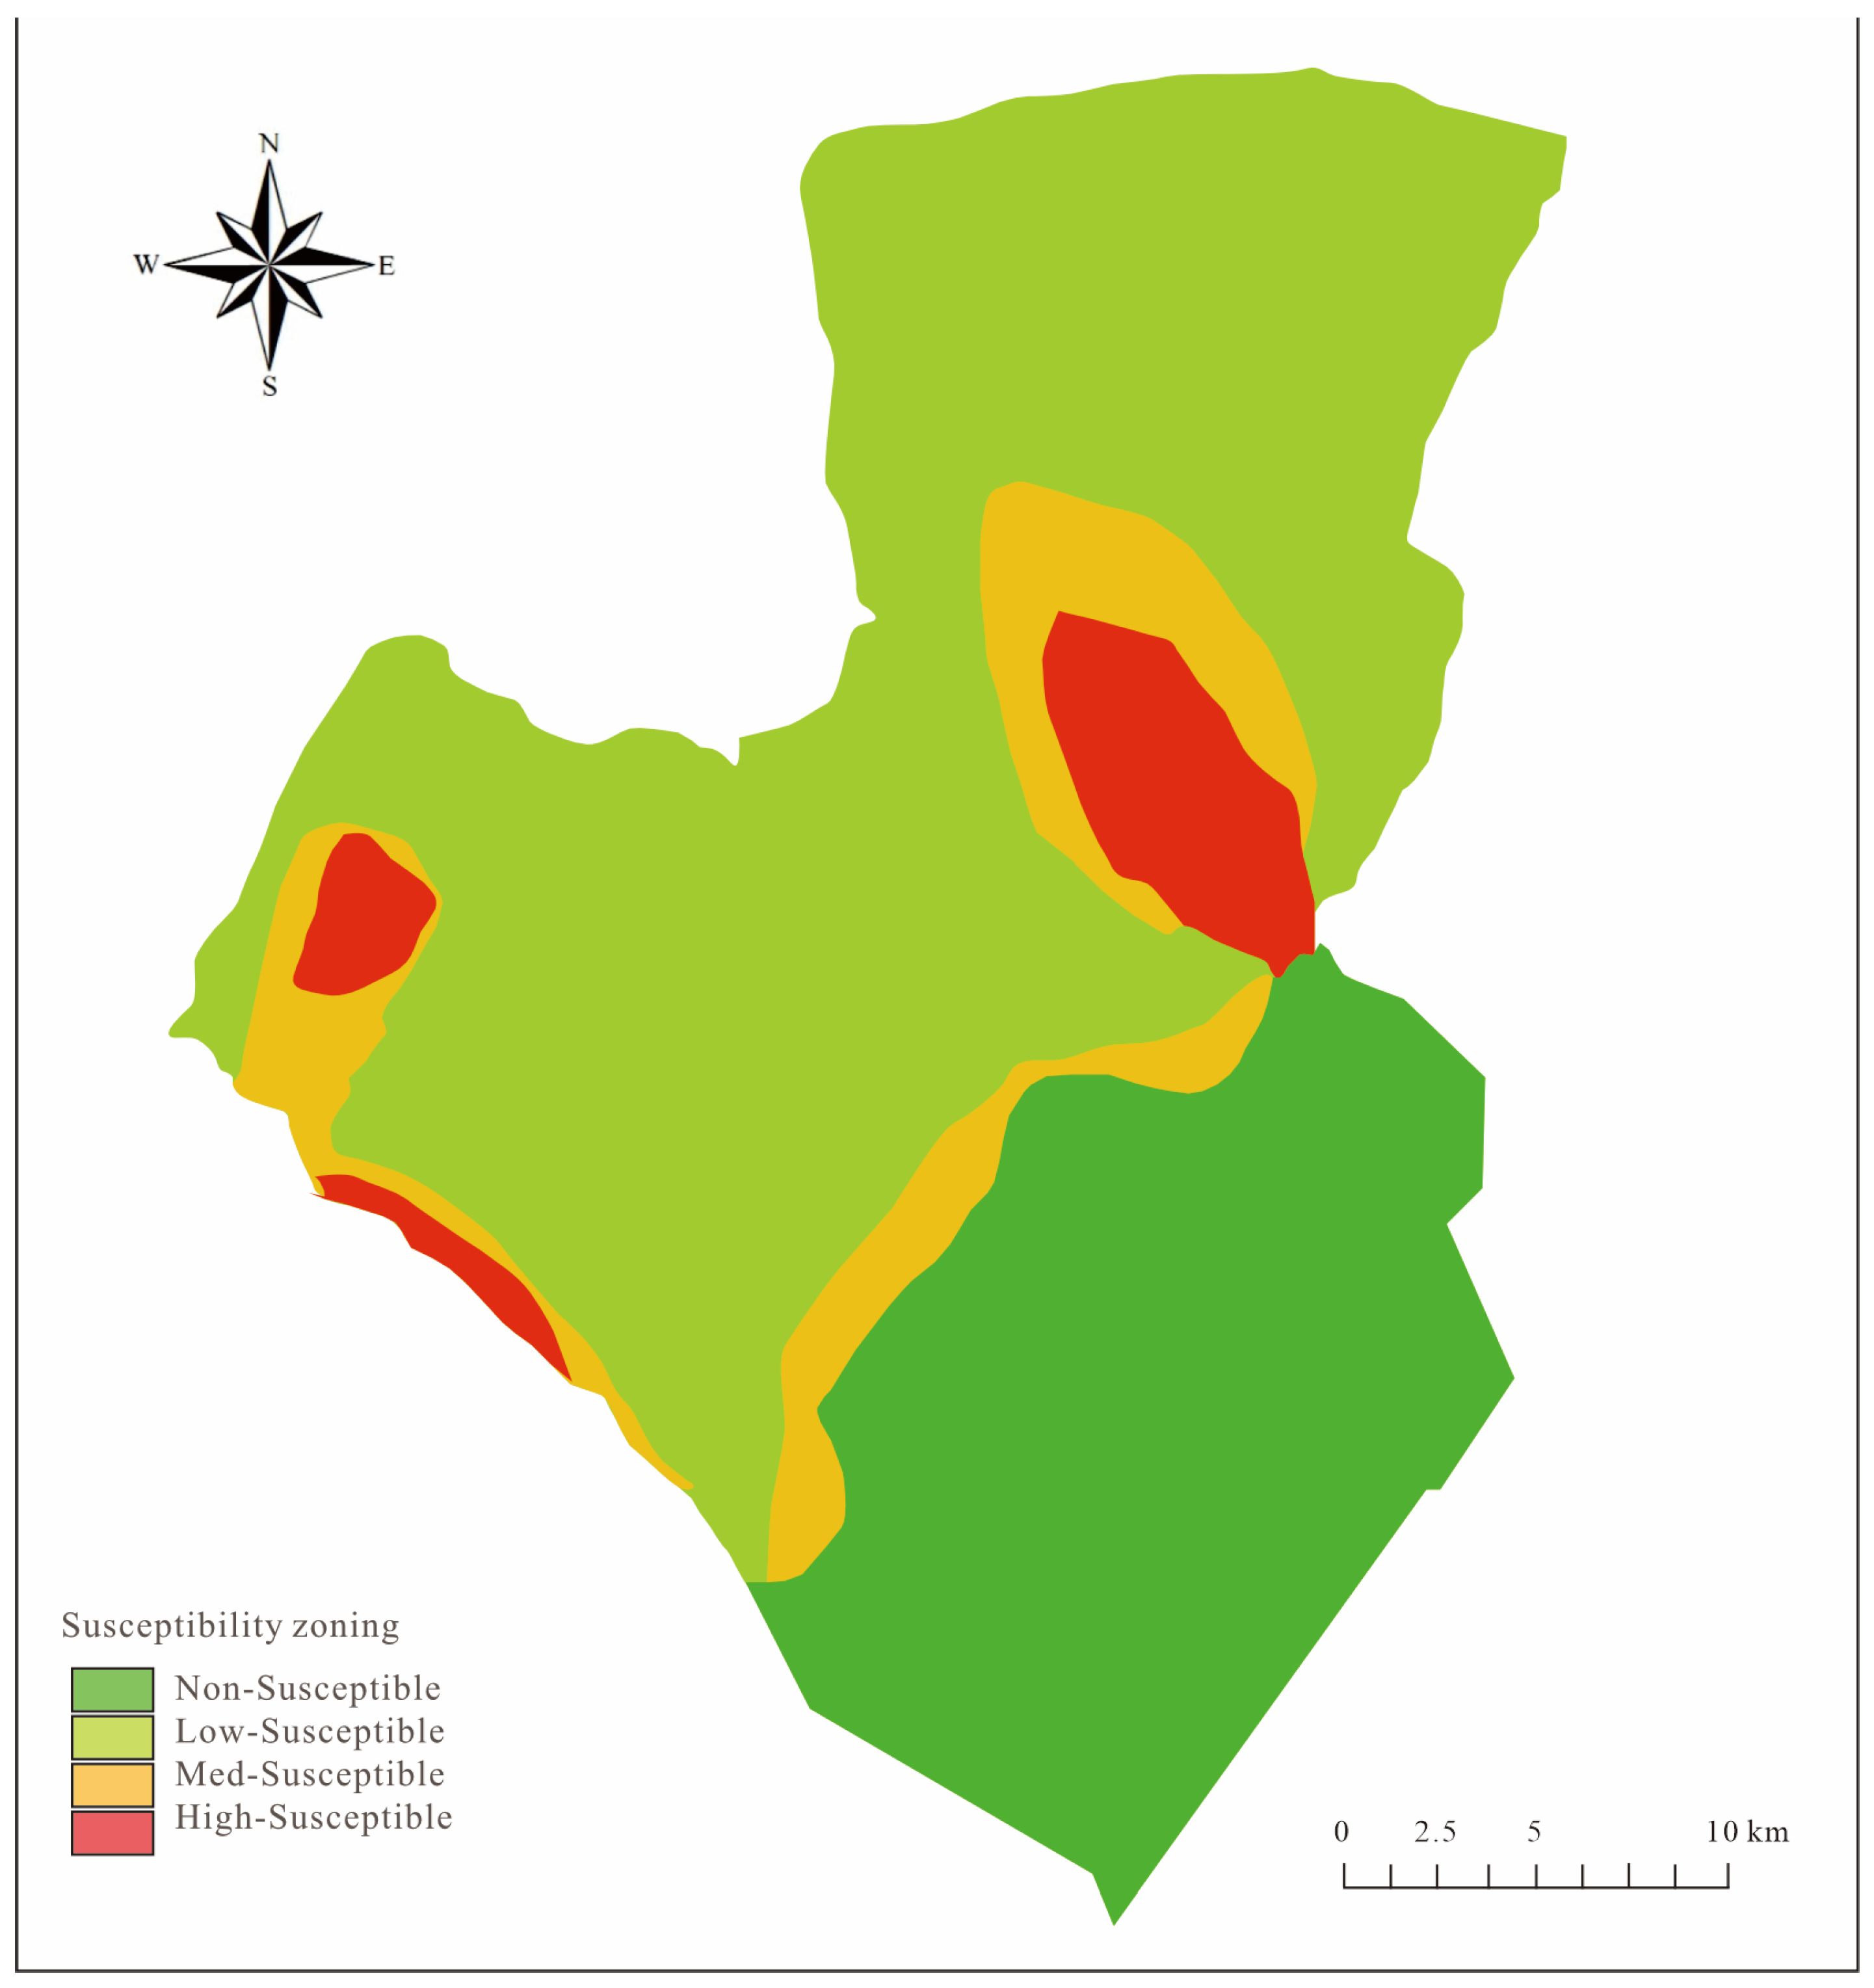
4.1.2. Susceptibility Map

Table 3 provides further quantitative insights into the sensitivity, positive and negative weights, and relative contribution of each influencing factor across different classification ranges, complementing the spatial susceptibility maps presented in this section.
This paper selects the all-index evaluation model as the vulnerability evaluation model, and the evaluation index weight layers are superimposed. The vulnerability evaluation model and index weights were selected based on expert judgment and prior literature [50], taking into account geological and socio-environmental relevance to Dawukou District. A grid of susceptibility weights is formed, and the susceptibility evidence weight index (Si) ranges from 15.0043 to 10.4401 (Figure 6).
Figure 6 presents the cumulative IV index derived from all factors, offering a generalized susceptibility perspective. Superimpose the results of slope disaster susceptibility (Figure 7) and debris flow disaster susceptibility (Figure 8) and then evaluate and grade the vulnerability index layer. When evaluating and grading, the spatial distribution probability of geological disasters, that is, the ratio of the disaster area to the graded area, is mainly considered. The evaluation of geological disaster susceptibility in Dawukou District is shown in Figure 9. These thematic layers provide valuable insights into hazard mechanisms and spatial differentiation within the study area.

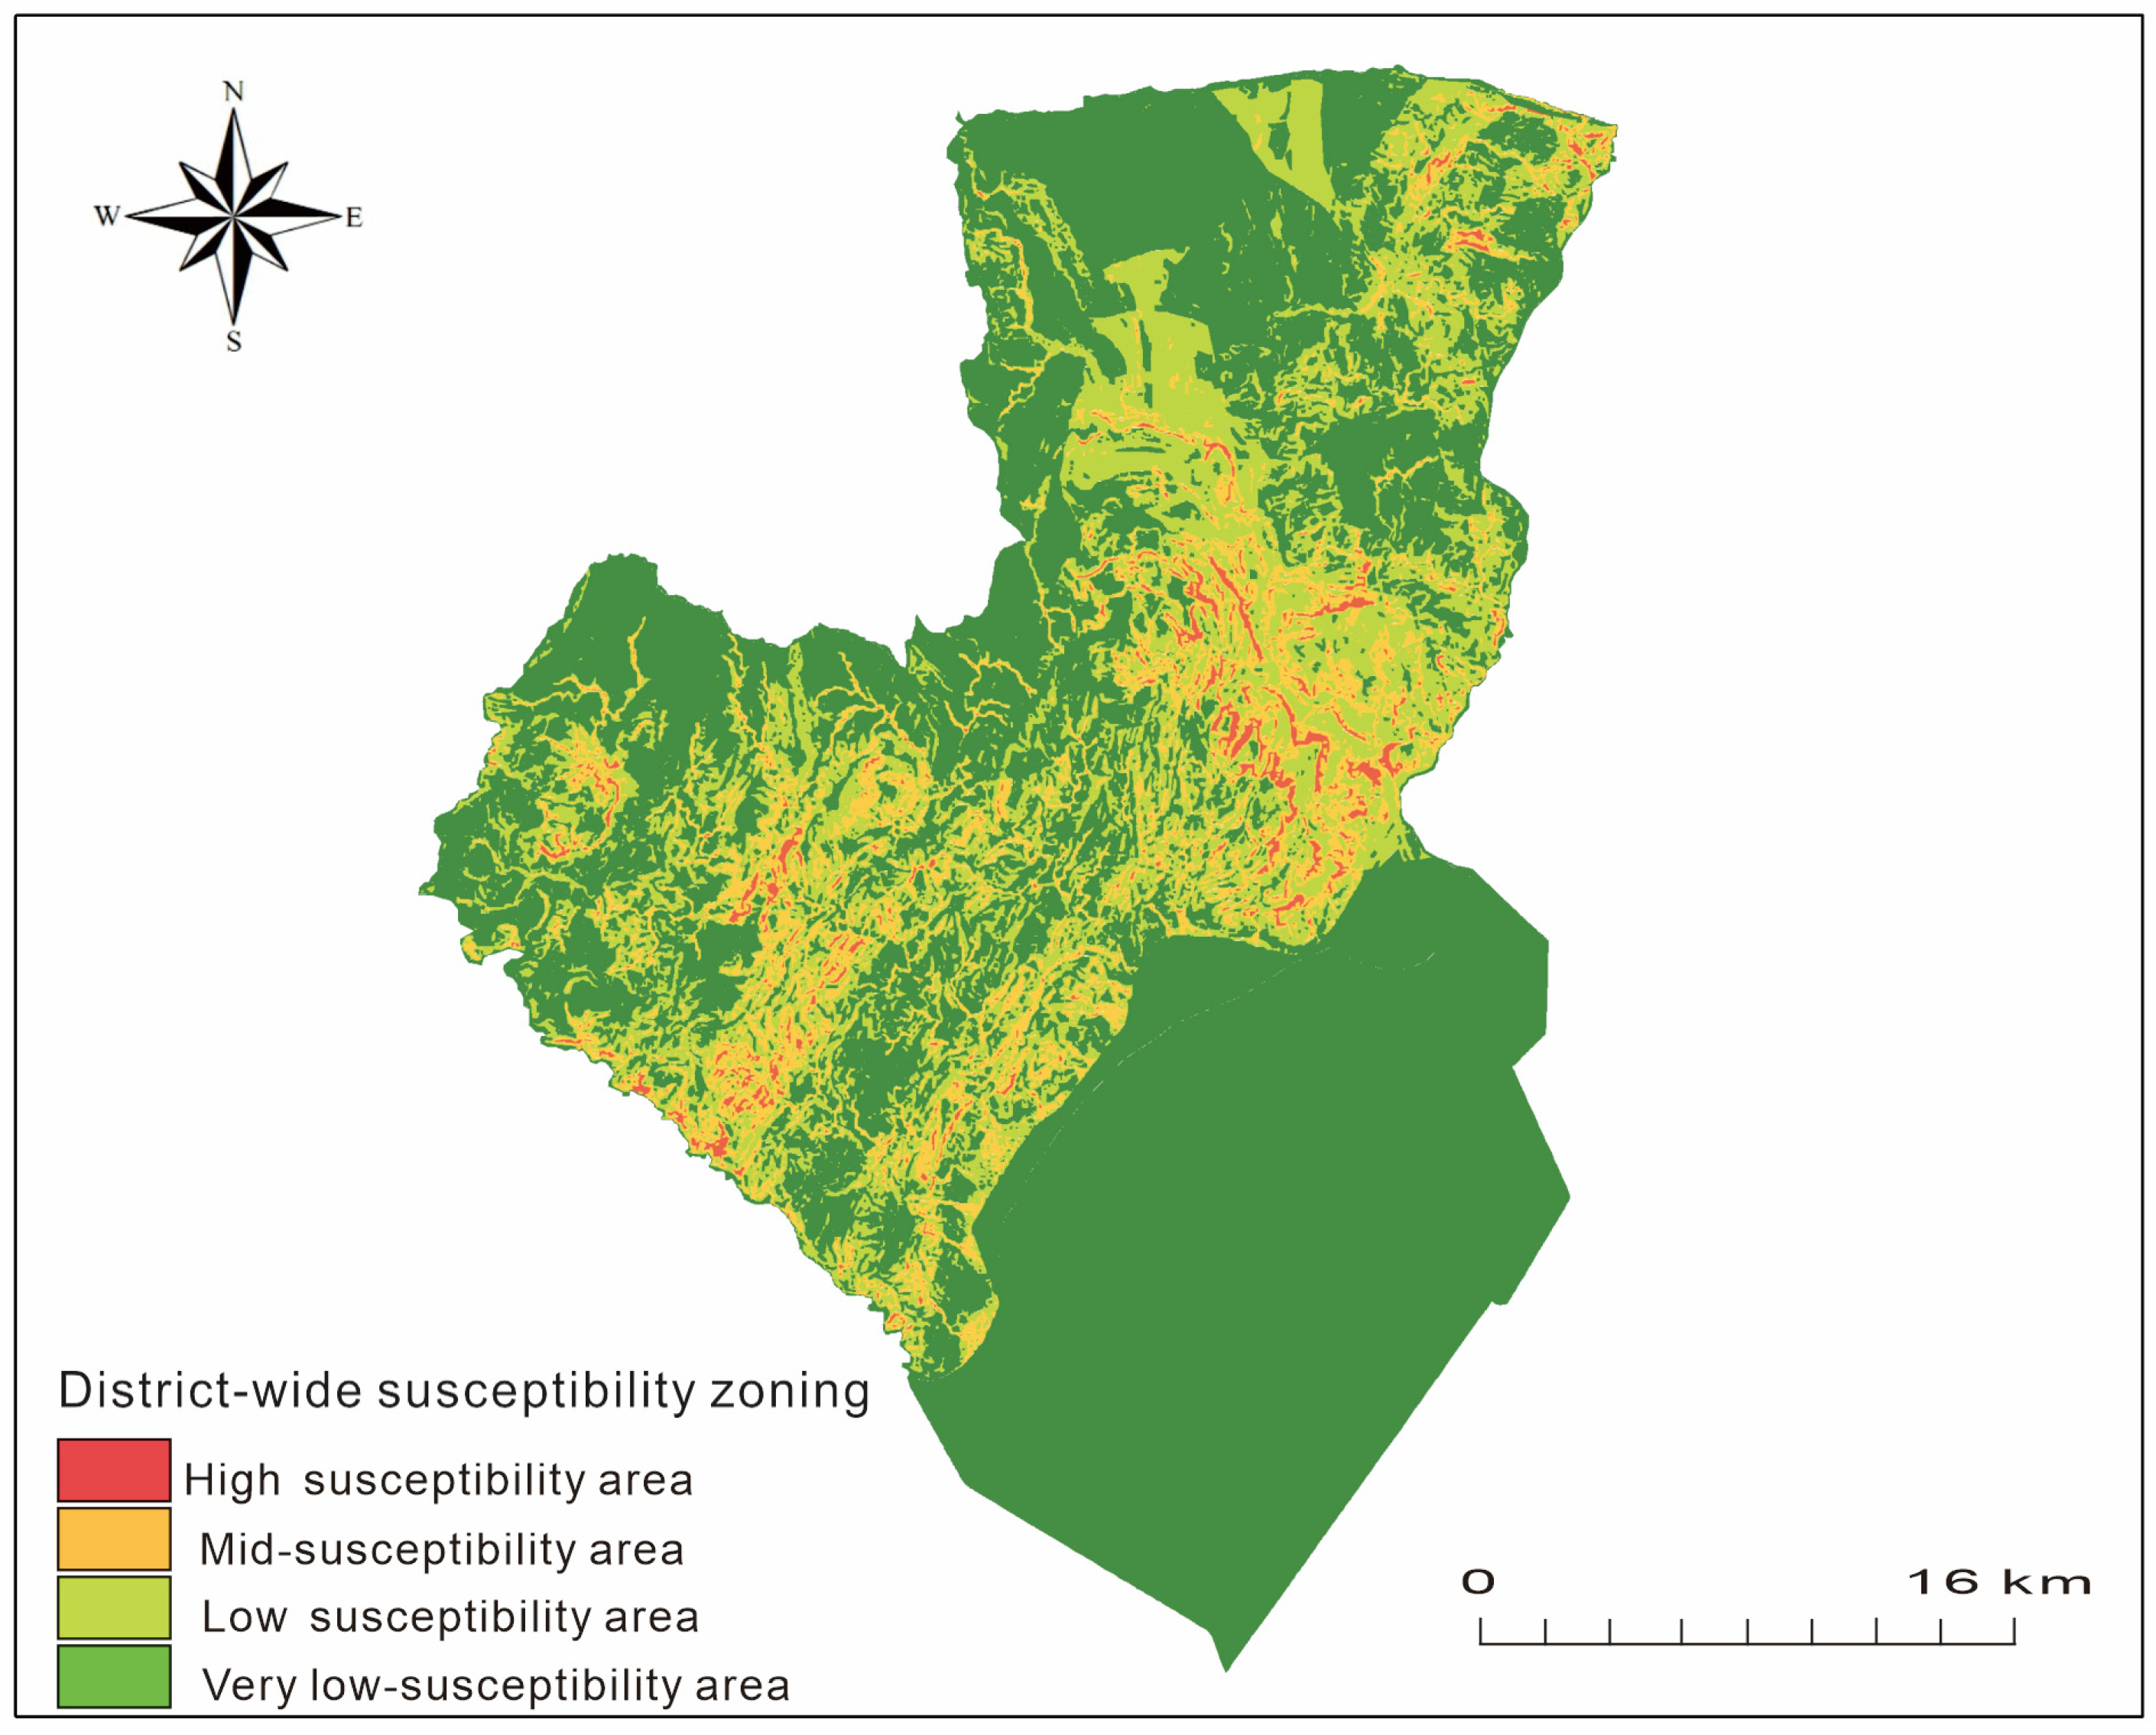
4.2. Risk Zone Mapping

Building on the thematic susceptibility maps, Figure 10 presents an integrated hazard zoning map that combines the outputs of debris flow and slope susceptibility analyses. The overlaid classification enables a comprehensive understanding of hazard-prone areas across Dawukou District, facilitating prioritized intervention and spatial risk mitigation. Building on the susceptibility evaluation, a comprehensive risk assessment was conducted by integrating additional factors such as hazard frequency, vulnerability, and anthropogenic influences. The study area was categorized into four risk zones: high-, moderate-, low-, and very-low-risk zones (Figure 10, Table 4).
  • High-Risk Zone (1.55% of the area):
These zones were primarily located in mining-intensive regions and areas with steep slopes near fault lines. These conditions increase the likelihood of frequent landslides, debris flows, and slope collapses. Infrastructure and human settlements within these zones face severe threats. Immediate mitigation measures, including slope stabilization and real-time monitoring systems, are recommended for these areas.
  • Moderate-Risk Zone (10.16% of the area):
Moderate-risk zones were found along the foothills of the Helan Mountains and in regions with active fault systems, steep gradients, and low vegetation cover. These areas are vulnerable to recurring hazards, particularly during heavy rainfall events. Enhanced disaster preparedness and land use planning are critical for these zones to minimize impacts on local communities.
  • Low-Risk Zone (23.32% of the area):
Low-risk zones were distributed across hilly areas with moderate slopes and vegetation cover. These zones are less hazardous but require monitoring, especially during extreme weather events. Land use activities should be regulated to prevent risk escalation in these regions.
  • Very-Low-Risk Zone (64.97% of the area):
Very-low-risk zones were predominantly distributed across flat plains and geologically stable areas, where geological hazards are least likely to occur based on current susceptibility modeling. However, these zones should not be construed as entirely risk free. The classification reflects minimal hazard probability under present conditions, but the residual risk from factors, such as localized subsurface weaknesses or unexpected hydrological or climatic events, cannot be entirely ruled out. Accordingly, while these zones may be appropriate for infrastructure development and urban expansion, such activities should still be accompanied by precautionary geological assessments and long-term monitoring strategies to ensure safety and resilience.

4.3. Validation

The accuracy of the susceptibility and risk maps was validated using historical hazard occurrence data and Receiver Operating Characteristic (ROC) curve analysis. The Area Under the Curve (AUC) value of 0.88 indicated a high level of predictive accuracy, confirming the reliability of the IV model and the effectiveness of the risk zone mapping (Figure 11). Additionally, cross-validation with field data and geological survey records reinforced the consistency of the findings.
In addition, cross-validation was performed using field investigation data and geological survey records provided by the Ningxia Geological Hazard Monitoring System, which further confirmed the consistency and reliability of the susceptibility and risk maps.

5. Discussion

5.1. Effectiveness and Applicability of the Information Value Model

The information value (IV) model has proven to be a reliable and efficient tool for assessing geological hazard risks in Dawukou District. Its ability to quantitatively analyze the relationships between influencing factors and hazard occurrences facilitates a systematic evaluation of susceptibility patterns and risk zones. This study incorporated key influencing factors such as slope gradient, lithology, fault proximity, vegetation cover (NDVI), and precipitation into the IV model. The model’s performance, validated through Receiver Operating Characteristic (ROC) curve analysis, achieved an Area Under the Curve (AUC) score of 0.88, indicating high predictive accuracy and confirming the model’s reliability for complex geological settings [56,57,58].
The adaptability of the IV model lies in its capacity to integrate diverse datasets across geological, environmental, and anthropogenic domains [59,60]. Its results aligned closely with field observations and historical hazard records, particularly in high-risk zones characterized by steep slopes, weak lithology, and proximity to active fault systems. These findings validate the model’s robustness and suitability for hazard assessments in regions with similar geological challenges. However, the model’s reliance on static datasets, such as geological maps and historical precipitation records, presents limitations in capturing temporal dynamics, including changes in land use, vegetation cover, and climatic variability. These factors are critical in regions like Dawukou, where mining activities and urban expansion continuously reshape the landscape.
Incorporating real-time datasets and predictive tools, such as satellite-based land cover analysis and climate forecasting models, could significantly enhance the IV model’s application. For instance, temporal datasets on vegetation health and precipitation patterns could better account for dynamic factors driving hazard development. Moreover, advanced geospatial technologies, such as LiDAR, could improve topographic and structural data resolution, enabling more detailed hazard assessments [61,62]. By addressing these limitations, the IV model could provide even greater accuracy and applicability in evolving environmental contexts.
Additionally, the study emphasized the role of dynamic factors, such as the NDVI and precipitation, in influencing hazard susceptibility. Sparse vegetation increases slope instability due to reduced soil cohesion, while intense localized rainfall events act as immediate triggers for hazards like landslides and debris flows [63,64]. These findings highlight the critical need to integrate geological, environmental, and climatic variables for a holistic understanding of hazard dynamics. Such integration improves the model’s predictive capability and enhances its value for decision-making in disaster prevention and urban planning.
It is also essential to acknowledge the limitations of the IV model in expressing absolute risk levels. The model assigns low or even negative information values to specific factor combinations, which may result in some grid units being classified as “very low risk” or seemingly “risk-free.” However, from an engineering and disaster prevention perspective, such zones should not be interpreted as entirely immune to hazards. Unpredictable variables—such as unmonitored micro-faults, localized rainfall anomalies, or future land use changes—can introduce risks that fall outside the model’s current parameterization. Therefore, while IV-based classification is statistically grounded, a residual risk management mindset remains critical in planning and decision-making processes.
Compared to other commonly used models—such as frequency ratio, logistic regression, and machine learning techniques—the information value (IV) model provides a transparent and computationally efficient approach that does not require complex training datasets. Prior studies have shown that while models like Random Forest may yield slightly higher accuracy, IV models are more interpretable and better suited to data-scarce environments. The AUC value of 0.88 achieved in this study demonstrates that IV-based susceptibility mapping can provide reliable results even in geologically complex regions.

5.2. Implications for Risk Management and Mitigation

The results of the risk zone mapping provide a clear framework for prioritizing disaster prevention, mitigation, and urban planning efforts in Dawukou District. High-risk zones, predominantly near mining areas, fault systems, and steep slopes, substantially threaten human lives, infrastructure, and ecosystems. Effective mitigation in these areas requires targeted strategies that address both natural and anthropogenic drivers of hazard risk. Critical interventions include slope engineering, such as constructing retaining walls, installing drainage systems, and regrading unstable slopes to enhance terrain stability and manage water infiltration. In addition, vegetation restoration, including reforestation and soil bioengineering, can stabilize slopes, reduce surface runoff, and improve soil cohesion. Real-time monitoring systems, such as rainfall sensors, inclinometers, and satellite-based tools, are essential for high-risk zones, providing early warnings to minimize disaster impacts [65,66].
Moderate-risk zones, often transitional between high-risk and low-risk zones, demand ongoing monitoring and regulation. These zones are influenced by both natural and human factors, making them susceptible to hazards during extreme weather events. Land use policies should encourage sustainable practices in these areas to avoid escalating risks. Meanwhile, low-risk zones present opportunities for urban expansion and infrastructure development, provided natural terrain stability is preserved [67,68,69]. Strategic planning in these areas can help alleviate development pressure in high-risk zones while ensuring safety and sustainability.
Integrating geological hazard assessments into urban planning and resource management processes is essential for building resilience [70,71]. Strategic zoning regulations, informed by susceptibility and risk maps, can guide development away from hazardous areas while hazard-resilient infrastructure designs minimize vulnerabilities. Community-based preparedness initiatives, such as public awareness campaigns and training programs, enhance local capacity to manage risks effectively. Empowering communities through knowledge and tools fosters resilience and reduces disaster impacts, particularly in high-risk regions. This comprehensive approach ensures a balanced allocation of resources and a proactive strategy for disaster mitigation and sustainable development in Dawukou District.

5.3. Challenges, Limitations, and Future Directions

Despite its strengths, this study faced challenges and limitations that highlight areas for future improvement. The accuracy of susceptibility and risk maps depends heavily on the quality and resolution of input datasets. For example, higher-resolution DEMs, updated geological maps, and finer-scale precipitation data could provide a more precise understanding of hazard dynamics [72,73,74]. Incorporating such datasets would allow for more detailed mapping and better differentiation of risk levels across more minor spatial scales.
A key limitation of the study is its reliance on historical climatic data, which may not fully account for future climate variability or extreme weather patterns. As global climate change accelerates, the frequency and intensity of extreme weather events are expected to increase, potentially altering hazard dynamics in unpredictable ways. To address this, future assessments should incorporate real-time climatic datasets and predictive climate models to anticipate better how changing conditions might influence geological hazards [25,75].
Anthropogenic activities, such as rapid urbanization, infrastructure development, and mining operations, are dynamic factors that significantly impact hazard susceptibility. These activities can destabilize slopes, alter hydrological systems, and reduce vegetation cover, creating new risks. Future assessments should integrate land use change models and continuous monitoring systems to account for these evolving influences. Advanced techniques, such as machine learning and artificial intelligence, offer promising avenues for refining hazard prediction models [56,76]. These approaches can analyze large and complex datasets to identify patterns and relationships that might be missed by traditional methods, improving the accuracy and scalability of assessments.
Community engagement is another critical area for improvement. While this study focused on technical assessments, involving local populations in hazard monitoring and mitigation efforts could complement these findings. Participatory approaches, such as citizen science initiatives and localized hazard mapping, can provide valuable insights into community-specific vulnerabilities and foster a sense of ownership over disaster risk reduction initiatives [77,78]. Engaging communities in preparedness efforts also enhances their resilience, reducing the overall impact of hazards.
The broader applicability of this study’s methodology extends beyond Dawukou District. The IV model and its integration with diverse datasets provide a replicable framework for geological hazard risk assessment in other regions with similar geological and environmental conditions. By combining quantitative modeling with dynamic ecological factors and rigorous validation techniques, this approach offers a comprehensive perspective for disaster management, urban planning, and sustainable development. The findings from Dawukou District can inform similar assessments in regions facing comparable challenges, contributing to a global understanding of geological hazard risks and mitigation strategies [79,80].

6. Conclusions

(1)
Slope gradient, lithology, fault proximity, vegetation index (NDVI), and precipitation were identified as the primary factors influencing geological hazard susceptibility, with steep slopes and weak lithology being the most significant contributors.
(2)
The study delineated four risk levels (high, moderate, low, and very low). The high-risk zones were concentrated near mining areas, fault lines, and steep slopes, providing a clear spatial understanding of hazard distribution.
(3)
Targeted interventions, including slope stabilization, vegetation restoration, and real-time monitoring, are essential for high-risk areas while integrating hazard assessments into urban planning enhances resilience and safety.
(4)
The methodology provides a replicable approach for hazard assessment in similar regions, demonstrating the importance of combining quantitative modeling, dynamic environmental factors, and validation for comprehensive risk management.
(5)
The IV model enables a quantitative susceptibility analysis, where slope, lithology, and vegetation cover were identified as the most sensitive variables contributing to hazard occurrence.

Author Contributions

Conceptualization, Y.G. and Y.Z.; methodology, Y.G. and X.H.; software, Z.H. (Zheng He) and Z.H. (Zhiyong Hu); validation, Y.Z., X.H. and S.G.; formal analysis, G.Z. and G.W.; investiga-tion, Y.G., G.W. and H.W.; resources, Y.G.; data curation, Z.H. (Zhiyong Hu) and H.W.; writing—original draft preparation, Y.G. and Y.Z.; writing—review and editing, Y.Z. and X.H.; visualization, G.Z. and Z.H. (Zheng He); supervision, Y.Z.; project administration, X.H.; funding acquisition, X.H. All authors have read and agreed to the published version of the manuscript.

Funding

This research received no external funding.

Institutional Review Board Statement

Not applicable.

Informed Consent Statement

Not applicable.

Data Availability Statement

The data presented in this study are available on request from the corresponding author. The data are not publicly available due to privacy or institutional restrictions.

Acknowledgments

This work was supported by the Ningxia Mine Slope Geo-Environment Reconstruction and Ecological Restoration Technology R&D and Demonstration Project (2023BEG02051), the Ningxia Hui Autonomous Region Mine Geological Environment Monitoring and Ecological Restoration Innovation Team (2022BSB03106), the Ningxia 2021 Young Talent Support Program, and the Ningxia 2022 Science and Technology Youth Talent Support Program.

Conflicts of Interest

The authors declare no conflict of interest.

References

  1. Alexander, D. Vulnerability to landslides. In Landslide Hazard and Risk; John Wiley & Sons Ltd.: Hoboken, NJ, USA, 2005; pp. 175–198. [Google Scholar]
  2. Del Ventisette, C.; Garfagnoli, F.; Ciampalini, A.; Battistini, A.; Gigli, G.; Moretti, S.; Casagli, N. An integrated approach to the study of catastrophic debris-flows: Geological hazard and human influence. Nat. Hazards Earth Syst. Sci. 2012, 12, 2907–2922. [Google Scholar] [CrossRef]
  3. Geertsema, M.; Highland, L.; Vaugeouis, L. Environmental impact of landslides. In Landslides–Disaster Risk Reduction; Springer: Berlin/Heidelberg, Germany, 2009; pp. 589–607. [Google Scholar]
  4. Glade, T.; Crozier, M.J. The nature of landslide hazard impact. In Landslide Hazard and Risk; John Wiley & Sons Ltd.: Hoboken, NJ, USA, 2005; pp. 41–74. [Google Scholar]
  5. Jakob, M. Landslides in a Changing Climate, Landslide Hazards, Risks, and Disasters; Elsevier: Amsterdam, The Netherlands, 2022; pp. 505–579. [Google Scholar]
  6. Mazzorana, B.; Picco, L.; Rainato, R.; Iroumé, A.; Ruiz-Villanueva, V.; Rojas, C.; Valdebenito, G.; Iribarren-Anacona, P.; Melnick, D. Cascading processes in a changing environment: Disturbances on fluvial ecosystems in Chile and implications for hazard and risk management. Sci. Total Environ. 2019, 655, 1089–1103. [Google Scholar] [CrossRef] [PubMed]
  7. Albahri, A.; Khaleel, Y.L.; Habeeb, M.A.; Ismael, R.D.; Hameed, Q.A.; Deveci, M.; Homod, R.Z.; Albahri, O.; Alamoodi, A.; Alzubaidi, L. A systematic review of trustworthy artificial intelligence applications in natural disasters. Comput. Electr. Eng. 2024, 118, 109409. [Google Scholar] [CrossRef]
  8. Cui, P.; Peng, J.; Shi, P.; Tang, H.; Ouyang, C.; Zou, Q.; Liu, L.; Li, C.; Lei, Y. Scientific challenges of research on natural hazards and disaster risk. Geogr. Sustain. 2021, 2, 216–223. [Google Scholar] [CrossRef]
  9. Tamilarasi, K.; Krishnakumar, P. Unravelling Complications in Natural Disasters: A Comprehensive Exploration, Predicting Natural Disasters With AI and Machine Learning; IGI Global: Hershey, PA, USA, 2024; pp. 1–40. [Google Scholar]
  10. Katyal, A.K.; Petrisor, I.G. Flood management strategies for a holistic sustainable development. Environ. Forensics 2011, 12, 206–218. [Google Scholar] [CrossRef]
  11. Dong, L.; Cao, J.; Liu, X. Recent developments in sea-level rise and its related geological disasters mitigation: A review. J. Mar. Sci. Eng. 2022, 10, 355. [Google Scholar] [CrossRef]
  12. Huang, Y.; Cheng, H. The impact of climate change on coastal geological disasters in southeastern China. Nat. Hazards 2013, 65, 377–390. [Google Scholar] [CrossRef]
  13. Tsatsaris, A.; Kalogeropoulos, K.; Stathopoulos, N.; Louka, P.; Tsanakas, K.; Tsesmelis, D.E.; Krassanakis, V.; Petropoulos, G.P.; Pappas, V.; Chalkias, C. Geoinformation technologies in support of environmental hazards monitoring under climate change: An extensive review. ISPRS Int. J. Geo-Inf. 2021, 10, 94. [Google Scholar] [CrossRef]
  14. Bai, Y.; Zhang, Y.; Liu, X.; Wang, Y. The spatial distribution and source apportionment of heavy metals in soil of Shizuishan, China. Environ. Earth Sci. 2023, 82, 494. [Google Scholar] [CrossRef]
  15. Chai, N.; Zhou, W.; Wan, B. Research on performance evaluation and obstacle diagnosis for urban water ecological civilization construction based on GFAHP-cloud-FSE model: The case of Shizuishan, China. Stoch. Environ. Res. Risk Assess. 2022, 36, 3439–3465. [Google Scholar] [CrossRef]
  16. Alimohammadlou, Y.; Najafi, A.; Yalcin, A. Landslide process and impacts: A proposed classification method. Catena 2013, 104, 219–232. [Google Scholar] [CrossRef]
  17. Mao, Z.; Yu, H.; Liang, W.; Sun, J. Dynamic monitoring of ecological restoration of abandoned mines based on GF-2 remote sensing images-Take Dawukou Ditch of Helan Mountain as an example. Ecol. Eng. 2024, 207, 107304. [Google Scholar] [CrossRef]
  18. Zhang, X.; Wang, D.; Ma, K.; Sun, D.; Yang, F.; Lin, H. Spatiotemporal evolution of soil water erosion in Ningxia grassland based on the RUSLE-TLSD model. Environ. Res. 2023, 236, 116744. [Google Scholar] [CrossRef] [PubMed]
  19. Khan, I.; Kainthola, A.; Bahuguna, H.; Asgher, M.S. Comparative landslide susceptibility assessment using information value and frequency ratio bivariate statistical methods: A case study from Northwestern Himalayas, Jammu and Kashmir, India. Arab. J. Geosci. 2024, 17, 231. [Google Scholar] [CrossRef]
  20. Xun, X.; Zhang, J.; Yuan, Y. Multi-information fusion based on BIM and intuitionistic fuzzy DS evidence theory for safety risk assessment of undersea tunnel construction projects. Buildings 2022, 12, 1802. [Google Scholar] [CrossRef]
  21. Marzocchi, W.; Garcia-Aristizabal, A.; Gasparini, P.; Mastellone, M.L.; Di Ruocco, A. Basic principles of multi-risk assessment: A case study in Italy. Nat. Hazards 2012, 62, 551–573. [Google Scholar] [CrossRef]
  22. Saha, S.; Sarkar, D.; Mondal, P. Efficiency exploration of frequency ratio, entropy and weights of evidence-information value models in flood vulnerabilityassessment: A study of raiganj subdivision, Eastern India. Stoch. Environ. Res. Risk Assess. 2022, 36, 1721–1742. [Google Scholar] [CrossRef]
  23. Thiery, Y.; Terrier, M.; Colas, B.; Fressard, M.; Maquaire, O.; Grandjean, G.; Gourdier, S. Improvement of landslide hazard assessments for regulatory zoning in France: STATE–OF–THE-ART perspectives and considerations. Int. J. Disaster Risk Reduct. 2020, 47, 101562. [Google Scholar] [CrossRef]
  24. Cao, X.; Liu, Z.; Hu, C.; Song, X.; Quaye, J.A.; Lu, N. Three-Dimensional Geological Modelling in Earth Science Research: An In-Depth Review and Perspective Analysis. Minerals 2024, 14, 686. [Google Scholar] [CrossRef]
  25. Dikshit, A.; Pradhan, B.; Alamri, A.M. Pathways and challenges of the application of artificial intelligence to geohazards modelling. Gondwana Res. 2021, 100, 290–301. [Google Scholar] [CrossRef]
  26. Gerstenberger, M.C.; Marzocchi, W.; Allen, T.; Pagani, M.; Adams, J.; Danciu, L.; Field, E.H.; Fujiwara, H.; Luco, N.; Ma, K.F. Probabilistic seismic hazard analysis at regional and national scales: State of the art and future challenges. Rev. Geophys. 2020, 58, e2019RG000653. [Google Scholar] [CrossRef]
  27. Casagli, N.; Intrieri, E.; Tofani, V.; Gigli, G.; Raspini, F. Landslide detection, monitoring and prediction with remote-sensing techniques. Nat. Rev. Earth Environ. 2023, 4, 51–64. [Google Scholar] [CrossRef]
  28. Khan, A.; Gupta, S.; Gupta, S.K. Multi-hazard disaster studies: Monitoring, detection, recovery, and management, based on emerging technologies and optimal techniques. Int. J. Disaster Risk Reduct. 2020, 47, 101642. [Google Scholar] [CrossRef]
  29. Kumar, P.; Debele, S.E.; Sahani, J.; Rawat, N.; Marti-Cardona, B.; Alfieri, S.M.; Basu, B.; Basu, A.S.; Bowyer, P.; Charizopoulos, N. An overview of monitoring methods for assessing the performance of nature-based solutions against natural hazards. Earth-Sci. Rev. 2021, 217, 103603. [Google Scholar] [CrossRef]
  30. Stefanidis, S.P.; Proutsos, N.D.; Solomou, A.D.; Michopoulos, P.; Bourletsikas, A.; Tigkas, D.; Spalevic, V.; Kader, S. Spatiotemporal monitoring of post-fire soil erosion rates using earth observation (EO) data and cloud computing. Natural Hazards 2024, 121, 2873–2894. [Google Scholar] [CrossRef]
  31. Binder, C.R.; Hinkel, J.; Bots, P.W.; Pahl-Wostl, C. Comparison of frameworks for analyzing social-ecological systems. Ecol. Soc. 2013, 18, 26. [Google Scholar] [CrossRef]
  32. Birkmann, J.; Cardona, O.D.; Carreño, M.L.; Barbat, A.H.; Pelling, M.; Schneiderbauer, S.; Kienberger, S.; Keiler, M.; Alexander, D.; Zeil, P. Framing vulnerability, risk and societal responses: The MOVE framework. Nat. Hazards 2013, 67, 193–211. [Google Scholar] [CrossRef]
  33. Sala, S.; Ciuffo, B.; Nijkamp, P. A systemic framework for sustainability assessment. Ecol. Econ. 2015, 119, 314–325. [Google Scholar] [CrossRef]
  34. Yin, H.; Ye, G.; Yi, X.; Jin, S.; Dong, H.; Zhang, L.; Wei, W. The ancient eastward-dipping subduction zone reactivated during the Mesozoic between the Alxa and Ordos Blocks: Electrical evidence from an extended MT profile. Tectonophysics 2023, 864, 230034. [Google Scholar] [CrossRef]
  35. Zhang, T.; Chen, R.; Wang, F.; Hu, J.; Zhang, M.; Li, Q.; Wu, J.; Liu, L. Provenance of the Upper Carboniferous Yanghugou Formation in the Western Margin of the Ordos Basin, China: Constraints on Paleogeography and Basin Development. Minerals 2024, 14, 78. [Google Scholar] [CrossRef]
  36. He, D.; Lu, R.; Huang, H.; Wang, X.; Jiang, H.; Zhang, W. Tectonic and geological setting of the earthquake hazards in the Changning shale gas development zone, Sichuan Basin, SW China. Pet. Explor. Dev. 2019, 46, 1051–1064. [Google Scholar] [CrossRef]
  37. Ghosh, S.; Sivakumar, R. Assessment of morphometric parameters for the development of Relative Active Tectonic Index and its significant for seismic hazard study: An integrated geoinformatic approach. Environ. Earth Sci. 2018, 77, 600. [Google Scholar] [CrossRef]
  38. Hakhoo, N.; Bhat, G.M.; Pandita, S.; Hussain, G.; Haq, A.U.; Hafiz, M.; Ahmed, W.; Singh, Y.; Thusu, B. Natural hazards-their drivers, mechanisms and impacts in the Shyok-Nubra Valley, NW Himalaya, India. Int. J. Disaster Risk Reduct. 2019, 35, 101094. [Google Scholar] [CrossRef]
  39. Rimando, R.E.; Knuepfer, P.L. Tectonic Control of Aseismic Creep and Potential for Induced Seismicity Along the West Valley Fault in Southeastern Metro Manila, Philippines. GeoHazards 2024, 5, 1172–1189. [Google Scholar] [CrossRef]
  40. Li, C.; Li, C.; Bao, S.; Li, M. Influence of different rainfall patterns and soil water content on hydrological processes in small watersheds. Front. Environ. Sci. 2023, 11, 1221571. [Google Scholar] [CrossRef]
  41. Zhang, Y.; Hou, K.; Qian, H.; Gao, Y.; Fang, Y.; Tang, S.; Xiao, S.; Ren, W.; Qu, W.; Zhang, Q. Natural-human driving factors of groundwater salinization in a long-term irrigation area. Environ. Res. 2023, 220, 115178. [Google Scholar] [CrossRef]
  42. Singh, P.; Singh, K.; Singh, T. Slope failure in stratified rocks: A case from NE Himalaya, India. Landslides 2017, 14, 1319–1331. [Google Scholar] [CrossRef]
  43. Zhou, C.-B.; Chen, Y.-F.; Hu, R.; Yang, Z. Groundwater flow through fractured rocks and seepage control in geotechnical engineering: Theories and practices. J. Rock Mech. Geotech. Eng. 2023, 15, 1–36. [Google Scholar] [CrossRef]
  44. Huang, S.; Li, P.; Huang, Q.; Leng, G.; Hou, B.; Ma, L. The propagation from meteorological to hydrological drought and its potential influence factors. J. Hydrol. 2017, 547, 184–195. [Google Scholar] [CrossRef]
  45. Korup, O.; Clague, J.J. Natural hazards, extreme events, and mountain topography. Quat. Sci. Rev. 2009, 28, 977–990. [Google Scholar] [CrossRef]
  46. Jiang, S.; Feng, F.; Zhang, X.; Xu, C.; Jia, B.; Lafortezza, R. Ecological transformation is the key to improve ecosystem health for resource-exhausted cities: A case study in China based on future development scenarios. Sci. Total Environ. 2024, 921, 171147. [Google Scholar] [CrossRef] [PubMed]
  47. Djalante, R.; Holley, C.; Thomalla, F.; Carnegie, M. Pathways for adaptive and integrated disaster resilience. Nat. Hazards 2013, 69, 2105–2135. [Google Scholar] [CrossRef]
  48. Jayasinghe, G.; Perera, T.; Perera, H.; Karunarathne, H.; Manawadu, L.; Weerasinghe, V.; Sewwandi, B.; Haroon, M.; Malalgoda, C.; Amaratunga, D. A systematic literature review on integrating disaster risk reduction (DRR) in sustainable tourism (SusT): Conceptual framework for enhancing resilience and minimizing environmental impacts. Int. J. Disaster Risk Reduct. 2024, 111, 104742. [Google Scholar] [CrossRef]
  49. Tian, H.-H.; Xiao, T.; Shu, B.; Peng, Z.-W.; Meng, D.-B.; Deng, M. Temporal and spatial pattern analysis and susceptibility assessment of geological hazards in Hunan Province of China from 2015 to 2022. Stoch. Environ. Res. Risk Assess. 2024, 38, 1453–1474. [Google Scholar] [CrossRef]
  50. Yue, X.L.; Wu, S.H.; Huang, M.; Gao, J.B.; Yin, Y.H.; Feng, A.Q.; Gu, X.P. Spatial association between landslides and environmental factors over Guizhou Karst Plateau, China. J. Mt. Sci. 2018, 15, 1987–2000. [Google Scholar] [CrossRef]
  51. Huan, Y.; Song, L.; Khan, U.; Zhang, B. Stacking ensemble of machine learning methods for landslide susceptibility mapping in Zhangjiajie City, Hunan Province, China. Env. Earth Sci 2023, 82, 35. [Google Scholar] [CrossRef]
  52. Mathew, J.; Jha, V.; Rawat, G. Landslide susceptibility zonation mapping and its validation in part of Garhwal Lesser Himalaya, India, using binary logistic regression analysis and receiver operating characteristic curve method. Landslides 2009, 6, 17–26. [Google Scholar] [CrossRef]
  53. Nykänen, V.; Lahti, I.; Niiranen, T.; Korhonen, K. Receiver operating characteristics (ROC) as validation tool for prospectivity models—A magmatic Ni–Cu case study from the Central Lapland Greenstone Belt, Northern Finland. Ore Geol. Rev. 2015, 71, 853–860. [Google Scholar] [CrossRef]
  54. Habibi, A.; Delavar, M.R.; Sadeghian, M.S.; Nazari, B.; Pirasteh, S. A hybrid of ensemble machine learning models with RFE and Boruta wrapper-based algorithms for flash flood susceptibility assessment. Int. J. Appl. Earth Obs. Geoinf. 2023, 122, 103401. [Google Scholar] [CrossRef]
  55. Salavati, G.; Saniei, E.; Ghaderpour, E.; Hassan, Q.K. Wildfire risk forecasting using weights of evidence and statistical index models. Sustainability 2022, 14, 3881. [Google Scholar] [CrossRef]
  56. Abdlmutalib, A.; Eltom, H. Machine learning of the chemical elements for enhanced interpretation of depositional environments: Upper Jurassic strata case study in central Saudi Arabia. Mar. Pet. Geol. 2024, 162, 106758. [Google Scholar] [CrossRef]
  57. Ali, M.; Zhu, P.; Jiang, R.; Huolin, M.; Ashraf, U.; Zhang, H.; Hussain, W. Data-driven lithofacies prediction in complex tight sandstone reservoirs: A supervised workflow integrating clustering and classification models. Geomech. Geophys. Geo-Energy Geo-Resour. 2024, 10, 70. [Google Scholar] [CrossRef]
  58. Merghadi, A.; Abderrahmane, B.; Tien Bui, D. Landslide susceptibility assessment at Mila Basin (Algeria): A comparative assessment of prediction capability of advanced machine learning methods. ISPRS Int. J. Geo-Inf. 2018, 7, 268. [Google Scholar] [CrossRef]
  59. Hipsey, M.R.; Hamilton, D.P.; Hanson, P.C.; Carey, C.C.; Coletti, J.Z.; Read, J.S.; Ibelings, B.W.; Valesini, F.J.; Brookes, J.D. Predicting the resilience and recovery of aquatic systems: A framework for model evolution within environmental observatories. Water Resour. Res. 2015, 51, 7023–7043. [Google Scholar] [CrossRef]
  60. Laniak, G.F.; Olchin, G.; Goodall, J.; Voinov, A.; Hill, M.; Glynn, P.; Whelan, G.; Geller, G.; Quinn, N.; Blind, M. Integrated environmental modeling: A vision and roadmap for the future. Environ. Model. Softw. 2013, 39, 3–23. [Google Scholar] [CrossRef]
  61. Joyce, K.E.; Samsonov, S.; Levick, S.R.; Engelbrecht, J.; Belliss, S. Mapping and monitoring geological hazards using optical, LiDAR, and synthetic aperture RADAR image data. Nat. Hazards 2014, 73, 137–163. [Google Scholar] [CrossRef]
  62. Muhadi, N.A.; Abdullah, A.F.; Bejo, S.K.; Mahadi, M.R.; Mijic, A. The use of LiDAR-derived DEM in flood applications: A review. Remote Sens. 2020, 12, 2308. [Google Scholar] [CrossRef]
  63. Phillips, C.; Hales, T.; Smith, H.; Basher, L. Shallow landslides and vegetation at the catchment scale: A perspective. Ecol. Eng. 2021, 173, 106436. [Google Scholar] [CrossRef]
  64. Thomas, J.; Gupta, M.; Srivastava, P.K.; Petropoulos, G.P. Assessment of a dynamic physically based slope stability model to evaluate timing and distribution of rainfall-induced shallow landslides. ISPRS Int. J. Geo-Inf. 2023, 12, 105. [Google Scholar] [CrossRef]
  65. Malik, B.A.; Koner, R. Comprehensive review of the monitoring and sensing system in slopes with a special focus on the mining sector. Environ. Sci. Pollut. Res. 2024, 31, 66588–66614. [Google Scholar] [CrossRef]
  66. Sassa, S. Global Promotion of Understanding and Reducing Landslide Disaster Risk: Two Years on P-LRT. Prog. Landslide Res. Technol. 2024, 3, 247–277. [Google Scholar]
  67. Cascini, L.; Bonnard, C.; Corominas, J.; Jibson, R.; Montero-Olarte, J. Landslide Hazard and Risk Zoning for Urban Planning and Development, Landslide Risk Management; CRC Press: Boca Raton, FL, USA, 2005; pp. 209–246. [Google Scholar]
  68. Daunt, A.B.P.; Silva, T.S.F.; Bürgi, M.; Hersperger, A.M. Urban expansion and forest reserves: Drivers of change and persistence on the coast of São Paulo State (Brazil). Land Use Policy 2021, 101, 105189. [Google Scholar] [CrossRef]
  69. Sutanta, H.; Rajabifard, A.; Bishop, I.D. Disaster risk reduction using acceptable risk measures for spatial planning. J. Environ. Plan. Manag. 2013, 56, 761–785. [Google Scholar] [CrossRef]
  70. Mielby, S.; Henriksen, H.J. Hydrogeological studies integrating the climate, freshwater cycle, and catchment geography for the benefit of urban resilience and sustainability. Water 2020, 12, 3324. [Google Scholar] [CrossRef]
  71. Rus, K.; Kilar, V.; Koren, D. Resilience assessment of complex urban systems to natural disasters: A new literature review. Int. J. Disaster Risk Reduct. 2018, 31, 311–330. [Google Scholar] [CrossRef]
  72. Bates, P.D.; Quinn, N.; Sampson, C.; Smith, A.; Wing, O.; Sosa, J.; Savage, J.; Olcese, G.; Neal, J.; Schumann, G. Combined modeling of US fluvial, pluvial, and coastal flood hazard under current and future climates. Water Resour. Res. 2021, 57, e2020WR028673. [Google Scholar] [CrossRef]
  73. Kirschbaum, D.; Watson, C.S.; Rounce, D.R.; Shugar, D.H.; Kargel, J.S.; Haritashya, U.K.; Amatya, P.; Shean, D.; Anderson, E.R.; Jo, M. The state of remote sensing capabilities of cascading hazards over High Mountain Asia. Front. Earth Sci. 2019, 7, 197. [Google Scholar] [CrossRef]
  74. Pappenberger, F.; Dutra, E.; Wetterhall, F.; Cloke, H.L. Deriving global flood hazard maps of fluvial floods through a physical model cascade. Hydrol. Earth Syst. Sci. 2012, 16, 4143–4156. [Google Scholar] [CrossRef]
  75. Enenkel, M.; Brown, M.; Vogt, J.; McCarty, J.; Reid Bell, A.; Guha-Sapir, D.; Dorigo, W.; Vasilaky, K.; Svoboda, M.; Bonifacio, R. Why predict climate hazards if we need to understand impacts? Putting humans back into the drought equation. Clim. Change 2020, 162, 1161–1176. [Google Scholar] [CrossRef]
  76. Gobinath, A.; Reshmika, K.; Sivakarthi, G. Predicting Natural Disasters with AI and Machine Learning, Utilizing AI and Machine Learning for Natural Disaster Management; IGI Global: Hershey, PA, USA, 2024; pp. 254–273. [Google Scholar]
  77. Chatterjee, A.; Mitra, I.; De, M. From Vulnerability to Resilience: The Role of Community Participation in Landslide Risk Mitigation in the Himalayan Region, Landslides in the Himalayan Region: Risk Assessment and Mitigation Strategy for Sustainable Management; Springer: Berlin/Heidelberg, Germany, 2024; pp. 465–497. [Google Scholar]
  78. Cole, J.M.; Murphy, B.L. Rural hazard risk communication and public education: Strategic and tactical best practices. Int. J. Disaster Risk Reduct. 2014, 10, 292–304. [Google Scholar] [CrossRef]
  79. Miao, C.; Na, M.; Chen, H.; Ding, M. Urban resilience evaluation based on entropy-TOPSIS model: A case study of county-level cities in Ningxia, Northwest China. Int. J. Environ. Sci. Technol. 2024, 22, 4187–4202. [Google Scholar] [CrossRef]
  80. Sen Gupta, D.; Ghosh, P.; Rai, S.P.; Tripathi, S. Hydrogeochemical variability and appraisal of water quality of groundwater in Mahoba district, Uttar Pradesh, India. Environ. Earth Sci. 2022, 81, 149. [Google Scholar] [CrossRef]
Figure 1. Geographical location of Dawukou District in Shizuishan City, Ningxia, China. The black square highlights the study area.
Sustainability 17 05990 g001
Figure 2. Dawukou District geomorphic division map. I–IV represent geomorphological zones: I—mountain, II—hilly terrain, III—piedmont slope, IV—alluvial plain.
Sustainability 17 05990 g002
Figure 3. Multi-year precipitation distribution from Shitanjing and Shizuishan stations (2003–2022).
Sustainability 17 05990 g003
Figure 4. Photographic evidence of anthropogenic activities: (a) large waste rock piles; (b) exposed mining slopes; (c) road-cut slope instabilities; (d) urban development adjacent to fault zones.
Sustainability 17 05990 g004
Figure 5. Spatial distribution maps of the eight landslide susceptibility conditioning factors in the study area: (a) elevation value (m); (b) distance to roads (m); (c) distance to faults (m); (d) engineering geological rock formations; (e) slope (°); (f) distance to water systems (m); (g) land use types; (h) vegetation types.
Sustainability 17 05990 g005
Figure 6. Cumulative susceptibility index map for Dawukou District. This map was generated by summing the weighted information value (IV) scores of all selected influencing factors (slope, lithology, precipitation, NDVI, fault proximity, etc.). The index ranges from −15.00 to 10.44, with higher values indicating stronger susceptibility to geological hazards.
Sustainability 17 05990 g006
Figure 7. Slope hazard susceptibility map based on geological and geomorphological controls. The map highlights zones vulnerable to landslides and slope failures. High-susceptibility areas are primarily located in regions with steep gradients and weak lithologies.
Sustainability 17 05990 g007
Figure 8. Debris flow susceptibility zones in Dawukou District, classified into four levels using IV-based analysis of terrain and hydrological factors. Red areas indicate high susceptibility, generally concentrated near gullies, steep terrain, and disturbed slopes.
Sustainability 17 05990 g008
Figure 9. Composite susceptibility zoning map of Dawukou District. This map integrates debris flow and slope hazard susceptibility layers to delineate overall geological hazard-prone areas. The classification supports regional zoning for hazard mitigation and land use planning.
Sustainability 17 05990 g009
Figure 10. Dawukou susceptibility zoning map.
Sustainability 17 05990 g010
Figure 11. AUC curve of the susceptibility evaluation model.
Sustainability 17 05990 g011
Table 1. Data sources.
DataData SourcesData TypeInfluence FactorsTemporal CoverageUsed in Susceptibility Analysis
Geological dataField investigation“shp”Geomorphic type, rock and soil type, distance from fault zone~2015 (latest edition)Yes
ASTER GDEM 30 m DEMwww.gscloud.cn (accessed on 16 May 2025) “tiff”Slope, aspect2011 (global release)Yes
Landsat-8 satellite imagerywww.gscloud.cn
(accessed on 16 May 2025)
“tiff”NDVI2022 (Landsat-8 OLI, spatial resolution 30 m, temporal resolution single cloud-free composite with cloud masking applied)Yes
PGA distribution mapearthquake.usgs.gov/earthquakes (accessed on 2 June 2025)“shp”PGA2020 (regional dataset)No
Meteorological datadata.cma.cn (accessed on 2 June 2025)“excel”Precipitation2003-2022Yes
National water system, road network, and residential
area
OpenStreetMap (www.openstreetmap.org (accessed on 21 July 2024))“shp”Water systems, buildings, transportation facilities2022Yes
Census datawww.stats.gov.cn
(accessed on 14 October 2024)
“excel”Population2020No
Note: NDVI is the normalized difference vegetation index. PGA is the peak ground acceleration.
Table 2. Ranking of AUC values of evaluation indicators.
Serial NumberEvaluation IndicatorAUC Value
1Slope0.89
2Elevation0.78
3Relief0.78
4Vegetation Type0.67
5Fault0.62
6Road0.59
7Engineering Geological Rock Group0.59
8Land Use Type0.58
9Water System0.54
10Aspect0.59
11Slope Pattern0.6
12Geomorphology0.56
Table 3. Susceptibility indexes of various evaluation indicators.
Evaluation FactorClassificationSensitivity IndexWi+Wi−
Elevation (m)1065–12810.7266990.661855−0.06484
1281–14790.961240.739696−0.22154
1479–16720.9060520.730933−0.17512
1672–18971.1128630.945873−0.16699
1897–23790.0546190.051531−0.00309
>3000−0.46073−0.279470.181257
Distance to Road (m)1000–3000−0.00175−0.00120.000554
500–1000−0.20345−0.184170.019278
300–5000.4888750.460076−0.0288
100–3001.0644610.971101−0.09336
50–1000.4377990.429441−0.00836
0–500.3573830.349716−0.00767
<1000.7623510.70287−0.05948
Distance to Fault (m)100–2000.6082890.565124−0.04316
200–3000.2549750.240331−0.01464
300–5000.044070.039813−0.00426
500–1000−0.07506−0.061410.013648
1000–20000.359210.258763−0.10045
>2000−1.02022−0.794240.22598
Engineering Geological Rock GroupHard massive gneiss0.9786520.912387−0.06626
Hard medium-thick bedded limestone−1.33963−1.313430.026195
Relatively hard thick-bedded clastic rock−0.40932−0.226970.18235
Gravelly soil, sandy gravelly soil−0.0561100.056109
Soft–hard identical clastic rock coal-bearing strata0.4892740.277918−0.21136
Slope (°)0–10−0.98959−0.884840.104752
10–20−0.11099−0.094680.016312
20–301.1676110.946997−0.22061
30–402.2602421.921598−0.33864
>402.5801482.391511−0.18864
Relief (m)0–30−2.11513−1.638610.476523
30–60−0.55116−0.38140.169764
60–901.263350.942813−0.32054
90–1201.8974151.697911−0.1995
120–2581.7692061.7098−0.05941
Distance to Water System (m)<100−0.13425−0.119130.015116
100–2000.2505810.219616−0.03096
200–3000.2044760.181768−0.02271
300–5000.1649120.133133−0.03178
500–1000−0.22058−0.15330.067282
1000–2000−0.09859−0.083440.015144
Land Use TypeLow-coverage grass−0.10073−0.081480.019252
Other construction0.7550620.636762−0.1183
Shrub forest land−0.53746−0.49810.039355
High-coverage grass0.1351420.112031−0.02311
Medium-coverage grass−0.2058−0.136340.069462
Residential land−1.29313−1.276650.016479
River beach land0.4742790.456032−0.01825
Cultivated land−0.0218600.021864
Vegetation TypeGrassland1.1246280.659991−0.46464
Desert−2.47812−2.293760.184354
Shrubbery−0.40466−0.20990.194754
Note: Wi+ represents the positive weight (favoring hazard occurrence) for each class, while Wi− represents the negative weight (disfavoring). The sensitivity Index is the difference of Wi+ − Wi−, indicating the strength and direction of influence.
Table 4. Classification table of geological hazard susceptibility evaluation.
SusceptibilityArea (km2)Proportion
Very-low-susceptible area618.6164.97%
Low-susceptible area222.0623.32%
Moderate-susceptible area96.7110.16%
High-susceptible area14.781.55%
Total948.84100.00%
Disclaimer/Publisher’s Note: The statements, opinions and data contained in all publications are solely those of the individual author(s) and contributor(s) and not of MDPI and/or the editor(s). MDPI and/or the editor(s) disclaim responsibility for any injury to people or property resulting from any ideas, methods, instructions or products referred to in the content.

