Abstract
Environmental sustainability constitutes a strategic priority for Germany, with the circular economy serving a crucial function in its realization. Circular practices foster sustainable development by decreasing reliance on finite resources, minimizing waste, and reducing greenhouse gas (GHG) emissions. The circular economy provides ecological advantages and strengthens economic resilience through the promotion of innovation, enhancement of supply chain efficiency, and creation of green jobs. Complementary measures, including the preservation of natural capital, the enactment of structural economic reforms, and the implementation of environmental taxes, enhance sustainability objectives. Ecosystem conservation enhances carbon absorption, structural changes facilitate low-emission industries, and environmental taxes incorporate environmental costs. In contrast, industrial activity continues to be a significant contributor to GHG emissions, necessitating policy examination. This study analyzes the relationships between the circular economy, natural capital, structural change, environmental taxation, and industrial activities on GHG emissions in Germany from the first quarter of 2010 to the fourth quarter of 2022. The study employs wavelet coherence analysis (WCA), fully modified ordinary least squares (FMOLS), and dynamic ordinary least squares (DOLS), demonstrating that circular economy practices, natural capital, structural changes, and environmental taxes significantly reduce GHG emissions. Conversely, industrial activities continually elevate GHG emissions in Germany. Moreover, WCA further reveals the time–frequency dynamics and co-movement patterns between key variables and GHG emissions, enabling the detection of both short-term and long-term dependencies. The results indicate that enhancing environmental sustainability in Germany could be effectively achieved by mandating the integration of recycled materials within key industrial sectors to improve environmental sustainability, which would help lower resource extraction and related GHG emissions.
1. Introduction
Environmental sustainability has evolved into a primary goal of global economic and policy frameworks, propelled by the pressing necessity to confront climate change, biodiversity decline, and resource exhaustion. The circular economy has acquired considerable prominence as a policy tool and economic model to promote sustainability in both rich and developing countries [1]. This transition from the conventional linear model of “take, make, dispose” to a regenerative economic system seeks to dissociate economic activity from environmental degradation. The circular economy seeks to improve resource efficiency, extend the life of products, and recover value from waste, therefore reducing GHG emissions and conserving natural resources [2]. With the intensification of global environmental issues, the transition to a circular economy has become essential.
The European Union (EU) and its member states have played a pivotal role in promoting circular economy policy. The European Green Deal, the Circular Economy Action Plan, and national resource efficiency frameworks underscore the EU’s political commitment to integrating circularity as a core element of sustainable development [3]. Countries globally, such as China, Canada, and Japan, have embraced circular economy concepts, each emphasizing distinct priorities. For instance, China’s strategy is closely associated with industrial advancement and waste management reform, whereas Japan emphasizes resource efficiency within the sound material-cycle society framework. Despite this global momentum, the worldwide circularity rate remains alarmingly low at only 7.2% [4]. This illustrates the persistent dominance of linear economic practices and underscores the necessity for a deeper empirical comprehension of the effects of circular economy strategies on environmental outcomes, especially GHG emissions.
Climate change has become a crucial problem of our era. The acceleration of global warming, rising sea levels, and the heightened frequency of extreme weather events have compelled countries to implement rigorous emission reduction objectives. Germany distinguishes itself by pledging to attain net-zero GHG emissions by 2045. The country has set intermediate targets to decrease emissions by a minimum of 65 percent by 2030 and 88 percent by 2040 relative to 1990 levels. Germany aspires to achieve net-negative emissions by 2050. As the largest economy in Europe and a global leader in manufacturing and innovation, Germany plays a pivotal role in the global environmental agenda [5]. Germany’s substantial industrial sector, robust environmental regulations, and early adoption of circular economy methods provide a good foundation for analyzing the interconnections between economic developments, resource efficiency, and emission reduction [6]. Furthermore, Germany has a strong empirical framework owing to its extensive environmental data infrastructure, bolstered by Eurostat and state agencies, for high-frequency, dependable research. The diversified industries, encompassing both energy-intensive manufacturing and innovative green technologies, provide a good context for analyzing the impact of structural and policy changes on emissions.
This study investigates the complex relationships between the circular economy, natural capital, structural economic change, environmental taxation, and industrial operations within the context of Germany’s sustainability strategy and their influence on GHG emissions over time. While several studies have examined these components independently, few have investigated them within a unified empirical framework that includes their interaction effects and dynamic temporal relationships. Furthermore, contemporary research often relies on conventional indicators such as recycling rates or trash quantities to denote the efficacy of the circular economy.
To guide this inquiry, the study draws upon two foundational theories in environmental economics: the Ecological Modernization Theory (EMT) and the Environmental Kuznets Curve (EKC) hypothesis of [7]. EMT asserts that environmental protection and economic development are not incompatible but can be concurrently achieved via technology innovation, institutional change, and proactive environmental governance [8]. According to EMT, advanced economies such as Germany can spearhead the transition to sustainable development by incorporating environmental considerations into fundamental economic and industrial practices. This includes the use of sustainable technology, the promotion of circular production models, and the establishment of legislative frameworks that internalize environmental externalities. Germany’s extensive waste regulations, carbon pricing strategies, and dedication to innovation-driven decarbonization show the EMT in practice.
The EKC hypothesis posits that environmental degradation typically escalates during the initial phases of economic development but subsequently decreases as income levels increase and societies allocate resources toward cleaner technologies and more stringent regulations. The EKC framework plays a crucial role in analyzing the emissions trajectory of nations experiencing economic transitions [9]. This study expands the EKC model by integrating the circular economy and natural capital indicators as variables that could potentially expedite the transition toward environmental improvement. By highlighting how circular practices and ecosystem conservation can reduce emissions even in highly industrialized contexts, the study offers a novel interpretation of EKC dynamics.
Natural capital, encompassing biodiversity, soil, aquatic systems, and forests, is vital for climate regulation and carbon sequestration. Natural capital is fundamental to the operation of all economic systems and immediately affects climate mitigation and adaptation initiatives. The degradation of natural capital hastens biodiversity loss and ecological imbalance; hence, it undermines the resource foundation necessary for sustained economic activity [10]. Natural capital underpins the functionality of all economic systems and directly influences climate mitigation and adaptation efforts. Degradation of natural capital accelerates biodiversity loss and ecological imbalance and undermines the resource base required for sustainable economic activity [11]. Within Germany’s sustainability plan, the preservation of natural capital is regarded as crucial for enduring ecological resilience and intergenerational equality. The forests of Germany, covering about one-third of its territory, absorb around 62 million tons of carbon each year. It is essential to protect and enhance these ecosystems to decrease emissions and foster resilience against climate-related disturbances. This study incorporates natural capital as a crucial element, alongside circular material utilization and structural transformation, with the objective of providing comprehensive knowledge of how these interconnected domains influence GHG emission patterns.
Structural changes, including the shift from a fossil-fuel-dependent economy to one reliant on renewable energy, circular production models, and digital innovation, are concurrently altering the country’s emission profile [12]. The energy sector, traditionally the greatest emitter, has seen a substantial decrease in emissions due to the expansion of renewables, which accounted for almost 46% of gross power consumption in 2022. The current phase-out of coal and the advancement of green technologies signify a wider economic transition [13]. The structural changes, along with the conservation of natural capital, constitute the foundation of Germany’s climate policy. Analyzing the interaction of these dynamics is crucial for assessing the nation’s advancement in achieving climate objectives and recognizing avenues for enhanced decarbonization. To comprehensively assess the impact of these dynamics, this study employs WCA to capture the time–frequency co-movements between circular economy indicators and GHG emissions, thus identifying both short-term fluctuations and long-term linkages. In addition, FMOLS and DOLS estimators are applied to evaluate the long-run equilibrium relationships, correcting for potential endogeneity and serial correlation. While earlier studies have emphasized the theoretical promise of the circular economy, they often overlook the temporal evolution and dual-scale effects of such practices on emissions. This study addresses that gap by empirically examining how circular economy measures interact with GHG emissions across multiple time horizons, providing a more nuanced understanding of their role in achieving Germany’s climate objectives.
By doing so, our study contributes to the body of existing literature on environmental economics in the following ways: First, it offers a comprehensive empirical framework that evaluates the contributions of circular economy practices, natural capital, structural changes, environmental taxation, and industrial activity in shaping GHG emissions, an approach that remains underexplored in prior research. Second, by focusing on Germany, a highly industrialized and policy-driven economy, the study provides context-specific evidence from a major emitter, filling a regional gap in the literature. Third, this study employed the WCA, which is essential for identifying dynamic, time–frequency relationships between variables, enabling researchers to observe the evolution of correlations over time and across various time scales. This method is significant in environmental studies as it effectively captures both short-run fluctuations and long-run trends in the interactions between factors such as GHG emissions and economic indicators. Fourth, the study improves on traditional waste-based metrics by introducing the circular material use rate as a more accurate stand-in for circular economy success. Fourth, we used FMOLS and DOLS to check the robustness of our results. The results provide policymakers with useful information for decarbonization and sustainable growth.
2. Literature Review
This literature review explores how human-driven economic processes, regulatory environmental measures, and progress in technology collectively influence climate dynamics. By analyzing these interconnections, the review aims to shed light on the diverse ways in which human activities contribute to environmental change. It explores the dual role of these activities in both exacerbating and mitigating climate-related challenges. The review begins by examining the environmental consequences of human actions, such as pollution and waste generation while also highlighting the positive contributions made through recycling and circular economy practices. It then transitions to a discussion on the circular economy’s potential to reduce GHG emissions, drawing on empirical studies that underscore the benefits and limitations of this approach in different sectors and regions. Finally, the review looks at how important factors like natural resources, changes in industry, environmental taxes, and business trends affect the link between the circular economy and GHG emissions, helping explain the complicated ways these elements influence sustainable development and efforts to combat climate change.
2.1. Human Activities, Circular Economy, and Their Environmental Consequences
Human activities exert a dual influence on environmental outcomes, both intensifying and mitigating climate change. The construction of factories and homes contributes to economic growth; however, it also results in significant environmental degradation due to heightened air, water, and light pollution, as well as increased fossil fuel consumption and GHG emissions. Accumulation of waste intensifies the challenges, creating ongoing issues for sustainable waste management systems [14].
However, human interventions have also played a constructive role in promoting environmental sustainability, particularly through initiatives such as recycling and waste segregation. Among these, recycling has gained prominence as a strategic response to the environmental challenges posed by large-scale production and plastic consumption. Its advantages extend beyond mere waste reduction, encompassing the conservation of natural resources and the mitigation of ecological degradation [15].
The circular economy, as conceptualized by Stahel [16], represents a strategic approach to long-term environmental and economic sustainability by promoting the reuse, repurposing, and regeneration of resources. Although widely studied in theory, empirical research remains limited, largely due to data constraints at both household and industrial levels. Nonetheless, emerging empirical studies offer valuable insights. Slorach, Jeswani [17] demonstrated that anaerobic digestion for food waste in the UK yields both environmental and economic benefits.
Building on these insights, Aguilar-Hernandez and Rodrigues [18], in a meta-analysis of over 300 circular economy scenarios, found significant potential for CO2 reductions through circular practices. However, they also identified key limitations, including short observational windows and persistent endogeneity issues, which complicate causal inference. The literature reveals a mixed global picture: while some countries have effectively employed circular policies to curb emissions, others have seen limited results, underscoring the importance of context-specific socio-economic and environmental conditions in determining policy effectiveness.
2.2. Circular Economy and GHG Emissions
Recycling and waste management have increasingly been recognized as integral components of strategies to mitigate climate change, offering pathways not only for reducing environmental burdens but also for promoting sustainable resource use. Cudjoe and Zhu [19] emphasize the significant role of recycling in curbing GHG emissions, particularly CO2 and methane, through the recovery of high-emission materials such as steel, nonferrous metals, plastics, and paper. Their findings suggest that material-specific recycling efforts can yield measurable environmental gains, reinforcing the view of recycling as a foundational mechanism within the broader sustainability agenda.
However, this optimistic view is strengthened by studies that question the efficiency of circular economy practices in all contexts. In their analysis of trade relations between China and Nigeria, Li and Song [20] underscore the inherent limitations of implementing circular economy strategies within resource-dependent, extractive economies. Despite the observed improvements in energy efficiency, the expected reductions in CO2 emissions did not materialize. This gap shows the difficulties of using circular economy ideas in industries that need a lot of energy and points out the structural and sector-specific issues that might limit their positive impact on the environment. Supporting this notion, Bayar and Gavriletea [21], in their analysis of EU countries, find no significant causal relationship between recycling rates or renewable energy adoption and CO2 reductions. These findings question the belief that circular economy actions directly lead to better environmental results, indicating that other factors like technology, regulations, and infrastructure development might influence these connections.
Moreover, the importance of context-specific implementation becomes even clearer when considering waste-to-energy strategies and the role of energy security. Studies on OECD countries [21] and others emphasize that nations such as France, Germany, and Japan rely heavily on both modern and combustible renewable resources to sustain their environmental agendas, highlighting the role of energy mix and policy consistency. Similarly, Caglar and Gökçe [22] reveal that while solid waste management positively contributes to environmental quality and supports SDG-11, its contribution is neither automatic nor universally strong across contexts. This finding illustrates the broader point that circular economy strategies must be embedded within supportive institutional and infrastructural ecosystems to be truly effective.
Further deepening the analysis, Gallego-Schmid and Chen [23], reinforce this point by calling for more sophisticated metrics and life-cycle assessments that can better capture the net emissions impacts of circular economy interventions. The Danish experience, explored by Magazzino and Mele [24], offers a practical example of how a transition from linear to circular waste management systems can yield emissions benefits, albeit with strong policy backing. Lastly, a broader regional perspective from Hailemariam and Erdiaw-Kwasie [25] presents cross-national evidence from 29 European countries, demonstrating a positive correlation between the progress of circular economy initiatives and reductions in CO2 emissions. This suggests that circular economy solutions could be expanded as long as national factors, especially consistent policies and cooperation between sectors, are properly aligned.
- Hypothesis 1:
H1:
Circular economy has a negative relationship with GHG emissions.
2.3. Natural Capital, Structural Changes, and Circular Economy
Natural capital refers to the stock of natural assets—including geological formations, soil quality, atmospheric resources, water bodies, and biological diversity—that collectively sustain essential ecosystem services and human well-being [26]. Within the framework of the circular economy, natural capital plays a pivotal role in minimizing dependence on virgin materials and fostering sustainable production and consumption patterns. The conservation and efficient management of natural capital are fundamental to advancing the objectives of the circular economy, as it fosters waste minimization and the restoration of natural resources through practices such as recycling, upcycling, and sustainable sourcing [27]. By prioritizing the preservation and enhancement of natural capital, circular economy principles may guarantee that natural resources are used without depleting or degrading ecosystems, hence offering sustained economic and environmental advantages.
Furthermore, natural capital, defined as the stock of natural ecosystems that provide essential goods and services, serves as a foundational pillar for long-term sustainability. Zhang and Iqbal [11], using quantile process estimation, indicated that natural capital has a substantial role in reducing emissions and enhancing ecosystem resilience in China. Their findings underscore the synergistic link between structural economic reform and the conservation of natural capital in facilitating a successful circular economy. However, stable institutions, investment in innovative concepts, and methods to appreciate nature amplify the impact of both factors, despite their significance. Therefore, future policies and research should focus on making structural improvements while also connecting them with managing natural resources to ensure both environmental and economic benefits work well together.
- Hypothesis 2:
H2:
Natural capital has a negative relationship with GHG emissions.
Structural changes, defined as shifts in the economic, social, and technological architecture of production and consumption, play a transformative role in aligning industrial systems with sustainability goals. These changes often entail transitions toward greener business models, such as product and service systems, and the mainstreaming of circular economy principles within high-impact sectors like manufacturing and construction [28]. While the literature generally supports the notion that such shifts can decouple economic activity from environmental degradation, the evidence suggests that their success largely depends on the degree of integration with innovation systems and policy frameworks. Technological improvements from changes in structure, like using energy-saving production methods and choosing long-lasting, eco-friendly materials, can greatly lower the use of resources and GHG emissions. However, the scale and speed of such outcomes remain contingent on the depth of structural transformation and the sectoral readiness to absorb change.
Importantly, structural changes are not just environmentally beneficial; they also carry socio-economic dividends. Emerging sectors focused on recycling, repair, refurbishment, and remanufacturing have demonstrated job creation potential, particularly in regions where industrial policies support circular economy-aligned skills and enterprises [29]. Marra and Colantonio [30] using the data from 34 OECD countries, revealed that structural change does not exert a direct effect on emission reduction; it serves as a catalyst for fostering green innovation and lowering energy intensity. Adebayo and Oladipupo [31] used the data from Turkey for the period 1965–2019 and employed the NARDL estimator, demonstrating that structural transformation contributes positively to ecological quality. However, their findings also indicate that Turkey’s current development trajectory remains environmentally unsustainable, primarily due to its heavy dependence on fossil fuel-based energy consumption.
- Hypothesis 3:
H3:
Structural changes have a negative relationship with GHG emissions.
2.4. Environmental Tax, Industrial Activities, and Circular Economy
Environmental taxes play a significant role in the relationship between the circular economy and GHG emissions. The concept of ‘Pigovian Taxation’ underpins this approach by assigning a cost to pollution-related activities, such as CO2 emissions, thereby incorporating the environmental damage into the market price. This mechanism motivates firms and individuals to lower their emissions and shift toward cleaner technologies by making carbon-intensive behaviors less economically attractive [32]. The role of environmental taxes, including carbon and energy levies, in curbing GHG emissions has been extensively acknowledged in the literature. Ghazouani and Jebli [33] demonstrated that implementing environmental taxes alongside the encouragement of cleaner energy adoption effectively reduces pollution across nine major European economies. Correspondingly, Hsu and Zhang [34] underscored the significant impact of environmental taxation on lowering GHG emissions in China, specifically noting substantial reductions in haze pollution and PM2.5 concentrations. In a related study, Doğan and Chu [35] examined how environmental taxes can mitigate the adverse effects of energy consumption and natural resource exploitation while simultaneously supporting the growth of renewable energy sectors. Their findings highlight the dual environmental benefits of such fiscal policies in reducing emissions. Furthermore, Wolde-Rufael and Mulat-weldemeskel [36] identified a strong inverse relationship between environmental taxation and CO2 emissions across 20 European nations. Expanding on these concepts, the theory of Environmental Tax Reform advocates for the reinvestment of revenues generated from environmental taxes into renewable energy projects, green technologies, or compensatory tax reductions, thereby aiming to secure both environmental sustainability and economic gains.
- Hypothesis 4:
H4:
Environmental tax has a negative relationship with GHG emissions.
Industrial activities significantly contribute to GHG emissions, mainly as a result of energy-intensive processes, dependence on fossil fuels, and direct gas emissions during manufacturing. The Pollution Haven Hypothesis [37] suggests that industries often move their operations to regions where environmental regulations are comparatively lax, resulting in heightened local emissions. The EKC theory proposes that economic growth initially leads to rising emissions; however, as nations develop further and adopt cleaner technologies, these emissions tend to decline. In parallel, Porter’s Hypothesis [38] argues that stringent environmental regulations can act as catalysts for innovation, driving industries toward more sustainable practices that reduce emissions. Empirical evidence from Azam and Rehman [39] confirms that industrialization contributes to increased environmental pollution through heightened GHG emissions. Key sectors such as energy production, transportation, manufacturing, agriculture, and construction are major contributors to these emissions. Particularly, the energy sector is a significant source of pollution due to its dependence on fossil fuels, while transportation emissions primarily arise from fuel consumption in vehicles and aircraft. The hypothetical framework is given by (Figure 1).
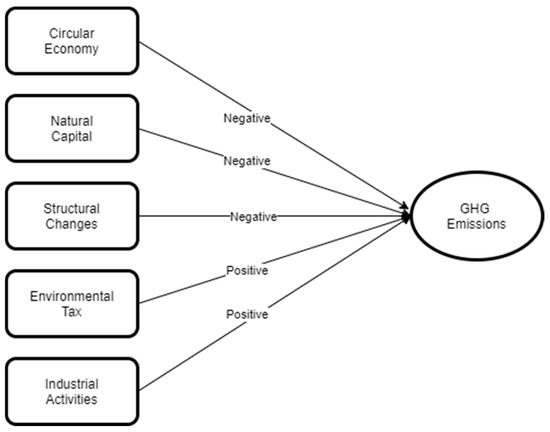
Figure 1.
The figure depicts the hypothesized relationships examined in the study, where circular material use, natural capital, structural changes, environmental tax, and industrial activities influence GHG emissions. The framework is designed to guide the empirical strategy and variable selection.
- Hypothesis 5:
H5:
Industrial activities have a positive relationship with GHG emissions.
3. Research Methodology
3.1. Theoretical Framework
The linear economy, defined by its “take-make-dispose” framework, continues to dominate the current economic system. This model entails the extraction of raw materials, the production of goods, their consumption, and, ultimately, the disposal of these products as waste after their functional lifespan has ended. This system results in the unnecessary depletion of natural resources, as each cycle of production and disposal contributes to the gradual loss of these vital resources [40]. The conventional linear model generally entails the acquisition of material resources, their conversion into consumable products, and their eventual disposal, often neglecting the long-term ecological consequences [41]. This model emphasizes financial profit and consumer convenience at the expense of environmental sustainability, leading to the creation of products typically intended for single use and subsequent disposal.
The circular economy represents a significant shift addressing the inefficiencies and environmental harm associated with the linear economic model. This approach promotes a restorative system aimed at reducing waste and enhancing resource efficiency through a reevaluation of product lifecycles. The literature indicates that transitioning from a linear to a circular economic model necessitates addressing several significant challenges, including technological limitations, economic issues, and changes in behavior [41]. Comprehending these challenges is essential for the effective implementation of circular practices and their subsequent success.
The circular economy is based on the principle of utilizing resources to foster regeneration and renewal instead of depletion. It highlights innovative methods such as recycling, reusing, and remanufacturing to transform waste into valuable inputs. The circular economy presents a viable framework for addressing issues of resource scarcity, waste generation, and inefficiencies inherent in conventional economic systems [42]. Highlighting recycling and other circular economy practices is essential for ensuring environmental sustainability and reducing harmful emissions. The implementation of these practices can markedly decrease the ecological footprint associated with industrial and consumer activities [25].
Considering the growing significance of environmental management within the industrial sector, it is crucial to evaluate the roles and contributions of different stakeholders in effective waste management. The literature emphasizes the necessity of a collaborative approach among governments, corporations, and consumers for the effective implementation of circular economy models [43]. Governments are responsible for establishing regulatory frameworks and incentives that promote circular practices, whereas businesses must innovate to integrate circular principles into their operations. Consumers play a vital role by adopting sustainable behaviors and endorsing products intended for reuse and recycling [44].
The circular economy aims to enhance the efficiency and sustainability of limited natural resources, such as forests, land, water, air, metals, and minerals. This model reduces emissions linked to resource extraction and processing by minimizing resource consumption and waste generation. This approach addresses urgent environmental challenges while also considering social dimensions and promoting human well-being [45]. The transition from a linear economy characterized by a “manufacturing-consumption-waste” model to a circular economy defined by “make-use-recycle” necessitates the integration of sustainable principles that emphasize resource productivity and lifecycle management. The circular economy model is defined by strategies aimed at minimizing or eliminating resource flows, thereby reducing the negative environmental impacts linked to conventional economic practices [27].
In summary, transitioning from a linear to a circular economy represents a significant shift in resource management and utilization. The circular economy emphasizes sustainability and efficient resource utilization, providing a viable alternative to conventional practices. It has the potential to significantly reduce environmental harm and promote long-term ecological sustainability.
3.2. Model Specifications
This study is grounded in the theoretical frameworks of ecological modernization and circular economy theory. Ecological modernization asserts that technological innovation, institutional transformation, and market-driven strategies can decouple economic growth from environmental degradation. The circular economy is a systems-oriented approach aimed at closing material loops, enhancing resource efficiency, and minimizing waste and pollution. The circular material use rate, environmental taxation policies, and structural economic variables utilized in this study serve as practical applications of these theoretical concepts. The study integrates principles of sustainable development, highlighting the balance of environmental integrity, economic efficiency, and social responsibility, consistent with the triple-bottom-line framework. This study seeks to evaluate the effects of circular economy practices on emissions outcomes through the integration of various perspectives.
Building upon the insights derived from the reviewed literature, this study adopts an enhanced analytical framework to examine the relationship between circular economy practices and GHG emissions. Diverging from prior research that predominantly centered on CO2 emissions as the sole indicator of environmental impact, this study employs GHG emissions as the dependent variable to capture a broader and more comprehensive spectrum of emissions contributing to climate change. Furthermore, while earlier studies have often utilized waste management indicators to represent circular economy activities, this research introduces the circular material use rate as the principal independent variable. This methodological refinement enables a more direct and nuanced assessment of how material circularity affects aggregate GHG emissions. The empirical specification of the model is presented in Equation (1):
where , , , , , and denote GHG emissions, circular economy, natural capital, structural changes, environmental tax, and industrial activities, respectively. denotes the constant term, whereas , …, represent the parameters that need to be estimated, and is the error term.
3.3. Data
The dataset employed in this study comprises quarterly observations for Germany spanning the period from first quarter of 2010 to fourth quarter of 2022. Annual series were converted to quarterly frequency using the quadratic match-sum interpolation method, which enhances temporal granularity while preserving the integrity of annual aggregates. To improve the statistical properties of the data and facilitate meaningful interpretation, all variables were transformed into their natural logarithmic forms. This transformation helps stabilize variance, supports model linearity, and enables the interpretation of estimated coefficients as elasticities, thereby capturing proportional relationships among the variables within the econometric framework.
The dependent variable in this analysis is GHG emissions, measured in tons per capita and obtained from the Eurostat database. Unlike studies that focus solely on CO2 emissions, this broader metric captures the full spectrum of anthropogenic emissions contributing to climate change, thereby offering a more comprehensive assessment of environmental impact. To evaluate circular economy performance, this study adopts the circular material use rate as the key explanatory variable. Consistent with recent empirical work, such as Abbas and Imran [2] and Neves and Marques [46]. It is defined as the share of materials recovered and reintegrated into the production cycle. Data for this variable are also sourced from Eurostat, reflecting material circularity and resource efficiency within the economy. This rate quantifies the ratio of recycled materials reintegrated into the economy compared to the total materials utilized, underscoring the efficacy of circularity initiatives in diminishing dependence on new raw resources. Although we recognize that this proxy reflects but one facet of circularity, specifically material recirculation, it was chosen for its reliability, data accessibility, and formal application in European monitoring frameworks. To address the inherent limitation of depending on a singular indicator, we augment it with additional variables such as environmental tax revenue, industrial structure, and natural capital, which represent further dimensions of the circular economy, including institutional support, sectoral dynamics, and environmental sustainability. This multivariable technique guarantees a more thorough analysis while upholding scientific integrity and data reliability.
Natural capital, as defined by the United Nations Conference on Trade and Development (UNCTAD), refers to the economic value derived from a country’s stock of natural resources, including oil, natural gas, coal, minerals, forests, and agricultural land. It denotes the economic value generated from a nation’s inventory of natural resources, encompassing oil, natural gas, coal, minerals, forests, and agricultural land. Total natural resource rents are often quantified as a percentage of GDP, reflecting the income derived from the extraction and utilization of these resources, after accounting for extraction costs. This measure indicates the extent of a nation’s dependence on extractive and land-based activities for economic production. An increased proportion of natural resource rents in GDP signifies a greater reliance on natural capital, perhaps indicating susceptibility to commodity price volatility and sustainability issues if resource management is ineffective. The data on natural capital, accessible via the UNCTAD database, function as an effective proxy for evaluating the economic importance of natural resources and the possible environmental and structural consequences of resource reliance [47].
Structural changes denote the protracted transition of economic activity from low-productivity sectors, such as agriculture, to higher-productivity sectors, including manufacturing and services. This shift is essential for attaining sustained economic growth and development. UNCTAD evaluates structural change using variables like the sectoral composition of GDP and employment, the proportion of industry and services in economic output, the degree of export diversification and complexity, and the intensity of fixed capital creation. These indicators demonstrate the redistribution of resources among sectors and enhancements within sectors. Structural transformation entails recognizing and mitigating binding constraints, like insufficient infrastructure, restricted technical capability, and regulatory obstacles that hinder productivity improvements. By monitoring these developments, UNCTAD offers a framework for comprehending the evolution of economies toward more intricate and higher value-added industries. The data on natural capital and structural changes are freely available on the United Nations Conference on Trade and Development website (https://unctad.org/topic/least-developed-countries/productive-capacities-index) (accessed on 2 March 2025).
The role of environmental tax revenue is incorporated into the analysis to assess its impact on GHG emissions. This variable, measured as a percentage of total tax and social contribution revenues, serves as an economic instrument designed to internalize environmental externalities. By imposing a levy on each ton of GHG and CO2 emitted, environmental taxation aims to incentivize polluters to adopt more efficient and cost-effective abatement strategies. In doing so, it underscores the potential of fiscal policy to drive environmental improvements and promote sustainable practices within the economy. To measure the impact of industrialization, we use industrial activities as a proxy for industrialization (the data were collected from Eurostat).
3.4. Methodological Framework
The methodological framework employs advanced econometric techniques to analyze the relationship between GHG emissions and key explanatory variables. By incorporating both primary and control variables, the approach ensures a robust and comprehensive evaluation of their effects on environmental outcomes.
3.4.1. Unit Root Testing
Unit root tests play a crucial role in time series analysis by assessing the stability of data, a fundamental assumption that significantly influences the precision of statistical conclusions and forecasts. The Augmented Dickey–Fuller (ADF) and Phillips–Perron (PP) tests are frequently utilized to identify unit roots, providing insights into the temporal characteristics of the series. Detecting non-stationarity via these tests aids in avoiding misleading regression outcomes and informs the choice of appropriate modeling techniques.
The ADF test is defined by the following Equation (2):
where denotes the vector of deterministic components. This test assesses whether a unit root exists in the time series, allowing for the evaluation of data stationarity. Similarly, the PP test is expressed as indicated in Equation (3):
where denotes the first differences of , is the coefficient of the lagged series , and is the error term. Both tests play a crucial role in assessing the long-term characteristics and trends within the data, confirming that the assumptions supporting the statistical analysis are both valid and reliable.
3.4.2. Cointegration Testing
This study employed the Johansen cointegration test, which was developed by Johansen and Juselius [48] and Johansen [49]. This test is considered a powerful statistical method used to examine the presence of long-run equilibrium relationships among multiple non-stationary time series variables that are integrated in the same order, typically I(1). Unlike other cointegration techniques that can only analyze two variables, the Johansen test enables the simultaneous evaluation of multiple variables within a vector autoregressive framework, which makes it particularly useful in multivariate settings. One of its key advantages lies in its ability to determine not just the existence of cointegration but also the number of distinct cointegrating vectors, which offers a deeper understanding of the dynamics among variables. The test offers two approaches, such as the trace test and the maximum eigenvalue test, each providing evidence for the number of cointegrating relationships. This method is crucial in time series analysis because it helps researchers avoid spurious regressions by ensuring that only variables with a valid long-term association are modeled together. Overall, the Johansen test is important for analyzing related time series data, like in economics or finance, where it is vital to understand both long-term balance and short-term changes.
3.4.3. Wavelet Coherence Analysis
WCA has emerged as a significant approach in economics for analyzing the dynamic relationships and interactions among economic time series. Initially formulated by Goupillaud and Grossmann [50], the WCA has been extensively utilized in various fields, including economics, owing to its capacity to capture time-varying associations. Economic variables frequently undergo changes and exhibit varying relationships over time. WCA facilitates the examination of how these relationships and their timing differ across various time periods and frequencies. In contrast to cross-wavelet analysis, which is limited to specific frequency points due to scale smoothing, WCA effectively captures correlation patterns across a wider frequency spectrum, providing valuable insights into cycles and relationships within economic data. When applied alongside econometric methods such as FMOLS and DOLS, which emphasize long-term relationships, WCA provides supplementary insights by revealing complex, time-varying connections that traditional methods may fail to capture. This combination enables a more detailed and thorough understanding of complex economic phenomena.
The Morlet wavelet family, which has the following mathematical definition, is used to introduce WCA in the present study. The Morlet wavelet, which is used in this research and described in Equation (4), makes it possible to examine economic variables at various time and frequency levels and get a thorough grasp of their interactions:
where denotes the wavelet function, serves as normalization constant, corresponds to a complex sinusoid with Gaussian unit standard deviation, represents the Gaussian envelope, and defines the central frequency of the wavelet. This formulation integrates a sinusoidal oscillation modulated by a Gaussian window, enabling precise localization in both time and frequency domains. Subsequently, the original time series is transformed into the time–frequency space through convolution with scaled and translated versions of the wavelet function. is thereby mapped into as formalized in Equation (5):
where represents the wavelet function localized in both time and frequency domains, where indicates its position in the time domain denotes the corresponding frequency component, and t is the time variable. The normalization factor is given by , which ensures energy preservation across different scales. To further explore the dynamic interactions between two time series, the cross-wavelet transform (CWT), denoted as ( is introduced and formalized in Equation (6). This transformation enables the identification of time-varying coherence and phase relationships, providing a detailed understanding of their co-movement and synchronization across multiple time–frequency scales:
where represents the original time series, which is analyzed using the formulation presented in Equation (7):
Furthermore, the wavelet power spectrum (WPS), as defined in Equation (8), measures the distribution of variance within a time series across both time and frequency domains:
where denotes the wavelet power spectrum. The next step entails estimating the dependency structure in the time–frequency domain through the application of CWT power analysis as given by Equation (9):
where represents the CWT of two time series in the time–frequency domain. and denote CWT of the individual time series at and , respectively. The magnitude and consistency of their co-movement is calculated through WCA, expressed by in Equation (10):
The strength of the interaction between two time series is measured using WCA, defined by in Equation (11). This metric represents the squared correlation coefficient in time–frequency domain ranging from 0 to 1 (0 ≤ ≤ 1). A value of close to 1 indicates a strong correlation at a specific time and frequency, typically illustrated in red and enclosed black contour lines. Conversely, value near 0, shown in blue, suggest weak or no correlation. The smoothing function C ensures stability of coherence estimate over time. Additionally, the phase angle, defined in Equation (11), provides the lead–lag relationship between the two variables:
where denotes the phase angle. The equation represents the ratio of the imaginary component and real component of CWT.
3.4.4. Robust Analyses
FMOLS and DOLS are advanced statistical methods designed to provide accurate and fair estimates of long-term connections in systems that are cointegrated. FMOLS reduces issues of endogeneity and serial correlation by making semi-parametric changes to the standard OLS estimator, resulting in estimates of the cointegrating vector that are nearly unbiased and reliable as the sample size increases. FMOLS reduces problems of endogeneity and serial correlation by making adjustments to the standard OLS estimator, which helps provide reliable and accurate estimates of the cointegrating vector over time. Both methods are primarily focused on accurately estimating long-run equilibrium relationships while correcting for statistical issues that commonly affect non-stationary time series. Equation (12) presents the FMOLS and DOLS:
where represent the estimators derived from the FMOLS and DOLS methods, respectively. The corresponding t-statistics for these estimators can be computed as outlined in Equation (13):
4. Results and Discussions
4.1. Summary Statistics
In this study, statistical indicators such as skewness and kurtosis were utilized to evaluate the distributional characteristics of the data, offering preliminary insights into deviations from normality. For normality, the Jarque and Bera [51] was employed. The results, as presented in Table 1, indicate that all variables except and exhibit nonlinear behavior, as they reject the null hypothesis (p < 0.05).

Table 1.
Summary statistics.
Moreover, the correlation matrix reveals moderate to strong relationships among certain variables, such as between structural change and industrial activity (0.794) and between circular economy and environmental taxes (−0.777), suggesting potential overlaps in explanatory power, as given by Table 2. However, no pairwise correlation exceeds the conventional threshold of ±0.80, indicating that severe multicollinearity is unlikely. Furthermore, to further assess this, the authors employed the variance inflation factor (VIF) test, which measures how much the variance of an estimated regression coefficient increases due to collinearity. All VIF values were found to be within acceptable limits (below 10), confirming that multicollinearity does not pose a significant threat to the stability or interpretability of the regression models. This two-pronged approach, examining both the correlation matrix and VIF ensured that the predictors used in the model were sufficiently independent for robust econometric analysis.
Table 2.
Correlation matrix and variance inflation factor.
4.2. Unit Root Test
The unit root test results from both the ADF and PP methods indicate that all variables are non-stationary at their level forms, as evidenced by test statistics that do not reject the presence of a unit root. However, upon first differencing, each variable becomes stationary, with test statistics exceeding the critical values at either the 1% or 5% significance levels. This suggests that all series are integrated into order one, I(1), confirming the necessity to apply cointegration techniques for investigating their long-run relationships as given by Table 3. The results validate the suitability of employing advanced econometric methods such as FMOLS and DOLS in the subsequent analysis.
Table 3.
Unit root test.
4.3. Cointegration Test
The Johansen test results provide evidence of cointegration among the variables. The trace test statistic at the null hypothesis of no cointegration (rank = 0) is 94.262, which
exceeds the critical value of 83.937, and the associated p-value (0.007) is below 0.01, indicating rejection of the null at the 1% significance level. Similarly, the maximum eigenvalue test also rejects the null hypothesis of no cointegration with a statistic of 52.369, surpassing the critical value of 36.630. At the null of at most one cointegrating vector (rank ≤ 1), the trace test statistic (60.406) is slightly below the critical value (61.893) but still significant at the 5% level, while the maximum eigenvalue test
statistic (46.066) exceeds the critical value (30.440), confirming at least one cointegrating relationship as given by Table 4. For rank ≤ 2, both tests fail to reject the null, suggesting no additional cointegrating vectors beyond those identified. Overall, these results indicate the
presence of one or two stable long-run equilibrium relationships among the variables under study.
Table 4.
Cointegration test.
4.4. Results of Wavelet Coherence Analysis
WCA differs fundamentally from traditional time-series methods by capturing the dynamic relationships between variables not only over time but also across different frequency bands. While conventional methods, such as standard cointegration or regression techniques, typically assume stable relationships over the entire sample period and focus on average long-run or short-run effects, WCA uncovers how these relationships evolve and vary at different cyclical scales. This allows for the detection of transient, periodic, or cyclical co-movements that traditional approaches often miss. Furthermore, WCA provides information on phase differences, revealing lead–lag patterns and the timing of interactions between variable features that traditional models generally do not address. This makes WCA especially valuable for analyzing economic and environmental data, where relationships can fluctuate due to policy shifts, technological changes, or external shocks, offering a richer and more nuanced understanding of complex and time-varying interdependencies.
The WCA, illustrated in Figure 2, employs the cone of influence and Monte Carlo simulations to assess the significance of these relationships over time. The analysis captures the simultaneous causation and correlation between GHG emissions and their explanatory factors across both time and frequency domains, aligning with our previous hypotheses and findings. This method, integrating econophysics concepts, provides a nuanced view of how these interactions evolve from first quarter of 2010 to fourth quarter of 2022.
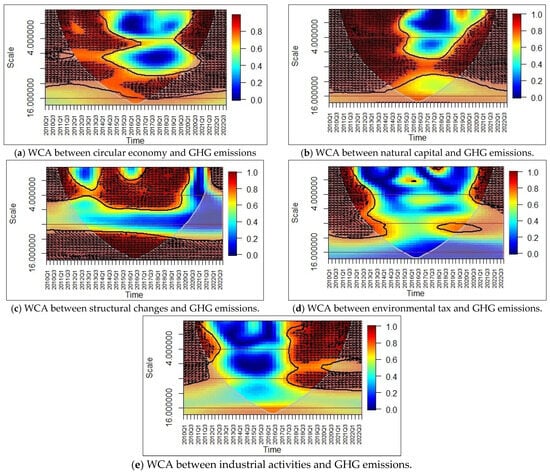
Figure 2.
In the wavelet coherence plots, time is represented on the horizontal axis, while frequency is depicted on the vertical axis. Areas of statistically significant coherence at the 5% level are enclosed by black contours. Regions of strong co-movement between variables are indicated by warmer colors (e.g., red), whereas cooler colors (e.g., blue) reflect weak or no co-movement. Directional arrows illustrate the phase relationship and lead–lag dynamics between the two variables. Arrows pointing to the right (→) denote a positive correlation, while those pointing to the left (←) signify a negative correlation. Diagonal arrows (↗, ↙) indicate that the first variable leads the second, whereas (↖, ↘) suggest the second variable leads the first. Vertical arrows pointing upward (↑) and downward (↓) imply that the first variable is leading or lagging, respectively. This graphical representation enables the detection of time-varying interdependencies and causal directions across different frequency bands.
Our analysis reveals that GHG emissions and circular economy exhibit a strong negative correlation throughout the period. This is consistent with our earlier findings, where the circular economy was identified as a significant predictor of environmental sustainability. The upward and leftward arrows in Figure 2a reinforce this relationship, indicating that improvements in the circular economy decrease the GHG emissions. The significant negative correlation between GHG emissions and the circular economy in Germany indicates the country’s successful execution of circular economy strategies designed to improve environmental sustainability. Germany has established itself as a leader in waste management, recycling, and resource efficiency, underpinned by rigorous environmental regulations, circular product design policies, and robust institutional frameworks. These measures decrease material extraction and energy consumption, thereby directly reducing emissions. Furthermore, investments in circular innovation, including remanufacturing, eco-design, and extended producer responsibility, have led to reductions in industrial waste and enhancements in energy efficiency across various sectors. The shift toward a circular economy in Germany is consistent with overarching EU climate objectives, fostering policy alignment and strengthening the decarbonization of production and consumption systems. The aforementioned factors elucidate the correlation between advancements in the circular economy and the reduction of GHG emissions.
Conversely, Figure 2b illustrates leftward arrows across various frequencies from the first quarter of 2010 to the fourth quarter of 2022, reinforcing the negative relationship and indicating that natural capital effectively mitigates GHG emissions over time. This indicates a consistent negative correlation between natural capital and GHG emissions in Germany. Increased preservation of natural capital encompassing forests, wetlands, and biodiversity-rich ecosystems improves carbon sequestration capacity and mitigates environmental degradation, thus facilitating ongoing reductions in GHG emissions.
Furthermore, the analysis in Figure 2c shows a negative correlation between structural changes and GHG emissions throughout the period. There is a persistent negative correlation between structural changes and GHG emissions in Germany, as shifts from carbon-intensive industries toward service-oriented and technology-driven sectors reduce the economy’s overall emission intensity and support long-term decarbonization.
Figure 2d illustrates a consistent negative correlation between environmental tax and GHG emissions in Germany from first quarter of 2010 to fourth quarter of 2014, as well as from first quarter of 2020 to fourth quarter of 2022. This suggests that environmental tax policies were effectively implemented and enforced during these intervals. The increase in these taxes raised the costs associated with polluting activities, thereby encouraging firms and consumers to transition to more energy-efficient technologies and cleaner fuels. Furthermore, revenue generated from environmental taxes was likely reinvested in sustainable infrastructure and innovation, thereby enhancing emission reductions. The resurgence of this trend in the post-2020 period may indicate Germany’s strengthened climate policies in accordance with the European Green Deal and post-pandemic green recovery initiatives, which prioritize decarbonization and sustainable growth.
Figure 2e illustrates a positive correlation between GHG emissions and industrial activities, particularly notable from first quarter of 2010 to fourth quarter of 2012 and from second quarter of 2017 to fourth quarter of 2022, underscoring the ongoing environmental impact of Germany’s industrial sector. During these periods, industrial expansion likely entailed increased energy consumption, higher production volumes, and greater dependence on carbon-intensive inputs, all of which directly contribute to elevated GHG emissions. The rightward arrows indicate a reinforcing relationship, wherein economic growth propelled by industrial production is closely associated with emissions growth. Despite persistent initiatives to enhance sustainability in the industrial sector, reliance on conventional manufacturing, chemicals, and heavy industries may have constrained the decoupling of emissions from industrial activities in recent years. This highlights the necessity of expediting industrial decarbonization via cleaner technologies, enhanced energy efficiency, and sustainable resource utilization.
To summarize, the WCA enhances our understanding of the time-varying relationships between energy diversification and key economic variables, reinforcing our previous results and hypotheses. These findings offer valuable insights into how dynamic interactions between these factors influence GHG emissions and provide a comprehensive view of the temporal and frequency-specific associations.
4.5. Robustness Check: FMOLS and DOLS
For robustness checks, two additional cointegration techniques, FMOLS and DOLS, were applied. These methods effectively address common issues in time series analysis, such as endogeneity and serial correlation. FMOLS corrects for serial correlation by applying a semi-parametric correction to the ordinary least squares estimator, while DOLS incorporates leads and lags of the differenced regressors to eliminate simultaneity bias, ensuring unbiased long-run parameter estimates. These features make FMOLS and DOLS ideal complementary approaches to validate the credibility of long-run associations among the variables.
Table 5 shows that the negative and statistically significant effects of circular economy, natural capital, structural changes, and environmental tax on GHG emissions are consistently confirmed. For instance, the circular economy coefficient is −0.718 (DOLS) and −0.863 (FMOLS), both statistically significant at the 1% level. While the magnitude is somewhat larger in FMOLS and DOLS, this is not uncommon due to differing treatment of autocorrelation and endogeneity. The stronger coefficients in these methods suggest that the mitigating impact of circular economy practices may, in fact, be more pronounced when potential statistical distortions are addressed. This finding supports the notion that circularity contributes to emission reductions through resource efficiency and waste minimization. This result suggests that as the circular economy develops, GHG emissions decrease, highlighting the effectiveness of circular economy practices in mitigating environmental impact. This outcome aligns with previous research, such as the work of Hailemariam and Erdiaw-Kwasie [25] and Gallego-Schmid and Chen [23], which similarly found that circular economy initiatives play a critical role in reducing environmental footprints. Our study contradicts the findings of Eweade and Akadiri [52], who showed that the use of combustible renewable waste adversely affects the ecological footprint. The results support a complementary role for circular economy practices within a broader decarbonization strategy, particularly when integrated with other mechanisms, such as environmental taxation and structural economic reforms. This adjustment ensures that our recommendations are proportionate to the strength of the empirical evidence. The observed negative long-run relationship between the circular economy and GHG emissions aligns with prior studies suggesting that material circulation reduces pressure on virgin resource extraction and industrial energy usage. These findings confirm that circular practices such as increased recycling rates, product reuse, material recovery, and improved resource efficiency contribute meaningfully to emission reduction in Germany. The negative and significant coefficients reflect the environmental payoff of Germany’s long-standing commitment to circular economy principles, supported by strict regulations, strong public awareness, and innovation in sustainable design and manufacturing.
Table 5.
Robustness check.
The relationship between natural capital and GHG emissions is negative in both methods. With coefficients of −0.243 (DOLS) and −0.247 (FMOLS), the results indicate that improved management and preservation of natural resources significantly contribute to lowering GHG emissions in Germany. This result underscores the crucial role of ecosystem-based assets such as forests, peatlands, and sustainably managed agricultural land in mitigating emissions. These findings align with earlier studies. For example, Murdiyarso and Purbopuspito [53] emphasize the climate mitigation potential of peatland and mangrove restoration in tropical regions. Zhang and Iqbal [11] revealed that natural capital stocks significantly benefit the Chinese ecosystem and reduce GHG emissions, CO2 emissions, gaseous fuel, CO2 emissions, solid fuel, and carbon intensity in China. In Germany, natural capital encompassing forests, peatlands, and sustainable agricultural land exhibits a substantial inverse correlation with GHG emissions, indicating that the preservation or enhancement of natural capital is associated with a reduction in emissions. German woods encompass around 32% of the territory and trap over 62 million tons of CO2 each year, functioning as significant carbon sinks. Peatland restoration initiatives are decreasing emissions from formerly degraded regions that formerly released up to 40 million tons of CO2 emissions annually. From 1990 to 2023, Germany decreased its GHG emissions by 46%, mostly attributable to nature-based measures. These initiatives demonstrate that investment in natural ecosystems is integral to Germany’s climate strategy, directly facilitating emission reductions and aiding the nation’s objective of achieving climate neutrality by 2045.
Similarly, structural changes that capture economic transformation from low- to high-productivity sectors maintain their negative influence on GHG emissions, with coefficients of −0.213 (DOLS) and −0.270 (FMOLS), further validating the hypothesis that economic modernization has environmental benefits when strategically directed. Our results are consistent with previous studies, such as in Europe [54], by changing the industrial structure, and in Africa [55] and E7 [56], through the service sector as it is less energy-intensive when compared to the production of goods. Structural transformations in Germany’s economy, transitioning from heavy industrial to a mostly service-oriented and technology-driven paradigm, have shown a considerable inverse correlation with GHG emissions, considerably facilitating their reduction. Since 1990, Germany has decreased its GHG emissions by around 46%, decreasing from 1251 million tons of CO2-equivalent to 676 million tons in 2023, but its GDP has consistently expanded, signifying a decoupling of economic development from emissions. Significant variables include the reduction of coal-derived energy production, which decreased from over 50% of power generation in 1990 to around 27% in 2023, alongside the ascendance of renewable energy sources, presently representing almost 52% of electricity output. The reunification of Germany resulted in the closure of several inefficient, high-emission industries in former East Germany, hence expediting emission reductions. These structural transformations highlight the synergy between economic modernization and decarbonization.
The environmental tax variable, intended to capture the impact of fiscal policy on emissions, also has a negative relationship with GHG emissions, with coefficients of −0.209 (DOLS) and −0.224 (FMOLS). This highlights the effectiveness of taxation mechanisms in discouraging environmentally harmful behavior and incentivizing cleaner practices. This result is consistent with previous studies such as Doğan and Chu [35] and Wolde-Rufael and Mulat-Weldemeskel [36], etc. In Germany, environmental taxes have shown a significant inverse relationship with GHG emissions by establishing financial incentives to mitigate pollution and encourage cleaner technology. Implemented in 1999, Germany’s eco-tax reform elevated taxes on fossil fuels while diminishing labor taxes, promoting energy efficiency, and cutting emissions. Between 1999 and 2003, the tax on gasoline increased by EUR 0.15 per liter, resulting in a significant decrease in fuel use and vehicle emissions. As of 2023, Germany has established a carbon pricing mechanism for sectors such as transportation and heating, beginning at EUR 25 per ton of CO2 in 2021 and escalating to EUR 30 by 2022, with intentions for further increments. These policies facilitated a wider trend of emission reduction, GHG emissions decreased by about 46% from 1990 to 2023, underscoring the efficacy of fiscal policy instruments such as environmental taxes in promoting climate action and aiding the transition to a low-carbon economy.
Results of FMOLS and DOLS show that there is a positive relationship between industrial activities and GHG emissions, as indicated by the positive coefficients at 0.184 (DOLS) and 0.197 (FMOLS). This suggests that industrial output remains a major contributor to GHG emissions in Germany. This aligns with expectations, given the energy-intensive nature of industrial sectors in Germany. The persistence of this relationship across all models underscores the challenge of aligning industrial policy with environmental objectives. The results are consistent with previous studies, which show that industrial activities increase emissions such that in OPEC countries [39], in Bangladesh [57], etc. Industrial activities in Germany have a strong correlation with GHG emissions, serving as a significant source of energy consumption and carbon production. The industrial sector, including manufacturing, chemicals, and metallurgy, accounts for around one-fourth of Germany’s total GHG emissions. Energy-intensive sectors, like steel, cement, and chemical manufacturing, mostly depend on fossil fuels, especially natural gas and coal, therefore substantially adding to emissions. Notwithstanding enhancements in efficiency and technical progress, industrial production continues to be intricately associated with emissions levels; throughout phases of industrial expansion, exemplified by the early 2000s, emissions concurrently rose. This relationship highlights the difficulty of decarbonizing Germany’s industrial sector while preserving economic competitiveness.
Overall, the adjusted R2 values of 0.988 for DOLS and 0.958 for FMOLS indicate a strong model fit and further affirm the explanatory power of the selected variables. The consistent results across methods support evidence-based recommendations promoting the circular economy, taxing environmental externalities, protecting natural capital, and structurally shifting the economy toward greener sectors to effectively mitigate GHG emissions in Germany.
5. Conclusions and Policy Implications
5.1. Concluding Remarks
Germany is instrumental in the EU’s endeavors to mitigate GHG emissions by advocating for a circular economy. Germany, the EU’s largest economy and a leader in industrial innovation, establishes standards for sustainable practices by incorporating resource efficiency, waste reduction, and recycling into its production and consumption systems. Its robust policies regarding waste management, eco-design, and extended producer responsibility not only contribute to the reduction of emissions within the country but also have a significant impact on the development of EU-wide regulations and best practices. Germany makes a substantial contribution to the EU’s climate objectives by advocating for circular economy principles, which are instrumental in the continent’s transition to a resource-efficient, low-carbon future.
This study employs WCA, FMOLS, and DOLS to examine the long-term and dynamic relationships between the circular economy, natural capital, structural changes, environmental tax, industrial activities, and GHG emissions in Germany from first quarter of 2010 to fourth quarter of 2022. The Johansen cointegration test using FMOLS and DOLS confirms the existence of a stable long-run equilibrium relationship between these variables. WCA also reveals the frequency-specific and time-varying co-movements between the explanatory variables and GHG emissions, illuminating how these connections change across various time periods. The findings show that industrial operations significantly and favorably affect GHG emissions, but environmental taxes, the circular economy, structural modifications, and the preservation of natural capital all have a negative effect on emissions. By optimizing material flows and lowering dependency on non-metallic minerals and fossil fuels, these results demonstrate the critical role that circular economy practices play in lowering GHG emissions.
5.2. Policy Implications
This section outlines five policy implications for Germany aimed at reducing GHG emissions through the integration of circular economy principles, natural capital considerations, and structural changes, including:
Germany ought to introduce tax incentives, subsidies, or innovation grants for enterprises that embrace circular economy practices, including product-as-a-service, remanufacturing, or zero-waste production, to separate economic growth from resource consumption and emissions. Policies should prioritize the restoration and preservation of ecosystems, such as forests, wetlands, and soils, which function as carbon sinks. Incentive programs aimed at promoting biodiversity-friendly agriculture and sustainable forestry can improve natural carbon sequestration. Structural changes must involve the transition of energy- and carbon-intensive sectors, such as steel, chemicals, and automotive, toward cleaner technologies by promoting green research and development, electrification, and circular supply chains. Germany could enhance its carbon pricing mechanisms and implement material use efficiency standards in critical sectors, ensuring appropriate valuation of natural resources and the internalization of emissions in economic decision-making. Structural economic shifts require labor market policies that facilitate retraining, education, and workforce mobility in circular and green sectors, thereby ensuring a just transition for workers impacted by decarbonization.
While macro-level recommendations such as green taxation, investment in circular infrastructure, and ecological conservation remain essential, it is equally important to assess the effectiveness of Germany’s existing regulatory instruments. The revised Circular Economy and Waste Management Act (KrWG) has laid a strong legal foundation for waste prevention, resource efficiency, and extended producer responsibility. However, implementation gaps persist in areas such as plastic recycling quality, e-waste traceability, and industrial resource loops. Policymakers should strengthen monitoring and enforcement mechanisms, expand digital product passports, and incentivize the circular design of products through stricter eco-design standards.
Furthermore, the Russia–Ukraine conflict has expedited Germany’s transition from reliance on fossil fuels, presenting a rare chance to harmonize industrial decarbonization with the objectives of the circular economy. Targeted policies could involve financial help for energy-heavy industries to produce more efficiently, rules for government buying that prioritize circular materials, and training for small and medium-sized enterprises to use circular business models. These actionable, sector-specific measures would ensure that Germany sustains its circular leadership and builds industrial resilience in a rapidly changing geopolitical and energy landscape.
5.3. Research Limitations
While this study offers meaningful insights into the relationship between the circular economy and GHG emissions in Germany, it is subject to several limitations that should be acknowledged.
First, although advanced techniques such as WCA were employed to capture temporal variations, concerns about potential endogeneity remain. The finding that the circular economy and GHG emissions influence each other indicates that there may be feedback effects, which complicates the basic assumptions used in traditional methods like FMOLS and DOLS. As these estimators are used for robustness testing, the coefficient estimates should be interpreted cautiously, as they may not fully represent the pure causal effects. Future research could improve this issue by using instrumental variable (IV) methods or system-based estimators like GMM to better manage endogeneity and enhance the understanding of cause and effect.
Second, the study relies primarily on the circular material use rate as a proxy for the circular economy. While this indicator is widely recognized and officially reported by Eurostat, it captures only one dimension of circularity, ‘material recirculation’, potentially omitting other important aspects, such as product lifespan, eco-design, and digital innovation. Even though extra factors like environmental tax revenue and industrial structure were added to improve the model, future studies could be more helpful if they created and used combined or multi-faceted measures of the circular economy.
Third, the analysis is confined to Germany and, therefore, may not be generalizable to countries with different economic structures, policy regimes, or levels of industrial development. Comparative studies across different industries, multiple countries, or regions would offer greater clarity about how circular economy practices interact with emission trends under varying institutional and environmental conditions.
Lastly, the study is based on annual data, which, while consistent and reliable, may not fully capture short-term fluctuations or intra-annual policy effects. The inclusion of higher-frequency or disaggregated sectoral data in future research could allow for more granular analysis.
5.4. Suggestions for Future Studies
Future research might build on this analysis by comparing how varied legislative settings and industry structures impact the relationship between circular economy practices and emissions in different countries. It would also be helpful to do studies on certain sectors to find out how circular strategies affect various industries in different ways. Also, using composite indicators that show more than one aspect of circularity and considering institutional and behavioral elements might provide us with a better picture. Using nonlinear models and quasi-experimental approaches would make causal inference even stronger. Simulation-based forecasting might look at the long-term consequences of different circular economy policy scenarios.
Author Contributions
Conceptualization, H.C. and G.Z.; methodology, G.Z.; software, M.R.; validation, G.Z.; formal analysis, H.C.; investigation, G.Z.; resources, G.Z.; data curation, M.R.; writing—original draft preparation, H.C.; writing—review and editing, M.R.; visualization, G.Z.; supervision, G.Z.; All authors have read and agreed to the published version of the manuscript.
Funding
This work is supported by “The Key Project of Philosophy and Social Science Research in Colleges and Universities in Jiangsu Province” [Grant: 2021SJZDA139].
Institutional Review Board Statement
Not applicable.
Informed Consent Statement
Not Applicable.
Data Availability Statement
The data used for this research are publicly available.
Acknowledgments
The authors acknowledge the use of ChatGPT (GPT-4 version) to enhance the readability and linguistic clarity of the manuscript during its preparation. All content generated with the assistance of this tool was thoroughly reviewed and revised by the authors to ensure accuracy, coherence, and alignment with the research objectives. The authors accept full responsibility for the content and conclusions presented in the published article.
Conflicts of Interest
The authors declare no conflicts of interest.
References
- Nazarko, J.; Chodakowska, E.; Nazarko, Ł. Evaluating the Transition of the European Union Member States towards a Circular Economy. Energies 2022, 15, 3924. [Google Scholar] [CrossRef]
- Abbas, Q.; Imran, M.; Sattar, A. From linear to circular: The impact of economic policies and technological innovations on greenhouse gas emissions in the Netherlands. Carbon Balance Manag. 2025, 20, 11. [Google Scholar] [CrossRef] [PubMed]
- Chioatto, E.; Sospiro, P. Transition from waste management to circular economy: The European Union roadmap. Environ. Dev. Sustain. 2023, 25, 249–276. [Google Scholar] [CrossRef]
- Costanza, R.; d’Arge, R.; de Groot, R.; Farber, S.; Grasso, M.; Hannon, B.; Limburg, K.; Naeem, S.; O’Neill, R.V.; Paruelo, J.; et al. The value of the world’s ecosystem services and natural capital. Nature 1997, 387, 253–260. [Google Scholar] [CrossRef]
- Kirikkaleli, D.; Ali, M. Resource efficiency, energy productivity, and environmental sustainability in Germany. Environ. Dev. Sustain. 2024, 26, 13139–13158. [Google Scholar] [CrossRef]
- Li, R.; Wang, Q.; Wang, X.; Zhou, Y.; Han, X.; Liu, Y. Germany’s contribution to global carbon reduction might be underestimated–a new assessment based on scenario analysis with and without trade. Technol. Forecast. Soc. Change 2022, 176, 121465. [Google Scholar] [CrossRef]
- Grossman, G.M.; Krueger, A.B. Environmental Impacts of a North American Free Trade Agreement; National Bureau of Economic Research: Cambridge, MA, USA, 1991. [Google Scholar]
- Mol, A.P.; Spaargaren, G. Ecological modernisation theory in debate: A review. Environ. Politics 2000, 9, 17–49. [Google Scholar] [CrossRef]
- Bekun, F.V.; Alola, A.A.; Gyamfi, B.A.; Yaw, S.S. The relevance of EKC hypothesis in energy intensity real-output trade-off for sustainable environment in EU-27. Environ. Sci. Pollut. Res. 2021, 28, 51137–51148. [Google Scholar] [CrossRef]
- Mohajan, H.K. Germany is ahead to implement sustainable circular economy. J. Econ. Dev. Environ. People 2021, 10, 46–64. [Google Scholar]
- Zhang, Q.; Iqbal, S.; Shahzad, F. Role of environmental, social, and governance (ESG) investment and natural capital stocks in achieving net-zero carbon emission. J. Clean. Prod. 2024, 478, 143919. [Google Scholar] [CrossRef]
- Savona, M.; Ciarli, T. Structural Changes and Sustainability. A Selected Review of the Empirical Evidence. Ecol. Econ. 2019, 159, 244–260. [Google Scholar] [CrossRef]
- Brown, B.; Spiegel, S.J. Coal, Climate Justice, and the Cultural Politics of Energy Transition. Glob. Environ. Politics 2019, 19, 149–168. [Google Scholar] [CrossRef]
- Saxena, V. Water Quality, Air Pollution, and Climate Change: Investigating the Environmental Impacts of Industrialization and Urbanization. Water Air Soil Pollut. 2025, 236, 73. [Google Scholar] [CrossRef]
- Guo, J.; Ali, S.; Xu, M. Recycling is not enough to make the world a greener place: Prospects for the circular economy. Green Carbon 2023, 1, 150–153. [Google Scholar] [CrossRef]
- Stahel, W.R. The Circular Economy: A User’s Guide; Routledge: Abingdon, UK, 2019. [Google Scholar]
- Slorach, P.C.; Jeswani, H.K.; Cuéllar-Franca, R.; Azapagic, A. Environmental sustainability of anaerobic digestion of household food waste. J. Environ. Manag. 2019, 236, 798–814. [Google Scholar] [CrossRef]
- Aguilar-Hernandez, G.A.; Rodrigues, J.F.D.; Tukker, A. Macroeconomic, social and environmental impacts of a circular economy up to 2050: A meta-analysis of prospective studies. J. Clean. Prod. 2021, 278, 123421. [Google Scholar] [CrossRef]
- Cudjoe, D.; Zhu, B.; Nketiah, E.; Wang, H.; Chen, W.; Qianqian, Y. The potential energy and environmental benefits of global recyclable resources. Sci. Total Environ. 2021, 798, 149258. [Google Scholar] [CrossRef]
- Li, J.; Song, G.; Cai, M.; Bian, J.; Mohammed, B.S. Green environment and circular economy: A state-of-the-art analysis. Sustain. Energy Technol. Assess. 2022, 52, 102106. [Google Scholar] [CrossRef]
- Bayar, Y.; Gavriletea, M.D.; Sauer, S.; Paun, D. Impact of Municipal Waste Recycling and Renewable Energy Consumption on CO2 Emissions across the European Union (EU) Member Countries. Sustainability 2021, 13, 656. [Google Scholar] [CrossRef]
- Caglar, A.E.; Gökçe, N.; Şahin, F. Sustaining environment through municipal solid waste: Evidence from European Union economies. Environ. Sci. Pollut. Res. 2024, 31, 6040–6053. [Google Scholar] [CrossRef]
- Gallego-Schmid, A.; Chen, H.-M.; Sharmina, M.; Mendoza, J.M.F. Links between circular economy and climate change mitigation in the built environment. J. Clean. Prod. 2020, 260, 121115. [Google Scholar] [CrossRef]
- Magazzino, C.; Mele, M.; Schneider, N.; Sarkodie, S.A. Waste generation, wealth and GHG emissions from the waste sector: Is Denmark on the path towards circular economy? Sci. Total Environ. 2021, 755, 142510. [Google Scholar] [CrossRef] [PubMed]
- Hailemariam, A.; Erdiaw-Kwasie, M.O. Towards a circular economy: Implications for emission reduction and environmental sustainability. Bus. Strategy Environ. 2023, 32, 1951–1965. [Google Scholar] [CrossRef]
- Costanza, R. Social Goals and the Valuation of Natural Capital. Environ. Monit. Assess. 2003, 86, 19–28. [Google Scholar] [CrossRef]
- Bocken, N.M.P.; de Pauw, I.; Bakker, C.; van der Grinten, B. Product design and business model strategies for a circular economy. J. Ind. Prod. Eng. 2016, 33, 308–320. [Google Scholar] [CrossRef]
- Geissdoerfer, M.; Savaget, P.; Bocken, N.M.; Hultink, E.J. The Circular Economy—A new sustainability paradigm? J. Clean. Prod. 2017, 143, 757–768. [Google Scholar] [CrossRef]
- Kirchherr, J.; Bauwens, T.; Ramos, T. Circular disruption: Concepts, enablers and ways ahead. Bus. Strat. Environ. 2022, 32, 1005–1009. [Google Scholar] [CrossRef]
- Marra, A.; Colantonio, E.; Cucculelli, M.; Nissi, E. The ‘complex’ transition: Energy intensity and CO2 emissions amidst technological and structural shifts. Evidence from OECD countries. Energy Econ. 2024, 136, 107702. [Google Scholar] [CrossRef]
- Adebayo, T.S.; Oladipupo, S.D.; Rjoub, H.; Kirikkaleli, D.; Adeshola, I. Asymmetric effect of structural change and renewable energy consumption on carbon emissions: Designing an SDG framework for Turkey. Environ. Dev. Sustain. 2023, 25, 528–556. [Google Scholar] [CrossRef]
- Eichner, T.; Pethig, R. Kantians defy the economists’ mantra of uniform Pigovian emissions taxes. Ecol. Econ. 2022, 200, 107514. [Google Scholar] [CrossRef]
- Ghazouani, A.; Jebli, M.B.; Shahzad, U. Impacts of environmental taxes and technologies on greenhouse gas emissions: Contextual evidence from leading emitter European countries. Environ. Sci. Pollut. Res. 2021, 28, 22758–22767. [Google Scholar] [CrossRef] [PubMed]
- Hsu, C.-C.; Zhang, Y.; Ch, P.; Aqdas, R.; Chupradit, S.; Nawaz, A. A step towards sustainable environment in China: The role of eco-innovation renewable energy and environmental taxes. J. Environ. Manag. 2021, 299, 113609. [Google Scholar] [CrossRef] [PubMed]
- Doğan, B.; Chu, L.K.; Ghosh, S.; Truong, H.H.D.; Balsalobre-Lorente, D. How environmental taxes and carbon emissions are related in the G7 economies? Renew. Energy 2022, 187, 645–656. [Google Scholar] [CrossRef]
- Wolde-Rufael, Y.; Mulat-Weldemeskel, E. Effectiveness of environmental taxes and environmental stringent policies on CO2 emissions: The European experience. Environ. Dev. Sustain. 2023, 25, 5211–5239. [Google Scholar] [CrossRef]
- Dean, J.M. Does trade liberalization harm the environment? A new test. Can. J. Econ. 2002, 35, 819–842. [Google Scholar] [CrossRef]
- Porter, M.E.; Linde, C.V.D. Toward a new conception of the environment-competitiveness relationship. J. Econ. Perspect. 1995, 9, 97–118. [Google Scholar] [CrossRef]
- Azam, M.; Rehman, Z.U.; Ibrahim, Y. Causal nexus in industrialization, urbanization, trade openness, and carbon emissions: Empirical evidence from OPEC economies. Environ. Dev. Sustain. 2022, 24, 13990–14010. [Google Scholar] [CrossRef]
- Michelini, G.; Moraes, R.N.; Cunha, R.N.; Costa, J.M.; Ometto, A.R. From Linear to Circular Economy: PSS Conducting the Transition. Procedia CIRP 2017, 64, 2–6. [Google Scholar] [CrossRef]
- Ryen, E.G.; Gaustad, G.; Babbitt, C.W.; Babbitt, G. Ecological foraging models as inspiration for optimized recycling systems in the circular economy. Resour. Conserv. Recycl. 2018, 135, 48–57. [Google Scholar] [CrossRef]
- Lieder, M.; Rashid, A. Towards circular economy implementation: A comprehensive review in context of manufacturing industry. J. Clean. Prod. 2016, 115, 36–51. [Google Scholar] [CrossRef]
- Mohamed Sultan, A.A.; Mativenga, P.T. Sustainable Location Identification Decision Protocol (SuLIDeP) for determining the location of recycling centres in a circular economy. J. Clean. Prod. 2019, 223, 508–521. [Google Scholar] [CrossRef]
- Parajuly, K.; Fitzpatrick, C.; Muldoon, O.; Kuehr, R. Behavioral change for the circular economy: A review with focus on electronic waste management in the EU. Resour. Conserv. Recycl. X 2020, 6, 100035. [Google Scholar] [CrossRef]
- Erum, N.; Musa, K.; Tufail, S.; Said, J.; Zakaria, N.B. Impact of the circular economy on human development: Evidence from Germany. Environ. Dev. Sustain. 2024. [Google Scholar] [CrossRef]
- Neves, S.A.; Marques, A.C. Drivers and barriers in the transition from a linear economy to a circular economy. J. Clean. Prod. 2022, 341, 130865. [Google Scholar] [CrossRef]
- Shahbaz, M.; Siddiqui, A.; Ahmad, S.; Jiao, Z. Financial development as a new determinant of energy diversification: The role of natural capital and structural changes in Australia. Energy Econ. 2023, 126, 106926. [Google Scholar] [CrossRef]
- Johansen, S.; Juselius, K. Maximum likelihood estimation and inference on cointegration—With appucations to the demand for money. Oxf. Bull. Econ. Stat. 1990, 52, 169–210. [Google Scholar] [CrossRef]
- Johansen, S. Likelihood-Based Inference in Cointegrated Vector Autoregressive Models; OUP Oxford: Oxford, UK, 1995. [Google Scholar]
- Goupillaud, P.; Grossmann, A.; Morlet, J. Cycle-octave and related transforms in seismic signal analysis. Geoexploration 1984, 23, 85–102. [Google Scholar] [CrossRef]
- Jarque, C.M.; Bera, A.K. A Test for Normality of Observations and Regression Residuals. Int. Stat. Rev. 1987, 55, 163–172. [Google Scholar] [CrossRef]
- Eweade, B.S.; Akadiri, A.C.; Olusoga, K.O.; Bamidele, R.O. The symbiotic effects of energy consumption, globalization, and combustible renewables and waste on ecological footprint in the United Kingdom. Nat. Resour. Forum 2024, 48, 274–291. [Google Scholar] [CrossRef]
- Murdiyarso, D.; Purbopuspito, J.; Kauffman, J.B.; Warren, M.W.; Sasmito, S.D.; Donato, D.C.; Manuri, S.; Krisnawati, H.; Taberima, S.; Kurnianto, S. The potential of Indonesian mangrove forests for global climate change mitigation. Nat. Clim. Change 2015, 5, 1089–1092. [Google Scholar] [CrossRef]
- Bezić, H.; Mance, D.; Balaž, D. Panel Evidence from EU Countries on CO2 Emission Indicators during the Fourth Industrial Revolution. Sustainability 2022, 14, 12554. [Google Scholar] [CrossRef]
- Ibrahim, R.L.; Ajide, K.B.; Usman, M.; Kousar, R. Heterogeneous effects of renewable energy and structural change on environmental pollution in Africa: Do natural resources and environmental technologies reduce pressure on the environment? Renew. Energy 2022, 200, 244–256. [Google Scholar] [CrossRef]
- Sarpong, K.A.; Xu, W.; Gyamfi, B.A.; Ofori, E.K. A step towards carbon neutrality in E7: The role of environmental taxes, structural change, and green energy. J. Environ. Manag. 2023, 337, 117556. [Google Scholar] [CrossRef] [PubMed]
- Raihan, A.; Muhtasim, D.A.; Farhana, S.; Pavel, M.I.; Faruk, O.; Rahman, M.; Mahmood, A. Nexus between carbon emissions, economic growth, renewable energy use, urbanization, industrialization, technological innovation, and forest area towards achieving environmental sustainability in Bangladesh. Energy Clim. Change 2022, 3, 100080. [Google Scholar] [CrossRef]
Disclaimer/Publisher’s Note: The statements, opinions and data contained in all publications are solely those of the individual author(s) and contributor(s) and not of MDPI and/or the editor(s). MDPI and/or the editor(s) disclaim responsibility for any injury to people or property resulting from any ideas, methods, instructions or products referred to in the content. |
© 2025 by the authors. Licensee MDPI, Basel, Switzerland. This article is an open access article distributed under the terms and conditions of the Creative Commons Attribution (CC BY) license (https://creativecommons.org/licenses/by/4.0/).