Article

Assessment and Improvement Strategies for Sustainable Development in China’s Cultural and Tourism Sector

1
School of Business, Gansu University of Political Science and Law, Lanzhou 730070, China
2
School of Accounting, Lanzhou University of Finance and Economics, Lanzhou 730020, China
*
Author to whom correspondence should be addressed.
Sustainability 2025, 17(13), 5964; https://doi.org/10.3390/su17135964 (registering DOI)
Submission received: 27 April 2025 / Revised: 21 June 2025 / Accepted: 23 June 2025 / Published: 28 June 2025

Abstract

Against the backdrop of sustainable development and from a macro perspective, this paper focuses on the cultural and tourism industry, measures its sustainable development efficiency, analyzes influencing factors, and systematically explores improvement paths. Based on the theoretical perspective of sustainable development, this study has constructed an evaluation index system for measuring the sustainable development level of the cultural and tourism industry across four dimensions, as follows: cultural and tourism economic construction, cultural and tourism basic resources, social basic support, and ecological environment quality. The range entropy value was adopted to measure the sustainable development level of the cultural and tourism industry in 31 provinces of China from 2006 to 2023. The results show that the sustainable development level of China’s cultural and tourism industry is generally low, but shows an increasing trend. In terms of the annual growth rate of regional scores, the trend is as follows: North China (7.05%) > Central South (6.00%) > East China (5.97%) > Southwest (5.03%) > Northwest (4.56%) > Northeast (2.94%). This indicates considerable room for improvement in the future. Furthermore, this study used kernel density estimation to analyze the distribution dynamics and evolution trends of the sustainable development level of the cultural and tourism industry and its scores at all levels, revealing differences in development levels among provinces and regions. Finally, this study has innovatively adopted the fsQCA method to explore improvement paths for the sustainable development level of the cultural and tourism industry, and identified three implementation paths: “openness–human resources–consumption–environment-driven”, “human resources–consumption–environment-driven”, and “openness–environment-driven”. By constructing a multi-condition combination model, this study breaks through the limitations of traditional single-factor analysis and reveals multiple concurrent causal relationships in complex situations. This approach showcases the differentiated development models of each province under the interacting effects of multi-dimensional factors, and provides policymakers with a basis for precise policy implementation “tailored to local conditions and multi-dimensional collaboration”.

1. Introduction

As the global economy enters the fast lane of rapid development, accompanied by significant improvements in living standards, China’s tourism industry has gradually entered a new stage focused of development, shifted from quantity to quality [1]. The status of the cultural and tourism industry as a strategic pillar of the national economy is growing increasingly prominent, and its sustainable development capacity directly affects the optimization of the national economic structure and the effectiveness of ecological civilizational construction [2]. In recent years, the Chinese government has incorporated the integrated development of culture and tourism into its national strategic system, successively issuing a number of guiding documents such as the “14th Five-Year Plan for the Development of Culture and Tourism” and “Guiding Opinions on Promoting High-Quality Development of the Tourism Industry”, putting forward core tasks such as deepening the supply-side structural reform of culture and tourism, promoting green and low-carbon transformation, and improving the public service system. It also encourages improvements in the modern cultural industry system and market system and the implementation of strategies to drive major cultural industry projects [3]. In addition, Sun Yeli, Minister of Culture and Tourism in China, proposed that efforts should be made to promote the construction of national cultural parks in a high-quality manner; to accelerate the development of cultural heritage tourism, red tourism, tourism performances, study tours, and more; to give full play to the role of culture in empowering and tourism in driving and deepening the integration of “culture” and “tourism”; and to thereby promote the high-quality development of the cultural and tourism industry [4].
Against the background of this new era, the development of the tourism industry is currently in a crucial period of strategic opportunity. To accelerate the development of the cultural and tourism industries, it is worth noting that China’s cultural and tourism industry began in the late 1970s, while the concept of the integrated development of culture and tourism can be traced back to around the 1990s. This integration covers multiple aspects such as concept integration, management integration, product integration, market integration, and technology integration, thereby establishing all-round integration beyond the business level [5]. With the state’s increasing emphasis on the cultural and tourism industry, the integration of culture and tourism, as a new form of deep integration between the two industries, has become a new trend in tourism development [6]. Since the beginning of the 21st century, successful cases of cultural and tourism integration have emerged continuously across the country. With the transformation and upgrading of the cultural and tourism industry from extensive to intensive development, improving the efficiency of cultural and tourism integration has become an important way of, and a primary task in, promoting the high-quality development of culture and tourism [7].
In 2018, the Ministry of Culture and Tourism of China was officially established, and it officially proposed that “culture is the soul of tourism and tourism is an important carrier of culture”. The integration of culture and tourism thus entered a new era, prompting greater attention to their in-depth combination. The 2024 China Culture and Tourism Industry Development Work Conference further emphasized the need to leverage the significant role of the culture and tourism industry in maintaining stable growth and expanding domestic demand. It also highlighted the industry as a key driver of new, quality productive forces, and a focal point for achieving high-quality development.
In recent years, academic research on the development of cultural tourism has mainly focused on the relationship between culture and tourism, theories and development paths related to their integration, the relationship between specific industries or sectors, and the integration of culture and tourism, along with regional cases of such integration. From this perspective, there have already been in-depth studies on the theoretical basis, value system, potential assessment, construction status quo, and existing problems of regional culture to date, providing innovative strategies and guarantee mechanisms for sustainable development [8]. To further explore the practical paths for the coordinated development of the cultural industry and tourism economy against the background of the integration of culture and tourism [9], related research has also focused on the creative mining of cultural characteristics among regions [10], the exploration of development paths of characteristic resources based on this [11], etc. However, in the process of the continuous development of the cultural tourism industry in various regions, the following problems and deficiencies still persist. First, although the integration of culture and tourism has achieved initial success in promoting regional economic development, it still faces practical predicaments such as an imbalance in the supply and demand structure, “elite capture”, “enriching the people but not the government”, and the crowdfunding effect, which to some extent hinder the pace of high-quality development in the cultural and tourism economy [12]. Secondly, while promoting regional economic development and the protection of cultural resources, there are challenges in, for example, the collaboration of stakeholders, the establishment of long-term mechanisms, and the application of digital technologies [13]. In addition, other problems include the need to optimize the management mechanism, insufficient innovation in integration forms, and a shortage of compound talents in the digital promotion of cultural and tourism integration. Even though the cultural and tourism industry is diverse, it still faces problems such as the insufficient manifestation of cultural elements and the inadequate extension of the cultural and tourism industry chain [14], all of which will become obstacles to improving the foundation of culture and tourism. Thirdly, in the continuous promotion of the development of cultural and tourism resources, problems such as the low exploitation and utilization rate of resources, the insufficient integration of intangible cultural elements, excessive commercial attributes, and incomplete tourism facilities and service facilities have emerged [15]. Moreover, against the backdrop of the contemporary cultural and tourism industry having entered a period of deep adjustment, various regions are confronted with challenges such as the insufficient exploration of cultural connotations in tourism products and the homogenization and singularity of service types in cultural and tourism products, all of which have an impact on the quality of social resources in cultural tourism [16]. Fourth, the contemporary cultural and tourism industry is confronted with numerous challenges such as incomplete supporting infrastructure, insufficient innovation in cultural tourism, inadequate guidance for green development, and a lack of focus on ecological protection [17], all of which have put forward higher requirements for the sustainable development of the cultural and tourism industry.
Looking within China, the current research on the sustainable development of regional cultural and tourism industries still has significant limitations [18], prominently manifested as an insufficient implementation of the sustainable development concept, the obvious unidimensionalization of the evaluation index system, and a lack of exploration of multi-dimensional collaborative improvement paths, among other prominent issues. First, although many strategies such as the “integration of culture and tourism” have been proposed, the implementation of the concept of sustainable development in existing studies remains at the conceptual level [19]. Among these studies, the contradiction between ecological protection and tourism development is prominent, and some studies overly emphasize economic benefits. In addition, the development of cultural and tourism resources results in the phenomenon of “emphasizing form over connotation” [20], and has not seen the deep integration of cultural inheritance with tourism experience. Secondly, the evaluation of the sustainable development level of the cultural and tourism industry has certain problems, such as having a single evaluation dimension [21] and there being insufficient research on dynamics and adaptability. This leads the cultural and tourism industry to mostly focus on tourism’s economic benefits [22] or ecotourism potential [23], lacking a comprehensive evaluation index system constructed based on four dimensions—cultural and tourism economy, basic resources, social support, and ecological environment. A single-dimensional evaluation cannot fully reflect the multiple benefits of integrating culture and tourism, and is prone to ignore the dynamics of policy adjustments in the development of the cultural and tourism industry, thus leading to policy formulations focusing on one aspect while neglecting another. Thirdly, the improvement path of the sustainable development level of the cultural and tourism industry has not yet broken through the limitations of traditional single-factor analysis. Currently, the research only focuses on a single element, such as policy guidance, resource development [24], or the isolated optimization of economic benefits [25], without systematically analyzing the interaction and organic combination of multiple key driving factors, such as openness, human resources, consumption, and the environment. The importance of a multi-dimensional collaborative mechanism has been ignored. From an international perspective, research on the sustainable development of the cultural and tourism industry in foreign countries started earlier, and has formed a relatively mature theoretical system with practical experience. For instance, the EU’s “Digital Strategy for Cultural Heritage” [26], Japan’s “Ecotourism Development Model” [27], the US’s “National Park System” [28], and New Zealand’s “Sustainable Tourism Certification Standards” [29] all emphasize the deep integration of resource protection, community participation, and technological innovation. In contrast, although research on the sustainable development of China’s cultural and tourism industry has advanced rapidly in recent years, its theoretical system still needs to be improved. Moreover, it mostly focuses on localized applications, and is still insufficient in drawing on international experience.
The theory of sustainable development takes the coordinated progress of the “economy–society–environment” as its core, emphasizing meeting the needs of the present without harming the interests of future generations [30]. This theory provides fundamental guidance for the development of the cultural and tourism industry. First, by optimizing resource allocation and industrial integration, it enhances economic efficiency and regional competitiveness. Second, we should focus on ecological protection and social equity to ensure the long-term utilization and value enhancement of cultural and tourism resources. Therefore, integrating the concept of sustainable development into the evaluation and practice of the cultural and tourism industry can not only break through the current development bottleneck of homogenization and extensive development, but also help build an industrial ecosystem that is resilient, inclusive, and innovative, thus providing a “Chinese solution” for the transformation of the global cultural and tourism industry.
In view of this, starting from the concept of sustainable development, this study constructs a multi-dimensional comprehensive evaluation index system including aspects such as cultural and tourism economic construction, cultural and tourism basic resources, social basic support, and ecological environment quality. This study measures the sustainable development level of the cultural and tourism industry in 31 provinces of China, and analyzes the development differences and dynamic evolution trends among various regions. The multiple combined paths for enhancing the sustainable development level of the cultural and tourism industry are studied, providing a scientific basis for different regions to develop their cultural and tourism industry in accordance with local conditions and formulate targeted policy measures, thereby promoting the development of the cultural and tourism industry in a diversified and sustainable direction.

2. Literature Review

2.1. Research on the Sustainable Development of Culture and Tourism

In recent years, the advancement of the Global Sustainable Development Goals (SDGs) has made research on the sustainable development of culture and tourism an academic hotspot. The existing literature mainly focuses on the collaborative relationship between ecotourism, low-carbon tourism, cultural protection, and tourism development, forming a multi-disciplinary research pattern. Despite decades of debates, theories, and practical activities surrounding the sustainability of tourism, there are still numerous difficulties. It is precisely the contradictory relationship between tourism activities and the natural and social environment that has given rise to the concept of sustainable tourism [31].
First, from the perspective of the existing theoretical framework, most of the current research focuses on the sustainability of ecotourism, while paying insufficient attention to objective dimensions such as the cultural and tourism economy, basic resources, and social foundations. Existing studies generally recognize that when developing sustainable tourism, the consideration of ecological systems and cultural assets is often intertwined, and the “bio-ecological” cultural approach is regarded as an effort to protect local tourism resources [32]. Run and Ziyue, by analyzing the contribution of the ecological and low-carbon model in the regional cultural tourism industry to the global sustainable development goals, provide a successful example for other cities [33]. M. Leg et al. [34] incorporated sustainability into public policies requiring the development of tourism, and through the active participation of stakeholders, they enabled sustainability to have positive impacts on the environment, economy, and society. Elgin and Elveren [35] provided valuable insights for seeking balance between economic growth and environmental and social sustainability by analyzing the complex relationship between tourism and sustainable development among different economies.
Secondly, in terms of the evaluation content, existing studies have mostly focused on three stakeholder groups, that is, resource management, tourists, and local communities, emphasizing the sustainability of ecotourism [36], while lacking a systematic examination of cultural elements. However, although existing research on cultural space involves concept analysis and the exploration of structural elements, it has not yet deeply analyzed the key factors influencing the evolution of cultural space in tourist destinations, which restricts the theoretical construction of sustainably developed cultural tourism [37]. Existing explorations of regional tourism resource development strategies have focused on the dimensions of how to search for, create, manage, and maintain renewable urban tourism resources. However, judgment criteria for the sustainable utilization conditions of these resources still remain to be clarified [38].
Thirdly, from the perspective of the evaluation index system, the systematic absence of cultural elements makes it difficult for the evaluation system, from the perspective of sustainable cultural tourism, to fully reflect the essential characteristics of the complex system of “cultural tourism”. Chen [39] constructed an evaluation framework of China’s tourism economy from the dual perspectives of the domestic tourism level and the international tourism level. Parvane et al. [40] constructed indicators including the dual dimensions of “environment–physical, population–society and economy–institution” on this basis, so as to evaluate the sustainability level of national ecotourism. Furthermore, an assessment model for the sustainable development of tourism was constructed from the triple perspectives of “economic, social and environmental performance” [41]. Soh et al. innovatively proposed sustainable competitiveness indicators, and simultaneously explored the relationship between tourism development and economic growth as well as the vulnerability characteristics of the tourism market [42]. To solve the problem of the sustainable development of rural tourism, Ye and Li [22] designed a model of the evaluation index system for low-carbon tourism-oriented rural development in research on low-carbon tourism development, and constructed an evaluation index system for rural low-carbon tourism development with sustainable calculation intensity.

2.2. Research on the Application Status of fsQCA

Fuzzy Set Qualitative Comparative Analysis (fsQCA), as a configuration research method combining fuzzy set theory and Boolean algebra, has received extensive attention and seen much application in the international academic community in recent years.
First, application fields in the social sciences are being incorporated into multi-disciplinary scenarios. fsQCA is frequently used to analyze classic issues such as social responsibility risks, social governance, and management strategies. For instance, some scholars have explored the realization path of managing low social responsibility risks through fsQCA, expanding the conceptual framework of the driving mechanism of corporate social responsibility [43]. In sociology, this method is widely used to explore the relationship between social governance and performance, such as the path of the effect of social governance innovation policies on governance performance [44]. Scholars such as Kumbure have used fsQCA to examine managers’ cognition and company performance, and extract a strategic framework from individuals on the management team [45]. In addition to the field of social sciences, fsQCA has also achieved application extensions in emerging fields. In environmental science, fsQCA is used to assess the effectiveness of climate change policies, such as through analyzing carbon emission efficiency [46], energy industry transformation [47], tourism ecological transformation [48], etc. In the field of medical and health care, Tiago and Carla examined the specific patterns that led to the presence and absence of medical care quality through fsQCA, thereby revealing the combination of individual-level and organizational-level characteristics that led to the lack of such care quality [49]. Scholars such as Brian analyzed the conditional allocation of unreasonable drug prices from the perspective of medical service provision, and deepened the research on drug price regulation and the medical service system [50].
Second, policy and strategic decision support guide practical empowerment through theoretical exploration. International research has always emphasized the practical value of fsQCA, especially in fields such as policy design and industrial planning. Its analytical framework of “conditional configuration–result mapping” provides a scientific basis for complex decisions. In educational policies, scholars such as Brian have promoted inclusive education and strengthened support services for children with special needs by analyzing the data of EU educational policies [51]. For environmental policies, Yimin proposed that policymakers should keep in mind the contextual fit of decentralization, adopted configurational thinking in environmental governance, and studied the complex relationship among decentralization, national context, and environmental policy performance through fsQCA [52]. In international policy, the importance of formulating successful strategies is revealed by analyzing the attributes of media performance in European countries and the economic policy characteristics of the countries where major activities are carried out [53]. In industrial planning, Hu found that the multiple influences of economic efficiency, technological innovation, and policy environment form a diversified reorganization path, promoting the integration of the two major industries comprising the modern service industry and advanced manufacturing [54], and finally, Stejskal and Hajek found that knowledge spillover has a positive impact on innovation in the creative industry and empowers innovation in industrial planning [55].

2.3. Literature Commentary

The existing research has laid an important theoretical foundation, and provides practical guidance for the sustainable development of the cultural and tourism industry. Scholars generally recognize the promotional effect of integrating culture and tourism on regional development. A variety of tools have been developed in the evaluation dimension, ranging from a single economic benefit indicator to a multi-dimensional comprehensive evaluation system. Research on development paths such as rural revitalization and urban–rural linkage also reflects the practical value of academic research in serving national strategies. However, the current research on the sustainable development of the cultural and tourism industry still meets certain limitations in terms of theory, evaluation dimensions, and special national conditions. As a result, a systematic evaluation system that comprehensively covers cultural and tourism economic construction, cultural and tourism basic resources, social basic support, and ecological environment quality has not yet been formed [56].
First, at the theoretical level, existing studies merely simplify “sustainability” as a trade-off between environmental protection [57] and economic benefits [58], resulting in the inability to explain the multi-dimensional interaction characteristics of “cultural empowerment–tourism drive” in the cultural and tourism industry, that is, how cultural resources achieve value transformation through tourism carriers [59]. Existing theories lack the support of systematic research on the four-dimensional coupling relationship, and struggle to explain the “1 + 1 > 2” synergy effect that emerges through the integration of culture and tourism. For instance, key issues such as how cultural elements can enhance the added value of tourism products and how tourism development can promote cultural inheritance and innovation have not been fully expounded. To break through this limitation, this papers constructs an “economy–society–culture–ecology” four-dimensional coupling model while following the concept of sustainable development. The model not only enriches and expands the theoretical connotation of the sustainable development of the cultural and tourism industry, but also provides a new theoretical paradigm for the development of national cultural and tourism.
Secondly, at the level of evaluation dimensions, the existing evaluation index system struggles to explain why some areas have developed cultural and tourism economies, but undergo significant ecological pressure, while some ecologically fragile areas have unsustainable resources due to excessive development. This exhibits economic–ecological and ecology–social interaction phenomena. The comprehensive evaluation index system that focuses on building, which integrates “cultural and tourism economy, cultural and tourism foundation, social foundation and ecological environment”, comprehensively covers the core contradictions of the sustainable development of the cultural and tourism industry. Among them, the cultural and tourism economy reflects the contribution of industries to the regional economy and employment, and it is the material basis for sustainable development [9]. The foundation of culture and tourism measures the endowment of cultural resources and the potential for sustainable utilization, and it is the material foundation for the development of culture and tourism [60]. The social foundation reflects the social carrying capacity and guarantees the convenience of cultural and tourism experiences [61], while the ecological environment that conforms to the “dual carbon” goals and ecological protection requirements is the core constraint of green development [62].
Thirdly, based on the special national conditions, there is an imbalance in regional development and significant differences in cultural resource endowments in China. Under the policy framework of the “Digital Culture and Tourism” strategy [63], the integrated development strategy of culture and tourism, and the goal of “building a Cultural Power” [64], many current studies still struggle to explain the internal logic of China’s characteristic development model of “culture and tourism”. In particular, multi-dimensional collaborative evaluations should be adopted to avoid a one-size-fits-all approach. The existing research shows deficiencies in dynamics, adaptability, and interdisciplinary integration [65]. There is an urgent need to construct a comprehensive measurement framework that takes into account both efficiency and fairness and integrates cultural protection and innovative development to provide a scientific basis for regional differentiated policy implementation.

3. Research Design

3.1. Construction of the Indicator System

The sustainable development of the cultural and tourism industry is a multi-dimensional and cross-disciplinary concept that not only involves economic aspects, but also closely relates to social, cultural, and environmental dimensions. To ensure that the development of the cultural and tourism industry achieves balance and coordination in terms of comprehensiveness, sustainability, and operability, this study constructs a comprehensive evaluation index system for the sustainable development level of the cultural and tourism industry. Based on existing research, the system design is based on four aspects: cultural and tourism economic construction, cultural and tourism infrastructure resources, social support systems, and ecological environment quality. The system aims to balance contemporary needs with intergenerational interests, providing policymakers and managers with a quantitative tool to facilitate the formulation of policies and the evaluation of sustainability outcomes related to the cultural and tourism industry.
Among them, the indicators for cultural and tourism economic construction reflect the contributions of the cultural and tourism economy in each region to regional economic growth and the local employment market, serving as a direct manifestation of the sustainable development of the cultural and tourism industry. Economic indicators such as those for labor force levels, industry performance, and tourism contribution rates directly reflect the economic benefits of the sustainable development of the cultural and tourism industry in various regions. They assess the economic rationality and efficiency of the cultural and tourism industry’s development, forming the economic foundation for measuring this industry’s sustainable development level. The indicators for cultural and tourism infrastructure resources are used to measure the influence of regional cultural and tourism resources, serving as the material foundation for the sustainable development of the cultural and tourism industry. By evaluating the level of tourism infrastructure resources and service quality, these indicators reflect the development potential and unique characteristics of a region’s cultural and tourism industry, such as the richness and uniqueness of tourism resources, the quality of supply, and the future sustainable development potential of cultural and tourism resources. The sustainable utilization and management of these resources form the resource foundation for the sustainable development of the cultural and tourism industry. The indicators for social support systems primarily reflect the transportation infrastructure and service capabilities of a region, serving as key factors in achieving the long-term stable development of the cultural and tourism industry. Passenger transport volume, vehicle allocation, and the foundational conditions of the tertiary sector collectively constitute the social support framework for the sustainable development of the cultural and tourism industry. In particular, passenger transport volume is directly linked to the tourist flow of this industry, influencing the development of related industries, such as catering and accommodation. Transportation infrastructure directly affects the convenience of travel and the tourism experience for visitors. The foundational conditions of the tertiary sector reflect the cultural and tourism industry’s position and contribution within the overall economy, with its growth providing the industry more employment opportunities and social resources, thereby enhancing its social influence and future development capacity. Ecological environment quality indicators serve as an ecological safeguard for the sustainable development of the cultural and tourism industry, reflecting a region’s level of investment in green economy, green and low-carbon development, and the construction of tourism ecological environments. Based on a region’s financial support and resource allocation for ecological environment improvement, these indicators aim to enhance resource recycling efficiency while improving the quality of tourists’ experiences. Additionally, prioritizing the protection of biodiversity and natural landscapes provides a solid foundation of abundant resources for ecotourism. By enhancing the overall attractiveness and competitiveness of tourism destinations, these efforts directly influence the sustainability of tourism activities and the supporting capacity for the development of the cultural and tourism industry. Based on the understanding and analysis of the connotation of the development level of the cultural and tourism industry under the aforementioned sustainable development concept, this study attempts to construct a comprehensive, systematic, and scientific evaluation index system. This system includes four primary indicators—”Cultural and Tourism Economic Construction,” “Cultural and Tourism Infrastructure Resources,” “Social Support Systems,” and “Ecological Environment Quality”—along with 11 secondary indicators and 26 specific tertiary indicators to measure the development efficiency and sustainable development level of the cultural and tourism industry in various regions. The names, calculation methods, indicator attributes, and weights of each indicator are presented in Table 1.

3.2. Measurement Method

The range entropy method can determine the weights of indicators through the correlation of data and the degree of entropy variation. It multiplies the standardized data with the weights of each indicator and then accumulates them to calculate the comprehensive score level of the evaluated object. It is an indicator construction method widely adopted by a large number of scholars. Many authoritative studies give priority to using this method for evaluation. For example, Han et al. used the entropy weight method to explore the site selection scheme for the renovation of coastal coal-fired power plants in China into nuclear power plants [66]. Scholars such as Fang have constructed an evaluation index system related to rural revitalization based on the entropy method and the coupling coordination degree model, studying and discussing the path selection and future development direction of rural revitalization through the integration of cultural tourism industries [67]. In order to analyze the development degree of this industry, scholars such as Zhang have constructed an integration degree model using the entropy value weighting method [68]. Ren et al. [69] stated that entropy, as a novel metric, can be used to measure the complexity of chaotic time series with extreme volatility, and its algorithm has great potential for progress and practical application. It can be seen from this that the range entropy method, with its characteristic of objectively determining the index weight based on data correlation and the degree of entropy variation [70], has shown wide applicability and significant advantages in multiple research fields such as regional assessment, energy system analysis, and the complexity measurement of complex systems. Therefore, this study adopted the range entropy value method to construct and measure the sustainable development level of the cultural and tourism industry in 31 provinces across China. The specific calculation steps are as follows:
First, data standardization processing is carried out.
Positive Indicator
y t i j = x t i j x j m i n x j m a x + 0.0001
Negative Indicator
y t i j = x j m a x x t i j x j m a x + 0.0001
Here, x t i j represents the j -th indicator of the i -th province in the t -th year.
Secondly, the information entropy of each indicator is calculated.
e j = k t = 1 T i = 1 m p t i j ln p t i j
Here, p t i j = y t i j / t = 1 T i = 1 m y t i j , k = 1 ln ( m T ) , where m is the number of samples, and t is the number of years.
Next, the weights of each indicator are determined,
w j = ( 1 e j ) / j = 1 n ( 1 e j )
Finally, the comprehensive scores of each province are calculated,
s i = j = 1 n w j y t i j

3.3. Data Sources

In view of the feasibility of data acquisition, this study, based on the provincial administrative division standards of China, selected 31 provincial administrative units excluding the Hong Kong, Macao, and Taiwan regions as research objects, focusing on the sustainable development issues of their cultural and tourism industries. Thus, this study selected the panel data of the 31 provinces in China from 2006 to 2023 as the sample basis for analysis. The caliber and period of the statistical data were inconsistent with those on the Chinese mainland, and the key indicators lacked comparability. Moreover, strategic orientations such as the integration of culture and tourism and rural revitalization were also quite different from those on the Chinese mainland. Comparing them alone can easily weaken the explanatory power for the local development paths on the Chinese mainland. Therefore, this study focused on the 31 provinces on the Chinese mainland to conduct a difference analysis. The data were sourced from the “China Statistical Yearbook”, “China Tourism Statistical Yearbook”, “China Environment Statistical Yearbook”, “China Science and Technology Statistical Yearbook”, “China Urban Statistical Yearbook”, “China Tertiary Industry Statistical Yearbook”, “Urban and Rural Construction Statistical Yearbook”, etc., and to ensure the completeness and continuity of the data from each year, this paper adopted the linear interpolation method to fill in the individual missing data points for each detailed indicator.

4. Measurement and Analysis of the Sustainable Development Level of China’s Cultural and Tourism Industry

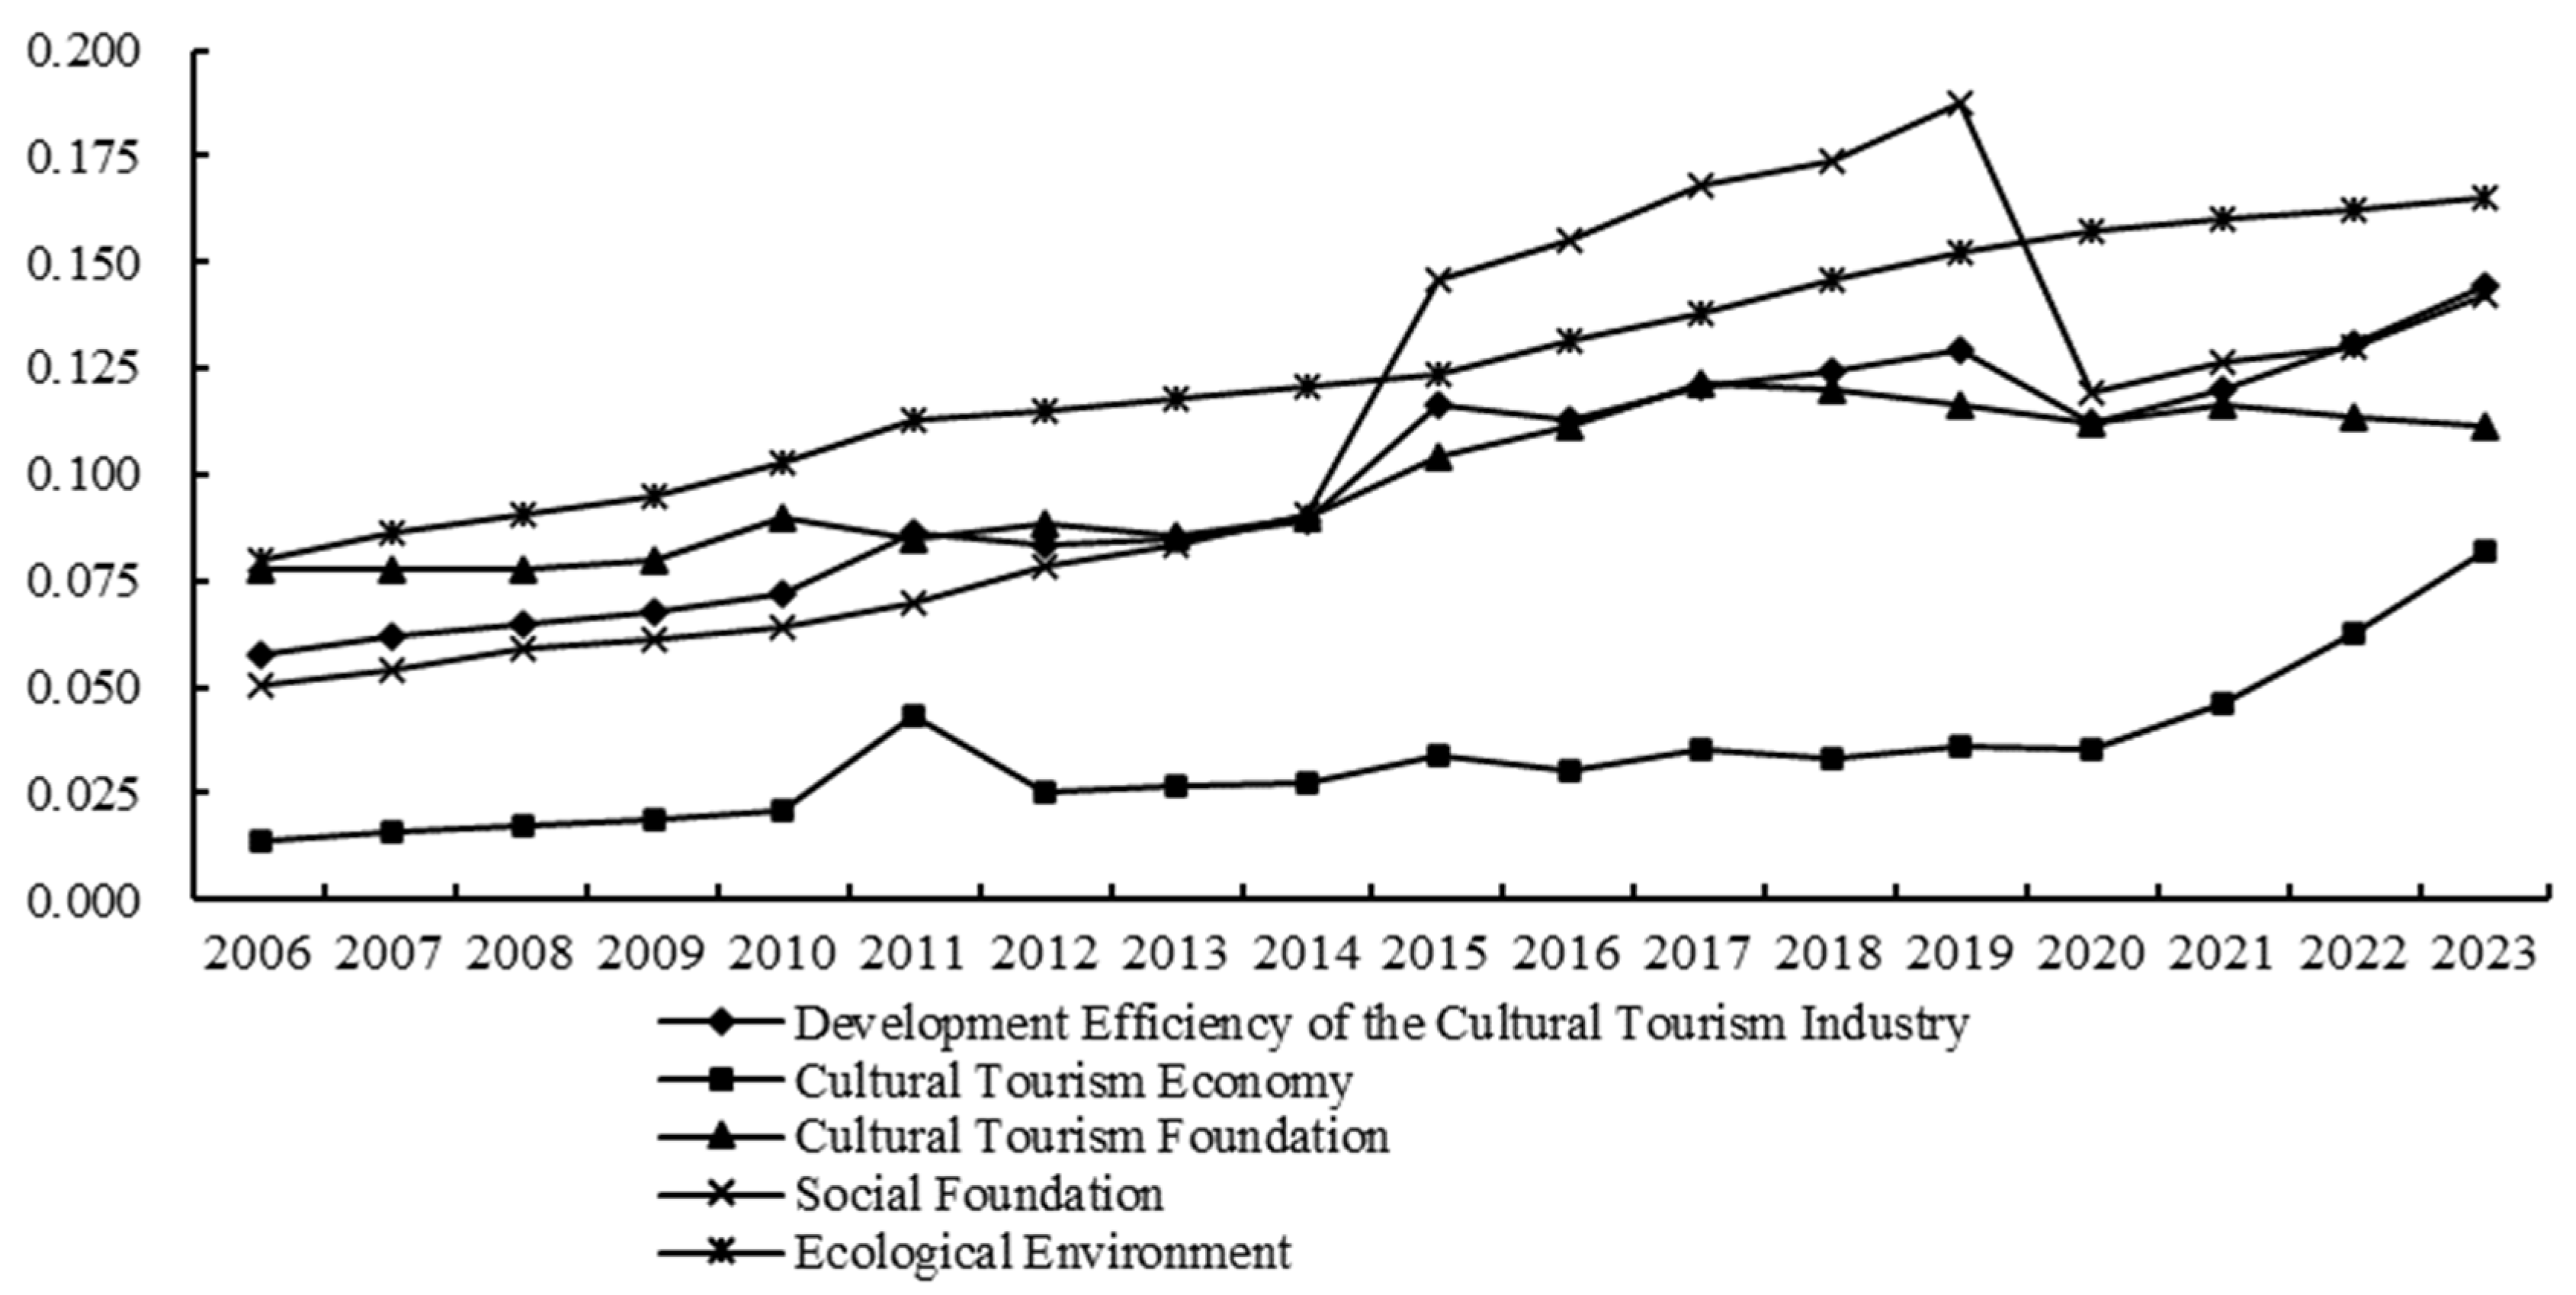
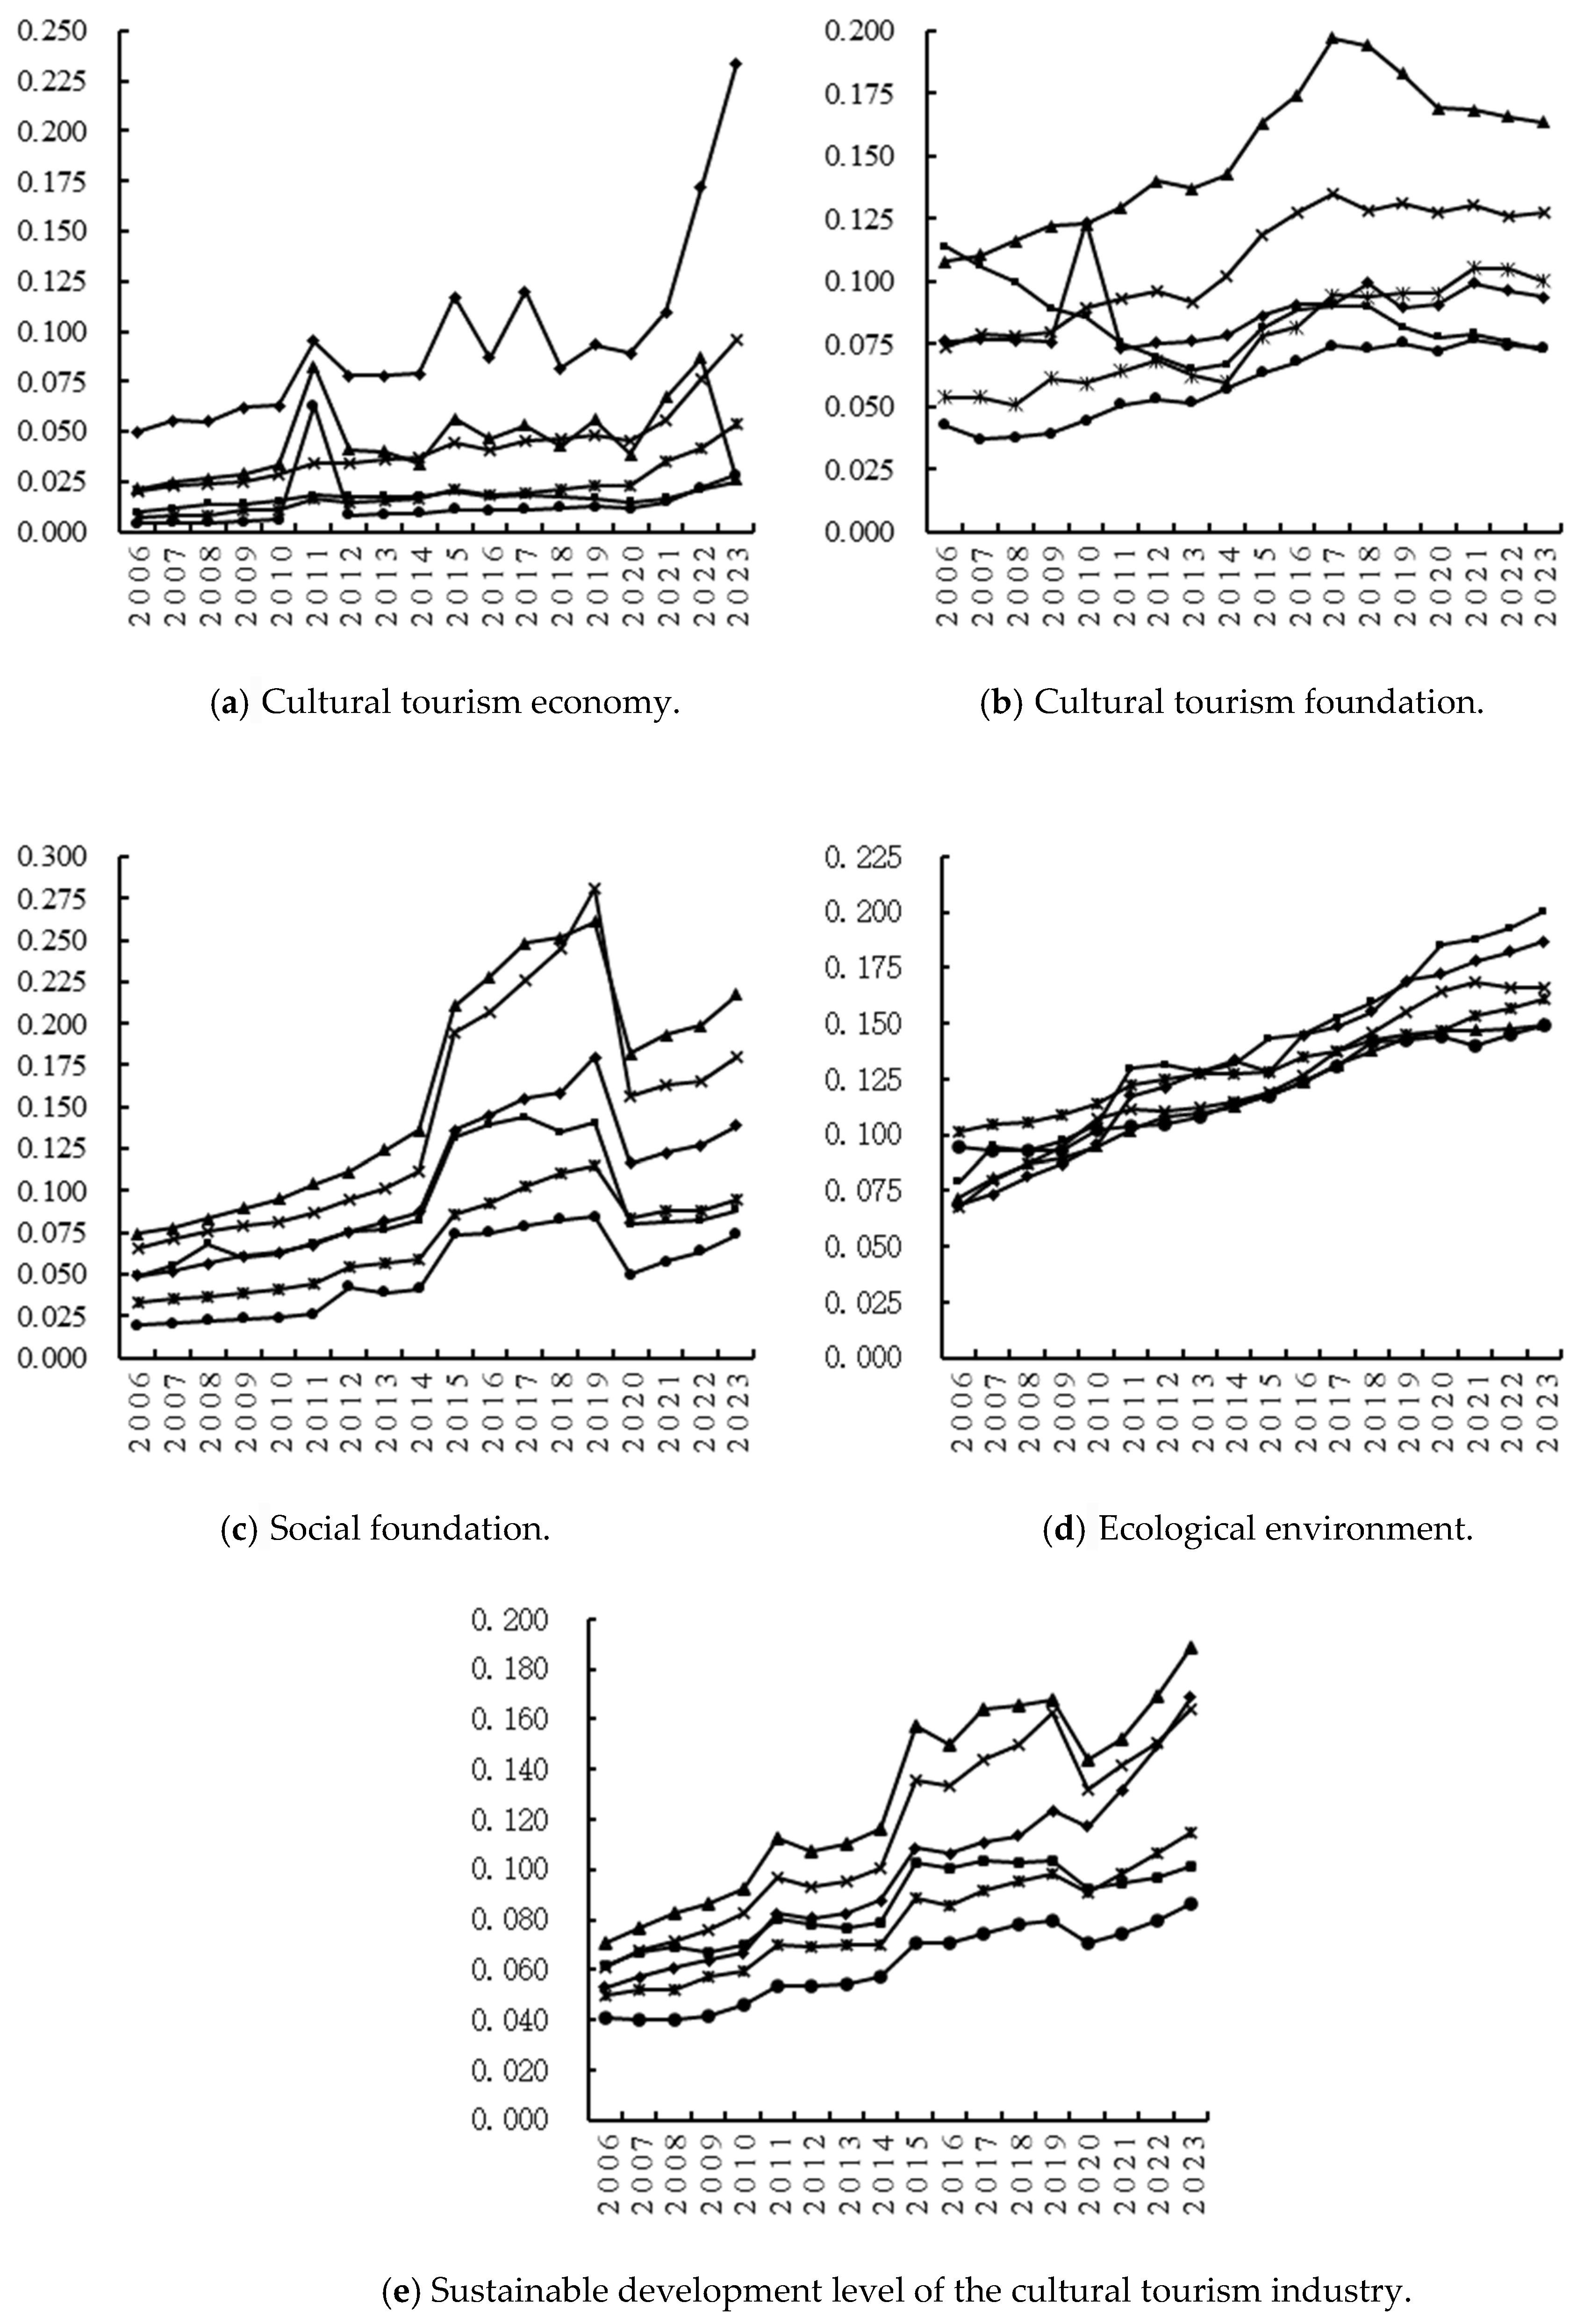
4.1. Comprehensive Scores and Scores at All Sustainable Development Levels of China’s Cultural and Tourism Industry

This study measured the comprehensive score and scores at sustainable development levels of China’s cultural and tourism industry from 2006 to 2023 (as shown in Figure 1). According to the measurement results, the following can be seen. First, the comprehensive index of sustainable development of China’s cultural and tourism industry is generally at a relatively low level. In terms of time span, the lowest score was only 0.058 in 2006, and the highest score was only 0.144 in 2023. This indicates that there is still much room for improvement in the sustainable development level of China’s cultural and tourism industry. Second, the comprehensive score of the sustainable development level of this industry generally shows an upward trend. Although there were slight declines in some years, it has been continuously increasing on the whole. Its comprehensive score increased from 0.058 in 2006 to 0.144 in 2023, an increase of 0.087. The annual average growth rate was 5.554%. Moreover, the comprehensive score in 2023 was 2.506 times that in 2006. This indicates that the sustainable development level of China’s cultural and tourism industry was relatively low in the early stage and has been increasing year by year in the later stages, with great potential for future development. Third, the annual average growth rate of the sustainable development level of China’s cultural and tourism industry shows different stages. In the initial slow-growth stage from 2006 to 2010, the annual average growth rate was 5.760%; in the rapid-growth stage from 2011 to 2015, it was 7.791%; and in the fluctuating-growth stage from 2016 to 2023, there were slight declines in 2016 and 2020, while from 2017 to 2019 and from 2021 to 2023, there was a more obvious growth trend.
The scores at all sustainable development levels of China’s cultural and tourism industry show the following. First, the score of the cultural and tourism economy generally shows an upward trend. From 2006 to 2011, it increased year by year, with a total increase of 0.030 and an annual average growth rate of 25.405%. The score decreased in 2011. The range of score change from 2015 to 2020 was relatively small. From 2020 to 2023, the score increased linearly, with a total increase of 0.047 and an annual average growth rate of 32.642%. Second, the score of cultural and tourism infrastructure generally shows a slow growth trend. From 2006 to 2014, the score increased slowly and fluctuated, with a total increase of 0.124 and an annual average growth rate of 1.880%. From 2014 to 2017, it increased year by year, with a total increase of 0.031 and an annual average growth rate of 10.487%. After that, it showed a slow downward trend. Third, the score of social foundation shows a continuous and rapid growth trend. It increased slowly and fluctuated from 2006 to 2014. From 2014 to 2019, it increased explosively, with a total increase of 0.097 and an annual average growth rate of 15.696%. After that, it declined sharply. From 2020 to 2023, it increased by a total of 0.023, with an annual average growth rate of 5.936%. Fourth, the score of ecological environment shows a steady growth trend. Specifically, from 2006 to 2023, it increased by a total of 0.086, with an annual average growth rate of 4.404%.
Overall, the sustainable development level of China’s cultural and tourism industry shows an upward trend. The cultural and tourism economy has the lowest score among the four systems, indicating that the development level of the cultural and tourism economy in various provinces across the country is still relatively low and will undergo great growth potential in the future. It is necessary to further accelerate the development of the cultural and tourism economy, formulate relevant policies to improve the development level of the cultural and tourism economy in various regions according to local conditions, and promote the sustainable development of the cultural and tourism economy. The ecological environment has the highest score among the four systems. This is due to China’s long-term adherence to the concept of green development and the policy orientation of striving to build and improve the ecological civilization system, demonstrating China’s firm determination in promoting the “dual carbon” strategy. Adhering to the concept of ecological priority and green development will help comprehensively transform and upgrade the economy and society.

4.2. Differences and Characteristics in the Sustainable Development Scores of the Cultural and Tourism Industry Among Provinces in China

This study measured the comprehensive scores of the sustainable development level of the cultural and tourism industry in 31 provinces in China in 2023 (as shown in Table 2). According to the measurement results, the following was observed: Generally speaking, the top five provinces with the highest comprehensive scores of the sustainable development level of the cultural and tourism industry are Guangdong, Jiangsu, Zhejiang, Shandong, and Beijing, while the bottom five provinces are Qinghai, Guizhou, Hainan, Jilin, and Ningxia. In terms of the interval of the sustainable development level of the cultural and tourism industry, the comprehensive index of 15 provinces is lower than 0.100, the scores of 14 regions are distributed within the interval of 0.100–0.200, and the most prominent provinces of Guangdong and Jiangsu are between 0.200 and 0.300. Specifically, Guangdong ranks first with a score of 0.287, and Ningxia, the province with the lowest score, has a score of 0.034, with the score of Guangdong being eight times greater.
From the perspectives of various aspects of the sustainable development level of the cultural and tourism industry, the following was observed. First, in terms of the cultural and tourism economy dimension, the scores of 27 provincial-level administrative regions did not reach 0.200. Only the scores of four regions, namely, Jiangsu, Guangdong, Tianjin, and Shanghai, exceeded this threshold. The score of Jiangsu, which ranked the highest, was 12.856 times that of Ningxia, which ranked the lowest. Second, in terms of the scores of cultural and tourism infrastructure, 11 provinces had scores lower than 0.100; the scores of 15 provinces ranged from 0.100 to 0.200, and the scores of five provinces, namely, Zhejiang, Shandong, Guangdong, Jiangsu, and Anhui, fell within the interval of 0.200–0.300. Zhejiang Province had the highest score and significantly outperformed the others, with its score being 6.499 times that of Ningxia Province. Third, from the perspective of the social foundation dimension, 12 provinces had scores lower than 0.100, and 13 provinces had scores ranging from 0.100 to 0.200. Zhejiang, Beijing, and Henan had relatively prominent scores, all within the interval of 0.200–0.300. Provinces scoring higher than 0.200 included Guangdong, Shandong, Jiangsu, Zhejiang, Beijing, and Henan. Among them, the scores of Shandong and Jiangsu exceeded 0.300. Guangdong had the highest score of 0.429, this being 27.773 times that of Tibet, the province with the lowest score. Fourth, in terms of ecological environment scores, 6 provinces had scores lower than 0.100, and 14 provinces had scores in the range of 0.100–0.200. Liaoning, Tibet, Hebei, Shandong, Sichuan, Qinghai, Jiangsu, Henan, and Hubei had scores between 0.200 and 0.300; Inner Mongolia and Guangdong had scores higher than 0.300. Inner Mongolia, with the highest score, had score that was 8.626 times greater than that of Hainan, which had the lowest score.
According to the above results, the sustainable development levels of the cultural and tourism industries in various provinces and the scores of each dimensional measurement exhibit the following characteristics. First, there is a significant gap in the comprehensive scores of the sustainable development levels of the cultural and tourism industries among provinces. Moreover, most regions obtained relatively low scores, indicating that there is generally significant potential for the future sustainable development capabilities of the cultural and tourism industries in each province. Second, there are notable disparities in the scores among provinces and across different dimensions, suggesting a clear divergence in the sustainable development levels of the cultural and tourism industries among various provinces. In the future, it will be necessary to intensify investment and reforms in all aspects of the cultural and tourism industries in a targeted manner to continuously boost their sustainable development levels. Specifically, when it comes to the gaps among provinces in various indicators, ranked from the largest to the smallest, they are social foundation, ecological environment, cultural and tourism economy, and cultural and tourism foundation. This indicates a significant regional imbalance in the development of culture and tourism among Chinese provinces. Particularly regarding social foundation, a pattern was observed whereby the southeast regions have relatively higher scores, while the northwest regions have relatively lower scores. Third, the disparities among provinces in the scores at each sustainable development level of the cultural and tourism industry are also relatively pronounced. This suggests that coordination among provinces in advancing the sustainable development of the cultural and tourism industry remains to be further enhanced, and synchronous coordination and balanced development among different aspects, including the cultural and tourism economy, social foundation, ecological environment, and cultural and tourism foundation, have not been realized yet.

4.3. Differences and Characteristics in the Sustainable Development Scores of the Cultural and Tourism Industries Among Regions

In line with the national regional economic division norms and relevant policy guidance documents, this research divided the entire country into six major geographical regions: North China, Northeast China, East China, Central South China, Southwest China, and Northwest China. Specifically, North China consists of Beijing, Tianjin, Hebei, Shanxi, and Inner Mongolia; Northeast China covers Liaoning, Jilin, and Heilongjiang; East China encompasses Shanghai, Jiangsu, Zhejiang, Anhui, Fujian, Jiangxi, and Shandong; Central and South China include Henan, Hubei, Hunan, Guangdong, Guangxi, and Hainan; Southwest China is composed of Chongqing, Sichuan, Guizhou, Yunnan, and Tibet; and Northwest China comprises Shaanxi, Gansu, Qinghai, Ningxia, and Xinjiang. The sustainable development level of the cultural and tourism industry from 2006 to 2023 was measured (as shown in Figure 2). By evaluating and analyzing the sustainable development capabilities of the cultural and tourism industries in each region, the following key characteristics can be identified. First, in terms of the trend of change, the sustainable development capabilities of the cultural and tourism industries in different regions generally exhibit a steady upward tendency. At the same time, the overall change modes of these regions are largely similar, indicating that the current sustainable development level of China’s cultural and tourism industry is continuously improving. Second, based on the scores of various regions for different aspects of the sustainable development level of the cultural and tourism industry, the specific performances are ranked as follows: East China > Central South China > North China > Northeast China > Southwest China > Northwest China. This order reveals that there is an issue of unbalanced development among regions in the process of the cultural and tourism industry advancing towards sustainable development. Third, in terms of the annual growth rate of regional scores, the regions are ordered as North China (7.05%) > Central South China (6.00%) > East China (5.97%) > Southwest China (5.03%) > Northwest China (4.56%) > Northeast China (2.94%). These data reveal the uneven development among various regions. However, it is worth noting that the annual average growth rates of the western regions (including the regions of Northwest and Southwest China here) are relatively large, indicating that the development disparities among regions are gradually narrowing. This also reflects the efforts made by the Northwest China region in the development of the cultural and tourism industry in recent years.
Regarding the scores at each measurement level for the sustainable development of the cultural and tourism industry across various regions, the following can be observed. First, regarding the trend of change, there are certain differences in the trends of scores at each measurement level for the sustainable development of the cultural and tourism industry among different regions. Specifically, the comprehensive scores of the ecological environment and regional grade scenic areas have been increasing year by year. The score of the social foundation has been rising with significant fluctuations. The comprehensive scores of the cultural and tourism foundation and economy have been continuously increasing slowly. This shows that the sustainable development capacity of China’s cultural and tourism industry is steadily improving. Second, different regions display distinct characteristics in relation to various evaluation indicators for the sustainable development of the cultural and tourism industry. Specifically, among the six major regions, the scores for the cultural and tourism economy can be ranked as follows: North China > East China > Central South China > Southwest China > Northwest China > Northeast China. In 2023, the score of North China, which ranked highest, was 9.241 times that of Northeast China, which ranked lowest. The annual average growth rates among regions are relatively large, and the development gaps between regions are also widening. In terms of regional distribution, the scores for cultural and tourism infrastructure show an obvious gradient difference, specifically, East China > Central South China > North China > Northeast China > Southwest China > Northwest China. In 2023, the score for East China, which ranked highest, was 2.257 times that of Northeast China, which ranked lowest. Among the six major regions, the scores for the social foundation are ranked as follows: East China > Central South China > North China > Northeast China > Southwest China > Northwest China. In 2023, the score of East China, which ranked highest, was 2.937 times that of Northwest China, which ranked lowest. The downward trend observed in 2020 was mainly due to the COVID-19 pandemic, which restricted transportation and other aspects in various regions, thus having a significant impact on the all-round development of the tertiary industry. From the perspective of the ecological environment, the scores of the six major regions are ranked as follows: Northeast China > North China > Southwest China, Central South China > Northwest China > East China. In 2023, the score of Northeast China, which ranked highest, was 1.340 times that of Northwest China, which ranked lowest. Third, the scores of evaluation indicators in each region generally show an upward trend. In terms of cultural and tourism infrastructure, the annual average growth rates of the Central South (0.032), Southwest (0.037), and Northwest regions (0.033) all exceed 0.03. Among the scores related to the social foundation in each region, the annual average growth rates of the Northwest (0.082), East China (0.065), Southwest (0.064), North China (0.063), and Central South (0.061) regions are significantly higher than 0.05. Among the scores related to the ecological environment in each region, the annual average growth rates of North China (0.061), Northeast China (0.056), and Central South China (0.054) are greater than 0.05. These data indicate that the development trends of cultural and tourism foundation, social foundation, and ecological environment in each region are gradually improving over time. Meanwhile, the annual average growth rates of the scores for the social foundation and ecological environment in each region are predominantly higher than the overall annual average growth rate of the sustainable development level of China’s cultural and tourism industry. The remaining scores for the cultural and tourism economy and cultural and tourism foundation measurements are all lower than the overall annual average growth rate of the sustainable development level of China’s cultural and tourism industry. Evidently, these three sub-dimensions make a substantial contribution to the overall level of the sustainable development level of the cultural and tourism industry.

5. The Dynamic Distribution and Evolutionary Trend of China’s Cultural and Tourism Industry’s Sustainable Development Level

As a non-parametric statistical method, kernel density estimation is mainly used for estimating the density function of the location parameter in probability distributions. This method is characterized by its ability to infer the characteristics of the overall distribution based on a limited sample of observed data. The density of the overall data is estimated with the kernel density function; that is, given a limited data sample and kernel function, the probability density of the overall data is output, presenting the results graphically. The deviation direction of the kernel density function can serve as an indicator for measuring the development level in time series analysis. If the kernel density function presents a rightward shift on the time series, the development level is relatively high; if it shifts leftward, this level is relatively low. The higher the curve in the kernel density function, the greater the probability density value of the measured variable within that value range; conversely, the lower the curve, the less likely it is that the variable will appear within that range. The narrower and steeper the kernel density peak, the more concentrated the data points are in that area, indicating a more balanced development of the measured variable; conversely, the wider and flatter the peak, the more dispersed the data points are in that area, reflecting a less balanced development. When the kernel density curve shows multiple peaks coexisting, there is severe differentiation or heterogeneity within the measured variable.
The formula for the kernel density function is as follows:
f ^ ( x ) = 1 n h i = 1 n K x x i h
Here, f ^ ( x ) is the kernel density function, i represents the measurement unit, x is the independently and identically distributed observation value, x i is the mean of the independently and identically distributed observation values, K ( x x i h ) is the kernel function, n is the number of sample observation values, and h is the smoothing bandwidth (which controls the amount of smoothing; the larger the value of h, the smoother the data, and h > 0). The kernel density distribution plot was drawn based on MATLAB 2018.

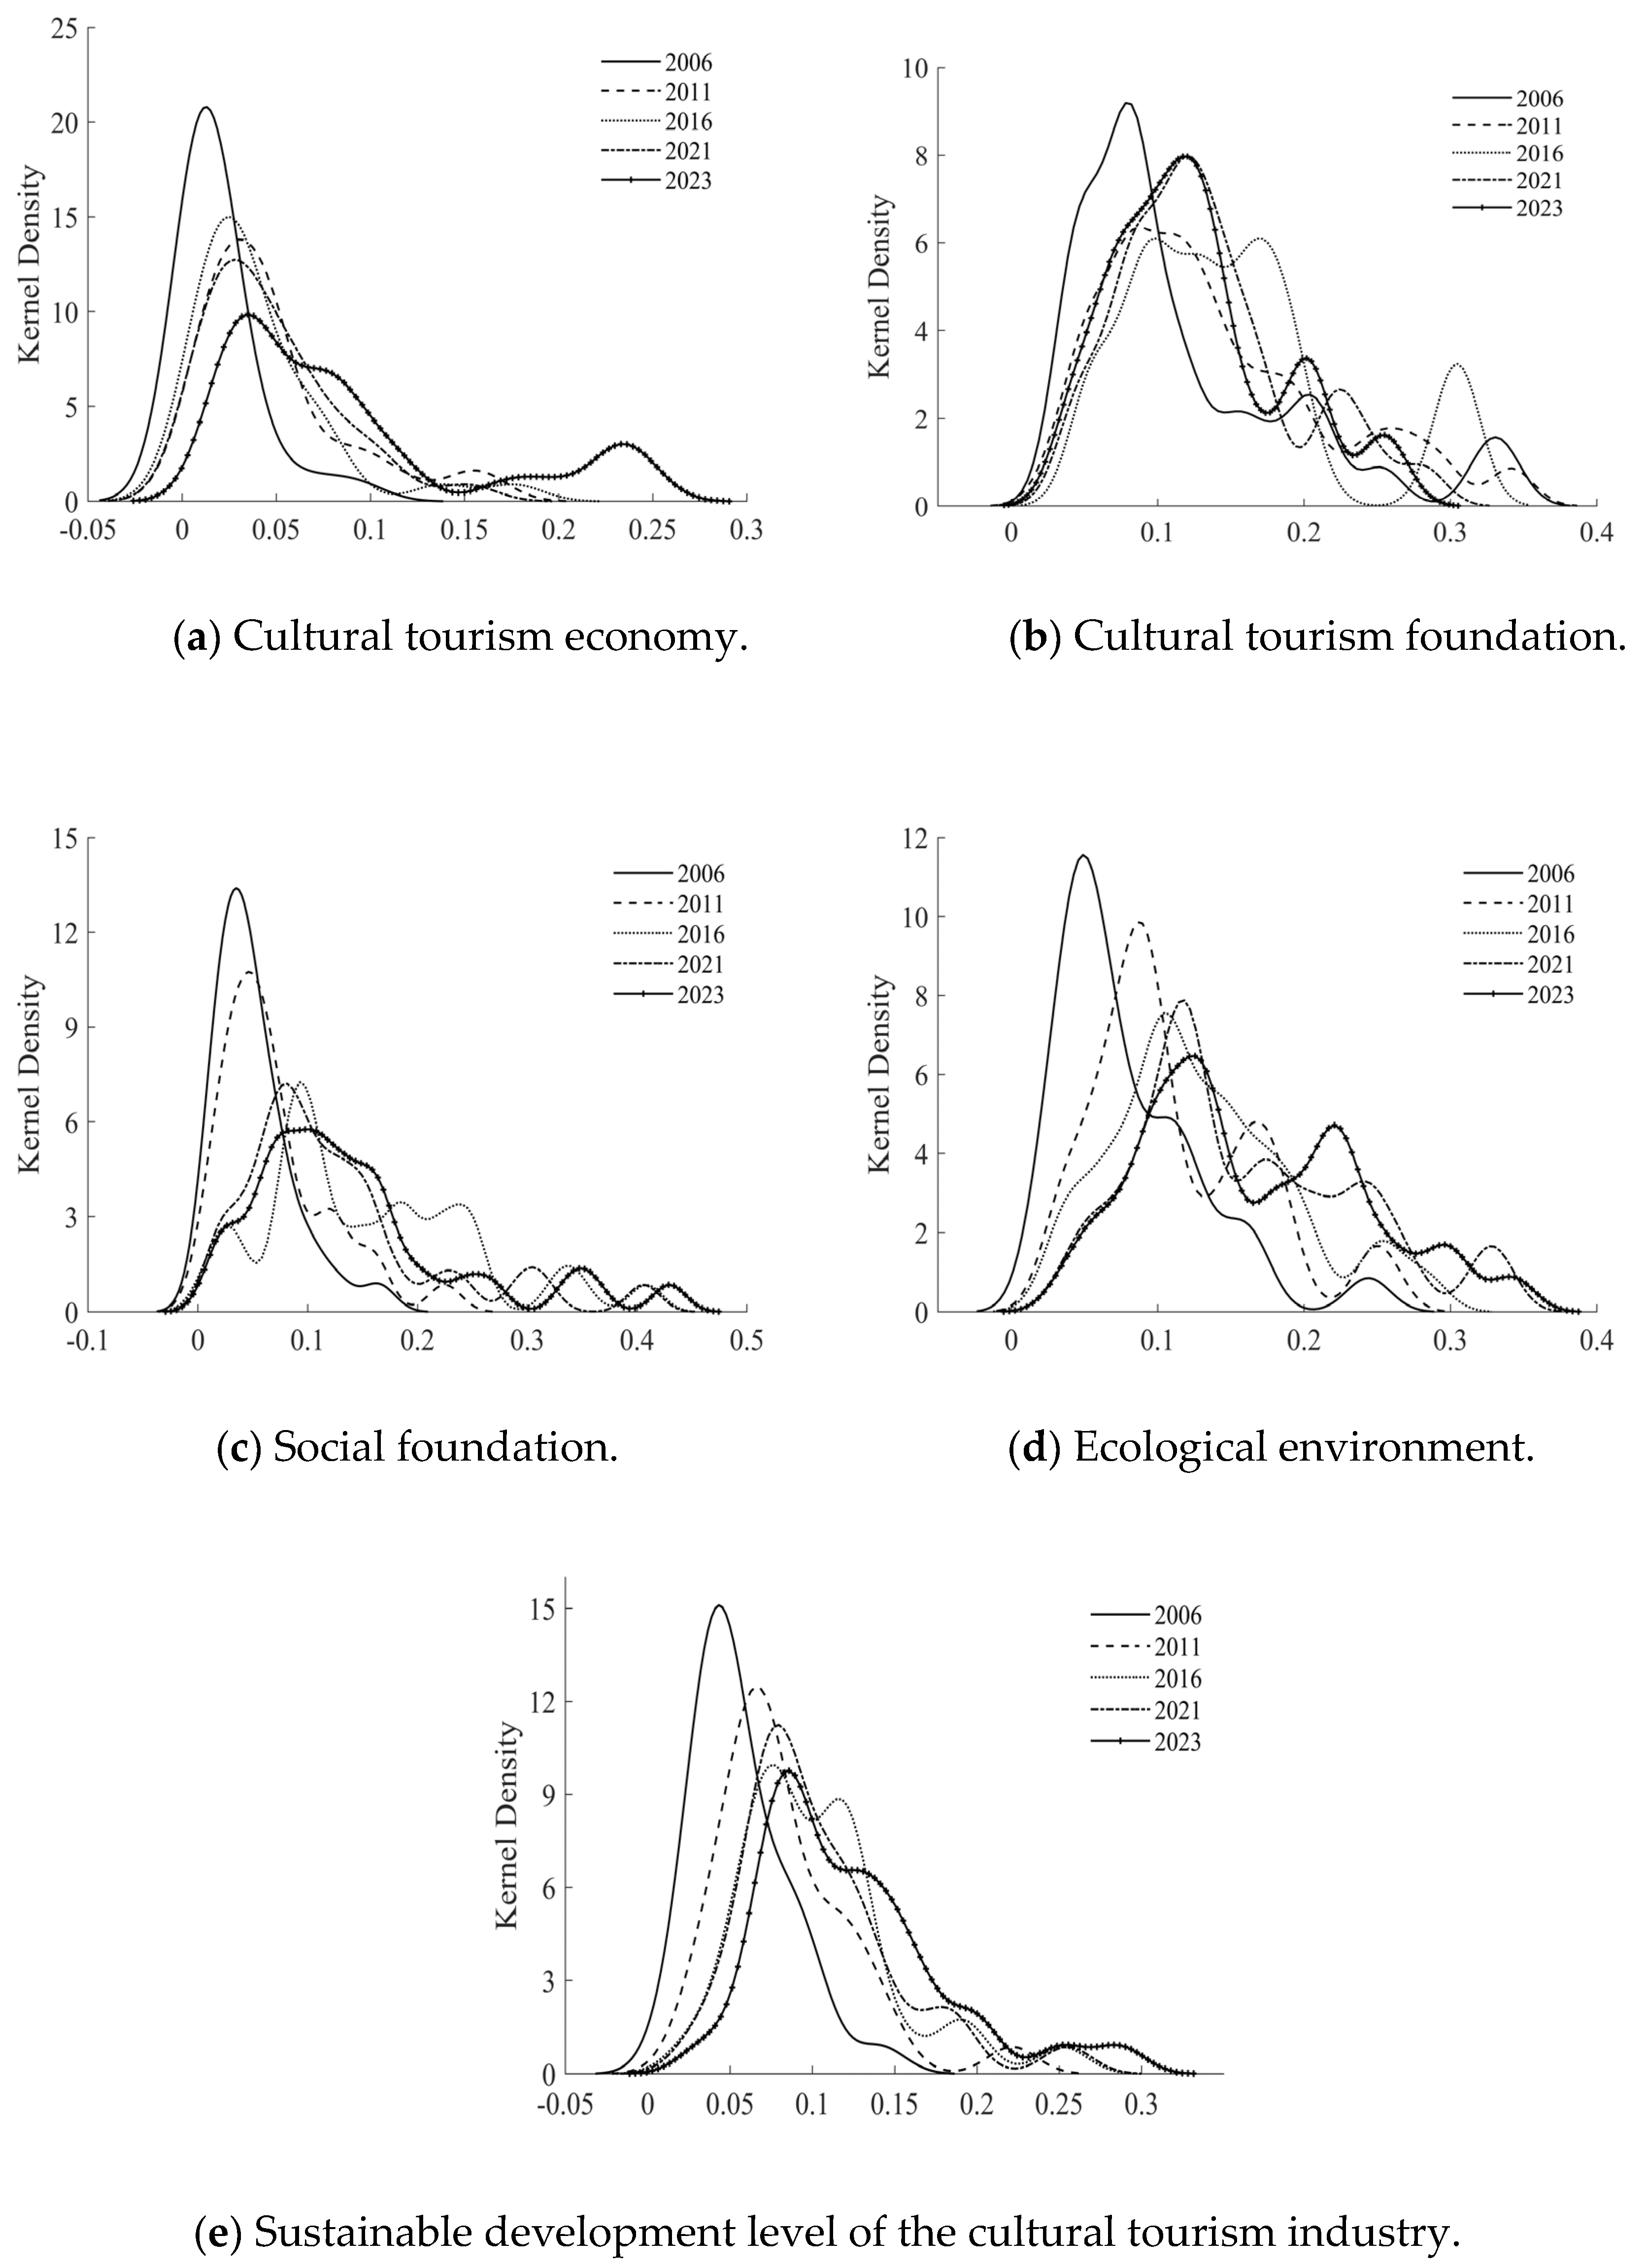
5.1. The Dynamic Distribution and Evolutionary Trend of the Sustainable Development Level and System Scores of China’s Cultural and Tourism Industry

The overall distribution and evolutionary trend of the sustainable development level of China’s cultural and tourism industry—and its scores at each level in 2006, 2011, 2016, 2021, and 2023—are estimated by the kernel density function (as shown in Figure 3). From an analysis of the overall trend, the kernel density distribution curve shows an obvious rightward shift, and its morphological structure changes from steep to flat. More specifically, the distribution pattern of “a single main peak with two secondary peaks” in the early period has gradually evolved into a complex pattern featuring “a prominent main peak and multiple coexisting peaks”. This change indicates that the overall situation regarding China’s cultural and tourism industry’s sustainable development level is continuously improving. However, despite the progress made by each province in this regard, there remains a significant imbalance across provinces. Although the continuous implementation of policy measures has, to some extent, narrowed the gap between provinces, it is undeniable that differentiation still persists.
As shown by the results of the time series analysis, the distribution of cultural and tourism economy indicators shows distinct dynamic change features—the distribution center continuously shifts to the high-value area, and its shape gradually changes from an initially leptokurtic state to a flatter one. This evolution process directly reflects the overall improvement in the development level of the cultural and tourism economy. Meanwhile, the “one main peak” is increasingly evidently transforming into “one main peak with a small peak”, indicating that the differences in the development level of the cultural and tourism economy among provinces are gradually increasing, as is the degree of differentiation. From the perspective of culture and tourism, the distribution curve has wholly shifted to the left, but the magnitude is relatively small, indicating that there has been a certain degree of reduction or degradation in cultural and tourism foundation resources, facilities, or related services, though at a relatively gentle pace. Meanwhile, the shape has become increasingly evident, transitioning from “one main peak with a small peak” to “one main peak with two small peaks”. The peak value of the curve has decreased and the distribution has widened, suggesting an increase in the diversity of the development level of cultural and tourism foundation and a greater disparity in levels among different regions. From the perspective of the social foundation, the distribution curve has moved to the right and the shape has changed markedly. The peak shape has gradually shifted from “narrow and steep” to “wide and flat”, indicating the continuous enhancement of the social foundation. At the same time, the shape has become progressively more distinct, changing from “one main peak with a small peak” to “one main peak with three small peaks”. The curve has become more scattered, suggesting that the disparities in the social foundation among provinces are gradually widening, and regional inequality is increasing. From the perspective of the ecological environment, the peak shape of the curve has gradually changed from “narrow and steep” to “wide and flat”, indicating that the quality of the ecological environment is continuously improving. Meanwhile, the shape has become increasingly evident, transitioning from “one main peak with a small peak” to “two main peaks with two small peaks”. The emergence of the multi-peak phenomenon indicates that the cultural and tourism industry presents a diversified development pattern in terms of ecological environment development. The shape has become more dispersed, suggesting that the ecological environment quality distribution among provinces has shifted from being relatively concentrated to more dispersed, with the differences gradually increasing and the imbalance intensifying.

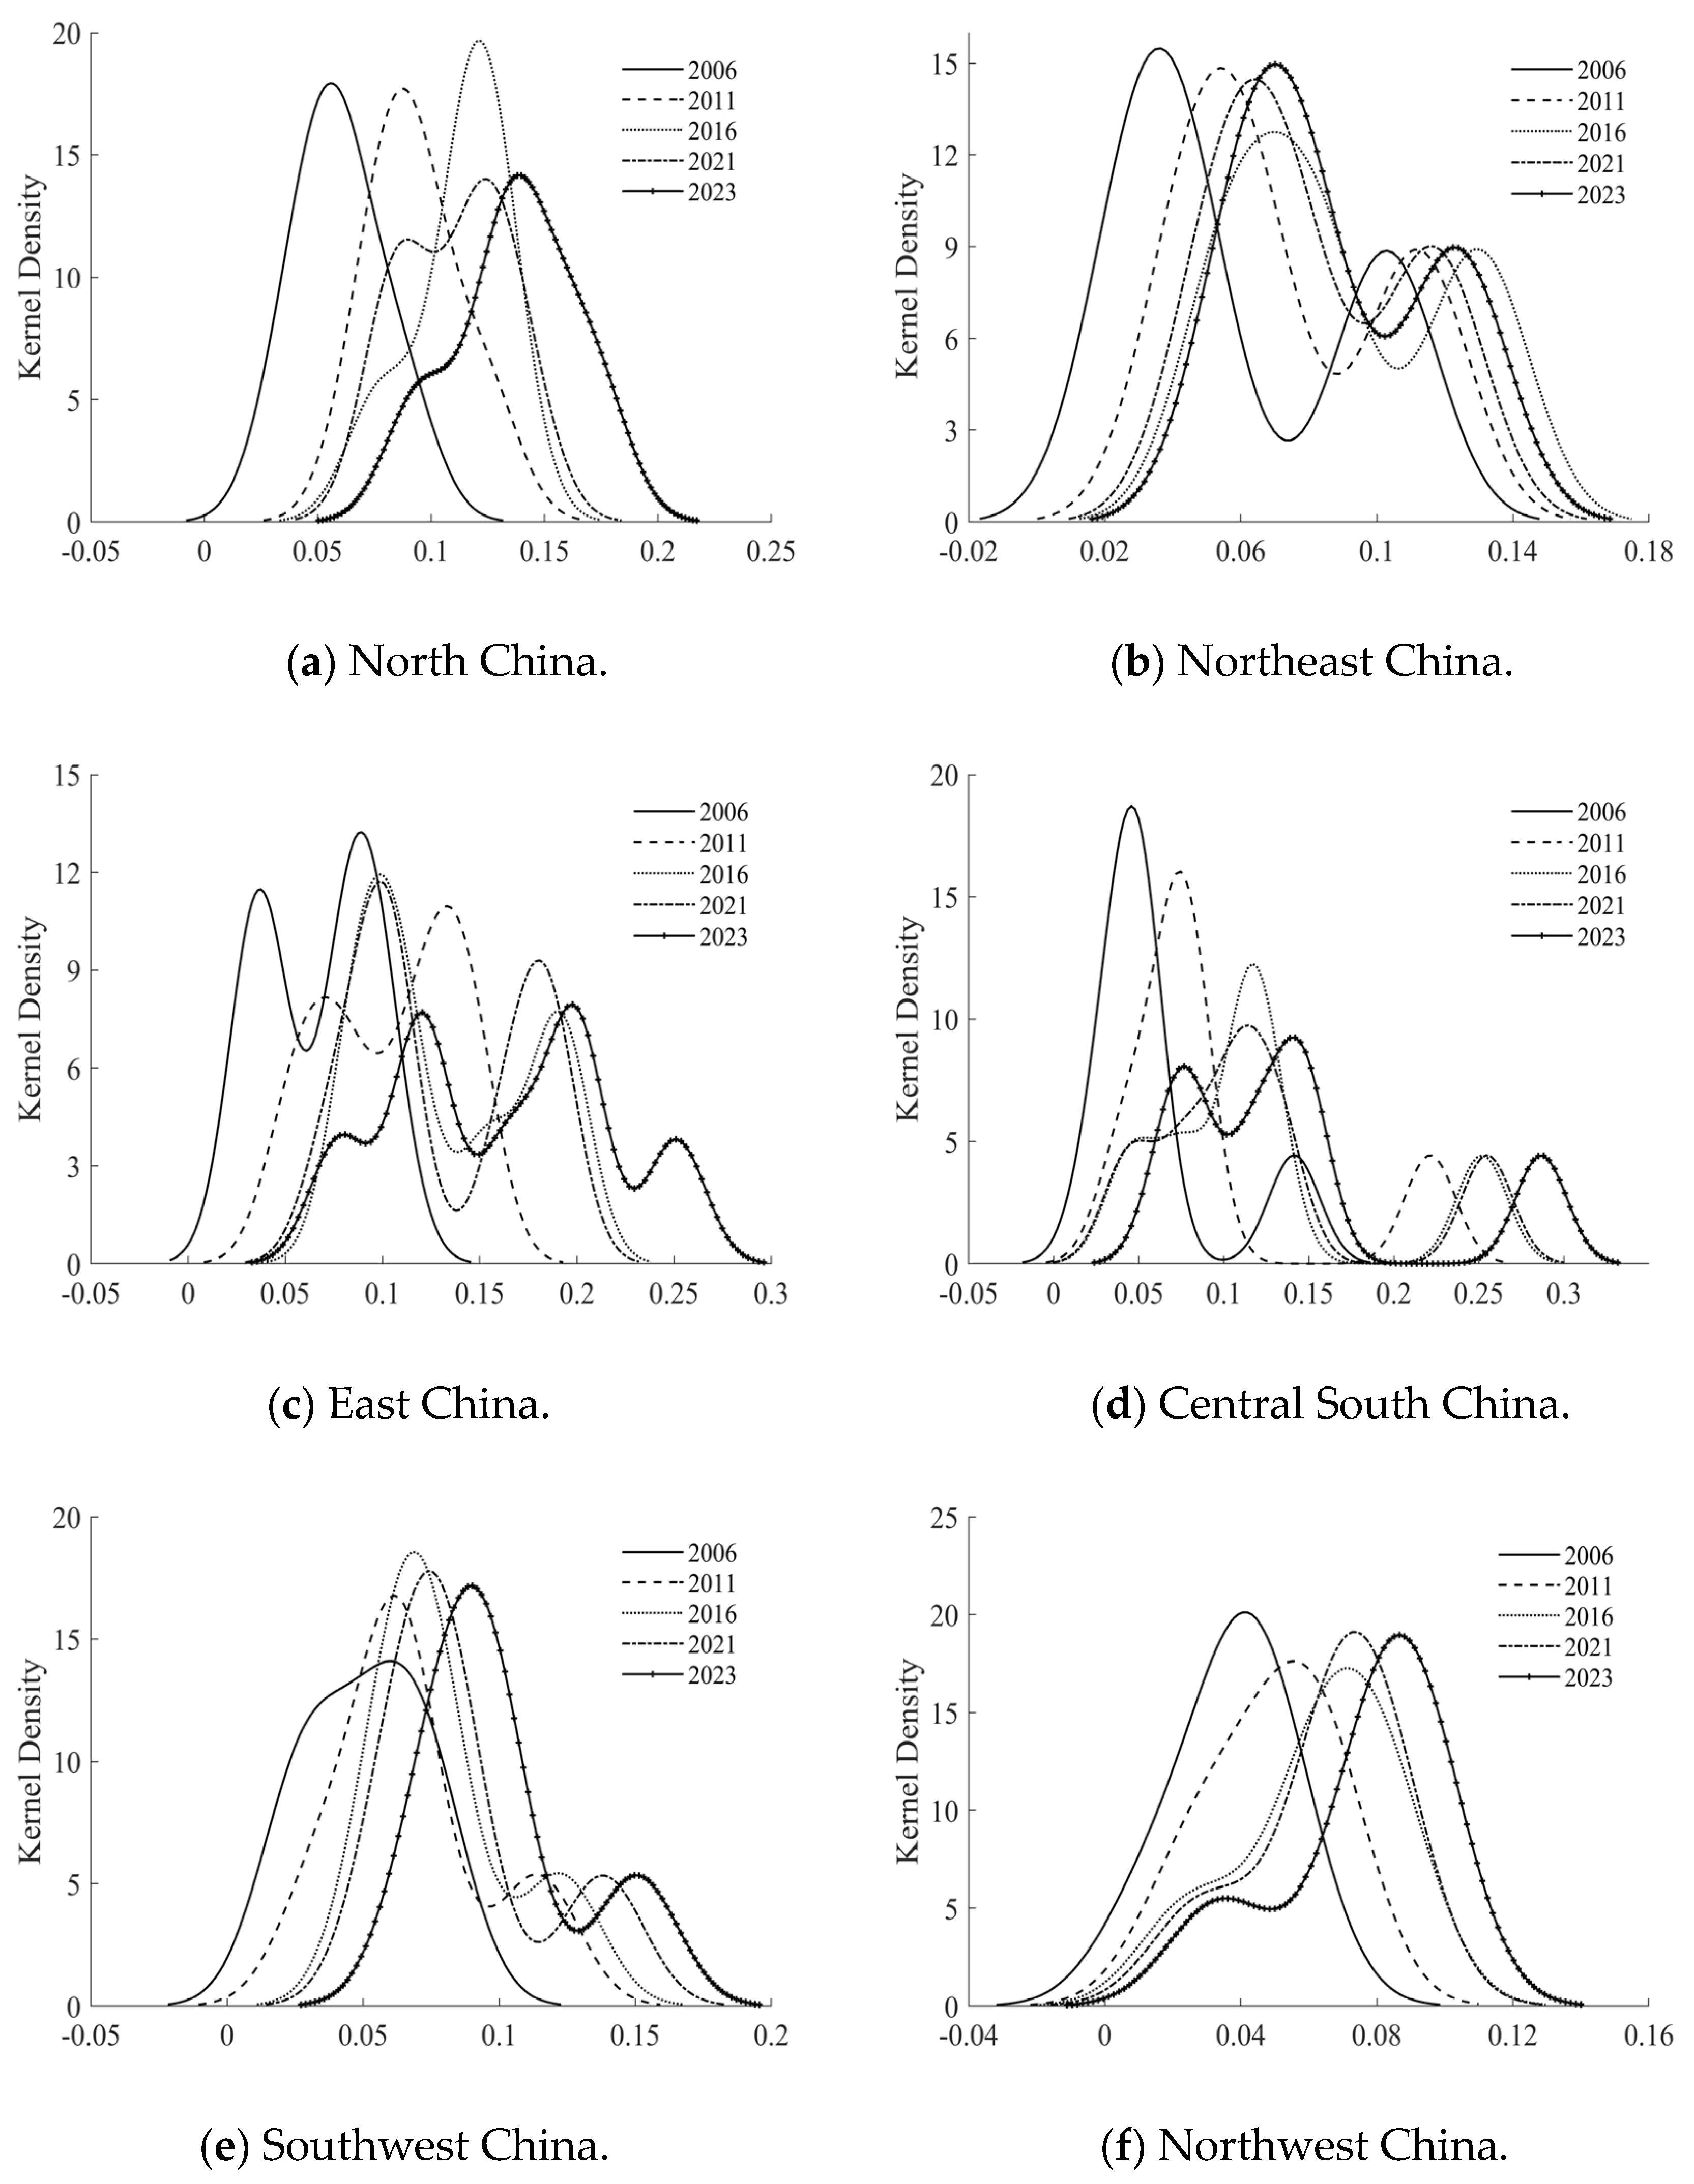
5.2. The Dynamic Distribution and Evolutionary Trend of the Sustainable Development Level of the Cultural and Tourism Industry in Six Major Regions

This research utilizes the kernel density estimation method to conduct an in-depth analysis of the overall distribution features and dynamic evolutionary trends of the sustainable development level of the cultural and tourism industry in six major regions in 2006, 2011, 2016, 2021 and 2023 (as shown in Figure 4). Focusing on North China, the distribution curve has been continuously moving to the right, and the coverage has comprehensively expanded, indicating that the sustainable development of the cultural and tourism industry in this region is generally on an upward trend, indicating a favorable development situation. However, the gap between provinces is also gradually increasing. From the perspective of the northeast region, the curve displays a rightward shift, which means that the development in this region was relatively consistent in the early stage, and then diverse development paths emerged. The overall development and regional development differences are continuously expanding. More specifically, in East China, its distribution characteristics are as follows: In the initial stage, the concentration level is relatively high, and then it tends to disperse. The distribution curve is significantly right-skewed, and its shape changes from a concentrated to a dispersed state. Moreover, the “multi-peak” feature becomes gradually more obvious. This reflects the fact that the sustainable development level of the cultural and tourism industry in this region was at a relatively high level in the early stages. Subsequently, the development tended to be stable, and the overall development trend continued to improve. However, the development differences among provincial-level regions have displayed expansion. Looking at the characteristics of Central South China, the distribution curve shows obvious agglomeration in the initial stage. Then, the distribution range gradually expands, along with a significant right skew. The overall shape changes from a concentrated to a dispersed distribution, indicating that the sustainable development level of the cultural and tourism industry in Central South China has gradually increased and the differentiation has gradually become more apparent. In the southwest region, the peak value is relatively high in the initial stage, and then gradually declines and disperses. The curve has a tendency to shift to the right, indicating that the sustainable development level of the cultural and tourism industry in this region was relatively high at the beginning. Later, the development tends to be diversified, and the overall development shows an upward trend, while the differences in the development level among provinces gradually increase. In the northwest region, the initial peak is relatively high, and then it declines and shifts rightward. The pattern of “one main peak and one small peak” persists, indicating that the sustainable development level of the cultural and tourism industry in this region was relatively high in the initial stage. Subsequently, the development has stabilized, and the overall development has shown an upward trend; however, differentiation has persisted.

6. Paths for Improving the Sustainable Development Level of China’s Cultural and Tourism Industry

6.1. Research Methods

Based on the above measurement results and using the basic data from 31 provinces (municipalities) across the country from 2006 to 2023, this paper adopts the fsQCA method to explore paths for improving the sustainable development level of the cultural and tourism industry in each province. More specifically, to study the factors enhancing sustainable development levels—and their combined enhancement paths—this research combines theories of regional tourism development [71], endogenous growth [72], and symbiosis [73]. Eight condition variables are selected—namely, the degree of openness; the upgrading of industrial structures; the labor, informatization, social consumption and transportation infrastructure levels; local fiscal environmental protection expenditure and a comprehensive index of environmental pollution—to explore diverse paths for improving the sustainable development level of the cultural and tourism industry in different regions.
On the one hand, our analysis was conducted from the perspective of the characteristics of each influencing factor. First of all, the cultural and tourism industry is currently in a critical period of transformation and upgrading. The traditional industrial structure can hardly meet the growing, diverse and high-quality tourism consumption needs. Enhancement in this regard could deeply integrate cultural and tourism industry with other sectors such as culture and technology, giving birth to more innovative formats and products, such as cultural and creative tourism, smart tourism, ecological health tourism, etc. While enriching tourists’ experiences, this would also enhance the added value and economic benefits of the industry. Secondly, the implementation of China’s opening-up policies such as the “Belt and Road” initiative has advanced the internationalization of the cultural and tourism industry. A relatively high level of openness is conducive to attracting more international tourists and increasing foreign exchange revenues. Meanwhile, it also facilitates the introduction of advanced international cultural and tourism management experiences, technologies and capital, promoting the international development of the local cultural and tourism industry and enhancing its competitiveness in the international market. Subsequently, as a typical service industry, labor level is directly related to service quality and tourist experience. Highly qualified labor forces with professional qualities, innovation capabilities and service awareness will provide more personalized and professional tourism services. Improving the quality of tourist experiences and enhancing customer loyalty would provide a solid foundation for the sustainable development of the cultural and tourism industry. In addition, against the backdrop of rapid advances in information technology, digital transformation and intelligent upgrading have become the main directions for developing the cultural and tourism industry. With the aid of advanced data analysis technologies, precise tourism product recommendations and personalized service customization can be achieved. In turn, this improves the operational management efficiency and economic benefits of the sector, complying with the national policy requirements of vigorously developing the digital economy and promoting the digital transformation of the cultural and tourism industry. Furthermore, as an important part of social consumption, the market scale and demand for cultural and tourism consumption have also been continuously expanding. A relatively high level of social consumption prompts the cultural and tourism industry to continuously innovate and upgrade its services, providing more high-end, diversified and personalized tourism experiences, such as luxury tourism routes, specially themed tourism, private customized tourism, etc., thereby promoting the sector to develop in a high-end and refined direction. At the same time, transportation is an important pathway for developing the cultural and tourism industry. A convenient and efficient transportation network can greatly shorten the travel times and spatial distances, reduce travel costs, and enable potential tourists to easily reach their destinations. The extension and expansion of major transportation arteries such as high-speed railways and expressways have expedited the development of the cultural and tourism industries. This not only expands the coverage of tourist source markets, but also promotes the integration and coordinated development of tourism resources between regions. Finally, under the guidance of sustainable development, ecological and environmental protection has become an important prerequisite and basis for the development of the industry. A comprehensive index of environmental pollution directly reflects the environmental quality of tourist destinations. A lower environmental pollution index indicates a higher-quality tourism environment, which will enhance the attractiveness and competitiveness of the cultural and tourism industry.
Recently, governments at all levels have introduced a series of environmental protection policies and regulations to strengthen cultural and tourism environment supervision. This requires the coordinated development of both economic and ecological benefits. On the other hand, considering the relevant policy background, these eight factors comprehensively cover multiple dimensions such as industrial structure, openness, labor force, informatization, consumption level, infrastructure, environmental protection expenditure, and environmental quality. These factors comprehensively account for the sustainable development level of the cultural and tourism industry from multiple perspectives, skillfully avoiding the inherent limitations of single-factor analysis, and providing an innovative combinatorial analysis approach for subsequent in-depth research. The application of this approach effectively fills the gap in the existing research in terms of configuration integration, helps to explore the sustainable development level of the cultural and tourism industries more comprehensively and systematically, and provides more scientific and precise theoretical evidence and practical guidance.
QCA is a case study-oriented, theoretical, set research method, including csQCA, mvQCA, fsQCA, etc. (as shown in Table 3). It is constructed on the formal language system of Boolean logic or set theory, and organically integrates the advantages of both “qualitative” and “quantitative” research methods [74]. QCA emphasizes that causal relationships do not exist in isolation, but are highly dependent on specific combinations of situations and conditions, denying the existence of universally applicable and constant causal laws. Starting from the perspective of overall configuration, it overcomes the limitations of the traditional single approach, revealing the causal connections behind complex phenomena.
More specifically, the judgment criteria for this method adopt consistency and coverage. The value range of consistency is (0, 1). Conditions with a consistency level higher than 0.9 are considered necessary for the result to occur [75]. The formula for consistency is as follows:
C o n s i s t e n c y X i     Y i = m i n ( X i , Y i ) X i
Coverage is used to measure the degree to which each condition combination (configuration) explains the outcome variable. The higher its value, the stronger the representativeness of this configuration in outcome occurrence. Its value range is (0, 1), and the formula for coverage is as follows:
C o v e r a g e X i     Y i = m i n ( X i , Y i ) Y i
In the formula, X i represents condition combination membership score, while Y i represents that of the outcome.
This paper intends to use the fuzzy set qualitative comparative analysis method (fsQCA) to explore the complex causal mechanism by which the sustainable development level of the cultural and tourism industry can be improved. Using configurational theory and Boolean algebraic operations, this study aims to achieve a comprehensive and necessary analysis of case causality and explore the internal event mechanisms, as well as the interaction mechanisms and potential association patterns among their constituent elements.

6.2. Data Analysis

6.2.1. Variable Setting

For ease of expression, in this paper, the upgrading of industrial structure is represented by “UI”, and its non-variable form is represented as “~UI”; the degree of opening up is represented by “DO”, and its non-variable form is represented as “~DO”; the labor level is represented by “LL”, and its non-variable form is represented as “~LL”; the informatization level is represented by “IL”, and its non-variable form is represented as “~IL”; the social consumption level is represented by “SC”, and its non-variable form is represented as “~SC”; the level of transportation infrastructure is represented by “TI”, and its non-variable form is represented as “~TI”; fiscal environmental protection expenditure is represented by “FE”, and its non-variable form is represented as “~FE”; the comprehensive index of environmental pollution is represented by “EP”, and its non-variable form is represented as “~EP”.
In addition, the outcome variable is the sustainable development level of the cultural and tourism industry, calculated based on the previously constructed evaluation index system, denoted as “CTIDEL”, and its non-variable form is represented as “~CTIDEL”. Specific information for each condition variable is shown in Table 4.
(1)
Condition Variables
The fsQCA method requires the use of theoretical saturation to achieve a good balance between variable comprehensiveness and operability, uncovering the condition combinations that lead to the result occurring. It utilizes case diversity to enable each case to exhibit differences across multiple dimensions, making these differences manageable. It also takes advantage of the feasibility of data analysis to obtain sufficiently rich information, making data collection and analysis highly feasible in practical operations. Therefore, for the above reasons, four to eight influencing factors are selected and key core conditional factors are screened out according to the relevant theoretical standards.
By combining the comprehensive evaluation index system of the sustainable development level of the cultural and tourism industry (as shown in Table 1), the core influencing factors are determined using the inductive method. Firstly, the literature is reviewed and systematically organized. Referring to the analytical logic of the theoretical framework system in relevant studies [76], core influencing factors are selected from four dimensions: the supporting force of the cultural and tourism economy, the attractiveness of cultural and tourism resources, the degree of perfect social foundations, and the effective force of the ecological environment. Then, after repeated adjustments and screenings, eight influencing factors were finally selected (as shown in Table 4). Among them, the supporting force of the cultural and tourism economy makes a contribution to the regional economy. It provides an important foundation for sustainable productivity, including the degree of opening up and the upgrading of industrial structure. The attractiveness of cultural and tourism resources involves quality and diversity resources. It is one of the core elements of the sustainable development of culture and tourism, including labor and informatization levels. The degree of perfect social foundation involves the social support aspect of the cultural and tourism industry’s sustainable development level. It is an important guarantee for the sustainable development of culture and tourism, including the social consumption and transportation infrastructure levels. The effective force of the ecological environment concerns its quality and sustainability. It is an important constraining condition for the sustainable development of culture and tourism, including fiscal environmental protection expenditure and a comprehensive index of environmental pollution. Finally, the eight influencing factors are measured to provide a basis for applying the fsQCA method in later stages.
(2)
Measurement of Condition Variables
Upgrading of industrial structure (UI). The industrial structure represents economic developmental health. A coordinated industrial structure implies higher economic growth vitality and stronger consumption capacity. The driving factors of tourism economic growth—with the upgrading of the tourism industry’s structure as the key predictive variable—have positive significance for the sustainable development of culture and tourism [77]. Referring to existing studies, this paper uses a comprehensive value obtained by multiplying the proportion of added value of each industry in GDP by its weight, and then adding them together to characterize it.
Degree of opening up (DO). The implementation of regional opening-up policies has effectively promoted the growth of cross-border tourist flows, facilitated the two-way expansion of the scale of both in- and outbound tourism markets, and significantly enhanced the integration efficiency of culture and tourism in local and surrounding cities in both the short and long term, having a positive impact on the optimization and upgrading of the tourism market’s structure [78]. Referring to existing studies, this paper characterizes this structure according to the ratio of the total import and export goods tax conversion rate to the regional gross domestic product.
Labor level (LL). As a labor-intensive service industry, the tourism industry benefits from high-quality labor, which helps improve management levels and promote tourism technology innovation, indirectly affecting the efficiency and quality of tourism industry development [79]. Referring to existing studies, this paper characterizes this labor by taking the natural logarithm of the number of employees in the tertiary industry.
Informatization level (IL). Relying on their excellent data dissemination and computing capabilities, information technologies centered around the Internet of Things, the internet, artificial intelligence, and virtual reality have long-term impacts on the integration efficiency of culture and tourism. They achieve this by innovating tourism service models, restructuring the organizational framework of tourism enterprises, and optimizing resource allocation mechanisms [80]. Referring to existing studies, this paper characterizes informatization according to the ratio of the total volume of postal and telecommunications services to the regional gross domestic product.
Social consumption level (SC). The transformation of consumption demand creates a reverse pressure mechanism, prompting enterprises to accelerate the innovation process of cultural and tourism products and emphasizing the key role of integrating cultural elements into enhancing the tourism experience in order to meet the diversified consumption demands [81]. This helps reduce irrational development investments and promotes the optimization and upgrading of industrial forms. Referring to existing studies, this paper characterizes social consumption according to the ratio of the total retail sales of consumer goods to the regional gross domestic product.
Transportation infrastructure level (TI). Improving transportation infrastructure significantly enhances the spatial accessibility of cultural and tourism destinations, thereby notably promoting their integration efficiency in local cities [34,81]. Based on the achievements of some scholars, this paper measures transportation infrastructure according to highway mileage and total freight volume logarithms.
Fiscal environmental protection expenditure (FE). As an indispensable consideration in the development of the cultural and tourism industry, fiscal environmental protection expenditure is directly related to improved environmental quality and effective ecological resource protection in tourist destinations with regard to investment direction and intensity. However, researchers often overlook environmental quality from the perspective of environmental protection expenditure and renewable energy consumption [82]. Therefore, based on existing studies, this paper characterizes environmental quality according to local government fiscal expenditure on environmental protection.
Comprehensive environmental pollution index (EP). The comprehensive environmental pollution index can directly reflect the environmental quality of tourist areas, making it a key indicator for measuring the sustainable development level of the cultural and tourism industry [83]. A single pollution indicator struggles to objectively reflect the environmental pollution situation of a region. After comprehensive consideration, the vertical and horizontal grade differentiation method is used to comprehensively evaluate the environmental pollution situation of Chinese cities at the prefecture level. Therefore, this paper characterizes the comprehensive environmental pollution index by using the entropy method for the total amount of wastewater discharge, the amount of sulfur dioxide emissions in waste gas, and the amount of general industrial solid waste generated.

6.2.2. Measurement and Calibration

This paper uses the previously calculated sustainable development level of the cultural and tourism industry as the value of the outcome variable. By setting three critical values for the condition variables, the data membership relationships of full membership, crossover point, and full non-membership are obtained. Referring to the research of scholars such as Ragin CC [84,85], the 95th percentile value, median value (50th percentile value), and 5th percentile value of the condition and outcome variables are, respectively, used as the calibration anchors for full membership, crossover point, and full non-membership. The fsQCA4.1 software is used to assign membership degrees to the data. More specifically, after the above membership assignment, all these variables are converted into fuzzy sets between 0 and 1, and then standardized through these three thresholds. The calibration anchors of each variable are shown in Table 5.

6.2.3. Univariate Necessity Analysis

Univariate condition variable analysis aims to identify whether a single condition variable has a critical impact on the outcome variable, thereby determining which conditions are necessary for improving the sustainable development level of the cultural and tourism industry. The key judgment indicators are consistency and coverage. A relatively high consistency value indicates a strong subset relationship between the condition and outcome variables, which may imply that the former is a necessary condition for the latter. It is generally considered that when the consistency indicator exceeds the threshold of 0.9, it can be determined as a necessary condition for the occurrence of the outcome [84,86]. Coverage is used to measure the degree to which each condition combination (configuration) explains the outcome variable. The higher its value, the stronger the representativeness of this configuration in outcome occurrence.
As shown in Table 6, the necessity and sufficiency analyses demonstrate that the consistency of the antecedent conditions is lower than 0.9, indicating that none are a necessary condition for enhancing the sustainable development level of the cultural and tourism industry. In other words, this level is not determined by a single antecedent condition; its essence lies in the synergistic effects of multiple, interacting antecedent variables, exhibiting a remarkable “multiple concurrency”. Consequently, a further analysis of the antecedent variable combination patterns is required.

6.2.4. Configuration Analysis and Result Interpretation

(1)
Analysis of Condition Combinations
Configuration analysis aims to explore how different combinations of multiple condition variables jointly lead to the occurrence of a specific result, thereby revealing the causal mechanisms of complex phenomena. Based on the condition configuration sufficiency test, this study explains the mechanism by which different combinations of antecedent variables affect the outcome variable of improving the sustainable development level of the cultural and tourism industry. This paper uses fsQCA4.1 software to analyze influencing factors in this regard. Each configuration represents a differentiated path to achieve the same outcome variable. This study adopts the following analysis criteria. In terms of determining the frequency threshold, considering that this paper examines a sample composed of 31 provinces, in order to avoid the occurrence of contradictory configurations, the minimum case frequency is set to 1. Secondly, the consistency index is used to evaluate the degree of membership between the configuration and the outcome set. According to Ragin’s [86] research, when the consistency score is lower than 0.75, inaccurate membership relationships may occur. Therefore, this study sets the consistency threshold at 0.75. In addition, the PRI consistency index can effectively identify the unique membership relationship of configurations in outcomes and non-outcomes. Referring to the research findings of Pappas and Woodside [87], the value of this index should be maintained at a level similar to the consistency score. Therefore, the PRI consistency threshold is also set to 0.75. After filtering out the truth value row table and conducting a standard analysis, three types of solutions—namely, complex, parsimonious, and intermediate solutions—are obtained [84,87]. The core conditions exist in both the parsimonious and intermediate solutions, while the peripheral conditions exist only in the intermediate solution [88]. Moreover, the intermediate solution has greater practical theoretical value. Based on this, we derived the combination paths for achieving a high level of sustainable development in the cultural and tourism industry.
Table 7 presents a configuration analysis of the high sustainable development level of the cultural and tourism industry. A comparison of the results shows that five causal configuration paths have been formed, including three types classified by core conditions—the “openness–human resources–consumption–environment-driven” type, the “human resources–consumption–environment-driven” type, and the “openness–environment-driven” type. The overall coverage rate is 0.535, indicating that these five configuration paths can explain approximately 53.5% of cases. The overall consistency of the five solutions reaches 0.972, further demonstrating that the combination of conditions has a certain degree of influence on the outcome variable. Therefore, by integrating eight key antecedent conditions, Table 7 shows an in-depth exploration of the multiple concurrent causal elements that affect the sustainable development level of the cultural and tourism industries, as well as their configuration paths.
(2)
Configuration Causal Path Analysis
As shown in Table 6, the equivalent configurations affecting the sustainable development level of the cultural and tourism industry include H1a, H1b, H1c, H2a, and H3a. The overall coverage is 53.5%, explaining 53.5% of the sample cases to a relatively high degree. The consistency of the five configuration paths and the overall consistency index both exceed the threshold of 0.9, fully demonstrating that the combination of antecedent variables has a high explanatory power for the outcome variable. According to the principle of the same core conditions, they can be divided into three configuration types. These configuration paths can be used to analyze the sustainable development level of the cultural and tourism industry (as shown in Figure 5), as well as the relevant theoretical model (as shown in Figure 6).
① Openness–Human Resources–Consumption–Environment-Driven Type
The three configuration paths, H1a, H1b, and H1c, with the core conditions of the degree of opening up (DO), labor (LL) and social consumption (SC) levels, and comprehensive environmental pollution index (EP), are renamed as the “openness–human resources–consumption–environment-driven type”. Among them, the degree of opening up (DO), labor (LL) and social consumption (SC) levels all play a core role in the outcome path due to their positive promoting effects. They work together with the comprehensive environmental pollution index (EP) to promote the occurrence of specific outcomes.
Configuration H1a: UI ×× DO ×× LL ×× ~IL × SC × ~TI × ~FE × EP (Upgrading of Industrial Structure × Degree of Opening Up × Labor Level × ~ Informatization Level × Social Consumption Level × ~ Transportation Infrastructure Level × ~ Fiscal Environmental Protection Expenditure × Comprehensive Environmental Pollution Index). The consistency of this configuration path is 96.0%, the raw coverage is 20.7%, and the unique coverage is 3.8%. Among them, the degree of opening up (DO), labor (LL) and social consumption (SC) levels and the comprehensive environmental pollution index (EP) are core conditions; the upgrading of industrial structure (UI), ~ informatization level (~IL), ~ transportation infrastructure level (~TI), and ~ fiscal environmental protection expenditure (~FE) are peripheral conditions, which are also auxiliary elements of the configuration path. This path describes a combination wherein—against the backdrop of a highly upgraded industrial structure, a high degree of opening up, and high levels of labor and social consumption—the informatization and transportation infrastructure levels and fiscal environmental protection expenditure are relatively low, and the environmental pollution problem is rather serious. That is, the optimization and upgrading of the industrial structure will enhance the overall innovation ability of the cultural and tourism industry. Although a low level of informatization will limit the pace of digital transformation, it would not impede advancements in traditional service areas. Improving transportation infrastructure is the foundation for the development of the cultural and tourism industry. However, a lack of improvement in this regard does not completely hinder development. Instead, it prompts the industry to seek innovative solutions under existing conditions. A reduction in fiscal environmental protection expenditure may reflect the government’s environmental protection investment strategy, but this does not exclude the cultural and tourism industry’s own active efforts and contributions in this regard.
The representative province in this model is Liaoning. During the “14th Five-Year Plan” period, the province’s opening up plan clearly proposes that, by 2025, the level of the province’s open economy will be significantly enhanced, and the total volume of imports and exports in the province will surpass CNY 1 trillion. Leveraging its geographical advantages as a coastal province, it actively attracts foreign investment in the cultural and tourism industry.
Configuration H1b: UI × DO × LL × IL × SC × ~TI × FE × EP (Upgrading of Industrial Structure × Degree of Opening Up × Labor Level × Informatization Level × Social Consumption Level × ~ Transportation Infrastructure Level × Fiscal Environmental Protection Expenditure × Comprehensive Environmental Pollution Index). The consistency of this configuration path is 95.8%, the raw coverage is 18.3%, and the unique coverage is 1.3%. Among them, the degree of opening up (DO), labor (LL) and social consumption (SC) levels and the comprehensive environmental pollution index (EP) are core conditions; the upgrading of industrial structure (UI), informatization level (IL), ~ transportation infrastructure level (~TI), and fiscal environmental protection expenditure (FE) serve as auxiliary elements of the configuration path, playing a supplementary and supportive role in its formation and development. This path depicts a combination with a highly upgraded industrial structure, a high level of opening up, and high labor, informatization and social consumption levels; the transportation infrastructure level is, however, on the lower side, yet the fiscal environmental protection expenditure is relatively high and the environmental pollution issue is rather severe. That is to say, the high-end progress of the industrial structure and the steady enhancement of the informatization level play a positive role in promoting cultural and tourism industry competitiveness. Despite the fact that inadequate transportation infrastructure levels may pose certain challenges to the accessibility and convenience of the cultural and tourism industry, this shortcoming can be alleviated to some extent by optimizing resource allocation and innovating service models. Meanwhile, the government’s increased fiscal input in environmental protection reflects its firm commitment to facilitating the industry’s green transformation and development.
The representative province under this model is Zhejiang. In terms of environmental protection, Zhejiang emphasizes ecological protection in the development of tourism, strives to build a world-renowned tourist destination, and promotes the formation of a strategic section of the new pattern of all-round opening up, integrating the concept of green development throughout the entire process of cultural and tourism industry development. In addition, according to data from the Zhejiang Provincial Department of Ecology and Environment, the comprehensive index of ambient air quality in the area averages 4.25, and the proportion of days with excellent air quality averages at 81.1%. These superior ecological and environmental conditions provide an important guarantee for the sustainable development of Zhejiang’s cultural and tourism industry.
Configuration H1c: UI × DO × LL × ~IL × SC × TI × FE × EP (Upgrading of Industrial Structure × Degree of Opening Up × Labor Level × ~ Informatization Level × Social Consumption Level × Transportation Infrastructure Level × Fiscal Environmental Protection Expenditure × Comprehensive Environmental Pollution Index). The consistency of this configuration path is 96.7%, the raw coverage is 25.6%, and the unique coverage is 1.7%. Among them, the degree of opening up (DO), labor (LL) and social consumption (SC) levels and the comprehensive environmental pollution index (EP) are core conditions; the upgrading of industrial structure (UI), ~ informatization level (~IL), transportation infrastructure level (TI), and fiscal environmental protection expenditure (FE) are peripheral conditions, which are also auxiliary elements of the configuration path. This path describes a combination where—against the backdrop of a highly upgraded industrial structure, a high degree of opening up, high labor, social consumption, and transportation infrastructure levels, and a high fiscal environmental protection expenditure—the informatization level is relatively low, and the environmental pollution problem is rather serious. The upgrading of the industrial structure will influence the overall development direction of the cultural and tourism industry. A lack of informatization would, to a certain extent, limit the development of digital transformation and intelligent services in the cultural and tourism industry, but this is not a decisive factor. Improved transportation infrastructure levels provide more convenient transportation conditions for the cultural and tourism industry, in turn attracting more tourists. The increase in fiscal environmental protection expenditure reflects the financial guarantee provided by the government for environmental protection and sustainable development. Among them, the core elements directly determine the basic situation and development potential of the cultural and tourism industry, while the auxiliary conditions provide strong support and guarantees. The combined effect of these core elements and auxiliary conditions promotes the efficient and sustainable development of the cultural and tourism industry, achieving a win–win situation of both economic and environmental benefits.
The representative province under this model is Shandong. In terms of the labor level, the province has implemented the “Talent-driven Tourism Development” strategy, attracting high-end cultural and tourism talents from home and abroad to start businesses and seek employment in Shandong through policy support and financial rewards, amongst other things. In terms of an adequate labor force, it ranks 3rd among 27 provincial-level administrative regions across the country. In terms of social consumption level, the province has hosted the Shandong Cultural and Tourism Benefit Consumption Season for six consecutive years, distributing a large number of benefit consumption vouchers. It has also organized cultural and tourism festivals such as the Qingdao Beer Festival and the Mount Tai International Climbing Festival, stimulating the public’s enthusiasm and enhancing the social consumption level of the cultural and tourism industry.
② Human Resources–Consumption–Environment-Driven Type
Configuration H2a, with the core conditions of labor (LL) and social consumption (SC) levels and the comprehensive environmental pollution index (EP), is renamed as the “Human Resources–Consumption–Environment-Driven Type”. Among them, the labor (LL) and social consumption (SC) levels give full play to the positive role of positive indicators, becoming the core forces driving result formation. Together with the comprehensive environmental pollution index (EP), they jointly shape path results.
Configuration H2a: ~UI × ~DO × LL × ~IL × SC × TI × FE × EP (~ Upgrading of Industrial Structure × ~ Degree of Opening Up × Labor Level × ~ Informatization Level × Social Consumption Level × Transportation Infrastructure Level × Fiscal Environmental Protection Expenditure × Comprehensive Environmental Pollution Index). The consistency of this configuration path is 96.3%, the raw coverage is 39.2%, and the unique coverage is 17.4%. Among them, ~ upgrading of industrial structure (~UI), ~ degree of opening up (~DO), ~ informatization level (~IL), transportation infrastructure level (TI), and fiscal environmental protection expenditure (FE) are peripheral conditions. That is, with the support of a high-quality labor level and a low level of environmental pollution index, as well as the significant influence of the social consumption level on industrial orientation, enhancing the transportation infrastructure will facilitate tourist travel and expand the tourist source market radius. In addition, appropriate fiscal environmental protection expenditure provides material guarantees for environmental governance and ecological restoration, ensuring that the comprehensive environmental pollution index remains within an ideal range. Meanwhile, when upgrading the industrial structure fails to sufficiently increase its added value, the cultural and tourism industry needs to rely on its unique resilience and stand firm in the market through differentiated competition. In an environment with a low level of opening up, relying on internal labor advantages, social consumption potential, and environmental protection, the cultural and tourism industry can develop self-sufficiently. Traditional cultural and tourism service models and interpersonal communication methods can still thrive without a high level of informatization; however, in the long term, improving the informatization level remains an inevitable direction for future development.
The representative province under this model is Henan. In terms of labor level, the province has implemented a strategy for integrating cultural tourism and creativity, promoting in-depth integration and providing new employment opportunities and career development paths in the labor market. Henan has also promoted the “Cultural Industry Commissioner” system, thereby transforming this region’s unique cultural tourism resources into development advantages and facilitating rural revitalization and high-quality employment. In terms of social consumption, the province has strengthened the construction of cultural tourism infrastructure, promoted integration with other industries, and created more consumption scenarios such as developing characteristic towns and cultural theme parks. While improving the consumption environment, Henan has also made efforts to enhance residents’ willingness to consume cultural tourism products. In terms of environmental protection, the province has actively promoted ecological and environmental protection work, strengthened environmental management in and around tourist attractions, and implemented ecological restoration projects in scenic spots such as the Songshan Shaolin Temple and Yuntai Mountain Scenic Areas to protect forests and water resources.
③ Openness–Environment-Driven Type
Configuration H3a, with the core conditions of the degree of opening up (DO) and the comprehensive environmental pollution index (EP), is renamed as the “Openness–Environment-Driven Type”. Among them, the degree of opening up (DO), with its positive influence, plays a core, leading role, and jointly contributes to the final resulting configuration with the comprehensive environmental pollution index (EP), which has a negative effect.
Configuration H3a: UI × DO × LL × IL × ~SC × TI × FE × EP (Upgrading of Industrial Structure × Degree of Opening Up × Labor Level × Informatization Level × ~ Social Consumption Level × Transportation Infrastructure Level × Fiscal Environmental Protection Expenditure × Comprehensive Environmental Pollution Index). The consistency of this configuration path is 98.9%, the raw coverage is 18.4%, and the unique coverage is 2.9%. Among them, the upgrading of industrial structure (UI), labor (LL), informatization (IL), ~ social consumption (~SC), and transportation infrastructure (TI) levels and fiscal environmental protection expenditure (FE) are auxiliary elements. From this configuration path, it can be seen that, under the combined effects of a high level of opening up and a relatively low comprehensive environmental pollution index, the upgrading of the industrial structure, as an auxiliary element, provides solid industrial support for the development of the cultural and tourism industry. A high labor level will directly determine the quality and efficiency of cultural and tourism services. An improved informatization level would promote the digital transformation of the cultural and tourism industry. Enhanced transportation infrastructure provides strong support for the development of the industry. An increase in fiscal environmental protection expenditure will provide necessary financial and policy support for the green development of the cultural and tourism industry. Meanwhile, as a reverse indicator, we should not overly rely on the direct pull of the social consumption level. Instead, we should stimulate market demand by enhancing the attractiveness and service quality of cultural and tourism products.
The representative province under this model is Guangdong. In terms of the degree of opening up, the province has deepened cultural and tourism cooperation with countries participating in the Belt and Road Initiative, carrying out practical cooperation in areas such as two-way tourist flows and market development. In terms of environmental protection, the province has promoted green and low-carbon tourism models in the cultural and tourism industry, such as by advocating for the touristic travel “leaving no white pollution” model. Meanwhile, as it has the first provincial-level standardization technical committee for carbon peaking and carbon neutrality in China, Guangdong has also undertaken important functions in standard setting and coordination. It plays a key role in standard incubation and resource integration in the field of “carbon peaking and carbon neutrality”, boosting the sustainable development levels of the cultural and tourism industry.

7. Conclusions and Policy Recommendations

7.1. Discussion

This study clarifies the theory of sustainable development and provides an overall overview of the sustainable development level of the tourism industry. At present, most studies lack theoretical support for the cultural and tourism industry, and analyses of key issues are often superficial. For example, some studies only examine the importance of the cultural and tourism industry [89], explore the perspectives of different stakeholders [90], or focus on improving tourism experiences via digitalization [91]. The absence of a theoretical structural framework can make article narratives messy, leading to a lack of logical connection among the various parts. The comprehensive evaluation index system for the sustainable development level of the cultural and tourism industry, which includes four dimensions—cultural and tourism economy, cultural and tourism foundation, social foundation, and ecological environment—provides evidence to support and challenge the existing theoretical framework. Taking the theory of sustainable development as a breakthrough point, combined with the theory of green development and the construction of ecological civilization systems, it provides an innovative analytical framework for reviewing national patterns, analyzing differences at the provincial level, and exploring strategies at the improvement path level.
The combination of the range entropy method and fsQCA has solved the historical limitations of existing research in the field. Most existing studies only adopt, for example, the entropy method [92], the analytic hierarchy process [93], or principal component analysis [94] to explore the current development status of the tourism industry or related influencing factors. Although there are some studies combining two methods, these are generally as follows: analytic hierarchy process (AHP)–entropy method [95], principal component analysis–AHP [96,97], and analytic hierarchy process–network analysis [98]. This study, however, addresses the limitation of the combination of the range entropy method and fsQCA. It adopts a dynamic analysis framework of “data standardization–weight measurement–multi-dimensional configuration”, achieving a closed research loop from “identification of influencing factors” to “discovery of configuration paths”, and providing a methodological innovation example for research in the field of the sustainable development of the cultural and tourism industry.
This paper expands the research scope of paths for improving sustainable development in this field. Research related to the cultural and tourism industry is often limited to one-dimensional analyses based on the ecological environment or economic benefits. By standardizing the data, we determined the outcome variable of the sustainable development level of the cultural and tourism industry and measurement criteria for eight condition variables. This study shows that multi-dimensional combinations such as “high openness and excellent ecological environment” can improve the sustainable development level of the cultural and tourism industry more than a single factor; currently, research on the integration of culture and tourism is gradually gaining traction [85]. This can be limited to the exploration of natural and cultural values [99], the influencing factors of culture and tourism [100], research on cultural and environmental resilience [101,102,103], ways of promoting the integration of culture and tourism [104], etc. However, there are no practical pathways for enhancing the sustainable development level of the cultural and tourism industry. Therefore, by combining innovative methods, this study effectively compensates for the explanatory limitations of the traditional synergy theory. While refining the characteristics of the cultural and tourism industry, it systematically constructs a practical system for enhancing its sustainable development. In addition, for the practical paths developed, based on the regional differences that exist in regions with different resource endowments, operational implementation plans suited to local conditions have been proposed, offering more practical possibilities for improving the sustainable development level of the cultural and tourism industry from multiple dimensions.

7.2. Conclusions

From the perspective of sustainable development, this paper has constructed a comprehensive evaluation index system for the sustainable development level of the cultural and tourism industry in four dimensions: cultural and tourism economy, cultural and tourism foundation, social foundation, and ecological environment. It used the range entropy method to calculate the sustainable development level of the industry in 31 Chinese provinces from 2006 to 2023. Kernel density estimation was used to analyze its distribution dynamics and evolutionary trend. Finally, taking the sustainable development level of the cultural and tourism industry as the result variable, the fsQCA method was adopted to explore the combined pathways for improvements in this regard.
First, we examined the issue from the perspective of the overall development pattern. (1) At the national level, the overall sustainable development level of China’s cultural and tourism industry is relatively low. The measurement scores at all levels can be ranked as ecological environment > social foundation > cultural and tourism foundation > cultural and tourism economy. The cultural and tourism economy ranks as the lowest, while the provinces with the highest and lowest scores are Jiangsu and Ningxia, respectively. Meanwhile, the ecological environment takes the lead in the multi-dimensional system, with the highest score among provinces represented by Inner Mongolia, while that with the lowest score is Hainan. (2) Focusing on the provincial dimension, there is a significant degree of dispersion among provinces. Guangdong and Jiangsu, for example, rank among the top in terms of comprehensive scores, while Qinghai and Ningxia have relatively lower scores. From a regional perspective, the East China region stands out in the overall improvement process, while the northwest region lags behind slightly. In terms of score trend, all regions, on the whole, show growth. However, the problem of regional development imbalance remains relatively prominent. From the perspective of distribution dynamics and evolution trends, and focusing on the national level (1), the overall development trend of the core density estimation and analysis can be ranked as social foundation > cultural and tourism foundation > ecological environment > cultural and tourism economy. Over time, the curve shifts to the right and tends to change into a “wide flat shape”. (2) Focusing on the regional level, the development trend shows the characteristics of North China > East China > Central South > Northeast > Southwest > Northwest. The sustainable development levels of the cultural and tourism industries in North, East, Central South and Southwest China tend to show a multi-dimensional and -capital investment trend. In the early stages of the industry’s development in Northeast and Northwest China, it presented a single feature, before changing and showing a multi-dimensional development trend.
Second, from the perspective of combined paths for enhancing the sustainable development levels, the fsQCA configuration analysis results show that there are three types of improvement paths, including core factors such as the degree of opening up to the outside world, labor and social consumption levels, and the comprehensive index of environmental pollution. (1) The “open–human resource–consumption–environment-driven” path represented by Liaoning, Zhejiang and Shandong provinces emphasizes multi-dimensional synergy through optimizing the industrial structure, expanding the opening up to the outside world, improving the quality of the labor force, enhancing the social consumption capacity and improving the ecological environment. (2) The “human–consumption–environment-driven” path represented by Henan Province focuses on the internal labor force advantages and the release of social consumption potential; it can still achieve breakthroughs under conditions of insufficient high-level industrial structure. (3) The “open–environment-driven” path represented by Guangdong Province highlights the coupling effect between the international opportunities brought about by opening up to the outside world and the green and low-carbon development model, achieving a win–win situation of both ecological and economic benefits.

7.3. Practical Suggestions

Based on these results, the following policy recommendations are proposed:
(1)
Open–human resource–consumption–environment-driven regions. Focusing on the regional level, efforts should be made to promote regional cooperation, integrate resources and establish regional cultural and tourism cooperation alliances. Additionally, the integration and sharing of high-quality cultural and tourism resources in Liaoning, Zhejiang, Shandong and other places should be promoted. For instance, the “Bohai Rim–Yangtze River Delta–Jiaodong Peninsula Cultural and Tourism Alliance” could be established to jointly create cross-regional premium tourism routes. This would connect the historical and cultural relics of Liaoning, the natural scenery of Zhejiang and the Confucian culture of Shandong, as well as other characteristic resources, to achieve the mutual sharing of tourists and complementary advantages. In addition, The Silk Culture Experience Corner, the Interactive classroom of Shandong Confucian Culture, and scenic spots along the route have jointly launched the “one journey with multiple stops” preferential package. At the national level, efforts should be made to deepen international cooperation and green innovation. The state should support regions such as Shandong and Guangdong, which have a high degree of openness and rich resources, in strengthening the synergy between ecological protection and open cooperation. On the one hand, Shandong can rely on the Belt and Road Initiative to promote the international development of its cultural and tourism industry. As an example, it held the China–South Korea Cultural Exchange Year event to deepen cross-border tourism cooperation and cultural exchanges. On the other hand, to accelerate the standardized construction of carbon peaking, “Low-Carbon Construction Standards for Coastal Scenic Areas” should be formulated. For example, the proportion of electric shuttle buses in scenic areas should be no less than 60%, and the photovoltaic coverage rate should not be below 20%, etc. Another approach could be to designate areas that meet the standards as “Carbon Neutrality Demonstration Scenic Areas” and provide corresponding annual operation subsidies. Promoting green tourism models, such as by building “zero-carbon docks” and ships in low-carbon coastal scenic spots, would aid in achieving a win–win situation with both economic and ecological benefits. Meanwhile, these regions are encouraged to innovate in terms of cultural and tourism consumption. For instance, a “Metaverse Cultural Tourism Experience Hall” has been piloted in the Qianhai Free Trade Zone of Shenzhen, and a “Confucian Culture Immersive Theater” has been established in Qufu, Shandong, to enhance international competitiveness and build a globally renowned cultural and tourism brand;
(2)
Human–consumption–environment-driven regions. Focusing on the regional level, efforts should be made to deeply cultivate cultural resources and consumption guidance. For regions like Henan that are rich in cultural resources and have great consumption potential, it is necessary to guide them to create immersive cultural and tourism projects, such as holding Shaolin Kung Fu events, building a “Kung Fu Town” around the Shaolin Temple scenic area, setting up Shaolin Kung Fu training schools and allowing students to obtain Dan certificates, enriching Yu Opera cultural experience activities and charging tourist to learn simple face-changing moves, etc. The development of cultural and creative products, such as “Yu Opera blind boxes” that hold facial makeup and key links for opera costumes, as well as derivative products, could stimulate social consumption potential while forming an endogenous growth model of “consumption-driven cultural empowerment”. Focusing on the national level, we recommend incorporating cultural and tourism ecological protection into the national “mountains, rivers, forests, farmlands, lakes, grasslands and deserts” systematic governance project, giving priority to supporting environment-driven regions such as Liaoning, Henan and Guangdong in applying for the title of “National Demonstration Zone for Ecological Civilization Construction”. We also suggest establishing a “Special Fund for Ecological Compensation in Cultural and Tourism Development”, such as by extracting 3% from the ticket revenue of scenic spots and incorporating it into the fund to restore surrounding forests and vegetation. Another approach could be to provide financial incentives for regions that have made outstanding contributions to ecological protection, promoting the inclusion of cultural and tourism carbon sinks in the national carbon emission trading market. For instance, through monitoring the annual carbon emissions of scenic spots, the remaining carbon sinks—after offsetting through afforestation—can be listed for trading, exploring a win–win model of “ecological protection, cultural and tourism revenue”;
(3)
Open–environment-driven regions. Focusing on the regional level, efforts should be made to strengthen the green and low-carbon development model. We suggest piloting “blue carbon tourism” in the coastal areas of environment-driven provinces like Guangdong, such as via mangrove eco-tourism carbon sink trading, and setting up a “carbon sink account”. When tourists accumulate a sufficient amount of donations, they can exchange these for a night’s homestay. Another approach could be to promote the “forest health and wellness low-carbon homestay” model in mountainous areas, ensuring that homestays within scenic spots install solar water heaters and setting up regulations prohibiting the use of disposable plastic products, for example. We also suggest establishing a “carbon neutrality certification system for the cultural and tourism industry”, offering tax incentives or reducing the corresponding urban land use tax to tourism businesses that meet these standards. At the national level, efforts should be made to address industrial shortcomings and promote digital transformation. For regions like Guangdong that have prominent open conditions but weak industrial foundations, the state should support them by prioritizing addressing the shortcomings in their industrial structure and introducing high-end cultural and tourism projects. For instance, they should build international cruise home ports and provide subsidies based on docked cruise ship tonnage, constructing duty-free shopping centers in scenic spots to enhance the industry’s added value. At the same time, relying on international opportunities, efforts should be made to promote the transformation of traditional cultural and tourism service models into intelligent ones. This might involve, for example, developing smart tourism, deploying AI tour guide robots in resort areas that can cover the entire park and support languages such as Cantonese and English, improving functions like “driverless shuttle buses” in mini-program reservations, and enhancing virtual reality experiences in order to improve service efficiency and competitiveness. In addition, it is necessary to strengthen the green and low-carbon development model, such as by encouraging scenic spots to fully implement “paperless tours”, allowing tourists to use electronic maps to reduce printing and scan codes to listen to voice explanations to replace human tour guides. By combining ecological protection with industrial upgrading, sustainable development can be achieved.
Focusing on an international perspective, we can draw on existing experience to promote the sustainable development of the cultural and tourism industry. First, we suggest establishing a cross-border “Intangible Cultural Heritage (ICH) Inheritor Exchange Program”, drawing on the “International Residency Program for Traditional Artisans” implemented by South Korea and Japan. Every year, ICH inheritors from various countries are selected to conduct three months of skill demonstration and teaching in partner countries. For instance, one approach could be to set up an “Asian Traditional Craft Workshop” in Paris, France. Regions could invite inheritors of intangible cultural heritages—such as those adept in Chinese paper-cutting, Indian textiles, and Moroccan pottery—to teach on the spot, promoting cross-border exchanges and innovations in cultural skills. Second, a “global ecotourism certification mutual recognition system” should be established. By referring to the standards of Australia’s “Ecotourism Certification” and Costa Rica’s “CST Sustainable Tourism Certification”, an internationally unified ecotourism evaluation index should be set up to achieve mutually recognized certification results for cross-border scenic spots. For instance, the Swiss Alps Ecotrail has already achieved mutually recognized certification with the Fjords National Park in New Zealand. In this way, tourists can enjoy ecotourism discounts in multiple countries. Thirdly, we suggest promoting the “Joint Development of Digital Cultural Heritage” model, learning from the cooperation between the British Museum and Google Arts. UNESCO have taken the lead in establishing the “World Digital Cultural Heritage Cloud Platform” to achieve the joint construction and sharing of high-definition images and 3D scanning data for cross-border cultural relics. For instance, the digital resources of the Luxor Temple in Egypt and the Parthenon in Greece have achieved cross-border joint curation. Fourth, we also suggest establishing an “International Cultural and Tourism Carbon Neutrality Fund”, following New Zealand’s “Tourism Carbon Offset Scheme” operational model. Countries could set up carbon neutrality service counters at international airports, where passengers can purchase carbon credits to offset travel emissions. These funds would then be directly used for global endangered ecosystem protection projects, such as in the Amazon rainforest in Peru, and coral reef restoration projects in Indonesia. In this way, virtuous cycles between tourism consumption and ecological protection can be formed.

7.4. Theoretical Contributions

Firstly, our study has deepened theories of tourism sustainability evaluation. Most international studies are based on the experiences of Western developed economies, focusing on the one-dimensional trade-off between the economy and the environment. They simplify cultural elements as accessory variables of tourism attractiveness, ignoring the role of cultural elements. Furthermore, the theoretical framework is modeled after the West, using static evaluation, which poses problems when adapting to multicultural backgrounds and the complexity and staged characteristics of transformation in this regard in developing countries. This paper constructs a four-dimensional coupling framework: “cultural and tourism economy–basic resources–social support–ecological environment”. Based on the theory of sustainable development, our study takes cultural elements as the endogenous driving force, reveals the symbiotic relationship between multiple elements in the cultural and tourism industry, provides an assessment paradigm that takes into account both cultural inheritance and ecological security for emerging economies, and makes up for the existing insufficiencies in international theoretical understandings.
Second, we expanded theories of regional tourism and ecological economics. International research is based on the assumed equilibrium of neoclassical economics. Generally, regional tourism development is considered to be a homogeneous convergence process. This emphasizes the linear influence of a single dimension, presuppresses the convergence of regional development paths, ignores non-economic factors, and relies on static spatial analysis, making it difficult to reveal the dynamic evolution mechanism. This study, through a multi-dimensional evaluation system and the fsQCA method, reveals that regional differences in the sustainable development of the cultural and tourism industry stem from asymmetry in multi-factor interactions. Here, we expand the boundaries of related theoretical research, provide a refined analysis tool for unbalanced development regions, and promote theoretical transformation.
Third, our study innovates the methodological system. Traditional international research relies on subjective weighting, such as the Delphi method and AHP, and linear regression models, which have subjective biases. This leads to the evaluation results deviating from reality, making it difficult to identify the interactions between multiple factors. Moreover, the evaluation system and methods are highly fragmented, making it difficult to reveal the causal mechanism. This paper integrates the entropy value and fsQCA methods. Entropy value regulation avoids subjective bias and accurately measures the sustainable development level of the cultural tourism industry. fsQCA surpasses linear assumptions, identifies the differentiated combination path of the “high sustainability of the cultural and tourism industry”, builds a two-tier “measurement–explanation” framework, provides a basis for policy-making, solves the two major bottlenecks of international methodologies—“tool simplification” and “causal simplification”—and offers a replicable methodological paradigm.

Author Contributions

Conceptualization, methodology, writing—original draft preparation, writing—review and editing: W.D. and X.C. Formal analysis, econometric modeling, investigation, and visualization: X.C. and L.J. Project administration and funding acquisition: W.D. All authors have read and agreed to the published version on the manuscript.

Funding

This work was sponsored, in part, by the Gansu University of Political Science and Law university-level scientific research innovation project (GZF2023XZD09); the Gansu Provincial Soft Science Research Program (25JRZA203); and the Gansu Province Department of Education university teachers innovation fund project (2025A-068).

Institutional Review Board Statement

Not applicable.

Informed Consent Statement

Not applicable.

Data Availability Statement

Data are available upon request.

Conflicts of Interest

The authors declare no conflicts of interest.

References

  1. Yasmeen, H.; Tan, Q. Fostering sustainable development: The interplay of natural resources, tourism, financial development, and institutional quality in China. Interdiscip. Environ. Rev. 2024, 23, 317–339. [Google Scholar] [CrossRef]
  2. Alvarez, M.D. Governance for the implementation of the sustainable development goals in tourism: A 2050 horizon paper. Tour. Rev. 2025, 80, 209–220. [Google Scholar] [CrossRef]
  3. Zhao, X.; Wei, J.; Chen, J. Research on brand operation strategy of integrating traditional culture into the modern tourism industry based on big data analysis. Appl. Math. Nonlinear Sci. 2024, 9, 7. [Google Scholar] [CrossRef]
  4. Zeng, J.; Chen, X.; Chen, Y.; Zhou, C.; Zhong, Y. The Research on the Growth Pathways and Mechanisms of Tourism Economy Under Cultural-Tourism Integration: A Case Study of the ‘Concert + Tourism’ Model. J. Econ. Manag. Sci. 2025, 8, 106. [Google Scholar] [CrossRef]
  5. Ren, J.; Li, J.; Liu, S. Analysis of Connotation and Formation Mechanism of “Culture and Tourism Integration Industry”. Acad. J. Bus. Manag. 2025, 7, 190–198. [Google Scholar]
  6. Ning, Y.; Liu, S. Research on Strategies for the Integrated Development of Culture and Tourism in Hezhou City under the Background of High-Quality Tourism Development. J. Mod. Educ. Cult. 2024, 1, 93. [Google Scholar] [CrossRef]
  7. Lu, F.; Ren, H.; Zhai, X. Spatio-temporal evolution and influencing factors of culture and tourism integration efficiency in Shandong Province, China under high-quality development. PLoS ONE 2022, 17, e0277063. [Google Scholar] [CrossRef]
  8. Yan, M. Research on the Construction and Countermeasures of the Qilu Poetry Road Cultural Belt from the Perspective of Cultural and Tourism Integration. Am. J. Ind. Bus. Manag. 2025, 15, 551–570. [Google Scholar] [CrossRef]
  9. Gao, L. Strategies for the Synergistic Development of the Cultural Industry and Tourism Economy from the Perspective of Cultural-Tourism Integration. Front. Econ. Manag. 2025, 6, 167–173. [Google Scholar]
  10. Fu, H. Research on the Development Status and Innovation Path of Tourism Products in Northern Guangxi Under the Integration of Culture and Tourism. Art Des. Res. 2020, 1, 9–15. [Google Scholar]
  11. Shan, W.; Zhang, Y.; Xu, N. Research on the Development Path of Cultural Resources on the Grand Canal Poetry Road (Jiaxing Section) under the Background of Cultural and Tourism Integration. Media Commun. Res. 2023, 4, 40–45. [Google Scholar]
  12. Wang, X. The realistic dilemma and optimization strategy of Guangxi’s integration of culture and tourism to promote rural revitalization. Tour. Manag. Technol. Econ. 2024, 7, 118–126. [Google Scholar]
  13. Wei, Z.; Zhao, J.; Zhang, Y.; Sun, Y. The Practical Logic and Optimization Path of Rural Human Settlement Environment Governance in Jiangsu Region of China from the Perspective of Cultural and Tourism Integration. Proc. Bus. Econ. Stud. 2025, 8, 119–126. [Google Scholar] [CrossRef]
  14. Chen, B.; Yang, Y. Digital Media Enabling New Business Models for Cultural and Tourism Integration. Econ. Manag. Rev. 2024, 5. [Google Scholar]
  15. Jiang, J.; Pang, L. High-quality Development of the Pearl River Night Tour in the Context of Deep Integration of Culture and Tourism. Meteorol. Environ. Res. 2024, 15, 38–45. [Google Scholar]
  16. Liu, Z.; Liu, L.; Chen, Y.; Wu, Y. Research on the Integrated Development Path of Tourism and Cultural Industry in Wuhua County from the Perspective of Collaboration. Tour. Manag. Technol. Econ. 2024, 7, 209–218. [Google Scholar]
  17. Zhang, L. High-Quality Development Measure and Promotion Path of Rural Cultural Tourism Industry Integration-Anhui Province as an Example. Tour. Manag. Technol. Econ. 2023, 6, 46–56. [Google Scholar]
  18. Wang, T. Sustainable Development of Rural Revitalization in Zibo Pujia Village: A Perspective on Culture-Tourism Integration. Academic. J. Humanit. Soc. Sci. 2024, 7, 101–107. [Google Scholar]
  19. Jacobs, L.; Du Preez, A.E.; Fairer-Wessels, F. To wish upon a star: Exploring Astro Tourism as vehicle for sustainable rural development. Dev. South. Afr. 2019, 37, 87–104. [Google Scholar] [CrossRef]
  20. Geng, Y.; Yang, X.; Zhang, N.; Li, J.; Yan, Y. Sustainable rural development: Differentiated paths to achieve rural revitalization with case of Western China. Sci. Rep. 2024, 14, 31507. [Google Scholar] [CrossRef]
  21. Ye, Y.; Li, L. Construction of Evaluation Index System of Rural Low-Carbon Tourism Development Based on Sustainable Calculation. Mob. Inf. Syst. 2022, 2022, 8063427. [Google Scholar] [CrossRef]
  22. Wu, D.; Liu, W.; Ren, Y.; Li, H. Exploring energy and tourism economy growth nexus with DEA-based index systems: The case of sustainable development of tourism destinations. Environ. Sci. Policy 2024, 160, 103858. [Google Scholar] [CrossRef]
  23. Karakuş, B.C. Assessment of ecotourism potentiality based on GIS-based fuzzy logarithm methodology of additive weights (F-LMAW) method for sustainable natural resource management. Environ. Dev. Sustain. 2024, 26, 27001–27055. [Google Scholar] [CrossRef]
  24. Ma, W.; Mu, L. China’s Rural Revitalization Strategy: Sustainable Development, Welfare, and Poverty Alleviation. Soc. Indic. Res. 2024, 174, 743–767. [Google Scholar] [CrossRef]
  25. Claudio, M. Sustainable, Smart and Safe mobility at the core of sustainable tourism in six European islands. Transp. Res. Procedia 2023, 72, 635–641. [Google Scholar]
  26. Perić, B.Š.; Šimundić, B.; Muštra, V.; Vugdelija, M. The Role of UNESCO Cultural Heritage and Cultural Sector in Tourism Development: The Case of EU Countries. Sustainability 2021, 13, 5473. [Google Scholar] [CrossRef]
  27. Liu, Y.; Suk, S.; Cai, Y. Spatial and temporal changes in the coupling of ecological environment and tourism development: The case of Kyushu, Japan. Environ. Res. Lett. 2023, 18, 014004. [Google Scholar] [CrossRef]
  28. Margaret, W. Economics of the US National Park System: Values, Funding, and Resource Management Challenges. Annu. Rev. Resour. Econ. 2022, 14, 579–596. [Google Scholar]
  29. Haid, M.; Albrecht, N.J.; Finkler, W. Barriers to the implementation of sustainability in tourism destinations: Evidence from Tyrol, Austria, and the South Island of New Zealand. Int. J. Tour. Policy 2023, 13, 525–542. [Google Scholar] [CrossRef]
  30. Zahedi, S. Sustainable Development Theory: A Critical Perspective and an Integrative Model. J. Econ. Sustain. Dev. 2019, 10, 43–52. [Google Scholar]
  31. Mohamadi, S.; Abbasi, A.; Kordshouli, H.-A.R.; Askarifar, K. Conceptualizing sustainable–responsible tourism indicators: An interpretive structural modeling approach. Environ. Dev. Sustain. 2022, 24, 399–425. [Google Scholar] [CrossRef]
  32. Othman, R.B.N.R.; Abdullah, A.Y.; Nasrudin, N.; Yakob, H.; Nasir, R.A. Amalgamation of Bio-Eco Culture for Sustainable Island Tourism Development. IOP Conf. Ser. Earth Environ. Sci. 2024, 1316, 012008. [Google Scholar] [CrossRef]
  33. Liu, R.; Qiu, Z. Urban Sustainable Development Empowered by Cultural and Tourism Industries: Using Zhenjiang as an Example. Sustainability 2022, 14, 12884. [Google Scholar] [CrossRef]
  34. Gutierrez, E.L.M.; Rivera, J.P.R.; Soler, A.C.D. Creating local sustainability indicators towards evidence-based policymaking for tourism in developing economies: Evidence from the Philippines. J. Qual. Assur. Hosp. Tour. 2021, 22, 561–590. [Google Scholar] [CrossRef]
  35. Elgin, C.; Elveren, Y.A. Unpacking the economic impact of tourism: A multidimensional approach to sustainable development. J. Clean. Prod. 2024, 478, 143947. [Google Scholar] [CrossRef]
  36. Weng, L.; He, B.; Liu, L.; Li, C.; Zhang, X. Sustainability Assessment of Cultural Heritage Tourism: Case Study of Pingyao Ancient City in China. Sustainability 2019, 11, 1392. [Google Scholar] [CrossRef]
  37. Guo, W.; Zheng, X.; Meng, F.; Zhang, X. The Evolution of Cultural Space in a World Heritage Site: Tourism Sustainable Development of Mount Wuyi, China. Sustainability 2019, 11, 4025. [Google Scholar] [CrossRef]
  38. Ning, C.; Hoon, D.O. Sustainable development strategy of tourism resources offered by regional advantage: Exploring the feasibility of developing an ‘exotic culture’ resource for Weihai City of China. Procedia Eng. 2011, 21, 543–552. [Google Scholar] [CrossRef]
  39. Chen, X. Research on the Coupling Coordination Degree of Tourism Economy and Regional Resilience and Its Obstacle Degree Factors Based on the Obstacle Degree Model. J. Econ. Bus. Manag. 2024, 12, 50–56. [Google Scholar] [CrossRef]
  40. Parvaneh, S.; Hassan, E.; Moein, M.S.S.; Marcu, M.V.; Wolf, I.D. Evaluating Ecotourism Sustainability Indicators for Protected Areas in Tehran, Iran. Forests 2022, 13, 740. [Google Scholar] [CrossRef]
  41. Bianca, M.; Paul-Răzvan, Ş.; Irena, M.; Damian, N.; Grigorescu, I.; Dumitraşcu, M.; Dumitrică, C. Developing an Indicator-Based Framework to Measure Sustainable Tourism in Romania. A Territorial Approach. Sustainability 2021, 13, 2649. [Google Scholar] [CrossRef]
  42. Soh, N.A.; Puah, H.C.; Mohammad, A.A.; Jong, M.-C. The Role of Sustainable Competitiveness Indicator in Malaysian Tourism and Economic Growth. Stud. Bus. Econ. 2024, 19, 228–240. [Google Scholar] [CrossRef]
  43. Lyu, T.; Shen, Q. A fuzzy-set qualitative comparative analysis (fsQCA) study on the formation mechanism of Internet platform companies’ social responsibility risks. Electron. Mark. 2024, 34, 5. [Google Scholar] [CrossRef]
  44. Wu, Q.; Faura, C.J.; Li, X.; Wang, Y. Evaluating social governance innovation policy in China: A study based on fuzzy set qualitative comparative analysis. Eval. Program Plan. 2024, 106, 102460. [Google Scholar] [CrossRef] [PubMed]
  45. Kumbure, M.M.; Tarkiainen, A.; Luukka, P.; Stoklasa, J.; Jantunen, A. Relation between managerial cognition and industrial performance: An assessment with strategic cognitive maps using fuzzy-set qualitative comparative analysis. J. Bus. Res. 2020, 114, 160–172. [Google Scholar] [CrossRef]
  46. Zhou, L.; Chen, X.; Mi, Y.; Yang, G. Coupling coordination evaluation and driving path of digital economy and carbon emission efficiency in China: A fuzzy-set qualitative comparative analysis based on 30 provinces. PLoS ONE 2023, 18, e0287819. [Google Scholar]
  47. Lee, Y.; Kim, B.; Hwang, H. Which Institutional Conditions Lead to a Successful Local Energy Transition? Applying Fuzzy-Set Qualitative Comparative Analysis to Solar PV Cases in South Korea. Energies 2020, 13, 3696. [Google Scholar] [CrossRef]
  48. Wang, C.; Zheng, Q.; Zeng, H.; Wu, Y.; Wei, C. What configurational conditions promote tourism eco-transformation? a fuzzy-set qualitative comparative analysis based on the TOE framework. Front. Environ. Sci. 2022, 10, 1012856. [Google Scholar] [CrossRef]
  49. Tiago, G.; Carla, C. Individual and Organizational Conditions Leading to Quality of Care in Healthcare: A Fuzzy-Set Qualitative Comparative Analysis. Merits 2021, 1, 71–86. [Google Scholar] [CrossRef]
  50. Brian, L.F.; Wang, X.; Liu, T. What condition leads to an unreasonable pharmaceutical price? Impact research on the effect of medical service provision on pharmaceutical price regulation based on fuss-set QCA. PLoS ONE 2023, 18, e0284129. [Google Scholar]
  51. Robin, K.V.; Rok, H.; Sarah, C.; Brayne, C.; Baron-Cohen, S.; Czabanowska, K.; Roman-Urrestarazu, A. Inclusive education in the European Union: A fuzzy-set qualitative comparative analysis of education policy for autism. Soc. Work Public Health 2021, 36, 286–299. [Google Scholar]
  52. Mao, Y. Decentralization, national context and environmental policy performance: A fuzzy set qualitative comparative analysis. Environ. Sci. Pollut. Res. Int. 2018, 25, 28471–28488. [Google Scholar] [CrossRef] [PubMed]
  53. Fernando, S.C.; Vanessa, M.R.; Manuel, J.G.G. International economic policy: A fuzzy set qualitative comparative analysis on think tanks in the press. Econ. Res. Ekon. Istraž. 2021, 34, 2609–2627. [Google Scholar]
  54. Hu, C. The factors driving industrial integration: A fuzzy set qualitative comparative analysis. Heliyon 2024, 10, e36069. [Google Scholar] [CrossRef]
  55. Stejskal, J.; Hajek, P. Modelling collaboration and innovation in creative industries using fuzzy set qualitative comparative analysis. J. Technol. Transf. 2019, 44, 981–1006. [Google Scholar] [CrossRef]
  56. Zubiaga, M.; Sopelana, A.; Gandini, A.; Aliaga, H.M.; Kalvet, T. Sustainable Cultural Tourism: Proposal for a Comparative Indicator-Based Framework in European Destinations. Sustainability 2024, 16, 2062. [Google Scholar] [CrossRef]
  57. Tamaki, K.; Ichinose, T. Sustainable tourism industry and rural revitalization based on experienced nature and culture tourism. J. Glob. Tour. Res. 2019, 4, 111–116. [Google Scholar] [CrossRef]
  58. Tan, Y. Power Mechanism and Path of Deep Integration of Cultural Industry and Tourism Industry in the Era of Digital Economy. Appl. Math. Nonlinear Sci. 2025, 10, 0576. [Google Scholar] [CrossRef]
  59. Yin, Y. Research on the integration path of cultural creative industry and tourism industry based on collaborative filtering recommendation algorithm. Appl. Math. Nonlinear Sci. 2023, 2, 00551. [Google Scholar] [CrossRef]
  60. Heekyung, S.R.P.J.A. Tourism, Culture, and the Creative Industries: Reviving Distressed Neighborhoods with Arts-Based Community Tourism. Tour. Cult. Commun. 2012, 12, 5–18. [Google Scholar]
  61. Medina, J.P.; Tur, A.A.; Casado, S.N. Tourism Business, Place Identity, Sustainable Development, and Urban Resilience: A Focus on the Sociocultural Dimension. Int. Reg. Sci. Rev. 2020, 44, 016001762092513. [Google Scholar]
  62. Guan, C.; Rani, T.; Zhao, Y.; Ajaz, T.; Haseki, M.I. Impact of tourism industry, globalization, and technology innovation on ecological footprints in G-10 countries. Econ. Res. Ekon. Istraž. 2022, 35, 6688–6704. [Google Scholar] [CrossRef]
  63. Huang, W.; Shang, Y. Exploration of AR+VR Virtual Immersion and the Application of Digital Cultural Tourism Integration Development. Artif. Intell. Technol. Res. 2024, 2. [Google Scholar]
  64. Chima, D.A. Geocultural Power: China’s quest to revive the Silk Roads for the twenty-first century. Inn. Asia 2020, 22, 350–352. [Google Scholar]
  65. Liu, X.; Tan, Q.; Heng, X. The evolutionary process of the development path of cultural tourism industry integration from a non-linear perspective. Appl. Math. Nonlinear Sci. 2023, 1, 00272. [Google Scholar] [CrossRef]
  66. Han, Q.; Chen, L.; Tang, X.; Weng, T.; Yang, G.; Zhang, B.; Zhang, Y. Research on TOPSIS multi-indicator evaluation model based on entropy weight method for C2N site selection. Ann. Nucl. Energy 2025, 221, 111566. [Google Scholar] [CrossRef]
  67. Fang, L.; Liu, Z.; Jin, C. How Does the Integration of Cultural Tourism Industry Affect Rural Revitalization? The Mediating Effect of New Urbanization. Sustainability 2023, 15, 10824. [Google Scholar] [CrossRef]
  68. Zhang, W.; Lu, X.; Han, P. Research on the development mode of cultural tourism industry based on the concept of low carbon and environmental protection by big data analysis. Appl. Math. Nonlinear Sci. 2023, 2, 00606. [Google Scholar] [CrossRef]
  69. Ren, W.; Zhang, J.; Jin, N. Rescaled range permutation entropy: A method for quantifying the dynamical complexity of gas–liquid two-phase slug flow. Nonlinear Dyn. 2021, 104, 4035–4043. [Google Scholar] [CrossRef]
  70. Zhou, J.; Chen, C.; Guo, J.; Wang, L.; Liu, Z.; Feng, C. A novel rolling bearing fault diagnosis method based on continuous hierarchical fractional range entropy. Measurement 2023, 220, 113395. [Google Scholar] [CrossRef]
  71. Tisdell, A.C.; Wen, J.J. Tourism and China’s Development—Policies, Regional Economic Growth & Ecotourism; World Scientific Publishing Company: Singapore, 2001. [Google Scholar] [CrossRef]
  72. Pan, X. Choices from an Ecological Economics Perspective: Strong Sustainability V.S. Weak Sustainability. J. Humanit. Arts Soc. Sci. 2023, 12, 033. [Google Scholar] [CrossRef]
  73. Xie, X.; Li, X.; Fan, H.; He, W. Spatial analysis of production-living-ecological functions and zoning method under symbiosis theory of Henan, China. Environ. Sci. Pollut. Res. Int. 2021, 28, 69093–69110. [Google Scholar] [CrossRef] [PubMed]
  74. Fiss, C.P. Building Better Causal Theories: A Fuzzy Set Approach to Typologies In Organization Research. Acad. Manag. J. 2011, 54, 393–420. [Google Scholar] [CrossRef]
  75. Coduras, A.; Clemente, A.J.; Ruiz, J. A novel application of fuzzy-set qualitative comparative analysis to GEM data. J. Bus. Res. 2016, 69, 1265–1270. [Google Scholar] [CrossRef]
  76. Khosravi, F.; Izbirak, G. A framework of index system for gauging the sustainability of iranian provinces by fusing analytical hierarchy process (AHP) and rough set theory (RST). Socio Econ. Plan. Sci. 2024, 95, 101975. [Google Scholar] [CrossRef]
  77. Yang, C.; Yang, J.; Huang, J.; You, B.; Hong, H. An investigation of technological innovation and tourism industrial structure upgrading as drivers of tourism economic growth. Int. J. Tour. Res. 2024, 26, e2687. [Google Scholar] [CrossRef]
  78. Yan, N.; Zhang, J.; Xia, B.; Li, S.; Yang, W. How can the natural background and ecological & environment promote the green and sustainable development of Chinese tourist attractions? Ecol. Indic. 2024, 169, 112813. [Google Scholar]
  79. Wang, T.; Zhang, H. Nonlinear Impact of Labor Market Integration on Tourism Development: Evidence from China. J. China Tour. Res. 2025, 21, 191–213. [Google Scholar] [CrossRef]
  80. Zuzana, J.; Zuzana, T.; Oskar, S. The impact of chosen economic indicators on tourism sustainability: Case study of the Czech Republic and Norway. J. Secur. Sustain. Issues 2017, 7, 113–121. [Google Scholar]
  81. Zhu, A. Exploring the Design of Urban Microtourism Products from the Perspective of Integrated Development of Culture and Tourism. J. Tour. Manag. 2024, 1. [Google Scholar] [CrossRef]
  82. Emre, A.C.; Ersin, Y. The role of environmental protection expenditures and renewable energy consumption in the context of ecological challenges: Insights from the European Union with the novel panel econometric approach. J. Environ. Manag. 2023, 331, 117317. [Google Scholar]
  83. Li, X.; Yang, J.; Sheng, P. Structure and Application of a New Comprehensive Environmental Pollution Index. Energy Procedia 2011, 5, 1049–1054. [Google Scholar]
  84. Ragin, C.C. Using Qualitative Comparative Analysis to Study Causal Order. Sociol. Methods Res. 2008, 36, 431–441. [Google Scholar] [CrossRef]
  85. Tang, Y.; Yi, K.; He, Z. How policy promotes the integration of culture and tourism? A fuzzy-set qualitative comparative analysis based on the Policy Instrument Theory. PLoS ONE 2024, 19, e0301119. [Google Scholar] [CrossRef]
  86. Ragin, C.C. Set Relations in Social Research: Evaluating Their Consistency and Coverage. Political Anal. 2006, 14, 291–310. [Google Scholar] [CrossRef]
  87. Pappas, I.O.; Woodside, A.G. Fuzzy-set Qualitative Comparative Analysis (fsQCA): Guidelines for research practice in Information Systems and marketing. Int. J. Inf. Manag. 2021, 58, 102310. [Google Scholar] [CrossRef]
  88. Román, D.L.J.; Oya, V.J.; Tabales, N.M.J.; Rey, F.J. How to achieve economic development through tourism? Different ways for different economies: A new approach through fuzzy set qualitative comparative analysis. Tour. Econ. 2025, 31, 104–123. [Google Scholar] [CrossRef]
  89. Echeverri, A.; Batista, M.N.; Wolny, S.; Herrera-R, G.A.; Andrade-Rivas, E.; Bailey, A.; Cardenas-Navarrete, A.; Arenas, A.D.; Díaz-Salazar, A.F.; Hernandez, K.V.; et al. Toward Sustainable Biocultural Ecotourism: An Integrated Spatial Analysis of Cultural and Biodiversity Richness in Colombia. People Nat. 2024, 7, 194–214. [Google Scholar] [CrossRef]
  90. Janne, L.; Birthe, M.; Kristof, T. Activating socio-cultural values for sustainable tourism development in natural protected areas. J. Sustain. Tour. 2024, 32, 1182–1200. [Google Scholar]
  91. Zhang, M.; Jun, T. Transforming Cultural Tourism in Dali, Yunnan: Harnessing Digitalization for Smart Sustainable Heritage Experiences. J. Soc. Sci. Econ. 2023, 2, 49–63. [Google Scholar] [CrossRef]
  92. Dong, X. Research on Performance Appraisal of Customer Service Personnel in Tourism Companies Based on Entropy Method. Acad. J. Bus. Manag. 2023, 5, 176–180. [Google Scholar]
  93. Ali, M.J.; Domokos, K.E. Prioritizing Influential Factors on Tourist Decision-Making for Choosing Destinations Using Parsimonious Analytical Hierarchy Process (PAHP). Tour. Plan. Dev. 2024, 21, 330–353. [Google Scholar]
  94. González, G.J.M.; Vallejo-Pascual, M. The Application of Principal Component Analysis (PCA) for The Study of The Spanish Tourist Demand. Quaest. Geogr. 2018, 37, 43–52. [Google Scholar] [CrossRef]
  95. Wang, J.; Cheng, F.; Chen, C. Optimization and Evaluation of Tourism Mascot Design Based on Analytic Hierarchy Process–Entropy Weight Method. Entropy 2024, 26, 585. [Google Scholar] [CrossRef]
  96. Sarkar, A.; Mondal, M.; Sarma, S.U.; Podder, S.; Gayen, S.K. Tourism Suitability Assessment in Malbazar Block using principal component analysis and analytical hierarchy process. Environ. Dev. Sustain. 2024, 1–42. [Google Scholar] [CrossRef]
  97. Hoang, T.H.; Truong, H.Q.; Nguyen, T.A.; Hens, L. Multicriteria Evaluation of Tourism Potential in the Central Highlands of Vietnam: Combining Geographic Information System (GIS), Analytic Hierarchy Process (AHP) and Principal Component Analysis (PCA). Sustainability 2018, 10, 3097. [Google Scholar] [CrossRef]
  98. Bachtiar, A.S.A.; Nurwatik. Alternative Route Planning Analysis of Tourism Transport Using Analytical Hierarchy Process (AHP) and Network Analysis Methods (Case Study: Jember Regency). IOP Conf. Ser. Earth Environ. Sci. 2023, 1127, 012046. [Google Scholar] [CrossRef]
  99. Stojanović, T.; Trišić, I.; Brđanin, E.; Štetić, S.; Nechita, F.; Candrea, A.N. Natural and Sociocultural Values of a Tourism Destination in the Function of Sustainable Tourism Development—An Example of a Protected Area. Sustainability 2024, 16, 759. [Google Scholar] [CrossRef]
  100. Jia, X.; Xu, Y.; Zhao, B.; Li, H.; Li, L.; Zhang, J. Sustainable tourism at nature-based cultural heritage sites: Visitor density and its influencing factors. NPJ Herit. Sci. 2025, 13, 175. [Google Scholar] [CrossRef]
  101. Suvittawat, A.; Janchai, N.; Seepho, S.; Nonthachai, J.; Nonthachai, I. Sustainable Food Festival Tourism: Integrating the Bio-Circular-Green (BCG) Model for Cultural and Environmental Resilience in Thailand. Sustainability 2025, 17, 1969. [Google Scholar] [CrossRef]
  102. Mandić, A.; Petrić, L.; Pivčević, S. Harmonizing sustainability and resilience in post-crisis cultural tourism: Stakeholder insights from the Split metropolitan area living lab. Tour. Manag. Perspect. 2025, 55, 101331. [Google Scholar] [CrossRef]
  103. Mandić, A.; Séraphin, H.; Vuković, M. Engaging stakeholders in cultural tourism Living Labs: A pathway to innovation, sustainability, and resilience. Technol. Soc. 2024, 79, 102742. [Google Scholar] [CrossRef]
  104. Tian, X.; Xie, L.; Ai, H. Exploring the Path of Sustainable Cultural Tourism under the Context of Rural Revitalization: Taking Yantianzi, Hong Kong as an Example. J. Humanit. Soc. Sci. Stud. 2024, 6, 25–29. [Google Scholar] [CrossRef]
Figure 1. The comprehensive score of the sustainable development level of China’s cultural and tourism industry from 2006 to 2023, and the scores at each level. Data source: The author manually collated the data from the China Statistical Yearbook.
Sustainability 17 05964 g001
Figure 2. The sustainable development level of the cultural and tourism industry in each region and scores at each level from 2006 to 2023.
Sustainability 17 05964 g002
Figure 3. The sustainable development level of China’s cultural tourism industry and the distribution of its kernel density curves at all levels.
Sustainability 17 05964 g003
Figure 4. Distribution of kernel density curves of the sustainable development levels of the cultural tourism industry in six regions.
Sustainability 17 05964 g004
Figure 5. Analysis of the configurational paths for high sustainable development levels in China’s cultural and tourism industry.
Sustainability 17 05964 g005
Figure 6. Theoretical model of high sustainable development level in the cultural tourism industry.
Sustainability 17 05964 g006
Table 1. Comprehensive evaluation index system for the sustainable development level of the cultural and tourism industry.
Primary IndicatorsSecondary IndicatorsTertiary IndicatorsExplanationAttribute
Indicators for Cultural Tourism Economic ConstructionCultural and Entertainment IndustryCultural, Sports, and Entertainment IndustryNumber of Employees in Transportation, Storage, and Postal Industry+
Number of Employees in Accommodation and Catering Industry+
Number of Employees in Cultural, Sports, and Entertainment Industry+
Added Value of the IndustryAdded Value of the Tertiary Industry+
Added Value of Transportation, Storage, and Postal Service Industry+
Added Value of Accommodation and Catering Industry+
Performance of Cultural Tourism IndustryTourist Reception SituationReception by Domestic Travel Agencies+
Reception by International Travel Agencies+
Overall Economic IncomeTourism Foreign Exchange Earnings+
Total GDP+
Per Capita GDP+
Contribution of Inbound TouristsNumber of Inbound Overnight Tourists Received+
Number of Inbound Overnight Tourists from Abroad Received+
Labor Productivity in Cultural Tourism IndustryTourism AgenciesOperating Revenue of Travel Agencies+
Average Operating Revenue of Travel Agencies+
Per Capita Operating Revenue of Travel Agency Employees+
Indicators for Cultural Tourism Basic ResourcesTourism Basic ResourcesClass-A Tourism ResourcesNumber of Tourist Attractions at Various Levels+
Permanent Employees in Class-A Tourist Attractions+
Total Number of Visitors Received by the Scenic Spot+
Operating Revenue of the Scenic Spot+
Reception Situation of Travel AgenciesTotal Number of Travel Agencies+
Total Number of Tourists Received by Travel Agencies+
Employees in Travel Agencies+
Reception Capacity of Travel Agencies+
Service Quality LevelOperating Conditions of Star-Rated HotelsTotal Number of Star-Rated Hotels+
Operating Revenue of Star-Rated Hotels+
Employees in Star-Rated Hotels+
Quality of Cultural Tourism SupplyNumber of Public Libraries+
Per Capita Public Library Collections+
Number of Museums+
Number of Art Performance Groups+
Number of Art Performance Venues+
Indicators for Social Basic SupportPassenger Transport VolumePublic TransportationPassenger Volume+
RailwayRailway Transport Volume—Passenger Volume+
Railway Transport Volume—Passenger—Kilometers+
Transportation IndustryEmployees in the Transportation IndustryRailway Transport Industry+
Road Transport Industry+
Water Transport Industry+
Air Transport Industry+
Operating Vehicles of Public TransportationCivil Vehicles+
Passenger Cars+
Number of Commercial Vehicles on Highways+
Number of Public Buses, Trolleybuses, and Rail Transit Vehicles Assigned+
Number of Public Transport Vehicles per 10,000 Inhabitants in Cities+
Tertiary IndustryLegal EntitiesNumber of Legal Entities in the Tertiary Industry+
Number of Legal Entities in Transportation, Storage, and Post+
Number of Legal Entities in Accommodation and Catering+
Number of Legal Entities in Culture, Sports, and Entertainment+
Total GDPTotal GDP of the Tertiary Industry+
ProportionProportion of the Added Value of the Tertiary Industry in the Regional Gross Domestic Product+
Indicators for Ecological Environment QualityInvestment in Green EconomyUrban Garden Greening ConstructionInvestment in Garden Greening Construction+
Urban Appearance and Environmental ConstructionInvestment in Urban Appearance and Environmental Construction+
Green and Low-Carbon DevelopmentSolid WasteGeneration Amount of Industrial Solid Waste-
Comprehensive Utilization Amount+
Waste Amount-
Storage Amount-
Water QualityEcological Water Consumption+
Artificial Ecological Environment Replenishment Volume+
Urban Domestic Waste TreatmentGarbage Collection and Transportation Volume+
Harmless Treatment Volume+
Sanitary Landfill Treatment Volume+
Harmless Treatment Capacity+
Sanitary Landfill Treatment Capacity+
Ecological Environment ConstructionNature Reserve ConstructionTotal Number of Nature Reserves+
Area of Nature Reserves+
Proportion of the Area of Nature Reserves In The Jurisdiction Area+
Total Number of National Nature Reserves+
Area of National Nature Reserves+
Park Green Space ConstructionUrban Garden and Green Space Area+
Park Green Space Area+
Per Capita Park Green Space Area+
Greening ConstructionGreening Coverage Area+
Green Space Area+
Note: The symbols "+" and "-" represent a positive and negative indicator, indicating that the data of this indicator show a growth or improvement trend, reflecting the relevant positive aspects, or a downward or decreasing trend, reflecting the relevant negative situation, respectively.
Table 2. Comprehensive scores and rankings of the sustainable development level of the cultural and tourism industry of each province in 2023.
ProvinceCultural Tourism EconomyCultural Tourism InfrastructureSocial InfrastructureEcological EnvironmentComprehensive Measurement
ScoreRankScoreRankScoreRankScoreRankScoreRank
Beijing0.19450.129130.24250.105240.1725
Tianjin0.23030.072250.074240.060300.13311
Hebei0.039220.136110.18670.24950.13212
Shanxi0.033250.105190.119160.178140.09519
Inner Mongolia0.11280.082240.074250.34210.1517
Liaoning0.034240.099210.133140.29230.12313
Jilin0.025280.066280.054270.128210.06130
Heilongjiang0.025270.072260.077230.180130.07925
Shanghai0.22540.135120.16290.086270.1656
Jiangsu0.24610.20340.33930.21990.2512
Zhejiang0.17160.26010.26740.143160.1993
Anhui0.069160.20150.137130.134170.12015
Fujian0.09890.117170.159110.130190.12114
Jiangxi0.043210.102200.097200.104250.07826
Shandong0.080130.24920.35920.23060.1994
Henan0.050180.17170.20860.214100.14010
Hubei0.11870.14290.160100.204110.1509
Hunan0.088110.15680.127150.128200.11716
Guangdong0.23920.21030.42910.30320.2871
Guangxi0.050190.107180.102190.106230.08324
Hainan0.092100.071270.054280.040310.06929
Chongqing0.076140.138100.111170.086280.09618
Sichuan0.080120.19660.16980.22570.1518
Guizhou0.047200.090220.081220.096260.07228
Yunnan0.069150.123140.097210.132180.09817
Tibet 0.038230.042300.015310.26540.08523
Shaanxi0.066170.120150.108180.117220.09520
Gansu0.021300.090230.141120.156150.08722
Qinghai0.021290.054290.028290.22480.07427
Ningxia0.019310.040310.027300.062290.03431
Xinjiang0.029260.119160.065260.188120.08821
Table 3. Specific classification of QCA methods.
Analysis MethodApplicable IssuesHandle Object
csQCAThe current cause condition and result can be divided into a binary; that is, each antecedent cause condition and result can be assigned values of 0 and 1, respectivelySuitable for handling binary categorical variables
mvQCAThe current cause conditions and results need to be divided in multiple ways; that is, each antecedent cause condition and result can be assigned values such as 0, 1, 2, 3, etc.Suitable for handling multiple categorical variables
fsQCAIt is applicable to current membership problems where it is difficult to divide the conditions and results into 0 or 1. Partial membership fractions within the range of 0 to 1 are considered to achieve set fraction scalingNot only capable of handling category variables but also degree questions
Table 4. Factors influencing the sustainable development level of the cultural tourism industry.
Primary IndicatorsSecondary IndicatorsIndicator Calculation
Supporting Force of Cultural Tourism EconomyUpgrading of Industrial Structure (UI)The proportion of the added value of the primary industry in GDP × 1 + the proportion of the added value of the secondary industry in GDP × 2 + the proportion of the added value of the tertiary industry in GDP × 3
Degree of Opening Up (DO)(Total volume of goods import and export ×exchange rate of USD to RMB)/regional gross domestic product
Attractiveness of Cultural Tourism ResourcesLabor Level (LL)Take the natural logarithm of the number of employees in the tertiary industry
Informatization Level (IL)Total volume of postal and telecommunications services/regional gross domestic product
Perfection Degree of Social FoundationSocial Consumption Level (SC)Total retail sales of consumer goods/regional gross domestic product
Transportation Infrastructure Level (TI)Take the logarithm of the highway mileage and the logarithm of the total freight volume
Effective Force of Ecological EnvironmentFiscal Environmental Protection Expenditure (FE)Fiscal expenditure of local governments on environmental protection
Comprehensive Environmental Pollution Index (EP)The entropy value derived from the data of multiple pollutant emissions (wastewater, SO2, solid waste)
Table 5. Fuzzy set calibration.
VariableFull MembershipIntersection PointFull Non-Membership
Outcome VariableSustainable Development Level of the Cultural Tourism Industry (CTIDEL)0.1600.0800.040
Condition VariableUpgrading of Industrial Structure (UI)2.6002.3502.280
Degree of Opening Up (DO)1.0300.1500.060
Labor Level (LL)7.5706.7504.840
Informatization Level (IL)0.0900.0700.050
Social Consumption Level (SC)0.4400.3800.310
Transportation Infrastructure Level (TI)12.44011.9309.800
Fiscal Environmental Protection Expenditure (FE)242.010122.20036.580
Comprehensive Environmental Pollution Index (EP)0.3700.1800.030
Table 6. Necessity and sufficiency analysis.
Antecedent ConditionsCTIDEL~CTIDEL
ConsistencyCoverageConsistencyCoverage
UI0.672 0.733 0.540 0.622
~UI0.654 0.574 0.768 0.712
DO0.698 0.769 0.486 0.565
~DO0.605 0.527 0.801 0.737
LL0.856 0.790 0.541 0.527
~LL0.487 0.502 0.784 0.852
IL0.425 0.470 0.688 0.803
~IL0.822 0.714 0.545 0.500
SC0.759 0.683 0.641 0.609
~SC0.565 0.598 0.666 0.745
TI0.752 0.695 0.609 0.594
~TI0.560 0.576 0.687 0.745
FE0.800 0.836 0.494 0.545
~FE0.565 0.514 0.852 0.818
EP0.801 0.804 0.511 0.542
~EP0.543 0.513 0.815 0.812
Note: “~” indicates logical NOT.
Table 7. Configuration analysis of high sustainable development levels in the cultural tourism industry.
High Sustainable Development Level of the Cultural Tourism Industry
Conditional ConfigurationH1aH1bH1cH2aH3a
UI
DO
LL
IL
SC
TI
FE
EP
Consistency0.9600.9580.9670.9630.989
Original Coverage0.2070.1830.2560.3920.184
Unique Coverage0.0380.0130.0170.1740.029
Relevant CasesLiaoning
(0.54, 0.79)
Zhejiang
(0.56, 0.91)
Shandong
(0.53, 0.94)
Henan (0.64, 0.72)Guangdong
(0.51, 1.00)
Overall Consistency0.972
Overall Coverage0.535
Note: ⏺ indicates the presence of a core condition; ⊗ indicates the absence of a core condition; ● indicates the presence of an edge condition.
Disclaimer/Publisher’s Note: The statements, opinions and data contained in all publications are solely those of the individual author(s) and contributor(s) and not of MDPI and/or the editor(s). MDPI and/or the editor(s) disclaim responsibility for any injury to people or property resulting from any ideas, methods, instructions or products referred to in the content.

