Article

Quantifying China’s Food Self-Sufficiency and Security Transition Based on Flow and Consumption Analyses

by
Huanyu Chang
1,2,3,4,
Yong Zhao
2,
Yongqiang Cao
1,
Rong Liu
2,
Wei Li
5,
He Ren
1,
Zhen Hong
1 and
Jiaqi Yao
1,*
1
Academy of Eco-Civilization Development for Jing-Jin-Ji Megalopolis, Tianjin Normal University, Tianjin 300387, China
2
State Key Laboratory of Water Cycle and Water Security in River Basin, China Institute of Water Resources and Hydropower Research (IWHR), Beijing 100038, China
3
State Key Laboratory of Hydroscience and Engineering, Tsinghua University, Beijing 100084, China
4
Key Laboratory of Water Safety for Beijing-Tianjin-Hebei Region of Ministry of Water Resources, Beijing 100038, China
5
General Institute of Water Conservancy Resources and Hydropower Planning and Design, Ministry of Water Resources, Beijing 100120, China
*
Author to whom correspondence should be addressed.
Sustainability 2025, 17(13), 5965; https://doi.org/10.3390/su17135965
Submission received: 21 May 2025 / Revised: 24 June 2025 / Accepted: 27 June 2025 / Published: 28 June 2025
(This article belongs to the Section Sustainable Agriculture)

Abstract

This study aims to develop and apply an improved flow–consumption statistics (FCS) method to more accurately assess food and grain self-sufficiency in China. By incorporating dynamic food loss and waste estimates, the FCS method enhances accuracy and spatial resolution. Results from 2010 to 2022 show a national decline in food self-sufficiency to 82%, while grain self-sufficiency remains above 90%. Nineteen provinces failed to achieve food self-sufficiency, with notable regional disparities. Northern inland areas outperform southern coastal regions, which rely more on inter-regional transfers. The average national food loss and waste rate reached 22.8%. The FCS method provides a robust tool for policymakers to evaluate food security risks amid shifting socio-economic and environmental conditions.

1. Introduction

1.1. Background

Food security is a fundamental cornerstone of national security, underpinning social stability and sustained economic development [1,2]. In the United Nations 2030 Sustainable Development Goals (SDGs), “Zero Hunger” is explicitly listed as the second goal [3], aiming to eradicate all forms of hunger and malnutrition and to ensure access to safe, nutritious, and sufficient food for all people worldwide. However, according to the Food and Agriculture Organization (FAO), approximately 2.4 billion people globally were moderately to severely food insecure in 2022 [4]. The increasing frequency of extreme climate events such as droughts and floods [5,6], rising demand driven by population growth [7,8], and disruptions caused by geopolitical conflicts and pandemics [9,10] have all intensified the challenges of ensuring global food security, thereby threatening the achievement of the 2030 Zero Hunger goal.
As both a major agricultural producer and one of the most populous countries, China feeds nearly 20% of the world’s population with less than 9% of the world’s arable land. The Chinese government has consistently prioritized food security, repeatedly emphasizing in official policy documents the importance of “comprehensively strengthening the foundations of food security” and “ensuring that China’s food supply firmly remains in Chinese hands” [11]. Nonetheless, the country’s food security landscape is undergoing profound changes due to accelerating urbanization [12], constraints on agricultural production resources [13], continuous improvements in dietary structure [14], and increasing complexity in the international geopolitical environment [15]. A shift in consumption patterns from stable foods to animal-based foods has led to a surge in demand for feed grains, which are now projected to be twice as high as demand for staple grains. This transformation has driven continuous growth in overall food demand and may pose a future risk in which existing cultivated land can no longer meet production needs [16,17]. Furthermore, a mismatch in the spatial distribution of resources exacerbates supply–demand tensions. Arable land reserves are limited, water resources are unevenly distributed, and major food production areas are often geographically separated from major consumption regions [18,19]. Food transport from north to south implies a virtual water transfer of approximately 33.5 billion cubic meters annually from water-scarce northern areas to relatively water-abundant southern areas [20]. Moreover, China’s dependence on food imports, particularly soybeans, has continued to increase, with the country accounting for over 60% of global soybean imports [21]. This growing reliance exposes China to significant external risks, as fluctuations in international markets and geopolitical tensions further threaten national food security [22,23].
These multifaceted pressures—from shifts in dietary patterns and spatial mismatches in resource allocation to increasing reliance on global markets—have rendered China’s food security landscape more complex and uncertain than ever before. Ensuring a stable and sustainable food supply in this evolving context requires not only a better understanding of the structural drivers of food balance but also more rigorous tools to identify and assess emerging risks [24,25,26]. In this context, the concept of food self-sufficiency has attracted growing attention in both academic and policy circles, serving as a key indicator for evaluating national food security capacity.

1.2. Literature Review

The food self-sufficiency rate is a critical indicator for assessing a country’s ability to meet its own food needs and reflects the overall level of national food security. Despite variations in statistical definitions and methodologies, this indicator has been widely applied by scholars globally in studies related to food security, sustainable development, and international trade at national, regional, and global scales [27,28]. For instance, Beltran-Peña et al. [29] evaluated the food self-sufficiency status of 165 countries by assessing whether domestic food production could meet national caloric requirements. Zhang et al. [30] employed the Granger causality method to analyze the spatiotemporal evolution and driving factors of the food self-sufficiency rate in Africa from 1961 to 2018. Another study by Zhang et al. [31] assessed the caloric supply–demand balance across Chinese provinces between 1978 and 2020 through conversions of grain yields into caloric values. Niu et al. [32] examined the patterns and drivers of China’s food production and consumption over the past 30 years by accounting for food usage in ration, feed, seed, and post-harvest losses. Furthermore, Zhang and Lu [33] constructed a comprehensive food security assessment framework incorporating dimensions such as food supply, distribution, utilization, vulnerability, sustainability, and regulation to evaluate China’s food security status from 2001 to 2020. Similar studies were conducted at subnational levels, including assessments of food self-sufficiency and security in Qinghai province [34], Guangdong province [35], and the Yangtze River Delta urban agglomeration [36]. These studies have demonstrated that research on food security based on the food self-sufficiency rate has attracted considerable global attention, thus highlighting the importance of accurately defining and measuring this key indicator. Recent studies have expanded food security analysis by incorporating real-time data and regional granularity. Herteux et al. [37] developed a machine learning-based early-warning system using daily food security data, thereby demonstrating the value of short-term, data-driven forecasts for identifying high-risk areas. In the Chinese context, Niu et al. [38] analyzed county-level grain self-sufficiency over a period of four decades, revealing persistent regional disparities and emphasizing the challenges of feed grain supply under evolving dietary demands.
In recent years, the methods employed for the estimation of food self-sufficiency have been classified into the following three categories [32,39,40,41,42]: (1) Stint counting (SC), which involves the estimation of total demand through the multiplication of per capita ration standards by population size; (2) Flow statistics (FS), which utilize macro-level indicators such as production, imports, exports, and inventory changes to calculate balances; (3) Consumption statistics (CS), which estimate total food demand based on the composition of staple food consumption, feed, seed, and industrial uses. Each approach had its strengths: the CS method offered a relatively complete structural framework but relied heavily on fixed parameters; the FS method emphasized system-wide flow balance but lacked granularity in capturing consumption-specific differences; and the SC method was simple and straightforward but failed to account for structural changes in consumption patterns.
Collectively, extant research has advanced the understanding of food self-sufficiency by integrating production and consumption dimensions, addressing regional disparities, and expanding temporal and spatial granularity. Nevertheless, important methodological limitations persist. For instance, the observed variability in self-sufficiency rate estimates primarily stems from inconsistencies in the definitions and scopes of the underlying data used, such as differences in the types of food included and the treatment of consumption categories. Furthermore, the prevailing approach of employing static coefficients in addressing food waste and loss is questionable given the mounting evidence indicating that approximately one-third of global food is wasted annually [43,44]. These discrepancies hinder the comparability of results across regions and time periods, potentially distorting assessments of food security. Consequently, there is a necessity for more standardized, integrative, and consumption-adjusted evaluation frameworks.
To address these issues, this study proposes an improved method for calculating food demand that explicitly accounts for food waste and loss, based on traditional food demand calculation methods. Using this method, this study estimates China’s food self-sufficiency rate and analyzes the spatiotemporal evolution of national food security patterns. The main objectives of this study are as follows: (1) To integrate multiple approaches, including the stint counting method, the flow statistics method, and the consumption statistics method, to develop an improved flow–consumption statistics method, which identifies the proportion of food waste and losses; (2) To calculate both national and provincial food self-sufficiency and grain self-sufficiency rates in China using different calculation methods, and to assess the discrepancies among results; (3) To evaluate the spatiotemporal evolution of food and grain self-sufficiency in China at both national and provincial levels from 2010 to 2022 by using the flow–consumption statistics method, and to characterize the food security landscape; (4) To explore the impacts of urban and rural disparities and the spatial mismatch of resource endowments on China’s food security.
This study combines flow and consumption statistics to develop a new method for calculating food self-sufficiency, enriching food security analysis and quantifying the impact of food waste and loss. These findings can enable more accurate assessments of food security at both regional and national levels, and offer valuable insights for formulating forward-looking, scientifically grounded food strategies.

2. Methods and Data

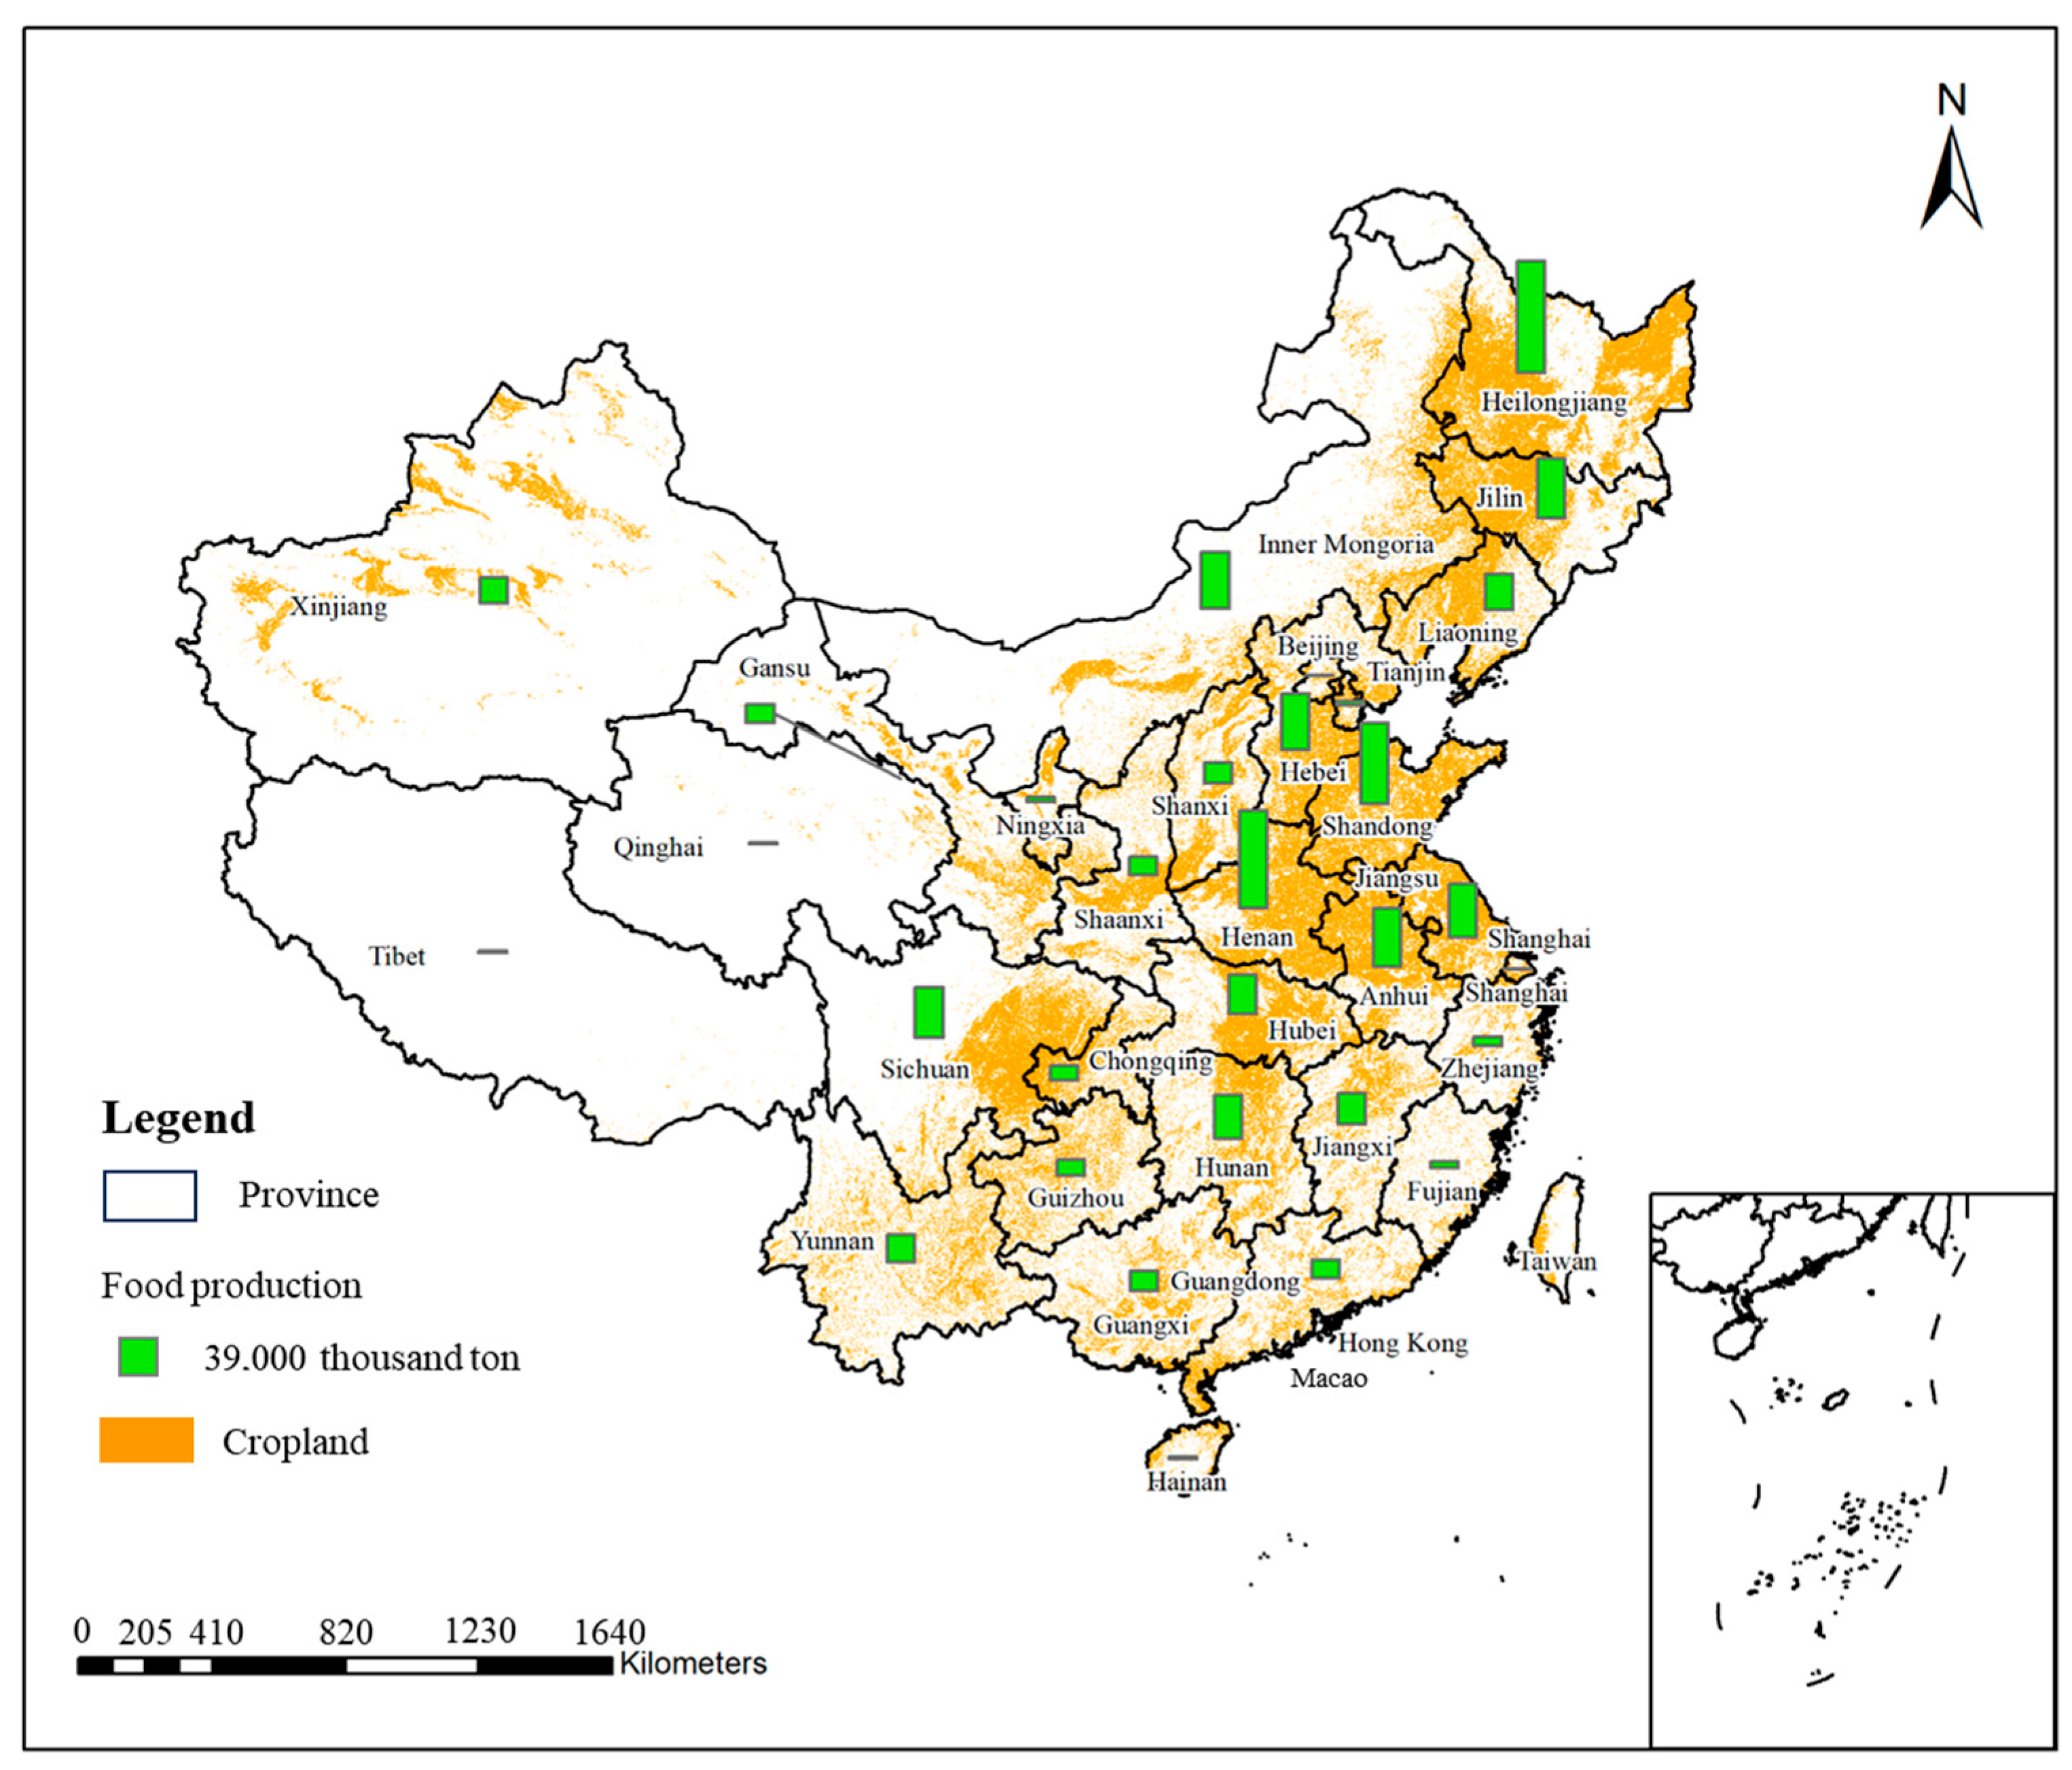
2.1. Study Area and Data Sources

China, as the world’s second populous country and the second-largest economy, plays a pivotal role in global food production and consumption. According to statistical data from 2022, China had a population of 1.4 billion people, a gross domestic product (GDP) of USD 17.96 trillion, a total grain output of 633.24 million tons, and an arable land area of 1.28 million square kilometers. This means that China, with only 8.1% of the world’s arable land, contributed 22.9% of global grain output, supported 17.9% of global GDP, and fed 17.8% of the world’s population [45,46,47,48]. These figures demonstrate China’s high level of agricultural intensification and productivity, while also highlighting the immense pressure on land resources and the critical importance of ensuring food security. This study adopts a two-scale approach—national and provincial—to calculate the food self-sufficiency rate and grain self-sufficiency rate, and to evaluate the spatiotemporal evolution of food security patterns. Due to data availability, this analysis includes only the 31 provincial-level administrative divisions of mainland China, excluding Taiwan, Hong Kong, and Macau. The data sources used in this study are summarized in Appendix A Table A1. The spatial distribution of these provinces is illustrated in Figure 1. The cropland data were derived from a 30 m resolution land cover dataset (https://zenodo.org/records/8176941, accessed on 20 May 2025), and food production data were obtained from the China Statistical Yearbook. All data refer to the year 2022.

2.2. Calculation Methods

2.2.1. Food Self-Sufficiency Rate

The food self-sufficiency rate (SSR) is defined as the percentage of total domestic food production relative to total food consumption demand, and is calculated as follows:
S S R = P F D F × 100 %
where S S R represents the food self-sufficiency rate, P F is the total food production, and D F is the total food consumption demand.
While food production statistics are relatively reliable, the accuracy of SSR calculations is primarily affected by the definition of food and the estimation of food consumption. Variations in the statistical scope of food and the methods used to calculate consumption can lead to significant differences in the resulting SSR values. Three commonly used approaches for estimating food demand are the stint counting method, the flow statistics method, and the consumption statistics method.
In this study, based on the characteristics of China’s food production and consumption, the following two statistical definitions of food are employed: (1) Broadly defined food, which includes cereals, legumes, and tubers. Cereals mainly comprises rice, wheat, and maize, along with minor grains such as millet and sorghum. Legumes are primarily soybeans, though other varieties are also included. Tubers refers to crops such as cassava and sweet potatoes. (2) Narrowly defined food, which refers exclusively to cereals, including rice, wheat, maize, and other minor grains. In the following analysis, the broadly defined food-based self-sufficiency rate is referred to as Food SSR, and the narrowly defined food-based self-sufficiency rate is referred to as Grain SSR. Food production data are sourced from the National Bureau of Statistics of China (https://www.stats.gov.cn/sj/ndsj/, accessed on 20 May 2025).

2.2.2. Stint Counting Method for Estimating Food Demand

The stint counting method estimates food demand by multiplying the per capita food consumption by the total population, using the following formulas (see Reference [42]):
D S C = P o × d
D S C , P r = P o P r × d
where D S C denotes the national food demand estimated by the stint counting method, P o is the total population, and d is the per capita food consumption. Based on the “National Food Security Medium and Long-term Planning Outline (2008–2020),” d is set as 400 kg/person/year for food self-sufficiency and 360 kg/person/year for grain self-sufficiency. D S C , P r represents the food demand of province Pr, and P o P r is the total population of Pr province.

2.2.3. Flow Statistics Method for Estimating Food Demand

The flow statistics method derives food demand by subtracting net exports and changes in stock from total food production. For provincial estimates, demand is allocated proportionally based on the province’s share of the national population. Import and stock change data were obtained from the FAO Statistical Database (https://www.fao.org/faostat/en/#home, accessed on 20 May 2025). The formulas are as follows (see Reference [42]):
D F S , i = P i + I i O i P i
D F S = i = 1 n D F S , i
D F S , P r = D F S P o × P o P r
where D F S is the national food demand estimated by the flow statistics method, D F S , P r is the demand in province Pr, P i is the production of food type i, I i and O i are imports and exports of food type i, and P i is the annual change in stock.

2.2.4. Consumption Statistics Method for Estimating Food Demand

The consumption statistics method calculates total food demand by summing the following five components: ration consumption, feed consumption, industrial consumption, seed retention, and loss.
(1) Ration Consumption
Ration consumption refers to food directly consumed by residents. Given urban and rural differences in diet and eating habits, ration consumption is estimated separately for rural and urban populations. Based on studies [39,40,49], it is assumed that 10% of rural and 14% of urban food consumption occurs outside the home. The formulas are as follows:
R C i = f r 1 r r o × P o r + f t 1 r t o × P o t
R C t o t a l = i = 1 n R C i
where R C i is the ration consumption of food type i, f r and f t are per capita consumption of rural and urban residents, r r o and r t o are the ratios of eating out, and P o r and P o t are the rural and urban populations, respectively.
(2) Feed Consumption
Feed consumption refers to food used indirectly via livestock to produce meat, dairy, and eggs. It is also estimated separately for rural and urban areas. Based on standard feed structures (see Table A2) and food-to-product conversion ratios [42], the formulas are as follows:
F C i = ( j = 1 m U r , j × a j × r f , j , i ) × P o r + ( j = 1 m U t , j × a j × r f , j , i ) × P o t
F C t o t a l = i = 1 n F C i
where F C i is the feed consumption of food type i, U r , j and U t , j are per capita consumption of animal product j in rural and urban, a i is the food-to-product conversion ratio, and r f , j , i is the share of food type i in feed for product j.
(3) Industrial Food Consumption
This refers to food used in producing industrial products such as liquor, beer, ethanol, starch, and monosodium glutamate (MSG). These account for 75% of total industrial food consumption [39]. For the conversion factors and food type shares see Table A3 and Table A4. The formulas are as follows:
I C i = k = 1 l P i n , k β k ÷ 0.75 × r i n , k , i
I C t o t a l = i = 1 n I C i
where I C i is the industrial consumption of food type i, P i n , k is the output of industrial product k, β k is its food conversion coefficient, and r i n , k , i is the share of food type i in its production.
(4) Seed Consumption
Seed consumption is calculated by multiplying seeding area by seeding rate for each crop using the following formulas:
S C i = S i × A i
S C t o t a l = i = 1 n S C i
where S C i is the seed consumption of food type i, S i is the seeding rate, and A i is the planting area.
(5) Food Loss
Based on findings from relevant studies [32,39], food losses are assumed to be 5% of total production, as shown in the following formula:
L C t o t a l = P F × 5 %
(6) Total Food Consumption Demand
Total demand is the sum of all food consumption. Equation (16) aggregates food demand across the entire country, while Equation (17) calculates food consumption for each individual province Pr. Each consumption component is estimated using province. The equations are as follows:
D C S = R C t o t a l + F C t o t a l + I C t o t a l + S C t o t a l + L C t o t a l
D C S , P r = R C t o t a l , P r + F C t o t a l , P r + I C t o t a l , P r + S C t o t a l , P r + L C t o t a l , P r

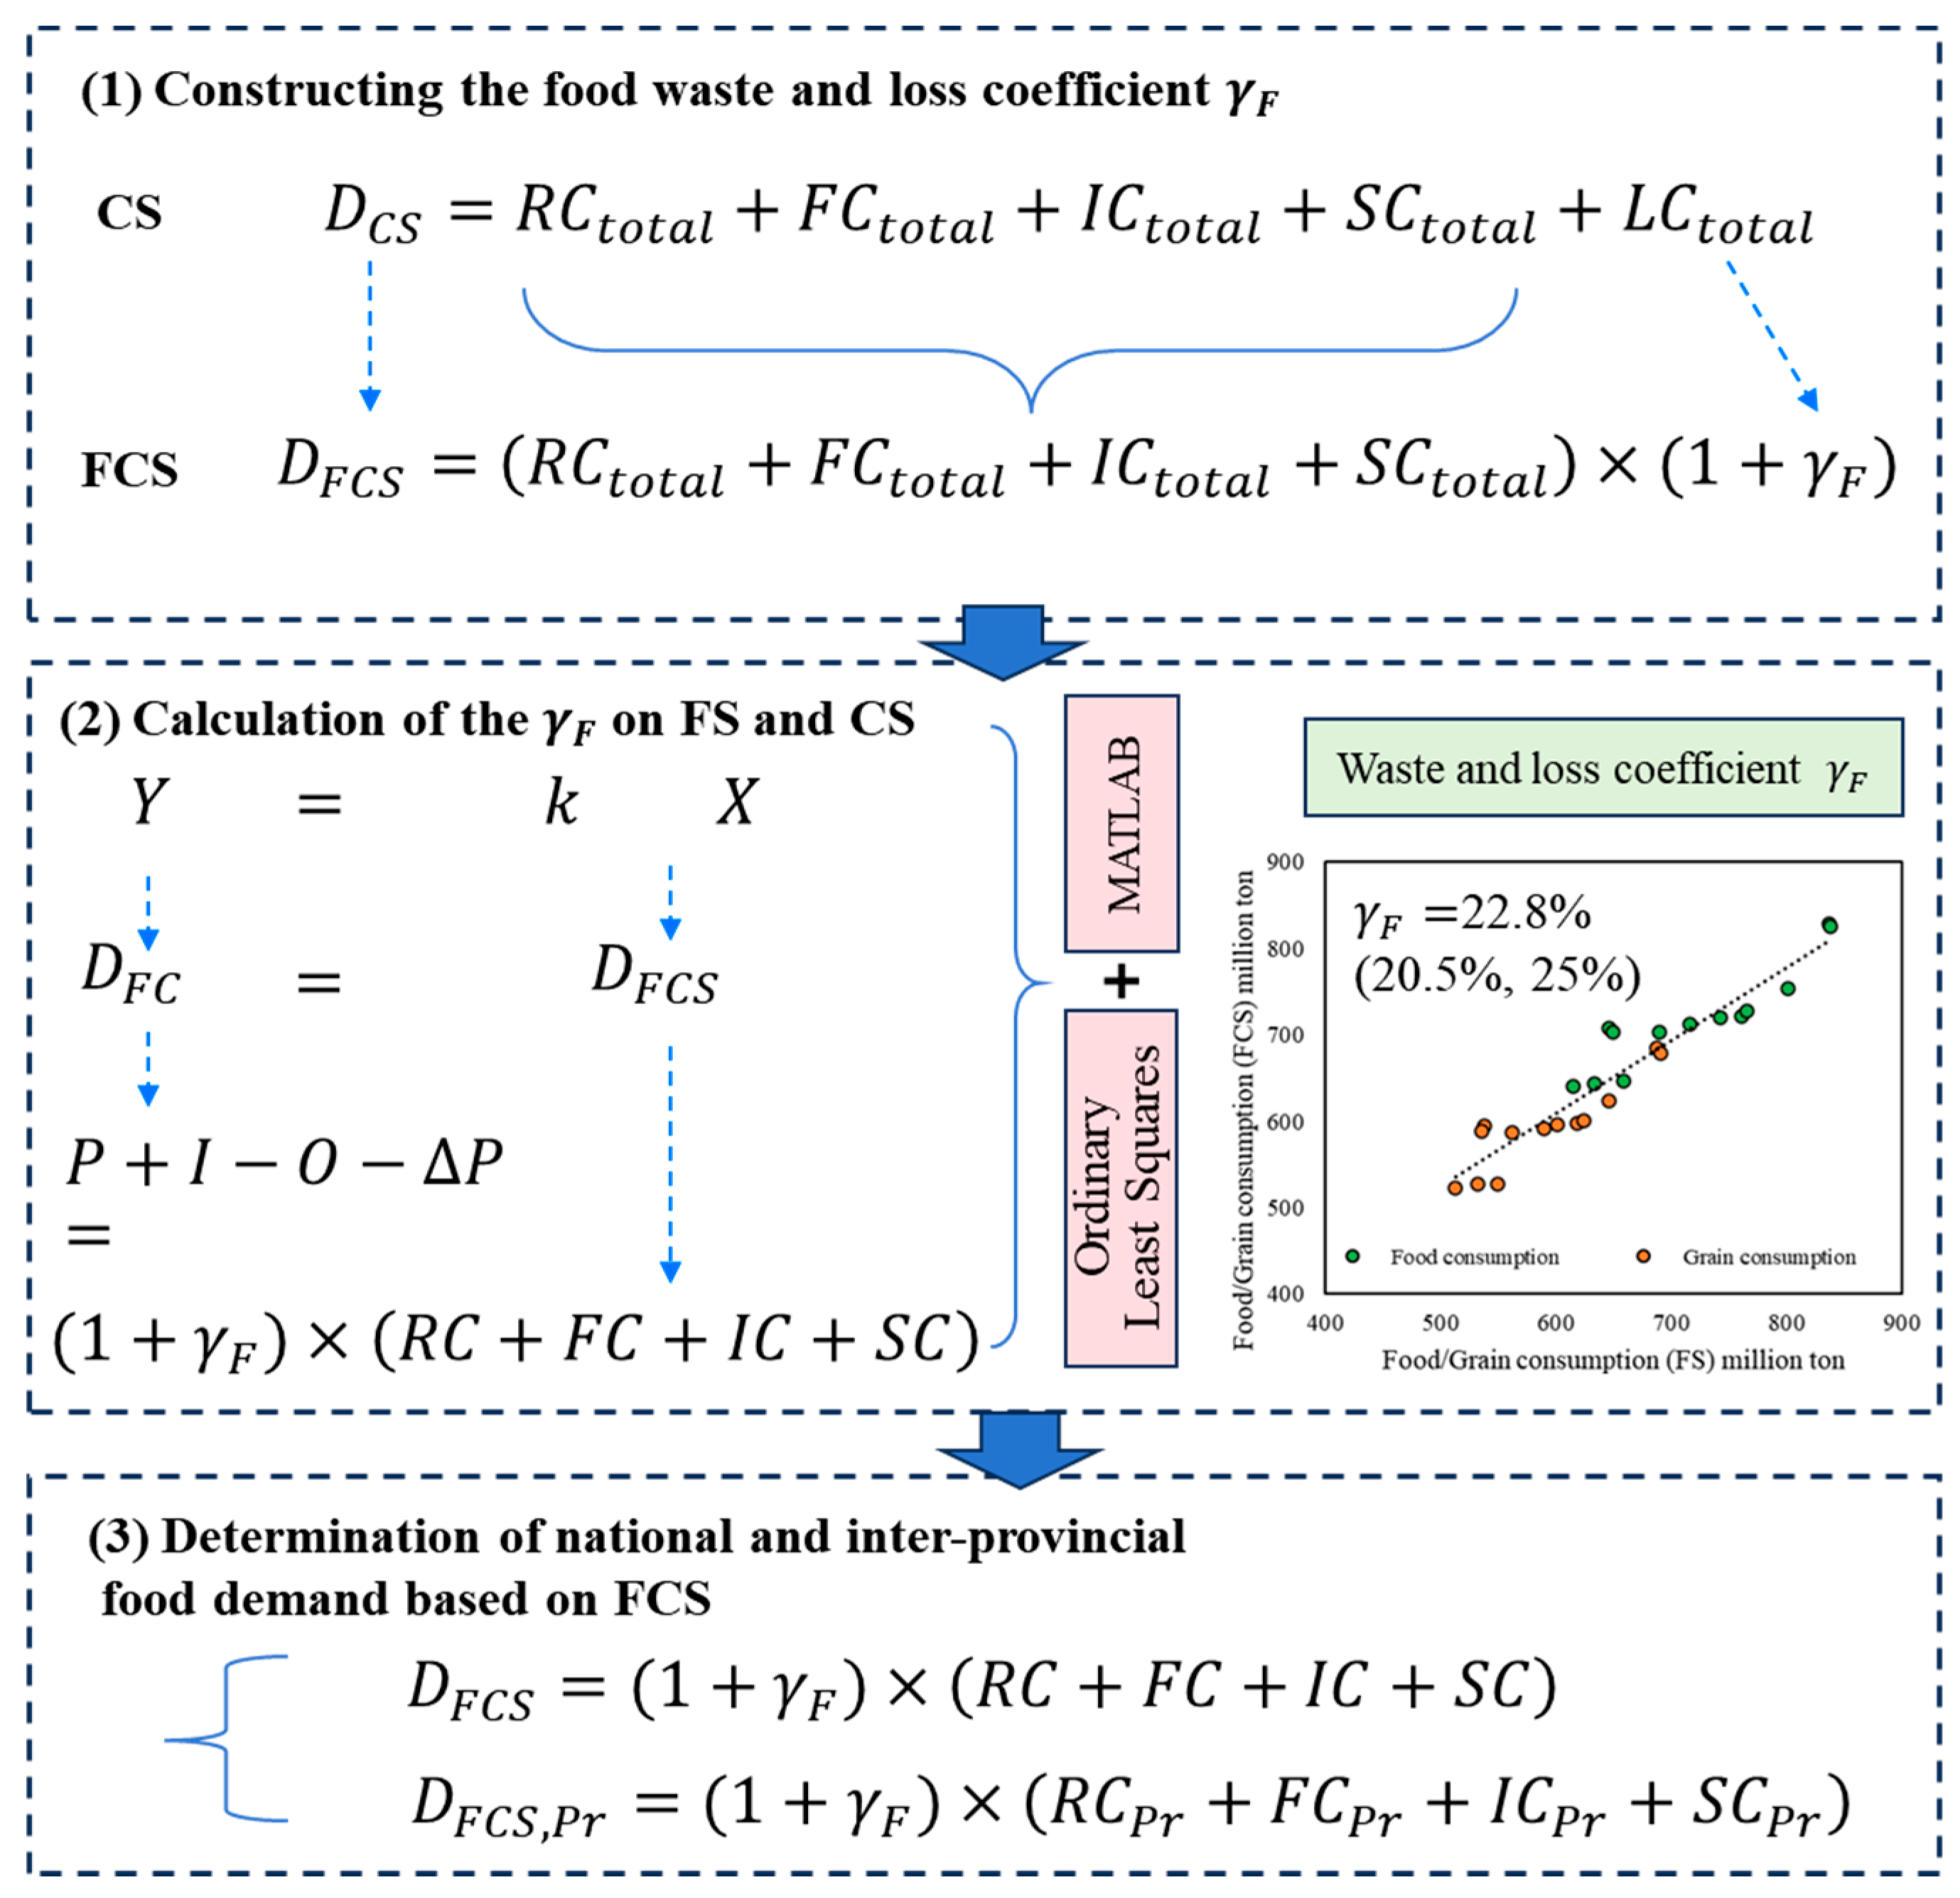
2.2.5. Flow–Consumption Statistics Method for Estimating Food Demand

To overcome the limitations of traditional food self-sufficiency estimation approaches, this study proposes an improved flow–consumption statistics (FCS) method. This approach integrates the macro-level balancing capability of the flow statistics (FS) method with the structural resolution of the consumption statistics (CS) method, and incorporates a dynamically calibrated mechanism for food loss and waste.
The FS method estimates national food demand by balancing domestic production, trade, and stock changes. It is effective at the macro scale but introduces substantial bias at the provincial level due to the omission of inter-provincial food circulation. In contrast, the CS method decomposes food consumption into various end uses—such as staple food, feed, seed, industrial processing, and loss—allowing for flexible estimation at both national and subnational scales. However, the CS method traditionally relies on fixed parameters, making it difficult to capture real-world variations across regions, time periods, and food categories. As pointed out by the FAO [50] and subsequent studies [51,52,53], the use of static coefficients may result in estimation bias, limiting model adaptability and accuracy.
The FCS method systematically addresses these limitations through the following three-step framework:
(1) Incorporation of a dynamic food loss coefficient. The traditional static loss rate in the CS method is replaced by a dynamic food waste and loss coefficient γ F , which accounts for regional, temporal, and commodity-specific variability.
(2) National-level calibration. The γ F parameter is calibrated using a least squares optimization approach to minimize the discrepancy between CS-derived and FS-derived national food demand estimates over the 2010–2022 period. This step ensures consistency between the food consumption structure and overall supply–demand balance.
(3) Provincial-level application. The calibrated γ F is applied to provincial-level CS data to generate subnational estimates of food demand and self-sufficiency rates. This approach retains the structural decomposition of the CS method while correcting for the overestimation or underestimation biases caused by static assumptions.
By combining structural disaggregation, system balancing, and dynamic parameter adjustment, the FCS method offers a more adaptive and spatially resolved tool for estimating food self-sufficiency. The complete workflow is illustrated in Figure 2, which demonstrates the interaction between FS data, CS structure, dynamic parameters, and multi-scale estimation results.

3. Results

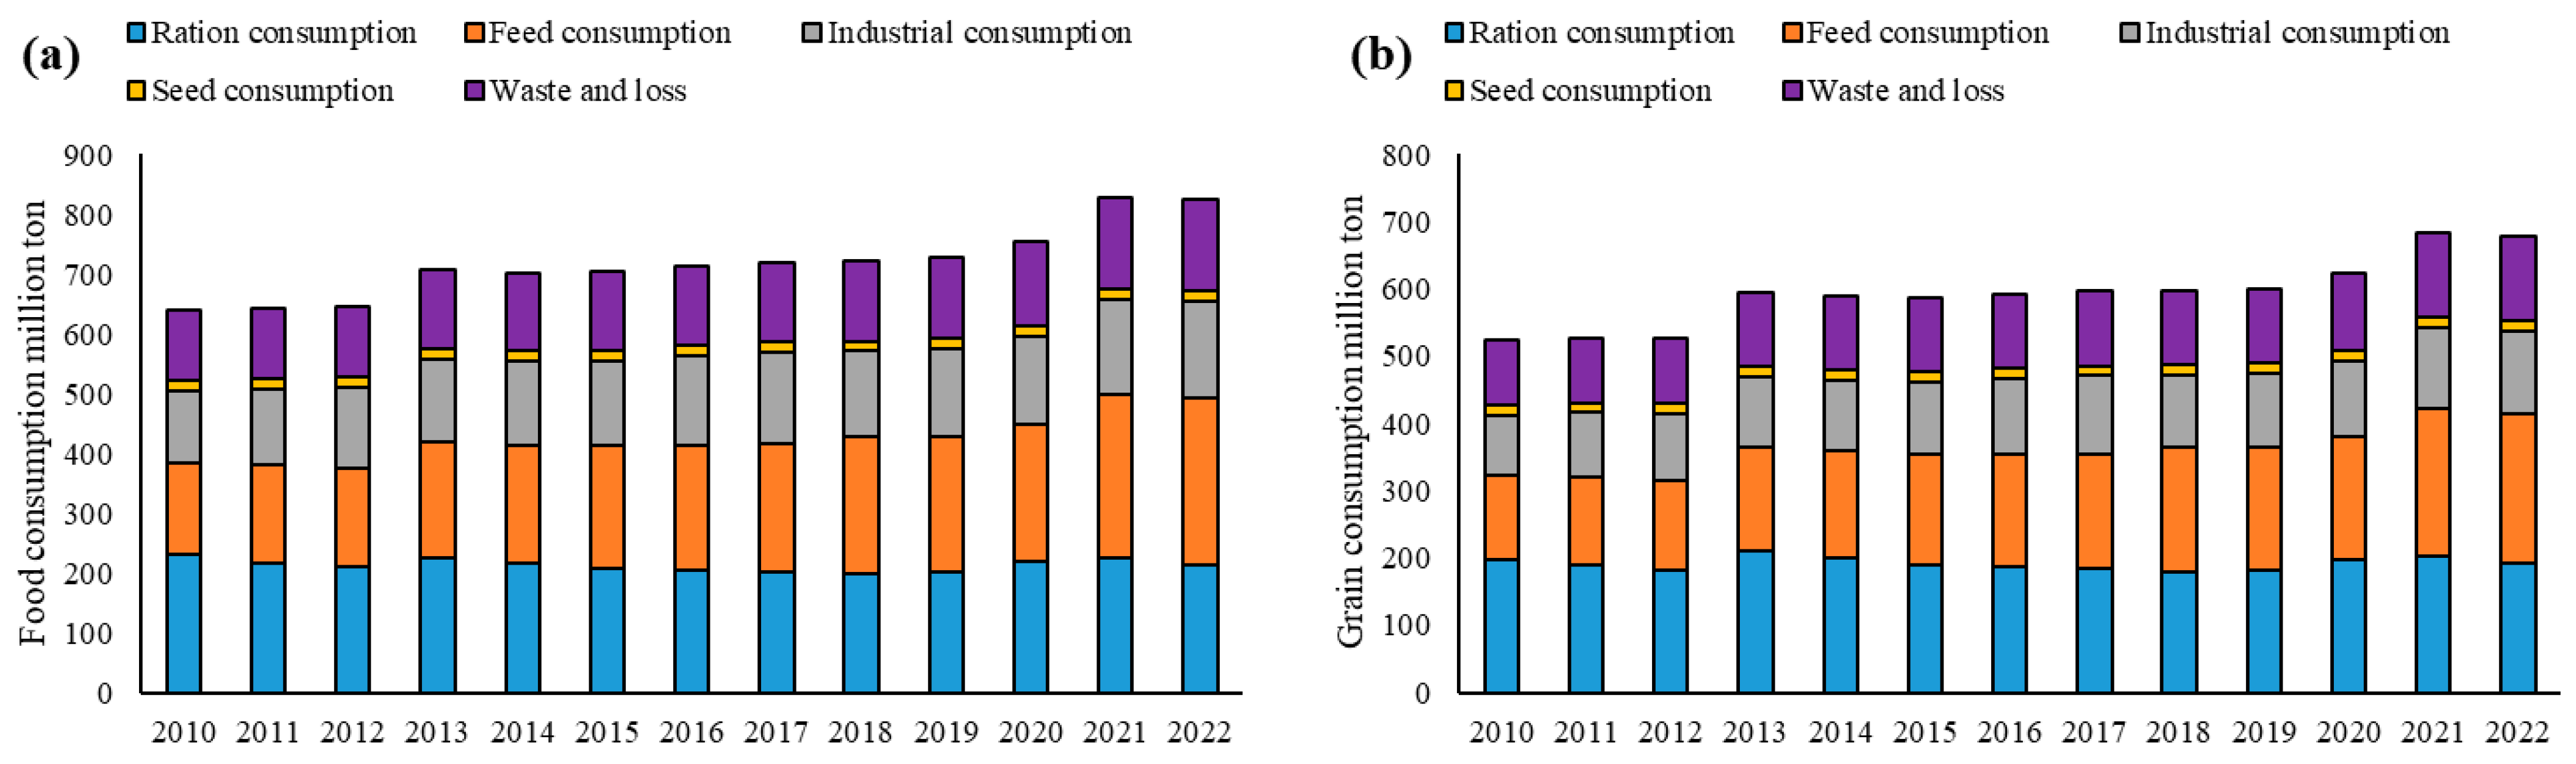
3.1. National-Scale Food Security Status

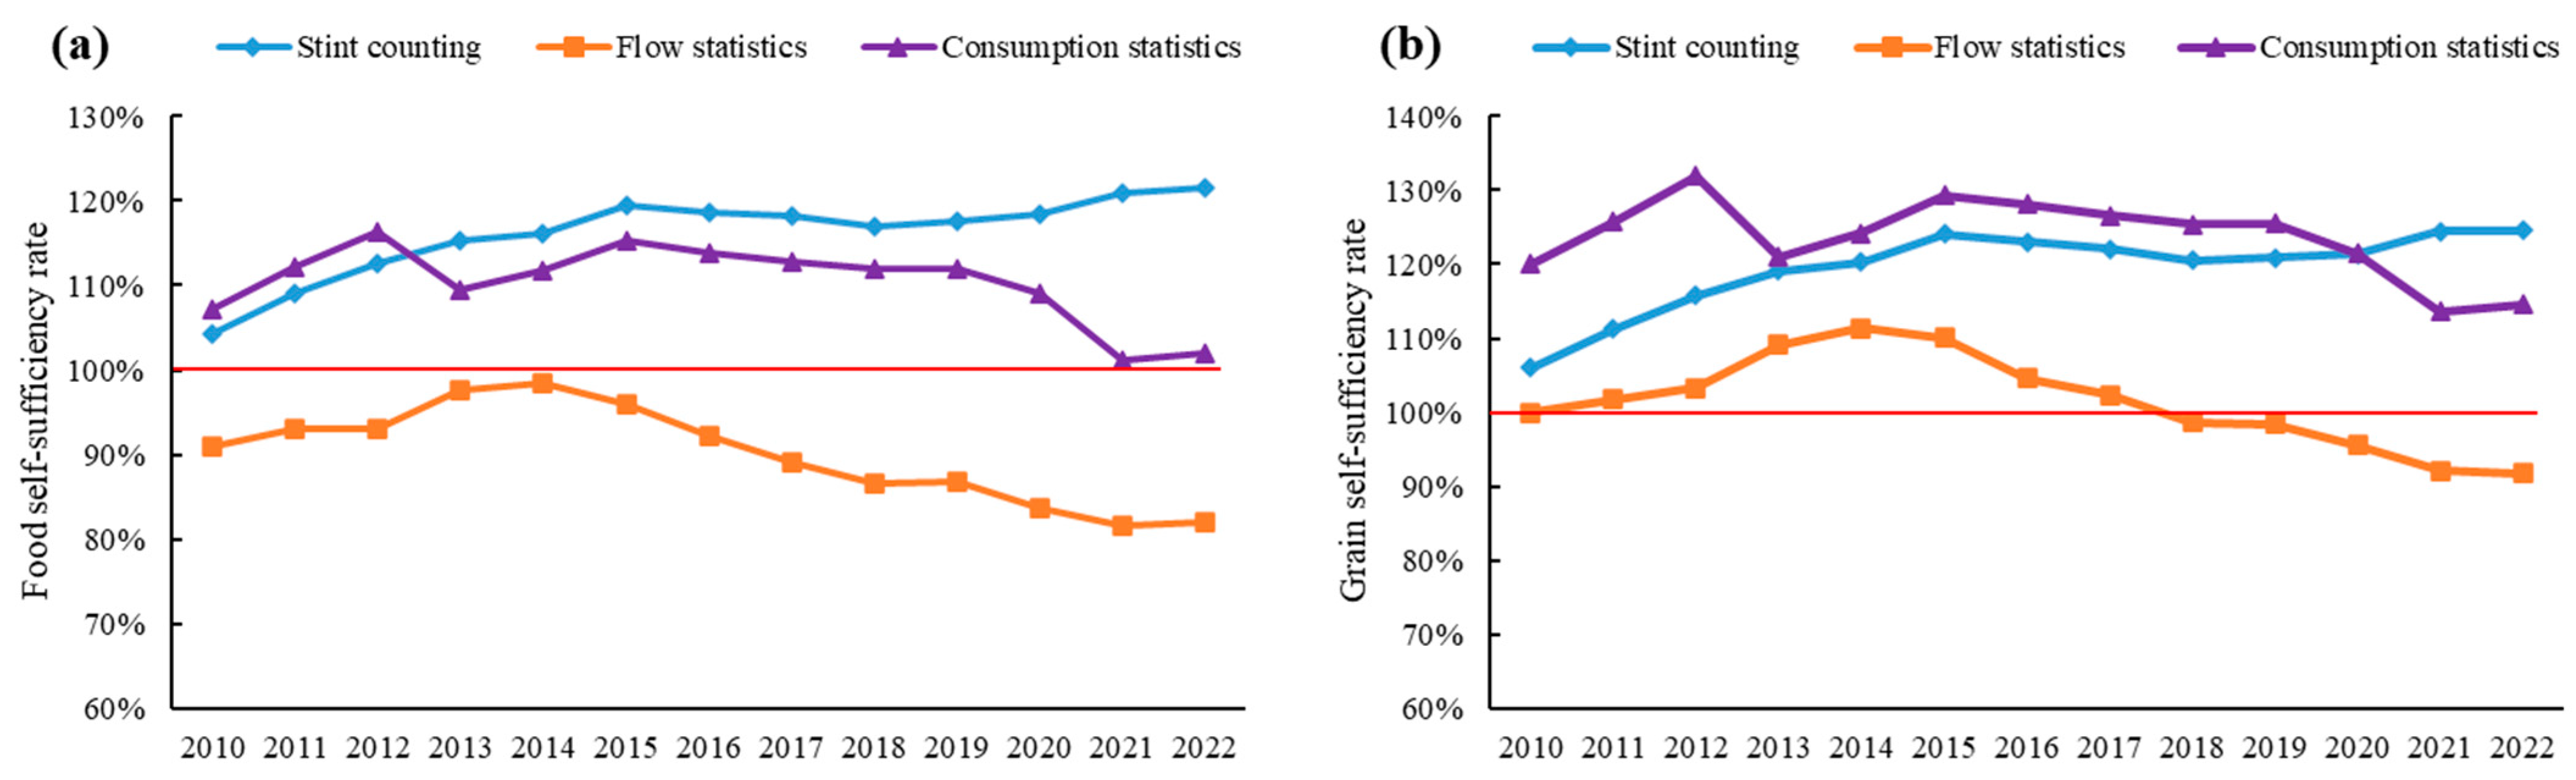
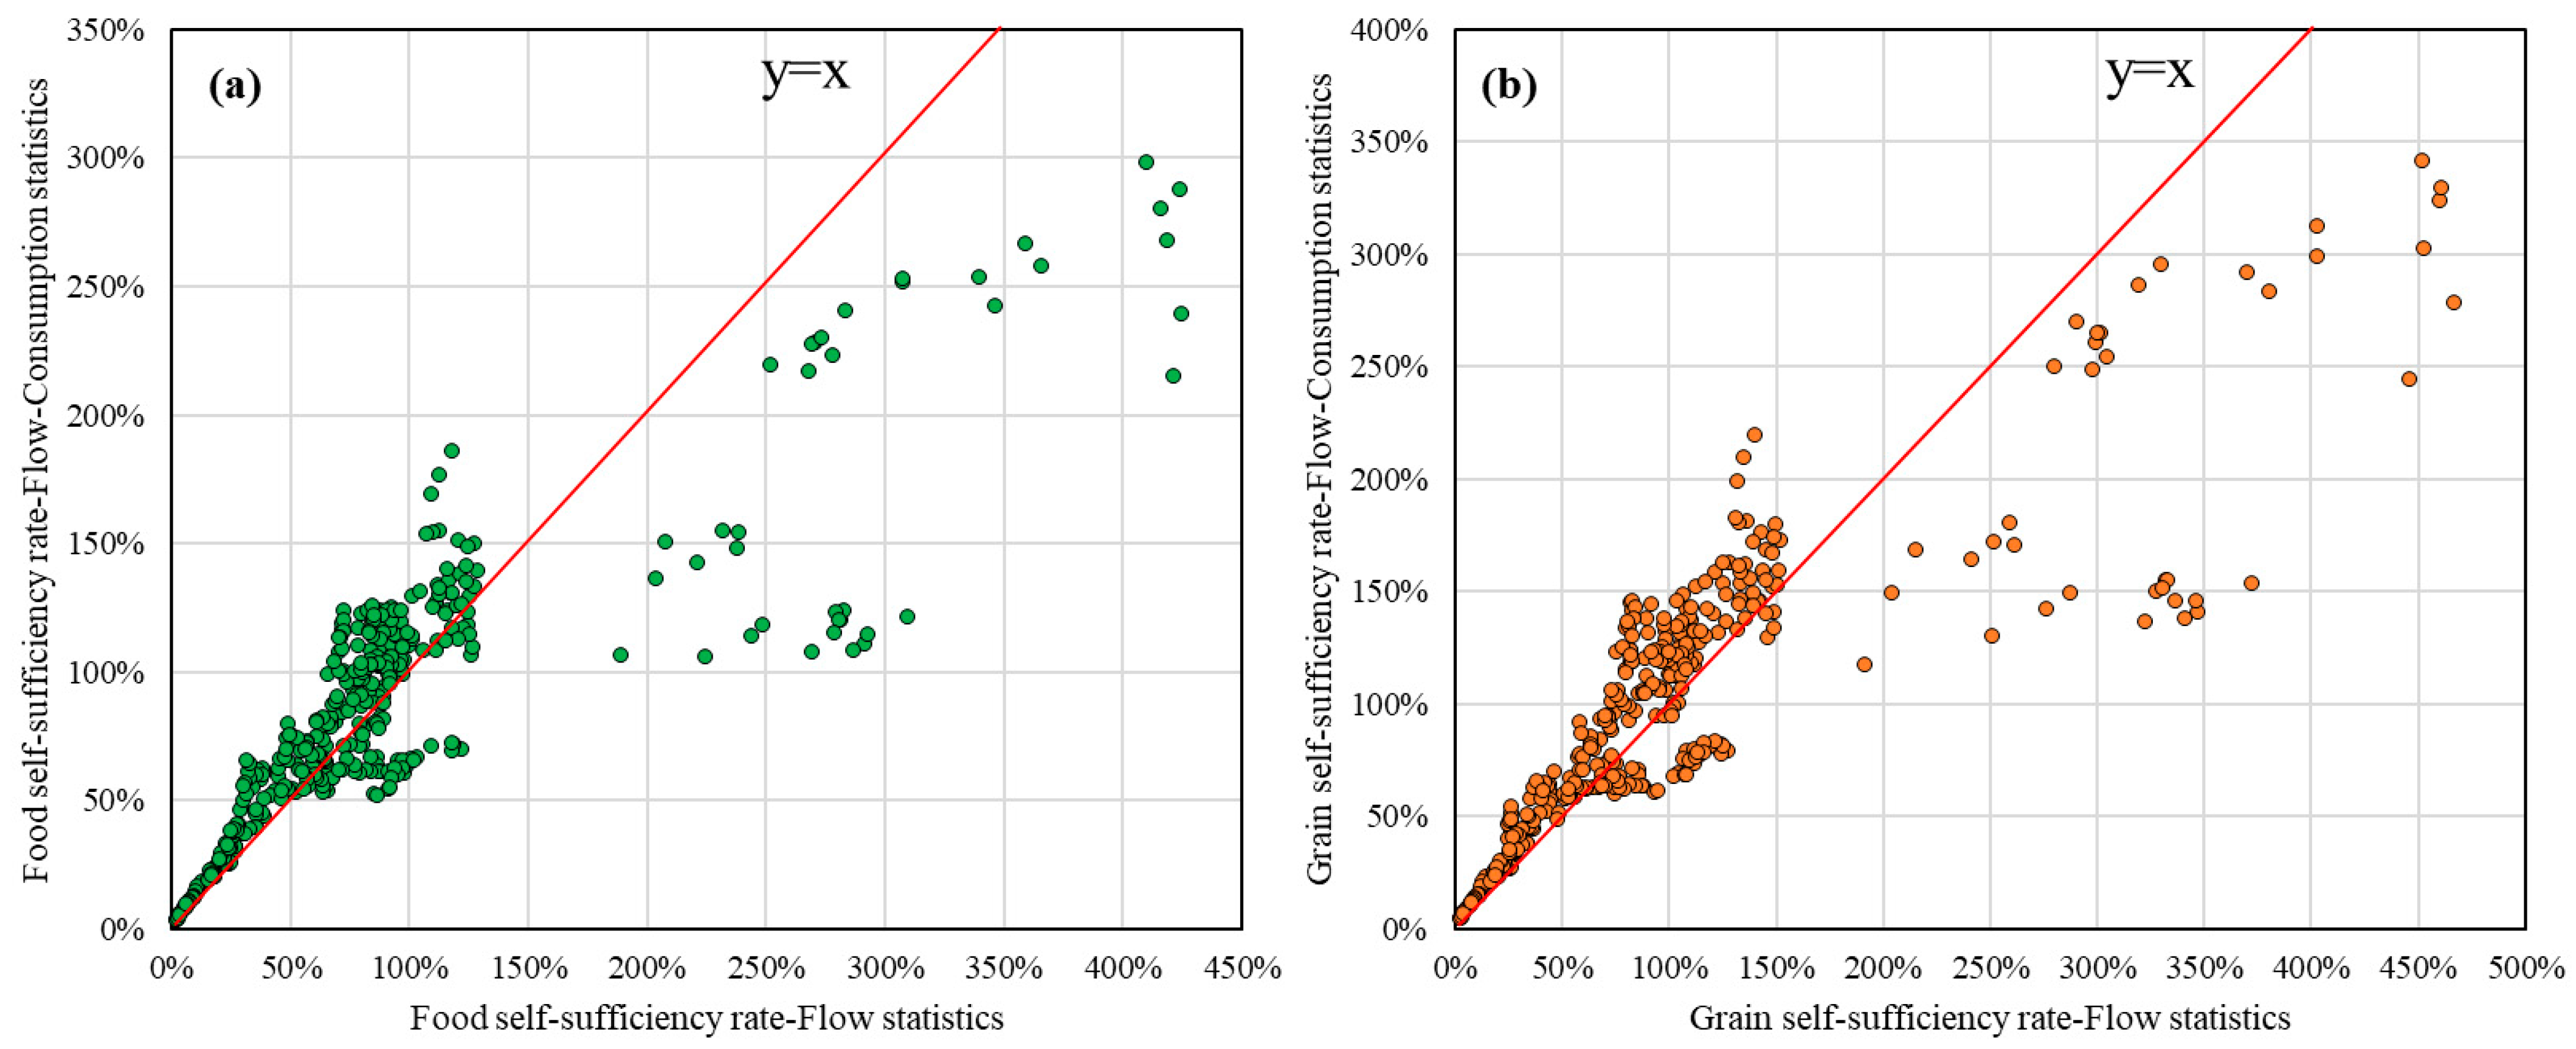
3.1.1. Comparison of Self-Sufficiency Rates Using Traditional Methods

Figure 3 presents the estimated food and grain self-sufficiency rates in China from 2010 to 2022, calculated using the stint counting method (SC), flow statistics method (FS), and consumption statistics method (CS). In terms of food self-sufficiency, the SC method shows an increasing trend, rising from 104% in 2010 to 122% in 2022. In contrast, both FS and CS methods exhibit similar patterns: an initial increase followed by a decline. Notably, after 2014–2015, FS and CS diverged from SC, showing opposite trends. This divergence is attributable to the increasing diversification of food consumption patterns and a concurrent rise in feed and industrial food use driven by socioeconomic development and improved living standards. As a result, the fixed quota used in the SC method no longer accurately reflects actual food demand, leading to a significant overestimation of the self-sufficiency rate.
Comparing the results from FS and CS reveals a marked difference. According to the FS method, food self-sufficiency peaked at 98% in 2014, approaching full self-sufficiency, but declined rapidly thereafter, reaching only about 82% by 2022, indicating emerging food security concerns. In contrast, the CS method estimates the food self-sufficiency rate at 102% in 2022 despite the downward trend, suggesting that relying solely on CS may underestimate the risks associated with food security.
Grain self-sufficiency rates follow trends similar to those of food self-sufficiency but are generally higher. According to the FS method, the multi-year average grain self-sufficiency rate from 2010 to 2022 was 101%, dropping to a low of 92% in 2022, still within an acceptable range for national food security. The CS method reports a multi-year average of 124%, which not only exceeds the FS estimate but also surpasses the 120% calculated by the SC method, implying that CS may overestimate both food and grain self-sufficiency.

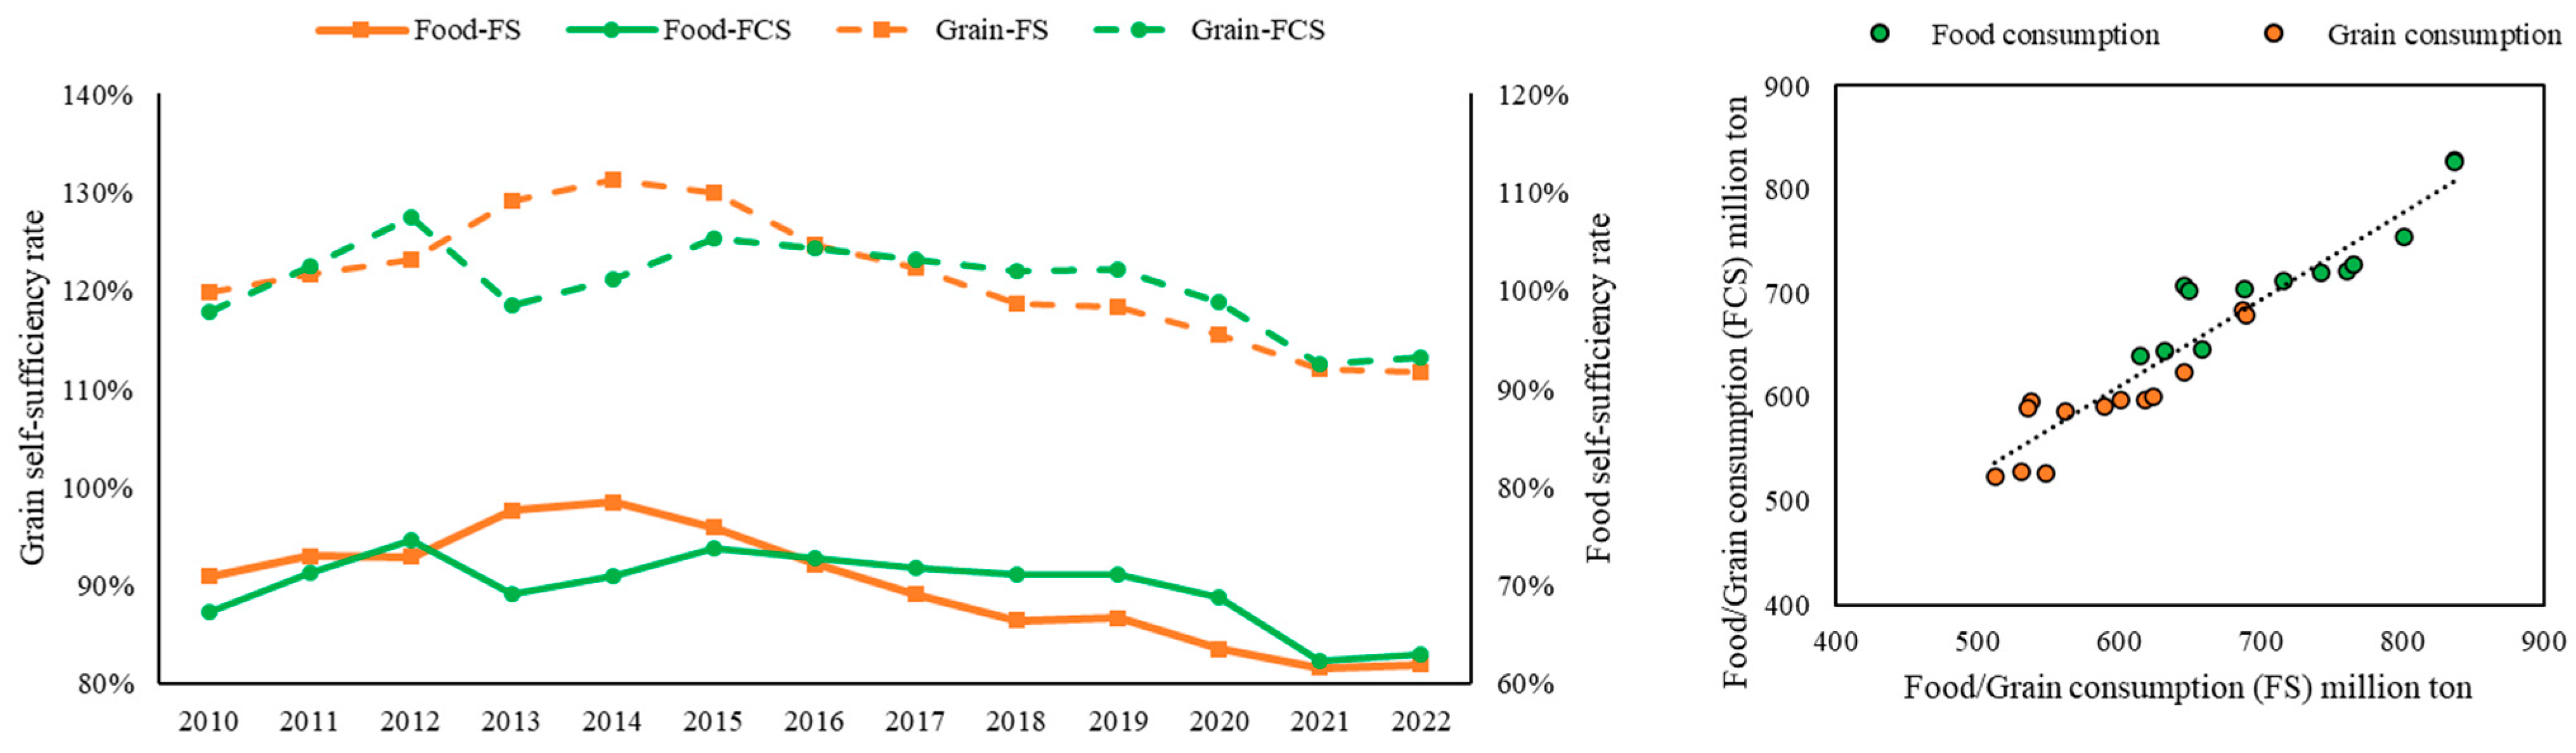
3.1.2. Self-Sufficiency Rates Using the FCS Method

The flow–consumption statistics (FCS) method was used to estimate China’s food and grain self-sufficiency rates and compared against the FS method, as shown in Figure 4. The introduction of the food waste and loss coefficient ( γ F ) in the FCS method effectively corrects for the overestimation problem inherent in the traditional CS approach. The self-sufficiency rates derived from FCS and FS exhibit a high correlation, with an R2 value of 0.8978. In terms of interannual variability, the two methods show broadly consistent trends, except for notable deviations in 2013 and 2014, when FCS estimates were significantly lower than FS.
Based on the FCS method, the estimated food waste and loss coefficient γ F is 22.8%, with a 95% confidence interval of 20.5% to 25%. This coefficient comprehensively reflects the total waste and losses across various stages of consumption, including ration, feed, industrial use, and seed use, during the 2010–2022 period. The value significantly exceeds loss levels reported in some related studies. For instance, according to a six-year nationwide field survey and literature review by Li, approximately 27% of food intended for human consumption in China is lost or wasted annually [52]. Thus, the integrated FCS method not only realistically reflects changes in self-sufficiency but also provides a robust assessment of food waste levels.
The FCS method also enables analysis of the structural composition of food and grain consumption (Figure 5). The trends for both food and grain consumption structures are generally similar. Seed use accounts for a small and fluctuating proportion. Among the remaining four components, only ration consumption shows a declining trend, while feed consumption increases most rapidly. In 2010, ration and feed accounted for 36% and 24% of total food consumption, respectively. By 2022, these proportions had reversed, 26% for ration and 34% for feed, indicating a significant dietary shift, with residents reducing traditional ration consumption and increasing meat intake, thereby driving up total food demand. Industrial consumption has also increased steadily, but its magnitude and trend are closely aligned with the rise in food waste and loss. This suggests that losses and waste are nearly equivalent to the entire industrial consumption, underscoring the urgency of addressing inefficiencies in the food supply chain.

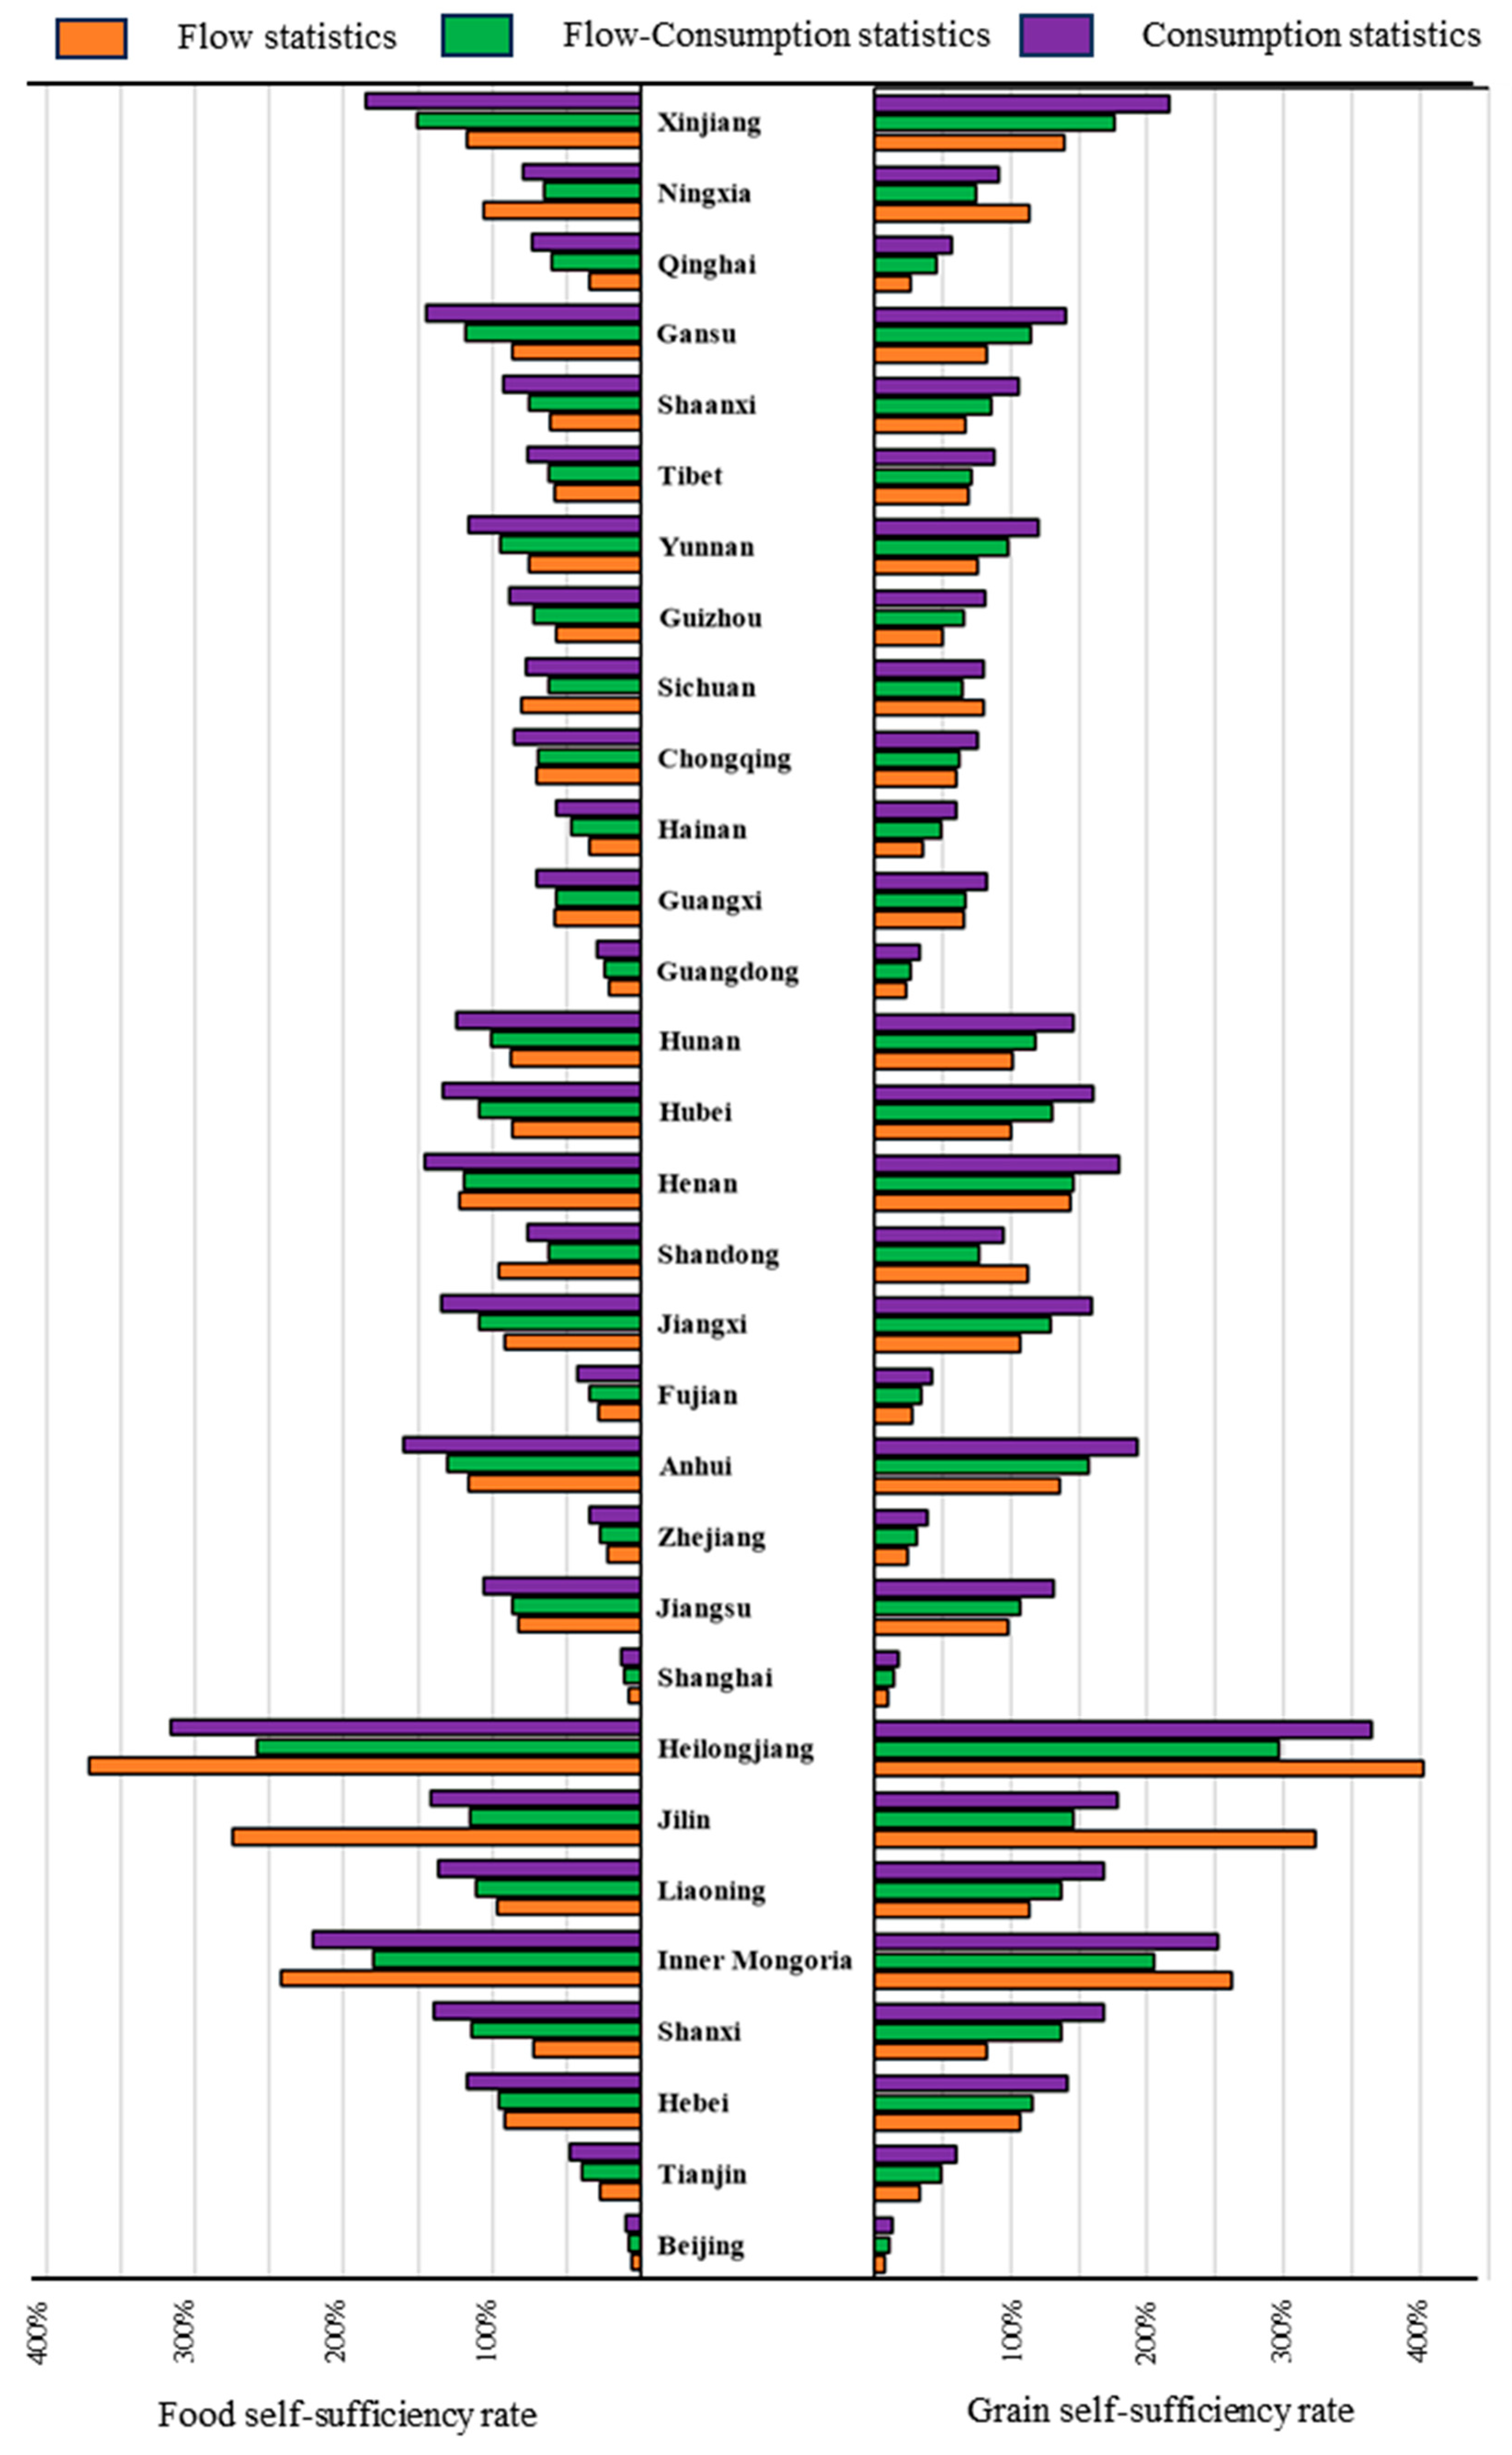
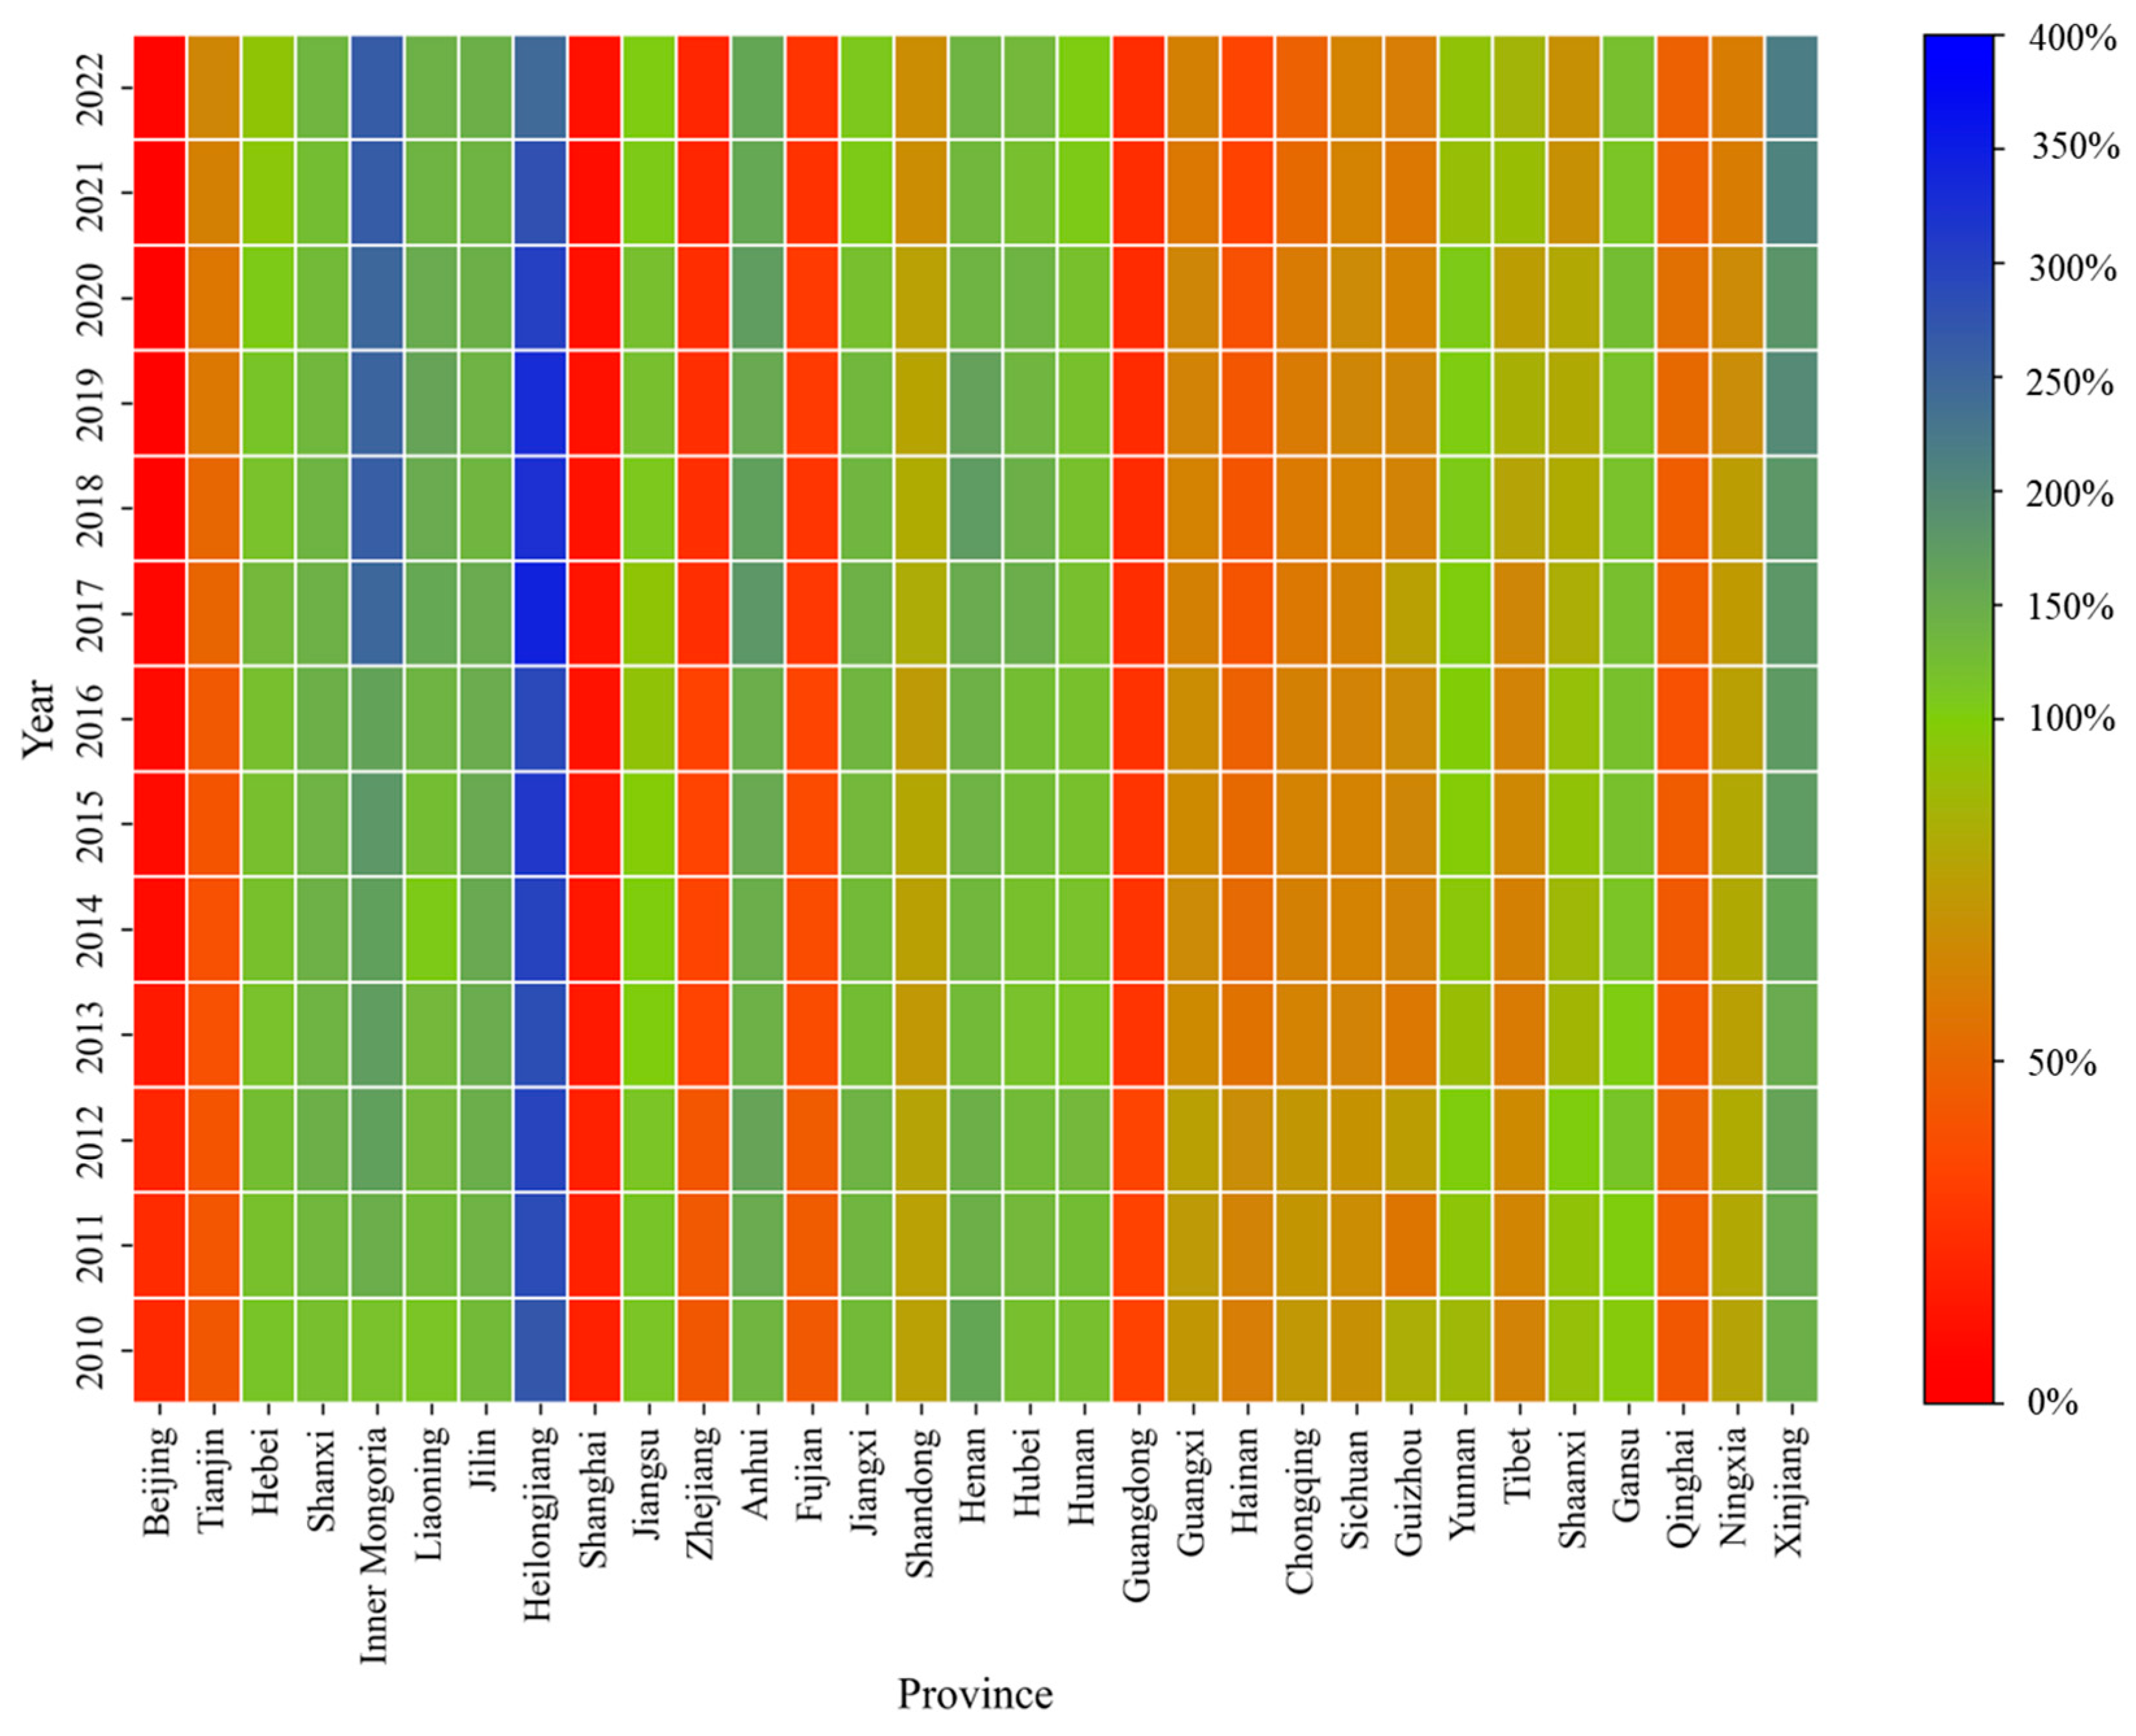
3.2. Provincial-Scale Food Security Status

To further evaluate the effectiveness of the FCS method at the inter-provincial scale, this section compares the self-sufficiency rates estimated by FS, CS, and FCS, which are three different methods, across various provinces. As previously demonstrated, the SC method fails to accurately reflect variations in self-sufficiency; therefore, it is excluded from further analysis.
Figure 6 compares the multi-year average provincial food and grain self-sufficiency rates estimated by FS, FCS, and CS methods. Figure 7 presents the annual food and grain self-sufficiency rates from 2010 to 2022 as estimated by FS and FCS. Results show that FS underestimates food self-sufficiency rates compared to FCS in 71% of the provinces, with nearly half of these provinces underestimations being within 10%. On a multi-year average basis, Shanxi, Xinjiang, and Gansu are the three most significantly underestimated provinces, with deviations of 41%, 33%, and 31%, respectively, all exceeding 30%. Although fewer provinces experience overestimation, the extent of overestimation is more pronounced. Notably, Jilin, Heilongjiang, and Inner Mongolia exhibit overestimations of 159%, 113%, and 62%, respectively. Regarding grain self-sufficiency, FS underestimates the rates in 74% of the provinces when compared to FCS. Again, Shanxi, Xinjiang, and Gansu are the most significantly underestimated, by 54%, 37%, and 32%, respectively, indicating that underestimation is even more severe for grain than for food self-sufficiency. The provinces with the greatest overestimation remain Jilin, Heilongjiang, and Inner Mongolia, with respective deviations of 178%, 106%, and 57%. Although Jilin’s overestimation is more pronounced in grain than food self-sufficiency, overestimation in other provinces appears to have slightly decreased.
The CS method, in contrast, consistently overestimates both food and grain self-sufficiency rates compared to FCS. The top three overestimating provinces are Heilongjiang, Inner Mongolia, and Xinjiang, with food self-sufficiency overestimated by 59%, 41%, and 34%, and grain self-sufficiency by 68%, 47%, and 40%, respectively. This indicates that the CS method tends to produce even higher overestimates for grain self-sufficiency than for overall food self-sufficiency. Notably, Heilongjiang and Inner Mongolia are overestimated under both FS and CS methods, whereas Xinjiang shows underestimation under FS but overestimation under CS.
Population density is a critical factor affecting regional self-sufficiency. This study finds that provinces with high population density and urbanization levels—such as Beijing, Shanghai, Jiangsu, and Guangdong—tend to have relatively low food and grain self-sufficiency rates. Due to limited arable land and high per capita food demand, these regions rely heavily on inflows from other provinces or international markets to meet local consumption needs. In contrast, provinces such as Heilongjiang, Inner Mongolia, and Jilin, which are less densely populated and have high agricultural output, often serve as net food exporters. This spatial imbalance also helps explain the significant overestimation of self-sufficiency rates in these areas under the FS and CS methods.

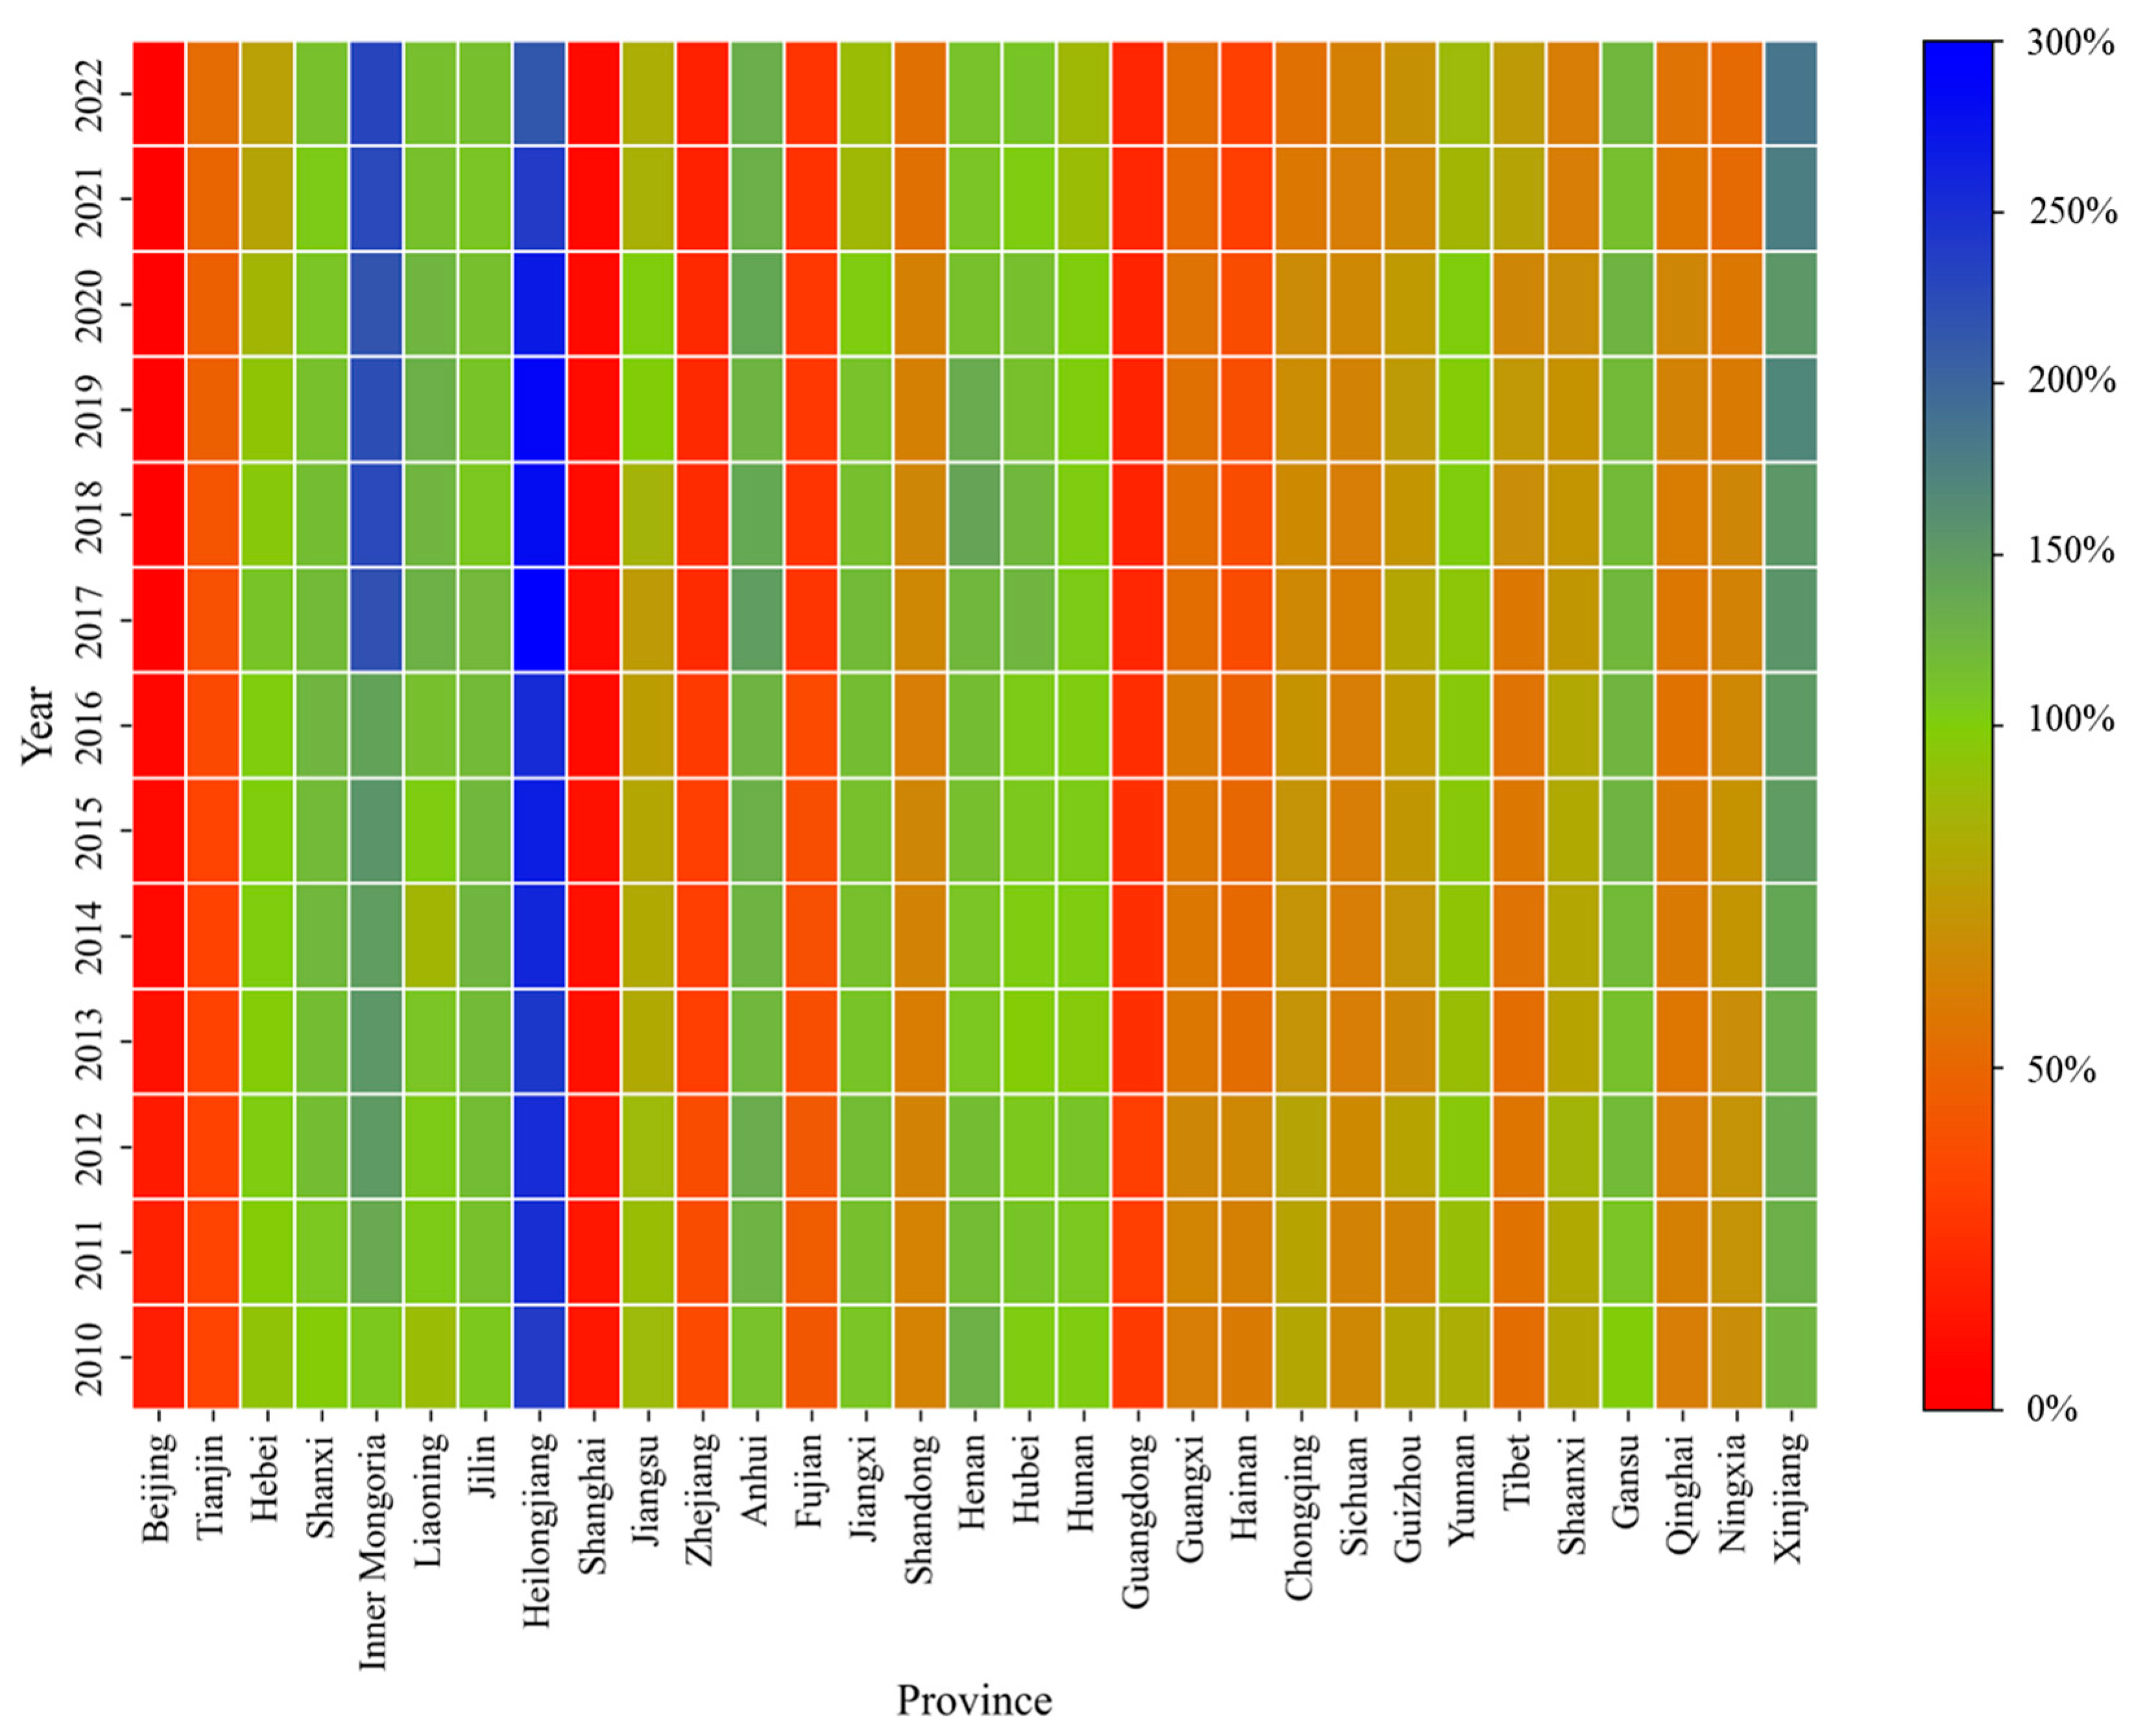
3.3. Spatiotemporal Analysis of Food Security

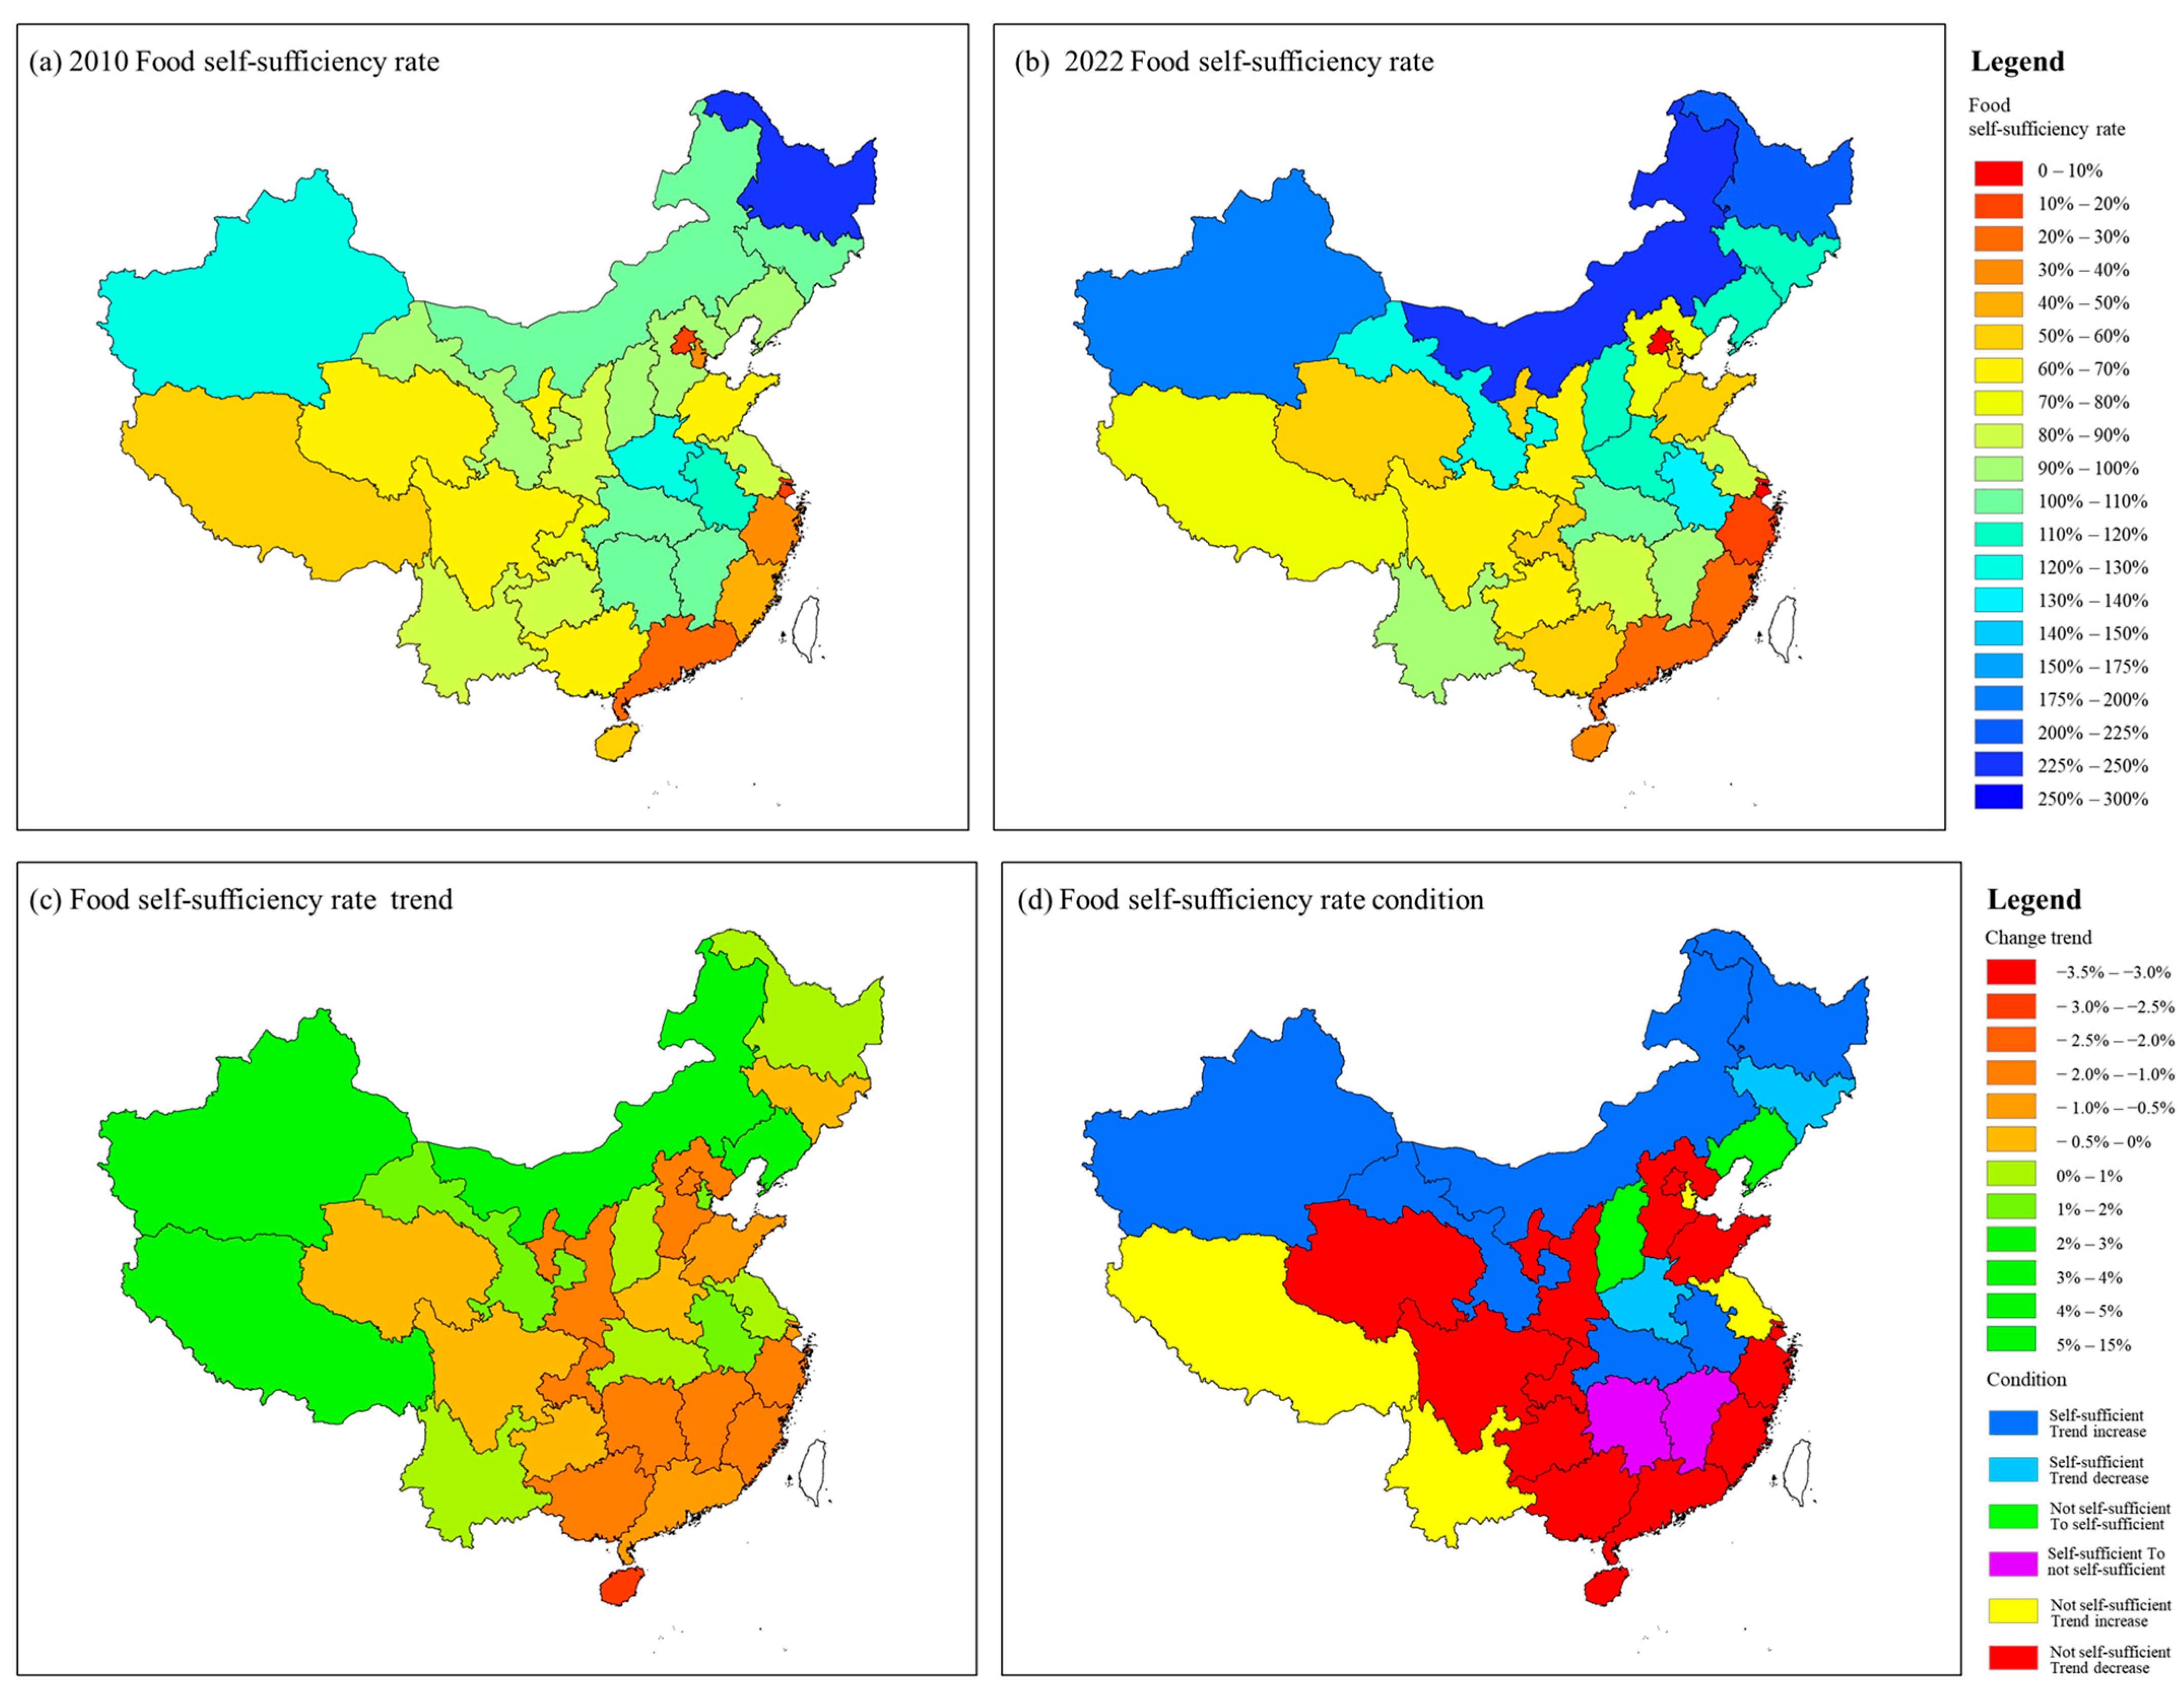
3.3.1. Spatiotemporal Dynamics of Food Self-Sufficiency Rate

Figure 8 illustrates the annual evolution of food self-sufficiency rates across 31 provinces from 2010 to 2022. Heilongjiang consistently maintains the highest and most stable food self-sufficiency rate, with rates exceeding 200% throughout the period. Inner Mongolia exhibits the most significant growth, surpassing 200% after 2016 and becoming the second highest in China. Conversely, Beijing, Shanghai, Guangdong, and Zhejiang exhibit the lowest food self-sufficiency, with multi-year averages of 9%, 11%, 24%, and 28%, respectively. All are below 30% and show a declining trend, especially in Beijing, where the rate declined rapidly over the past decade, reaching only 5% in 2022.
Figure 9a–c illustrates the spatial distribution of food self-sufficiency in 2010, 2022, and the trend over the entire period, respectively. A “rich-get-richer, poor-get-poorer” dynamic is evident. For instance, Inner Mongolia’s rate increased from 106% in 2010 to 230% in 2022, Xinjiang’s from 124% to 186%, and Gansu’s from 100% to 122%. Conversely, Beijing’s rate fell from 18% to 5%, Zhejiang’s from 37% to 19%, and Guangdong’s from 30% to 21%.
To categorize food security transitions from 2010 to 2022, provinces were classified into the following six categories, self-sufficient, not self-sufficient, not self-sufficient to self-sufficient, and self-sufficient to not self-sufficient, including two trend-based categories, trend increase and trend decrease. Transitions from not self-sufficient to self-sufficient were all classified as trend increase, while the reverse transitions were classified as trend decrease. Figure 9d presents these classifications results.
Red and yellow areas (19 provinces, 61% of the total) represent those not self-sufficient. These provinces are spatially contiguous and primarily located along China’s southern coast and border, as well as some central regions. Among them, only Tianjin, Jiangsu, Tibet, and Yunnan exhibit increasing trends (yellow); the rest show declines (red), indicating growing reliance on imports or inter-provincial trade. Blue and cyan areas (eight provinces, 26%) represent provinces consistently self-sufficient, mostly located in northern and central China (e.g., Henan, Hunan, Anhui). Six of these show improving trends (Blue), while Henan and Jilin show declines (Cyan). Green areas (Shanxi and Liaoning) have transitioned from not self-sufficient to self-sufficient. Shanxi increased from 99% in 2010 to 113% in 2022, whilst Liaoning increased from 91% to 115%, signifying improved food security. Purple areas (Hunan and Jiangxi) transitioned from self-sufficient to not self-sufficient. Hunan fell from 102% to 89%, and Jiangxi from 108% to 91%, indicating a reversal in food security status.

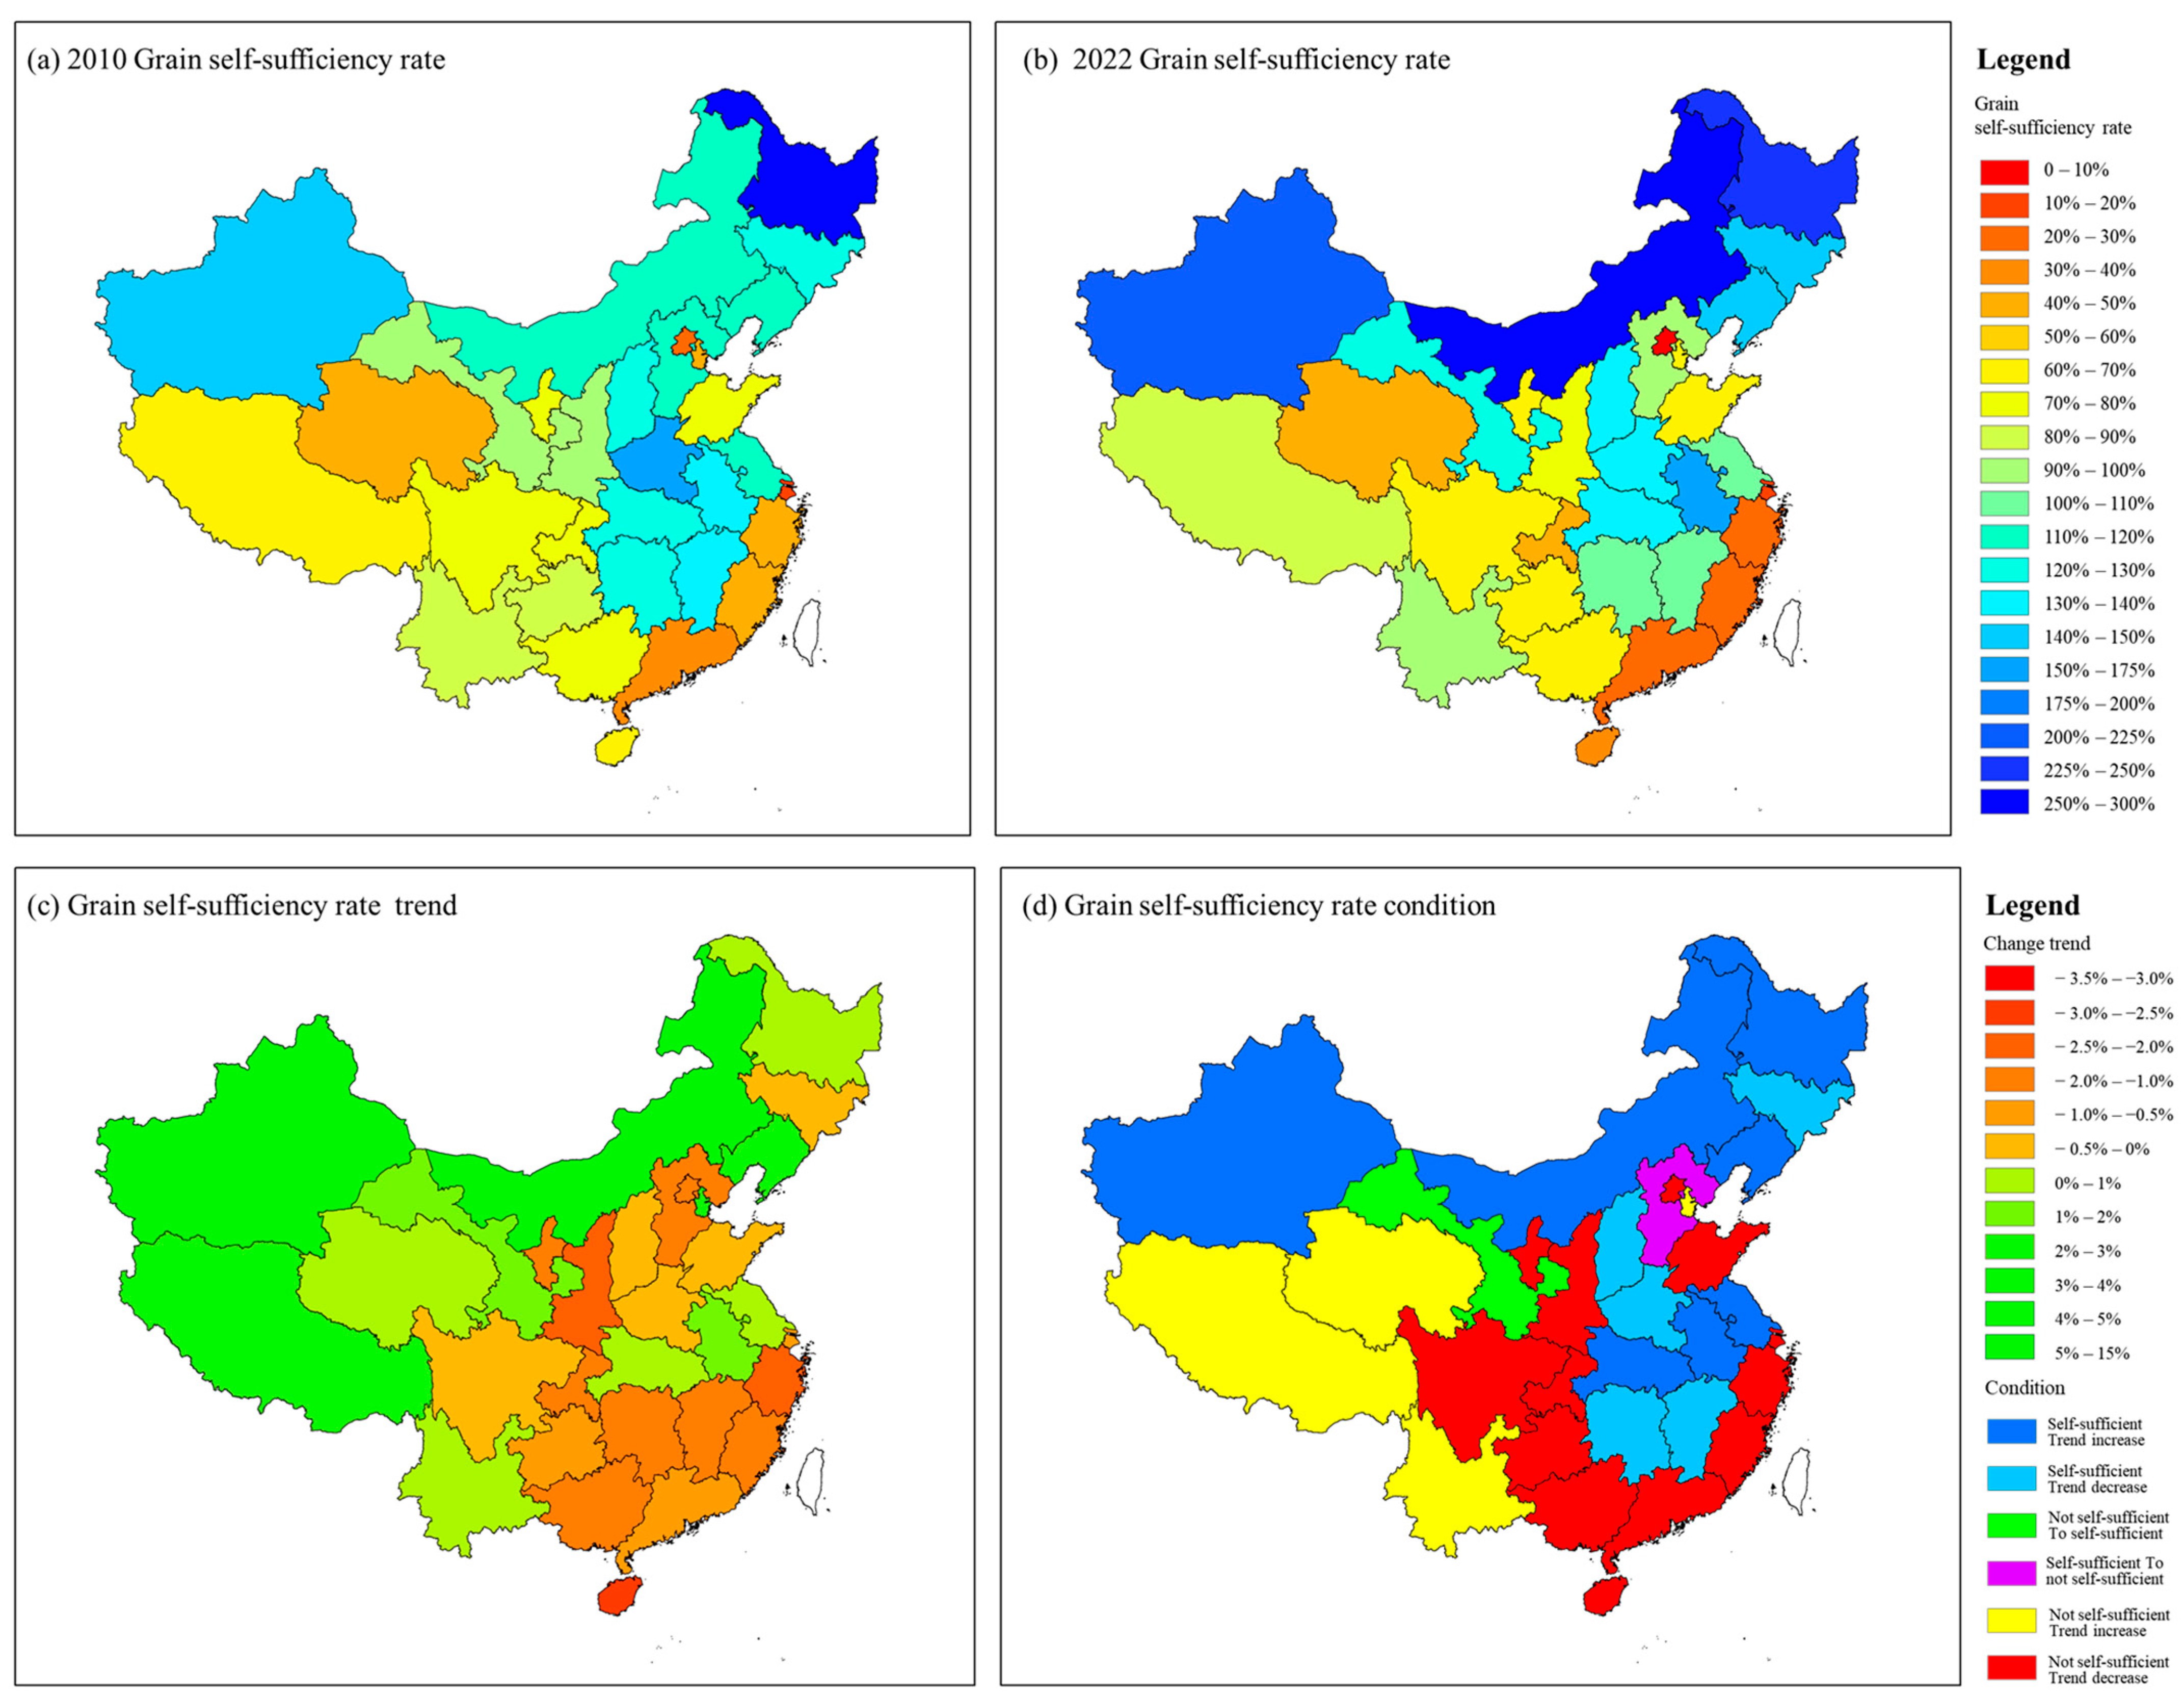
3.3.2. Spatiotemporal Dynamics of Grain Self-Sufficiency Rate

Figure 10 presents the annual changes in grain self-sufficiency rates for 31 provinces from 2010 to 2022. Overall, grain and food self-sufficiency trends are broadly consistent; however, discrepancies exist. While most provinces exhibit lower food self-sufficiency than grain, four provinces, Chongqing, Guizhou, Gansu, and Qinghai, show the opposite. In particular, Qinghai has an average grain self-sufficiency rate of only 46%, 14% lower than its food self-sufficiency rate, due to the high proportion of tuber crops in total production (over 25% in 2022). Seven provinces, Inner Mongolia, Liaoning, Jilin, Heilongjiang, Anhui, Henan, and Xinjiang, have average grain self-sufficiency rates at least 25% higher than food self-sufficiency, with grain self-sufficiency exceeding 130% and food self-sufficiency above 110%, indicating robust food security. Heilongjiang leads with the highest grain self-sufficiency rate, averaging 297%, highlighting its role as a key grain-exporting province.
Figure 11a–c shows the spatial distribution of grain self-sufficiency in 2010, 2022, and the overall trend. A declining trend is observed in 61% of provinces, while 31% exhibit increases. Inner Mongolia, Tianjin, and Xinjiang show the greatest improvements, with Inner Mongolia’s rate more than doubling and Tianjin and Xinjiang increasing by over 50%. In contrast, Beijing and Zhejiang have experienced sharp declines, with 2022 levels below 50% of their 2010 values. Beijing’s 2022 rate is only 30% of the 2010 level.
Figure 11d categorizes provinces based on grain self-sufficiency status. Red and yellow represent seventeen not self-sufficient provinces, two fewer than for food self-sufficient (Jiangsu and Hebei are now self-sufficient in grain). Among these, only Tianjin, Qinghai, Tibet, and Yunnan show increasing trends (yellow); the rest are declining (red). Blue and cyan denote twelve consistently grain self-sufficient provinces, five more than for food self-sufficient (including Liaoning, Jiangsu, Hunan, Jiangxi, and Shanxi). Gansu, however, no longer meets the threshold. Among these twelve provinces, seven show increasing trends (blue), while Jilin, Shanxi, Henan, Hunan, and Jiangxi are declining (cyan). Green represents provinces transitioning to self-sufficiency, seen only for Gansu which improved from 98% in 2010 to 122% in 2022. Purple represents provinces transitioning to not self-sufficiency, seen only for Hebei which declined from 115% in 2010 to 95% in 2022, losing its self-sufficient status.

4. Discussion

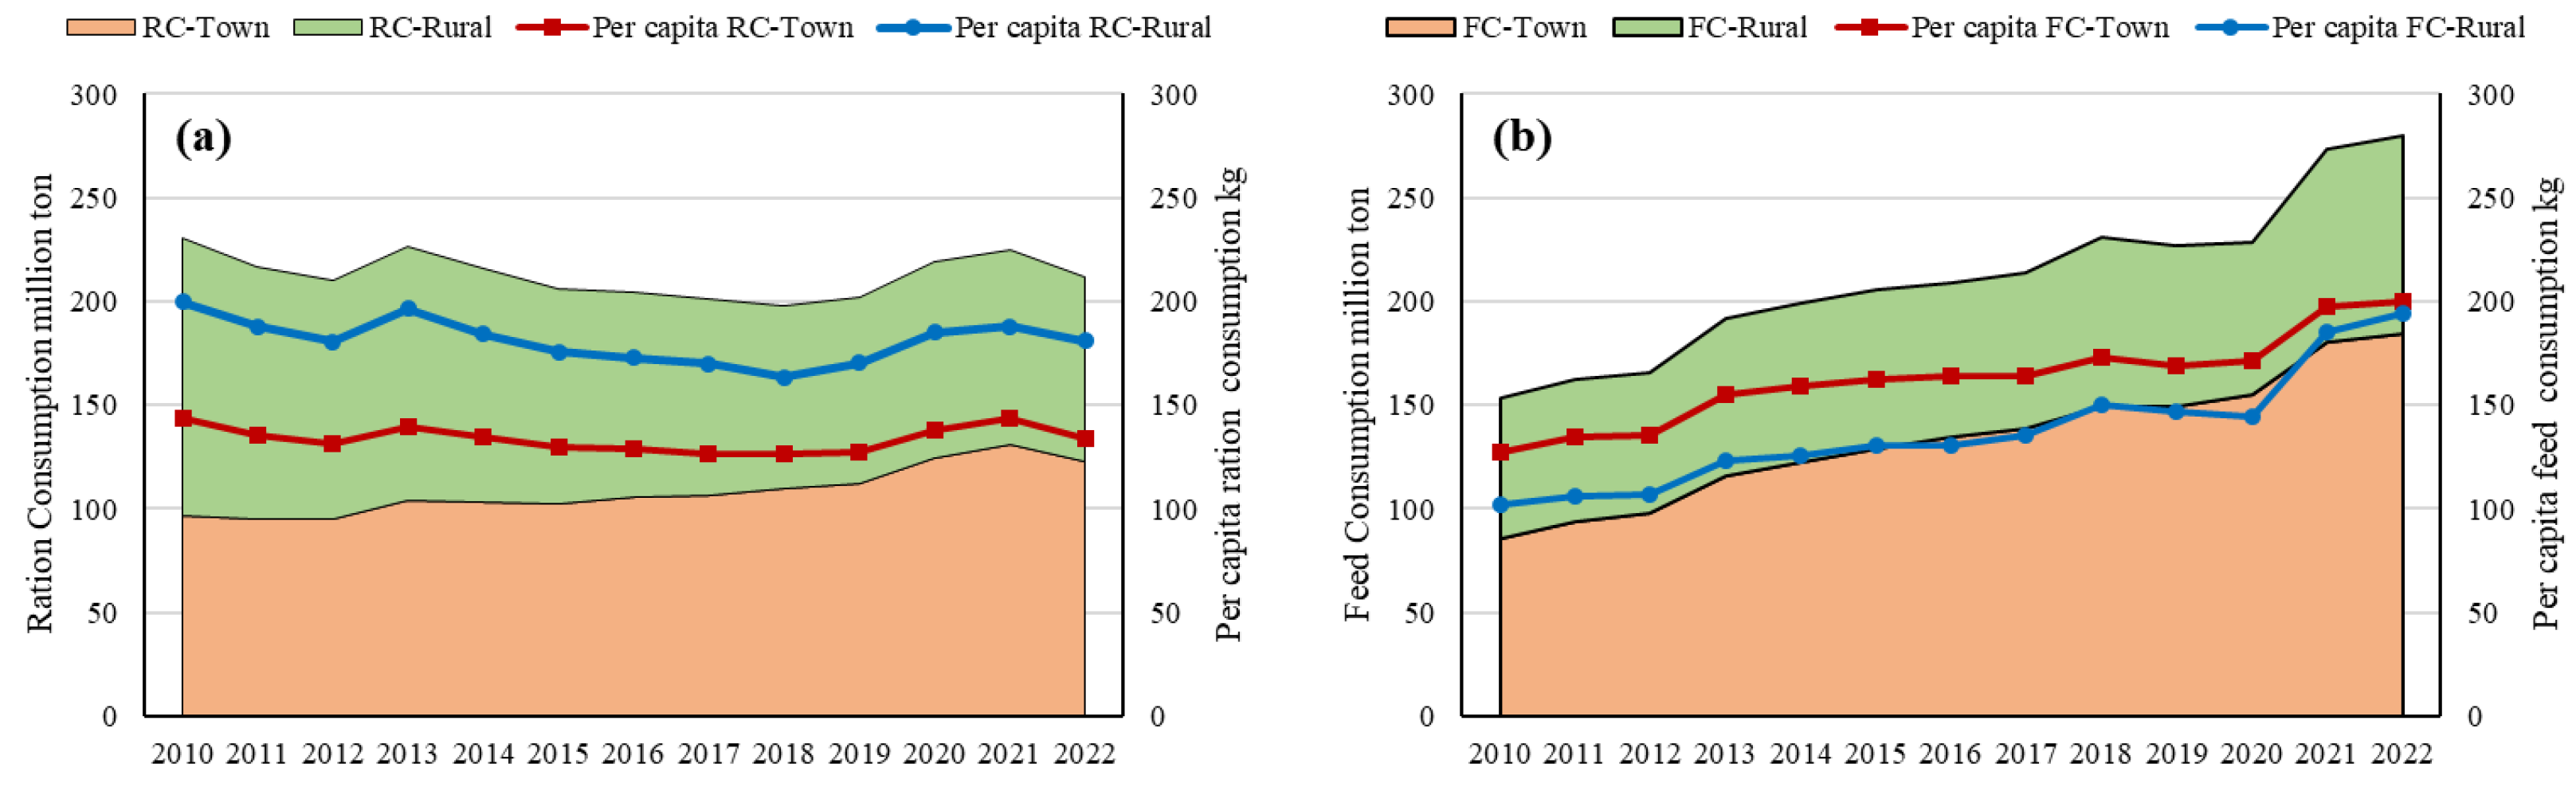
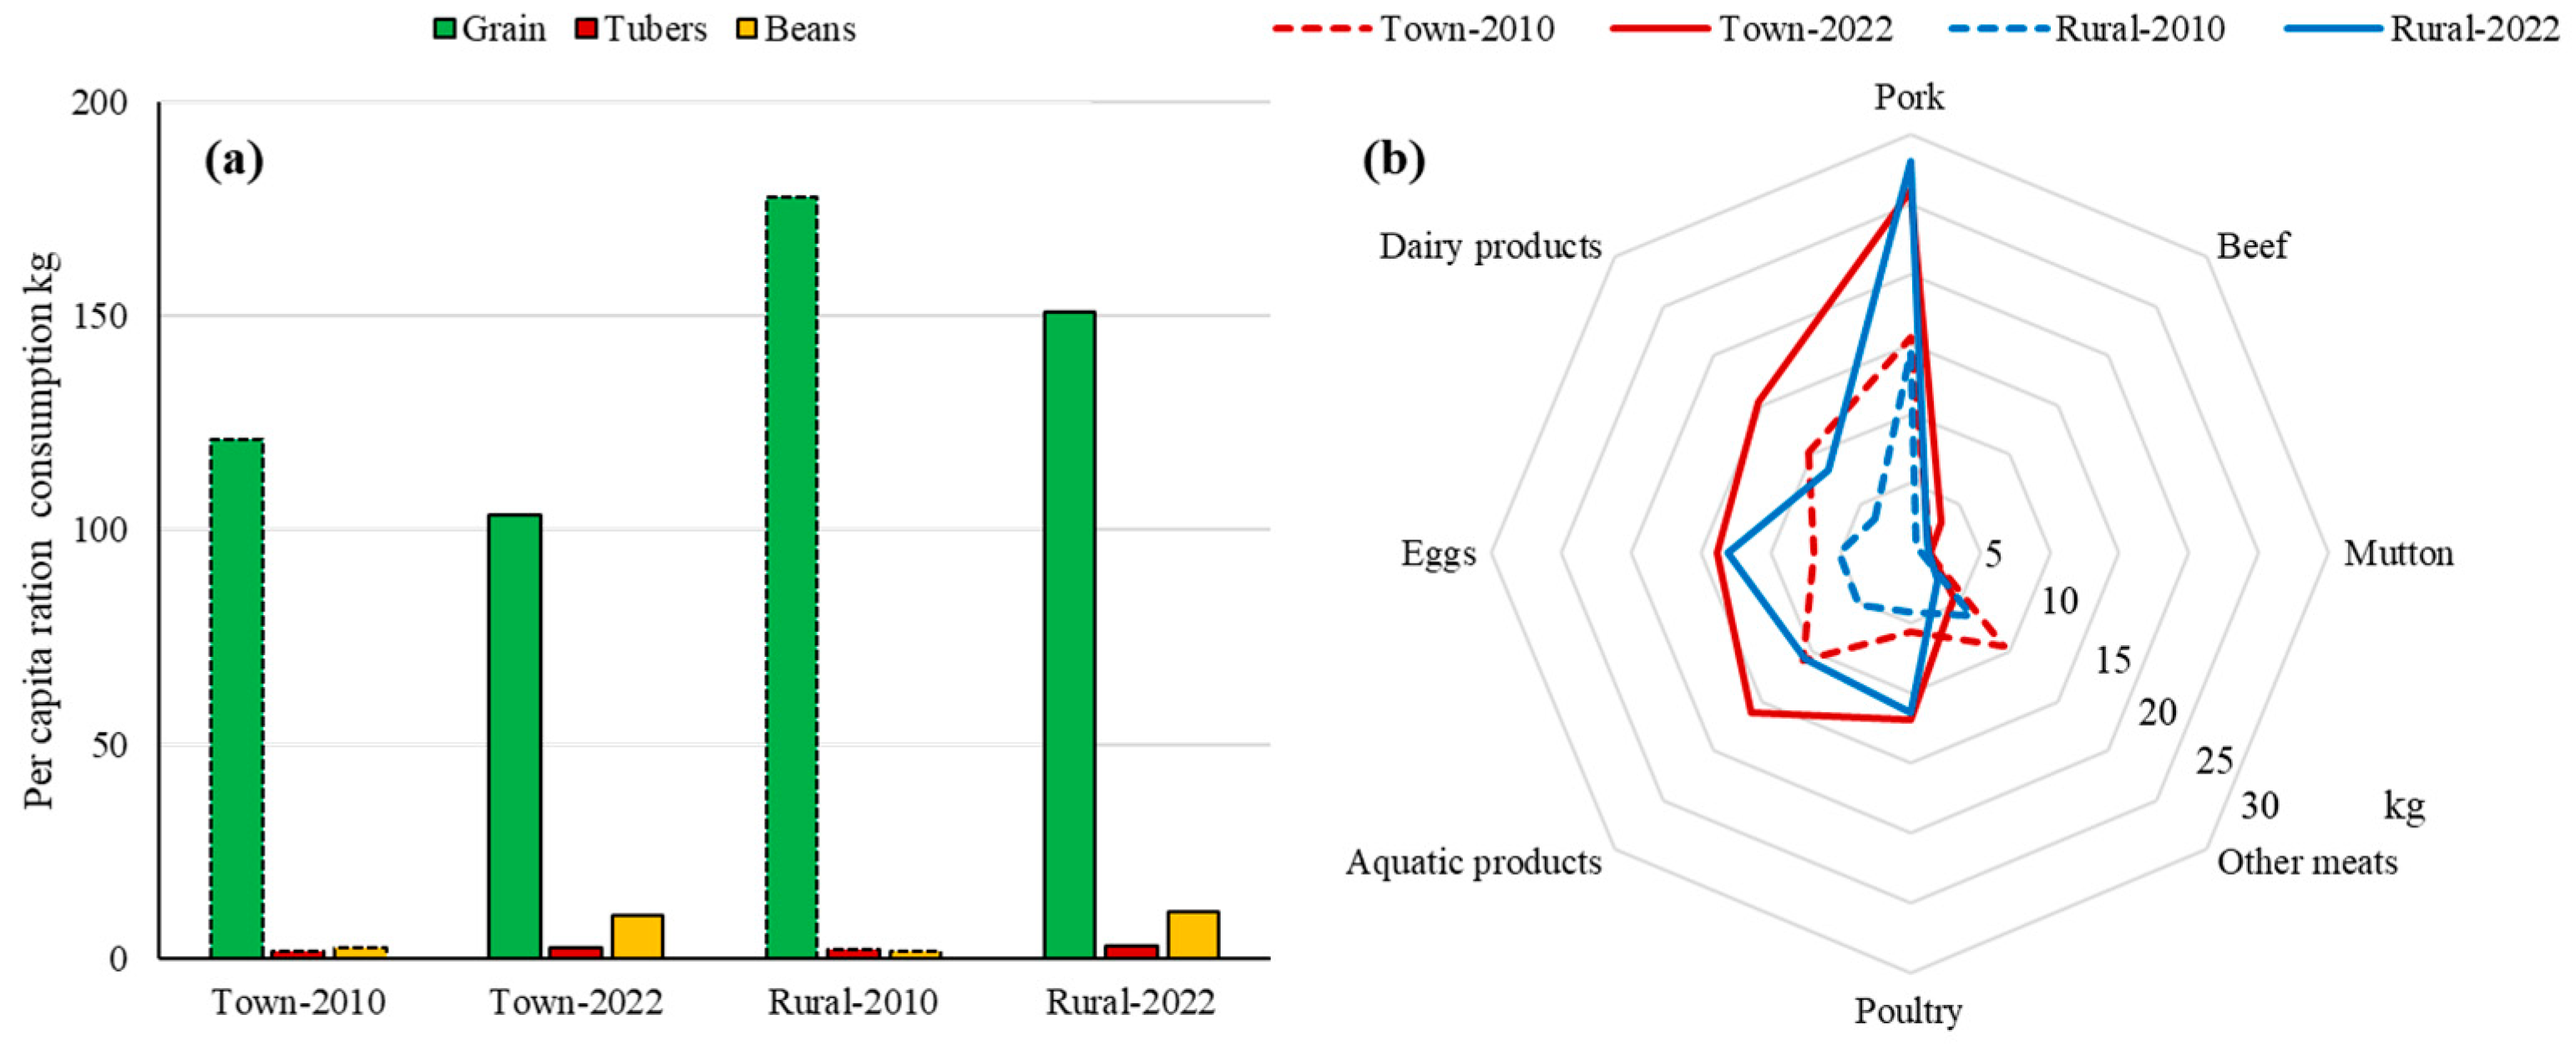
4.1. Urban–Rural Disparities and Their Impact on Food Security

Ration and feed consumption together account for approximately 60% of total food demand. The processes of economic development and urbanization have led to divergent food consumption trends between urban and rural areas, subsequently influencing overall food security. The changes and structural patterns in ration consumption (RC) among urban and rural populations are illustrated in Figure 12a and Figure 13a. In terms of per capita food consumption, urban consumption has shown a fluctuating trend. As depicted in Figure 13a, although urban per capita grain consumption has declined over the past decade, the increase in the consumption of tubers and beans has partially offset this reduction, resulting in a relatively stable overall per capita food intake. In contrast, rural per capita consumption has exhibited a clear downward trend, primarily because the decline in grain consumption has exceeded the increase in tubers and beans. In terms of total ration consumption, urban ration consumption has shown a steady increase, with an average annual growth of approximately 2.8 million tons. This growth is mainly driven by the rapid increase in the urban population. On the other hand, rural ration consumption has experienced a sharp decline, decreasing by about 3.6 million tons per year, owing to both a shrinking rural population and reduced per capita food consumption. Overall, ration consumption has shown a slight downward trend.
The dynamics and structural changes in feed consumption (FC) for urban and rural populations revealed in Figure 12b and Figure 13b. In terms of per capita feed consumption for meat, eggs, and dairy products, both urban and rural areas have exhibited a rising trend, with rural areas experiencing faster growth. By 2022, per capita feed consumption in rural areas had nearly converged with urban levels. As seen in Figure 13b, per capita consumption of meat, eggs, and dairy in both urban and rural areas has increased significantly since 2010. In urban areas, consumption of pork, beef, poultry, and eggs has increased by more than 65%, while rural areas, starting from a lower base, have seen increases exceeding 95%. In terms of total feed consumption, both urban and rural feed consumption have risen substantially. However, due to urbanization and rising per capita demand, urban feed consumption has increased more rapidly, with an average annual growth exceeding 7.8 million tons. Despite fewer rural residents, higher per capita demand has raised rural feed consumption by about 1.7 million tons per year.

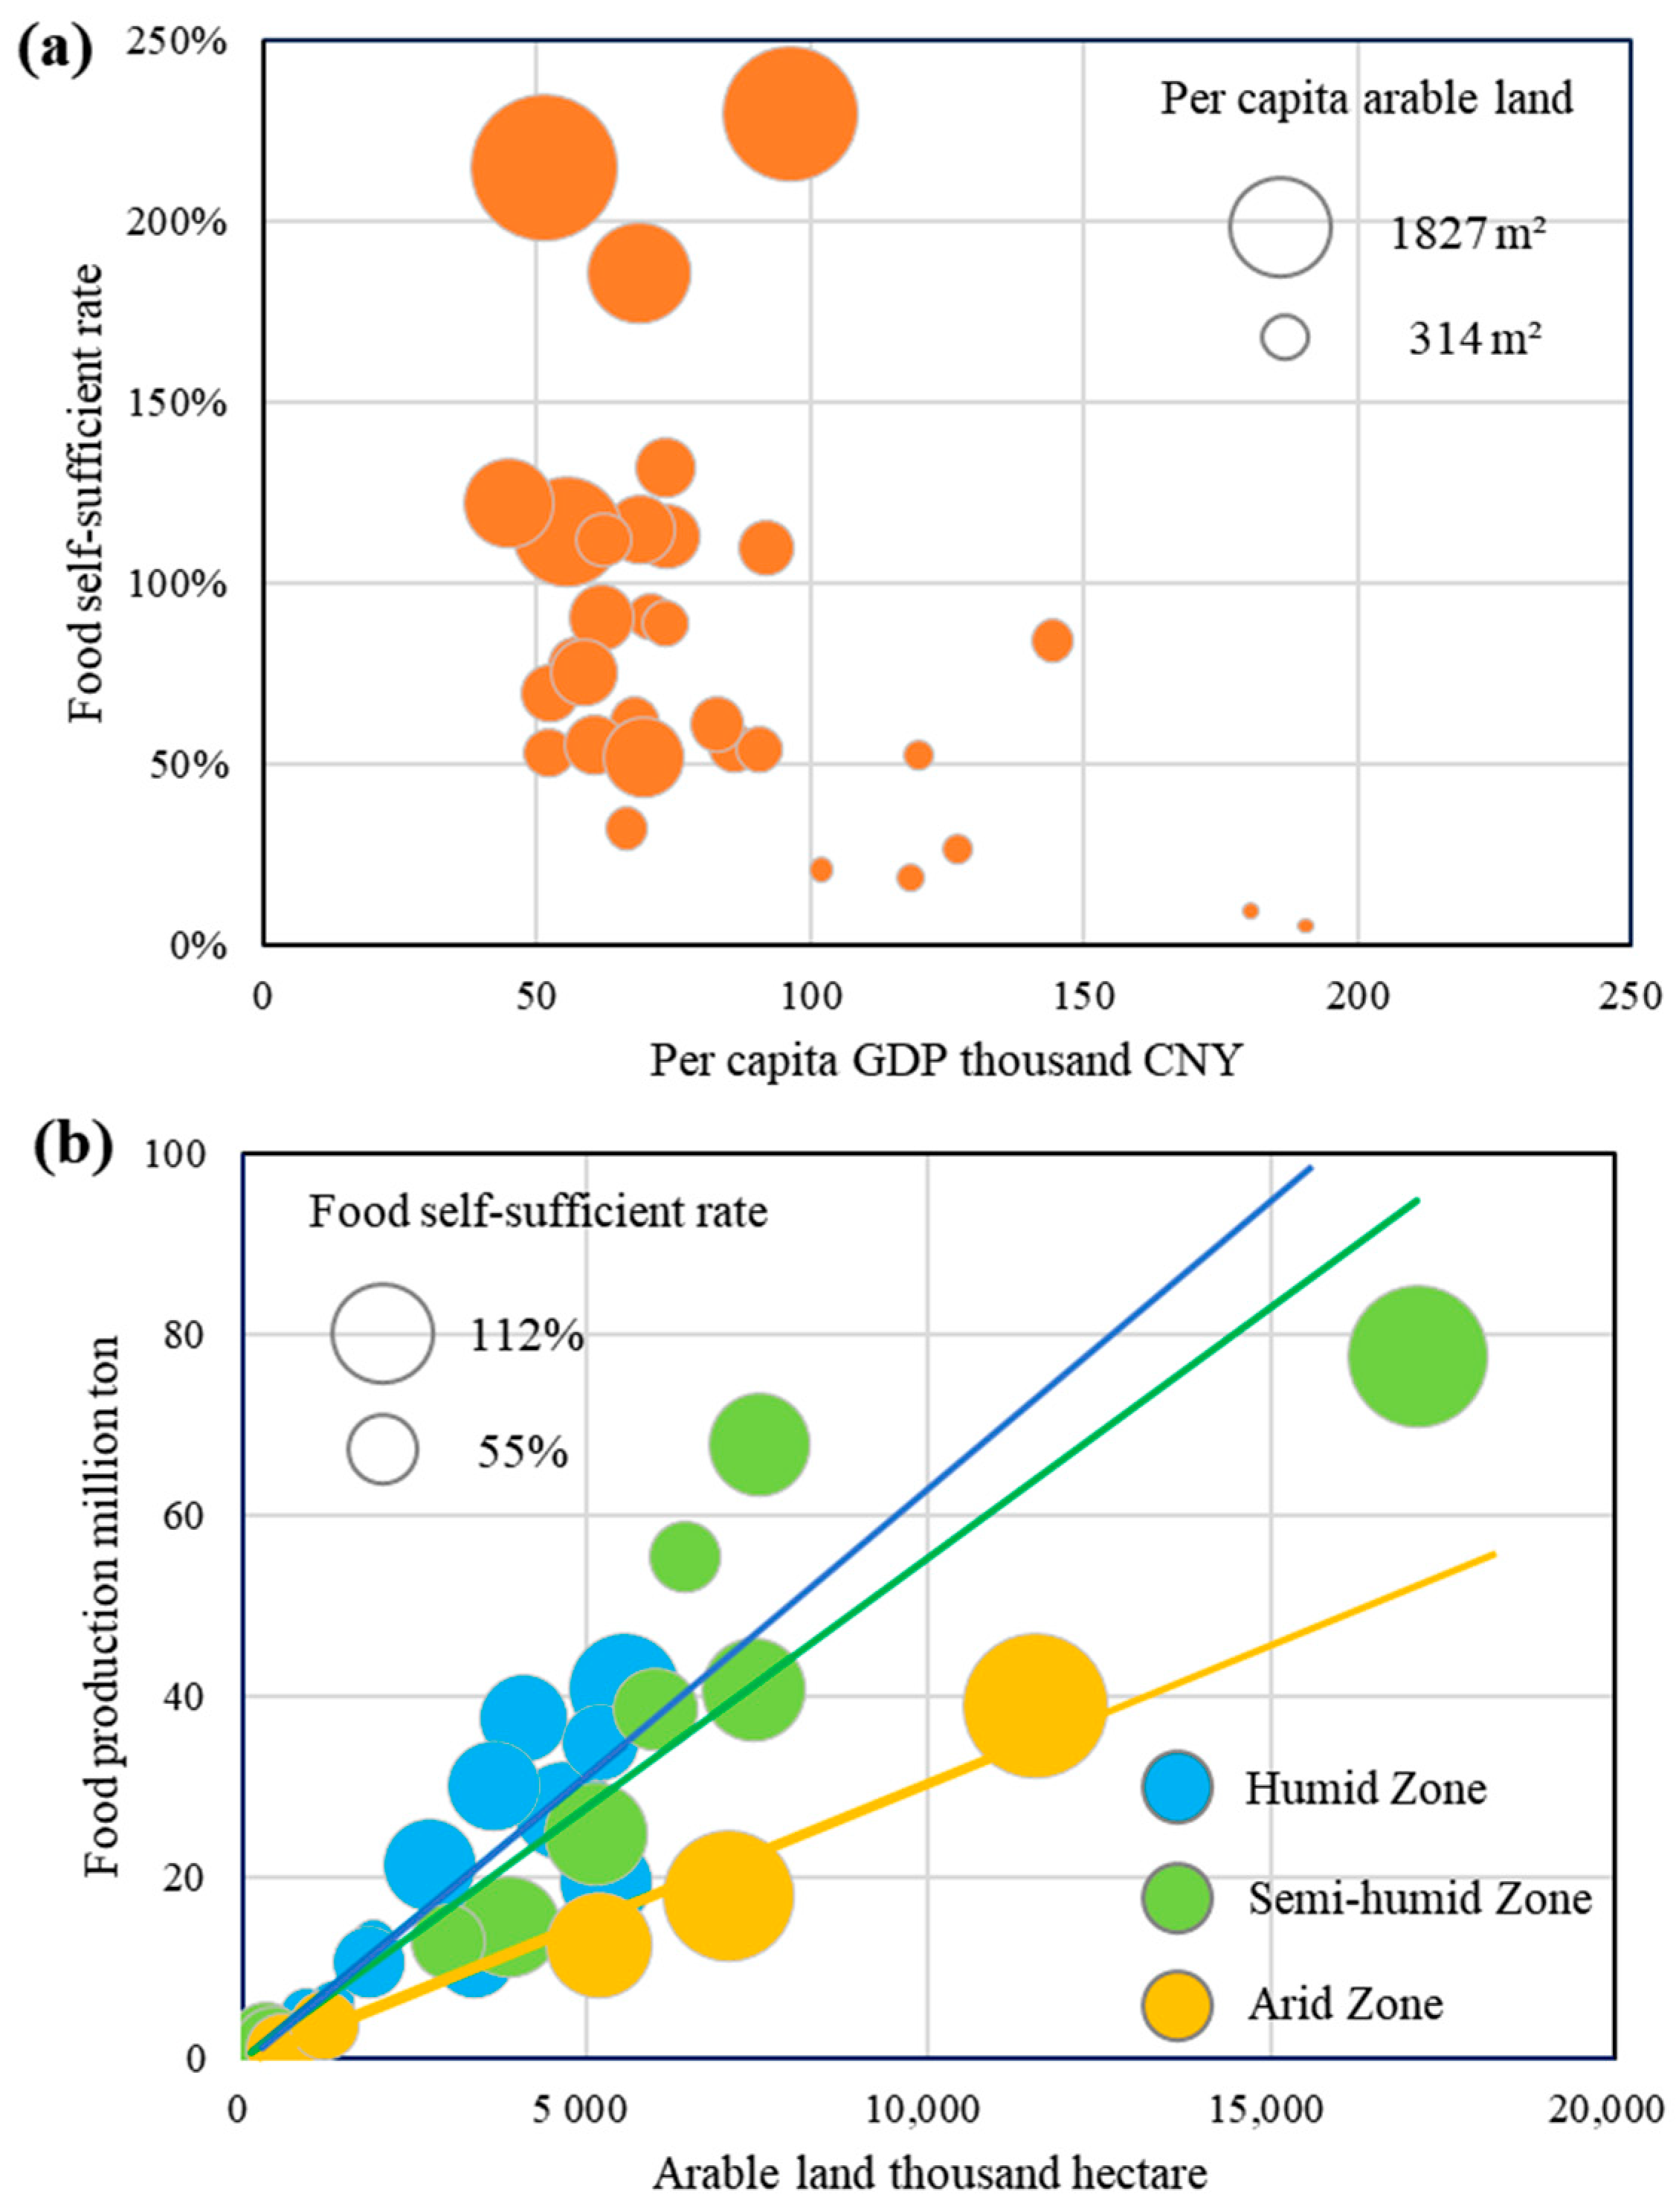
4.2. Spatial Inequality in Food Security

Based on the findings in Section 3.3, significant spatial disparities exist in food self-sufficiency across China. In general, northern provinces exhibit higher self-sufficiency rates, while many southern provinces struggle to meet their own food needs. Given that southern provinces typically have stronger economies, this study explores whether there is a relationship between economic prosperity and food self-sufficiency, using 2022 per capita GDP as a key indicator. Figure 14a reveals a negative correlation between per capita GDP and food self-sufficiency. Provinces with per capita GDP above CNY 100,000 tend to have self-sufficiency rates below 100%. This aligns with previous studies and reflects the effects of economic restructuring and regional policy mandates. On the one hand, industrialization, urbanization, and the expansion of service sectors have redirected land and labor resources from agriculture to high-value-added industries, reducing the space available for food production. On the other hand, government policy has divided regions into “main grain production zones,” “main consumption zones,” and “balanced zones,” encouraging economically developed provinces to focus on economic functions while shifting food production responsibilities to major production areas. The size of the dots in Figure 14a represents per capita arable land, further illustrating that more developed regions tend to have limited agricultural land, indirectly confirming the squeeze on land resources for food production.
Considering that land and precipitation are critical to agriculture, this study also analyzes the relationships among arable land area, precipitation levels, food production, and self-sufficiency across provinces (Figure 14b). Precipitation zones are defined based on long-term averages into the following: humid zone (p ≥ 800 mm), semi-humid zone (400 mm ≤ p < 800 mm), and arid zone (p < 400 mm). The slope of the fitted lines in Figure 14b represents food production efficiency per unit of arable land in each zone. The humid zone, comprising 48% of the provinces, has the highest production efficiency, contributing 40% of national output with only 35% of arable land, but these provinces tend to have small land areas (<6 million hectares) and low self-sufficiency rates. The semi-humid zone accounts for 35% of provinces and contributes 49% of national output from 45% of the land, with slightly lower efficiency than the humid zone. The arid zone includes only five provinces but holds 20% of China’s arable land; however, due to limited rainfall, its productivity is the lowest, contributing only 11% of total food production.

4.3. Policy Recommendations

(1) Food Waste Remains a Serious Issue
The flow–consumption statistics method proposed in this study not only enables accurate estimation of spatial food self-sufficiency but also facilitates the quantification of food loss and waste. Our findings indicate that food loss and waste in China account for approximately 22.8% of total food consumption, underscoring the severity of the issue. Gatto et al. [53] found that global food losses and waste increased by 25% from 2004 to 2014, further undermining food security. While zero food waste is unfeasible, minimizing losses is critical to improving self-sufficiency. Given China’s urban–rural disparities, shifting consumption patterns, and diverse agricultural systems, it is recommended to prioritize waste reduction in key sectors such as restaurants, school cafeterias, and workplace canteens through standardized “measured portion” and “demand-based serving” practices. On the supply side, post-harvest loss reduction should be promoted via financial subsidies and technological support. Additionally, public awareness campaigns, especially targeting youth, should encourage food-saving behaviors and promote a culture of rational, sustainable consumption.
(2) Clarification of Food Security Indicators
This study distinguishes between food self-sufficiency and grain self-sufficiency when assessing national food security. While China’s average food self-sufficiency rate has fallen below 90% in recent years, dropping to 82% by 2022, grain self-sufficiency has remained at safer levels, averaging 101% over 2010–2022 and staying above 90% even in recent years. Unlike grain self-sufficiency, the broader food self-sufficiency metric includes beans and tubers. However, China has become the world’s largest soybean importer [21], with over 90 million tons imported in 2022, mainly for oil processing and feed protein production [42]. Since rice and wheat remain the primary ration, including soybeans and tubers in food self-sufficiency calculations may overstate China’s food security risks. Therefore, food and grain self-sufficiency should be evaluated separately to provide an accurate picture of national food security.
(3) Technology-Driven Agricultural Innovation
Agriculture 4.0, precision farming, bio-inputs, and digital management tools are gradually enhancing the productivity and sustainability of the food system. For example, microbial fertilizers and biopesticides can reduce dependence on chemical inputs, improve soil health, and increase crop yields. In regions with weak technological foundations or fragile ecosystems, promoting appropriate technologies can help address production gaps and strengthen local self-sufficiency. To accelerate agricultural modernization, we recommend the use of fiscal subsidies, investment in digital infrastructure, and the expansion of agricultural extension services to improve access to and adoption of advanced technologies. At the same time, scientific evaluation mechanisms should be established to ensure that promoted technologies are both cost-effective and ecologically sustainable. Central and local governments should tailor technology dissemination strategies to local crop structures and resource conditions, thereby aligning technological advancement with food security objectives.

4.4. Limitations and Future Research

This study introduces the flow–consumption statistics (FCS) method, which enhances the structural completeness and flexibility of traditional approaches to estimating food self-sufficiency. It enables dynamic analysis at both national and provincial scales in China. However, the method has certain limitations that warrant further improvement in future research.
First, although the model accounts for out-of-home food consumption by adjusting per capita food intake using fixed coefficients—14% for urban residents and 10% for rural residents—based on empirical data from prior studies [39,40,49], these parameters may no longer reflect current patterns. With increasing urbanization and changing lifestyles, recent studies [54] report that the share of food consumed away from home in urban areas has reached or exceeded 18%, with notable variations across regions and income groups. Thus, although out-of-home consumption is incorporated into the model, the use of static coefficients may still underestimate actual food demand, especially in economically developed and highly urbanized provinces. Future research could incorporate region-specific and time-varying coefficients based on household surveys and catering industry statistics to improve the model’s sensitivity and adaptability to changing consumption behavior.
Second, while the FCS method improves overall demand estimation by introducing a dynamically calibrated food loss and waste coefficient ( γ F ), it does not disaggregate losses across the food supply chain stages. This is a methodological limitation as the causes, scale, and mitigation strategies of losses vary substantially by stage. For instance, production losses are typically driven by climatic and agronomic conditions, while consumption stage waste is influenced by dietary habits and public awareness [55]. Aggregating all losses into a single coefficient may obscure structural differences and reduce the model’s utility for policy-specific interventions. Future versions of the model could incorporate stage-specific loss rates based on national surveys or datasets from organizations such as the FAO, thereby enhancing its diagnostic detail and policy relevance.
Third, China’s future food self-sufficiency capacity—both nationally and provincially—will increasingly face dual challenges posed by climate change and uncertainties in international trade. Climate change is expected to reshape precipitation patterns, heat accumulation, and the frequency of extreme weather events, thereby affecting the spatial distribution and stability of agricultural yields. For example, water-stressed regions like the North China Plain may become more vulnerable to production risks, while resource-rich northeastern provinces could emerge as critical grain expansion zones. This potential spatial shift echoes the fundamental logic of the Von Thünen model, which relates crop location to production costs and market proximity. As Norton [56] emphasized, however, land use patterns are not static but evolve under complex socioeconomic dynamics. The FCS framework could be expanded by integrating climate sensitivity indicators and agroecological zoning to assess how provincial self-sufficiency rates might evolve under future climate scenarios. Moreover, rising geopolitical risks, trade restrictions, and price volatility further underscore the importance of local production resilience. For critical commodities like soybeans and feed grains, external supply shocks could disrupt entire livestock and food processing chains. Therefore, future extensions of the FCS method could incorporate trade exposure indices and strategic reserve data to simulate risk scenarios and support policy response planning.
Fourth, this study focuses primarily on quantitative food self-sufficiency as the core indicator, which effectively reflects the balance between supply and demand. However, it falls short in addressing critical dimensions such as nutritional adequacy, trade dependency, and environmental externalities. The self-sufficiency rate does not capture the nutritional suitability of different food compositions, nor does it consider the resource intensity or input–output dependencies resulting from international trade. Future research could extend the FCS framework by incorporating indicators such as dietary diversity, carbon footprint accounting, and nutrition accessibility. This would enable a shift from purely quantitative self-sufficiency assessments toward a more integrated evaluation of nutritional and food security.
Additionally, the current model relies on historical trends for parameter calibration and does not incorporate price mechanisms or elasticity variables. As a result, it lacks the capacity to dynamically capture the impacts of price fluctuations on consumption structures or regional substitution patterns. Furthermore, unpredictable shocks—such as extreme weather events, pandemics, and geopolitical trade disruptions—can cause sudden disturbances in the food system that trend-based models are ill-equipped to reflect. The effectiveness of policy interventions is also influenced by implementation mechanisms, regional disparities, and behavioral responses, which are difficult to comprehensively quantify in the current framework. Future studies could integrate price elasticity modeling, uncertainty analysis, behavioral adaptation, and scenario-based policy simulations to enhance the model’s responsiveness to shocks and improve its practical and forward-looking utility.

5. Conclusions

This study improves upon traditional methods for calculating food demand by proposing a new approach that dynamically accounts for food losses and waste. Based on this methodology, this study assessed food self-sufficiency levels and analyzed the spatial and temporal evolution of food security patterns in China. The main conclusions are as follows:
(1) By integrating the strengths of the flow statistics and consumption statistics methods, this study proposed a novel flow–consumption statistics method for food demand estimation. This approach addresses two key limitations of existing methods, the tendency of consumption-based statistics to overestimate food self-sufficiency and the difficulty of spatial downscaling in flow-based statistics, and also reveals that China’s overall food loss and waste rate is approximately 22.8%.
(2) From a national perspective, China’s food self-sufficiency rate peaked at 98% in 2014, approaching full self-sufficiency. However, it has since experienced a rapid decline, falling to approximately 82% by 2022, raising concerns about long-term food security. In contrast, the grain self-sufficiency rate shows a similar trend but maintains a significantly higher level overall. Between 2010 and 2022, the average grain self-sufficiency rate was 101%, with a low point of 92% in 2022, suggesting that grain security in China remains within an acceptable and safe threshold.
(3) At the provincial level, from 2010 to 2022, 19 provinces consistently failed to achieve food self-sufficiency. Among them, only Tianjin, Jiangsu, Tibet, and Yunnan exhibited an increasing trend in their food self-sufficiency rates. In contrast, eight provinces maintained food self-sufficiency throughout the period, while Henan and Jilin showed a decreasing trend. Shanxi and Liaoning successfully transitioned from being not self-sufficient to self-sufficient provinces, whereas Hunan and Jiangxi moved in the opposite direction, shifting from fully self-sufficient to not self-sufficient.

Author Contributions

Conceptualization, H.C.; Data curation, H.R. and Z.H.; Formal analysis, R.L.; Funding acquisition, H.C.; Investigation, W.L.; Methodology, Y.Z., Y.C. and J.Y.; Resources, Y.C.; Supervision, Y.Z. and J.Y.; Writing—original draft, H.C.; Writing—review and editing, H.C. and J.Y. All authors have read and agreed to the published version of the manuscript.

Funding

This research was funded by the National Natural Science Foundation of China (Grant No. 52409041, 52379021), the Natural Science Foundation of Tianjin (Grant No. 24JCQNJC01320), the Open Research Fund of State Key Laboratory of Water Cycle and Water Security in River Basin, (IWHR) (Grant No. IWHR-SKL-KF202412), the Open Research Fund Program of the State Key Laboratory of Hydroscience and Engineering (Grant No. sklhse-KF-2025-B-02), and the Open Research Fund of Key Laboratory of Water Safety for Beijing–Tianjin–Hebei Region of Ministry of Water Resources (Grant No. IWHR-JJJ-202401).

Institutional Review Board Statement

Not applicable.

Informed Consent Statement

Not applicable.

Data Availability Statement

Data will be made available on request.

Acknowledgments

We are so grateful to the anonymous reviewers and editors for their suggestions.

Conflicts of Interest

The authors declare no conflicts of interest.

Appendix A

Table A1. Data sources and categories.
Data TypeSpecific CategoriesTemporal/Spatial ScaleSource
Food productionFood, grain, rice, wheat, maize, legumes, and tubers2010–2022, national and provincialChina Statistical Yearbook (2010–2022)
PopulationUrban population and rural population2010–2022, national and provincialChina Statistical Yearbook (2010–2022)
Food trade and stockWheat, rice, maize, and soybean2010–2022, nationalFAO Statistical Database (https://www.fao.org/faostat/en/#home, accessed on 20 May 2025)
Food consumptionFood, grain, non-cereal grains, tubers, and legumes2010–2022, national and provincialChina Statistical Yearbook, Provincial Statistical Yearbooks (2010–2022)
Meat and animal productsTotal meat, pork, beef, mutton, other meats, poultry, aquatic products, eggs, and dairy2010–2022, national and provincialChina Statistical Yearbook, Provincial Statistical Yearbooks (2010–2022)
Food for industrial useLiquor, beer, ethanol, starch, and MSG2010–2022, national and provincialChina Light Industry Yearbook (2010–2022)
Sown areaFood, grain, rice, wheat, maize, legumes, and tubers2010–2022, national and provincialChina Statistical Yearbook (2010–2022)
Table A2. The food forage ingredient of livestock and poultry (%).
Livestock and PoultryWheatCornSoybeansRicePotato
Beef869887
Mutton13601377
Pork106510510
Dairy products8621587
Poultry1060101010
Table A3. Industrial food conversion factors.
Industrial UseLiquorBeerEthanolStarchMSG
Conversion Factor2.30.1731.65
Table A4. Food type shares of industrial food consumption.
Food TypeRiceWheatCornTubersSoybeans
Share (%)14.0415.2345.797.414.4

References

  1. McCarthy, U.; Uysal, I.; Badia-Melis, R.; Mercier, S.; O’Donnell, C.; Ktenioudaki, A. Global food security–Issues, challenges and technological solutions. Trends Food Sci. Technol. 2018, 77, 11–20. [Google Scholar] [CrossRef]
  2. Basset, C. Soil security: The cornerstone of national security in an era of global disruptions. Soil Secur. 2024, 16, 100154. [Google Scholar] [CrossRef]
  3. SDG Fund. Sustainable Development Goals. Available online: https://www.un.org/sustainabledevelopment/inequality (accessed on 8 May 2025).
  4. Food and Agriculture Organization of the United Nations (FAO). The State of Food Security and Nutrition in the World (SOFI) Report 2023; FAO: Rome, Italy, 2023. [Google Scholar]
  5. Krishnamurthy, R.P.K.; Fisher, J.B.; Choularton, R.J.; Kareiva, P.M. Anticipating drought-related food security changes. Nat. Sustain. 2022, 5, 956–964. [Google Scholar] [CrossRef]
  6. Reed, C.; Anderson, W.; Kruczkiewicz, A.; Nakamura, J.; Gallo, D.; Seager, R.; McDermid, S.S. The impact of flooding on food security across Africa. Proc. Natl. Acad. Sci. USA 2022, 119, e2119399119. [Google Scholar] [CrossRef]
  7. Molotoks, A.; Smith, P.; Dawson, T.P. Impacts of land use, population, and climate change on global food security. Food Energy Secur. 2021, 10, e261. [Google Scholar] [CrossRef]
  8. Abbas, S.; Haider, A.; Kousar, S.; Lu, H.; Lu, S.; Liu, F.; Li, H.; Miao, C.; Feng, W.; Ahamad, M.I.; et al. Climate variability, population growth, and globalization impacting food security in Pakistan. Sci. Rep. 2025, 15, 4225. [Google Scholar] [CrossRef]
  9. Ben Hassen, T.; El Bilali, H. Impacts of the Russia-Ukraine war on global food security: Towards more sustainable and resilient food systems? Foods 2022, 11, 2301. [Google Scholar] [CrossRef]
  10. Alabi, M.O.; Ngwenyama, O. Food security and disruptions of the global food supply chains during COVID-19: Building smarter food supply chains for post COVID-19 era. Br. Food J. 2023, 125, 167–185. [Google Scholar] [CrossRef]
  11. Xi, J. Hold High the Great Banner of Socialism with Chinese Characteristics and Strive in Unity for Building a Modern Socialist Country in All Respects: Report to the 20th National Congress of the Communist Party of China; Foreign Languages Press: Beijing, China, 2023. [Google Scholar]
  12. Lee, C.C.; Zeng, M.; Luo, K. The impact of urbanization on food security in China. Int. Rev. Econ. Financ. 2024, 93, 1159–1175. [Google Scholar] [CrossRef]
  13. Liu, Y.; Zhou, Y. Reflections on China’s food security and land use policy under rapid urbanization. Land Use Policy 2021, 109, 105699. [Google Scholar] [CrossRef]
  14. Zhu, Y.; Wang, Z.; Zhu, X. New reflections on food security and land use strategies based on the evolution of Chinese dietary patterns. Land Use Policy 2023, 126, 106520. [Google Scholar] [CrossRef]
  15. Li, S.; Kallas, Z.; Rahmani, D. Did the COVID-19 lockdown affect consumers’ sustainable behaviour in food purchasing and consumption in China? Food Control 2022, 132, 108352. [Google Scholar] [CrossRef] [PubMed]
  16. He, G.; Zhao, Y.; Wang, L.; Jiang, S.; Zhu, Y. China’s food security challenge: Effects of food habit changes on requirements for arable land and water. J. Clean. Prod. 2019, 229, 739–750. [Google Scholar] [CrossRef]
  17. Zhu, X.; Zhang, Y.; Zhu, Y.; Li, Y.; Cui, J.; Yu, B. Multidimensional deconstruction and workable solutions for addressing China’s food security issues: From the perspective of sustainable diets. Land Use Policy 2025, 148, 107401. [Google Scholar] [CrossRef]
  18. Liang, X.; Jin, X.; Han, B.; Sun, R.; Xu, W.; Li, H.; He, J.; Li, J. China’s food security situation and key questions in the new era: A perspective of farmland protection. J. Geogr. Sci. 2022, 32, 1001–1019. [Google Scholar] [CrossRef]
  19. Lan, Y.; Xu, B.; Huan, Y.; Guo, J.; Liu, X.; Han, J.; Li, K. Food security and land use under sustainable development goals: Insights from food supply to demand side and limited arable land in China. Foods 2023, 12, 4168. [Google Scholar] [CrossRef]
  20. Kang, M.; Wang, Y.; Zhu, Y.; He, F.; Jiang, S.; Yang, M. Optimizing the structure of food production in China to improve the sustainability of water resources. Sci. Total Environ. 2023, 900, 165750. [Google Scholar] [CrossRef]
  21. Wu, F.; Geng, Y.; Zhang, Y.; Ji, C.; Chen, Y.; Sun, L.; Xie, W.; Ali, T.; Fujita, T. Assessing sustainability of soybean supply in China: Evidence from provincial production and trade data. J. Clean. Prod. 2020, 244, 119006. [Google Scholar] [CrossRef]
  22. Wang, M.; Liu, D.; Wang, Z.; Li, Y. Structural evolution of global soybean trade network and the implications to China. Foods 2023, 12, 1550. [Google Scholar] [CrossRef]
  23. Lu, G.; Miao, Y.; Dong, X.; Dong, Z.; An, H.; Li, X. Strategies for improving food security under the impact of external grain price fluctuations: Evidence from China. Appl. Econ. 2025, 57, 887–903. [Google Scholar] [CrossRef]
  24. Cole, M.B.; Augustin, M.A.; Robertson, M.J.; Manners, J.M. The Science of Food Security. npj Sci. Food 2018, 2, 14. [Google Scholar] [CrossRef] [PubMed]
  25. He, T.; Hu, Y.; Li, F.; Chen, Y.; Zhang, M.; Zheng, Q.; Jin, Y.; Ren, H. Mapping Land- and Offshore-Based Wind Turbines in China in 2023 with Sentinel-2 Satellite Data. Renew. Sustain. Energy Rev. 2025, 214, 115566. [Google Scholar] [CrossRef]
  26. Chang, H.; Zhao, Y.; Cao, Y.; He, G.; Wang, Q.; Liu, R.; Li, W. Evaluating Sustainability of Water–Energy–Food–Ecosystems Nexus in Water-Scarce Regions via Coupled Simulation Model. Agriculture 2025, 15, 1271. [Google Scholar] [CrossRef]
  27. Chung, M.G.; Liu, J. International food trade benefits biodiversity and food security in low-income countries. Nat. Food 2022, 3, 349–355. [Google Scholar] [CrossRef]
  28. Liang, X.; Jin, X.; Xu, X.; Chen, H.; Liu, J.; Yang, X.; Xu, W.; Sun, R.; Han, B.; Zhou, Y. Uncertainty in China’s food self-sufficiency: A dynamic system assessment. Sustain. Prod. Consum. 2023, 40, 135–146. [Google Scholar] [CrossRef]
  29. Beltran-Peña, A.; Rosa, L.; D’Odorico, P. Global food self-sufficiency in the 21st century under sustainable intensification of agriculture. Environ. Res. Lett. 2020, 15, 095004. [Google Scholar] [CrossRef]
  30. Zhang, Z.; Kattel, G.R.; Shang, Y.; Wang, G.; Chuai, X.; Wang, Q.; Cui, X.; Miao, L. Steady decline in food self-sufficiency in Africa from 1961 to 2018. Reg. Environ. Change 2023, 23, 79. [Google Scholar] [CrossRef]
  31. Zhang, J.; Fang, Y.; Zheng, H.; Fan, S.; Du, T. The spatio-temporal evolution of food production and self-sufficiency in China from 1978 to 2020: From the perspective of calories. Foods 2023, 12, 956. [Google Scholar] [CrossRef]
  32. Niu, Y.; Xie, G.; Xiao, Y.; Liu, J.; Wang, Y.; Luo, Q.; Zou, H.; Gan, S.; Qin, K.; Huang, M. Spatiotemporal patterns and determinants of grain self-sufficiency in China. Foods 2021, 10, 747. [Google Scholar] [CrossRef]
  33. Zhang, Y.; Lu, X. A comprehensive evaluation of food security in China and its obstacle factors. Int. J. Environ. Res. Public Health 2022, 20, 451. [Google Scholar] [CrossRef]
  34. Liu, Y.; Zhen, L.; Shao, Q.; Ye, J.; Xie, S. Spatiotemporal Patterns in Production and Consumption of Major Foods in Qinghai, China. Foods 2025, 14, 736. [Google Scholar] [CrossRef] [PubMed]
  35. Xiao, Y.; Zhao, J.; Zhang, Y.; Wang, S. Grain Self-Sufficiency in Guangdong, China: Current Trends and Future Perspectives. Foods 2025, 14, 1126. [Google Scholar] [CrossRef] [PubMed]
  36. Duan, X.; Meng, Q.; Fei, X.; Lin, M.; Xiao, R. The impacts of farmland loss on regional food self-sufficiency in Yangtze River delta urban agglomeration over last two decades. Remote Sens. 2021, 13, 3514. [Google Scholar] [CrossRef]
  37. Herteux, J.; Raeth, C.; Martini, G.; Kraemer, M.; Brunner, A.; Gunkel, L.; Bartke, J. Forecasting Trends in Food Security with Real-Time Data. Commun. Earth Environ. 2024, 5, 611. [Google Scholar] [CrossRef]
  38. Niu, Y.; Xie, G.; Xiao, Y.; Liu, J.; Zou, H.; Qin, K.; Wang, Y.; Huang, M. The Story of Grain Self-Sufficiency: China’s Food Security and Food for Thought. Food Energy Secur. 2022, 11, e344. [Google Scholar] [CrossRef]
  39. Xiao, Y.; Cheng, S.; Xie, G.; Liu, A.; Lu, C.; Wang, Y. The Balance between Supply and Consumption of the Main Types of Grain in China. J. Nat. Resour. 2017, 32, 927–936. (In Chinese) [Google Scholar]
  40. Xu, Y.; Zhao, Y. The Situation of Food Self-Supply and Development Countermeasures in Sichuan Province. J. Agric. 2021, 11, 97. (In Chinese) [Google Scholar]
  41. Meng, Z.D.; Li, G.X. The Spatio-Temporal Evolution of China’s Grain Production and Demand Balance: From the Perspectives of Grain Use and Provincial Level. Res. Agric. Mod. 2020, 41, 928–936. (In Chinese) [Google Scholar]
  42. Yang, M.; Pei, Y.; Li, X. Study on Grain Self-Sufficiency Rate in China: An Analysis of Grain, Cereal Grain and Edible Grain. J. Nat. Resour. 2019, 34, 881–889. (In Chinese) [Google Scholar] [CrossRef]
  43. World Wide Fund For Nature. Report on Food Waste in Chinese Cities; World Wide Fund For Nature: Beijing, China, 2018. [Google Scholar]
  44. Wang, L.E.; Ni, X.W.; Li, Y.Y. Measurement of the scale of food waste and its resources and environmental effects at the consumer segment in China. J. Nat. Resour. 2021, 36, 1455–1468. [Google Scholar] [CrossRef]
  45. The World Bank. Available online: https://www.worldbank.org/ext/en/home (accessed on 8 May 2025).
  46. The World Bank. Available online: https://data.worldbank.org/ (accessed on 8 May 2025).
  47. FAO. Available online: https://www.fao.org/worldfoodsituation/csdb (accessed on 8 May 2025).
  48. FAO. Available online: https://openknowledge.fao.org/items/6c17080e-6c5d-47ae-a982-609c882bd4e7 (accessed on 8 May 2025).
  49. Gao, Q.J. Forcasting and analysis of grain consumption of urban and rural residents. Chin. Rural Econ. 2004, 10, 20–25. (In Chinese) [Google Scholar]
  50. Gustavsson, J.; Cederberg, C.; Sonesson, U.; van Otterdijk, R.; Meybeck, A. Global Food Losses and Food Waste: Extent, Causes and Prevention; Food and Agriculture Organization of the United Nations: Rome, Italy, 2011. [Google Scholar]
  51. Ishangulyyev, R.; Kim, S.; Lee, S.H. Understanding Food Loss and Waste—Why Are We Losing and Wasting Food? Foods 2019, 8, 297. [Google Scholar] [CrossRef] [PubMed]
  52. Xue, L.; Liu, X.; Lu, S.; Cheng, G.; Hu, Y.; Liu, J.; Liu, G. China’s food loss and waste embodies increasing environmental impacts. Nat. Food 2021, 2, 519–528. [Google Scholar] [CrossRef] [PubMed]
  53. Gatto, A.; Chepeliev, M. Global food loss and waste estimates show increasing nutritional and environmental pressures. Nat. Food 2024, 5, 136–147. [Google Scholar] [CrossRef]
  54. Wu, H.; Zhang, Z.; Xu, J.; Song, J.; Han, J.; Zhang, J.; Li, S. Food consumption away from home had divergent impacts on diet nutrition quality across urban and rural China. Food Secur. 2025, 17, 41–56. [Google Scholar] [CrossRef]
  55. Wang, R.; Lu, S.; Zhou, L.; Yang, Z.; Tang, Z.; Zhao, M.; Cheng, G. Assessing nutritional and economic aspects of food loss and waste in China. Sustain. Prod. Consum. 2023, 42, 95–105. [Google Scholar] [CrossRef]
  56. Norton, W. The Relevance of von Thünen Theory to Historical and Evolutionary Analysis of Agricultural Land Use. J. Agric. Econ. 1979, 30, 39–47. [Google Scholar] [CrossRef]
Figure 1. Geographical distribution of cropland and food production in China.
Sustainability 17 05965 g001
Figure 2. Workflow of flow–consumption statistics method.
Sustainability 17 05965 g002
Figure 3. Trends in China’s (a) food self-sufficiency rate and (b) grain self-sufficiency rate from 2010 to 2022 based on SC, FS, and CS methods.
Sustainability 17 05965 g003
Figure 4. Comparison of food and grain self-sufficiency rates estimated using the FS and FCS methods.
Sustainability 17 05965 g004
Figure 5. Composition of China’s (a) food consumption and (b) grain consumption from 2010 to 2022.
Sustainability 17 05965 g005
Figure 6. Comparison of multi-year average provincial food and grain self-sufficiency rates based on FS, FCS, and CS methods.
Sustainability 17 05965 g006
Figure 7. Annual food (a) and grain (b) self-sufficiency rates of different provinces from 2010 to 2022 based on FS and FCS methods.
Sustainability 17 05965 g007
Figure 8. Heatmap of food self-sufficiency rates across Chinese provinces from 2010 to 2022.
Sustainability 17 05965 g008
Figure 9. Spatial distribution and transition of food self-sufficiency status across Chinese provinces.
Sustainability 17 05965 g009
Figure 10. Heatmap of grain self-sufficiency rates across Chinese provinces from 2010 to 2022.
Sustainability 17 05965 g010
Figure 11. Spatial distribution and transition of grain self-sufficiency status across Chinese provinces.
Sustainability 17 05965 g011
Figure 12. Trends in RC (a) and FC (b) in China from 2010 to 2022.
Sustainability 17 05965 g012
Figure 13. Comparison of per capita RC (a) and FC (b) in 2010 and 2022.
Sustainability 17 05965 g013
Figure 14. (a) Per capita GDP vs. food self-sufficiency, (b) arable land vs. food production by precipitation zone.
Sustainability 17 05965 g014
Disclaimer/Publisher’s Note: The statements, opinions and data contained in all publications are solely those of the individual author(s) and contributor(s) and not of MDPI and/or the editor(s). MDPI and/or the editor(s) disclaim responsibility for any injury to people or property resulting from any ideas, methods, instructions or products referred to in the content.

