Abstract
This paper demonstrates the application of cognitive modeling methods to study problems relating to the functioning and advancement of a strategy for the development of rural areas. Rural areas play a vital role in human life; they have enormous economic, natural, demographic, historical, and cultural potential, and their revival ensures the achievement of the United Nations Sustainable Development Goals in the field of SDG 2: “End hunger, achieve food security and improve nutrition and promote sustainable agriculture”. The relevance of the study lies in the need to develop approaches in order to improve the efficiency of agriculture and to ensure the sustainable development of rural areas. The goal was to use cognitive modeling tools to understand the cause-and-effect mechanism of ensuring sustainable development of rural areas and analyze their possible development under the influence of internal and external factors to select the best strategy for sustainable development. Based on 24 selected quantitative and qualitative indicators, a cognitive map “Sustainable Development of Rural Areas” was constructed, and an analysis of 351 cycles of the cognitive model was carried out, among which 286 positive and 65 negative cycles were observed, indicating the structural stability of the model. Computational experiments were carried out using pulse and scenario modeling; the results are presented and visualized in the form of five scenarios for complex systems development. The results of this study can be used as decision support tools for substantiating strategies and developing policies for the balanced development of rural areas.
1. Introduction
The relevance of this study is due to the growing role of agriculture and rural areas in economic development and human life. Rural areas have enormous economic, natural, demographic, historical, and cultural potential. Agriculture is the largest employer in the world, providing a livelihood for 40 percent of the planet’s population [1].
Among the 17 important UN Sustainable Development Goals (SDGs) for the post-2015 period, SDG 2 “End hunger, achieve food security and improved nutrition and promote sustainable agriculture” recognizes the importance of “developing support for sustainable agriculture, expanding opportunities for smallholder farmers, …, ending rural poverty, ensuring healthy lives, and combating climate change” [2,3]. At the same time, achieving SDG 1 of the UN Sustainable Development Goals (eradication of poverty) is impossible without modernization of rural areas. Achieving sustainable development is possible only on the basis of rural revival.
However, the development of rural areas in the world today is extremely uneven and subject to various economic and climatic fluctuations, which means that food security and the survival of humanity as a whole are at risk. There are a number of identical problems in the agricultural sectors of most countries, such as the standard and quality of life of the rural population as a whole lagging significantly behind the standard of living in cities. Meanwhile, low life expectancy is observed, rural populations’ access to social, medical, and educational services is decreasing, social tension is growing, and the information, financial, social, and technological gaps between urban and rural areas are deepening. All this leads to urbanization and an increase in the migration outflow of the rural population (especially the most promising young personnel) and to the loss of development of rural areas. The share of the world’s urban population in 1960 was 33.6%; in 2024 it reached 57.4%, and by 2050, 68% of the world’s population is expected to live in cities [4].
A world with large disparities in development between rural and urban areas will never be able to achieve the Sustainable Development Goals (SDGs). Current challenges call for urgent action to revitalize rural areas to promote sustainable prosperity [5].
Today, it is necessary to take all measures to preserve the socio-economic potential of rural areas and to promote in every possible way the creation of advantages for the rural way of life and improvements in the quality and standard of living of the population in rural areas. In this context, it is necessary to develop approaches to increasing the efficiency of agriculture and ensuring food security at the level of all countries and regions. It is necessary to develop a certain methodology for systemic research of rural areas and create an integrated approach to planning and managing the development of rural areas [6,7].
The object of this research is the concept of rural areas including agrarian settlements, countryside residents, their culture, socio-economic status, industrial infrastructure, natural landscape conditions, and environmental risks [8,9].
Rural areas are a complex system of socio-economic factors that, depending on the objectives set, require various methodologies and techniques for studying, planning, and managing their development and expansion [10].
There are various definitions of the “sustainable rural development” concept [11,12,13,14,15]. Sustainable development is seen as the ability of production not only to meet current needs but also to plan for the needs of future generations [16,17]. Sustainable agriculture is a method of farming that makes maximum use of the land’s resource potential and ensures environmental safety and constant renewal of the ecosystem’s fertility. The concept of “sustainable development” implies improving the living conditions of the population and applying scientific and technological achievements in the production process. In the service sector, the sustainable development model is based on meeting the needs of the current generation without compromising the ability of future generations to meet their needs. The concept of sustainable development is based on a combination of three components: economic, environmental, and social [18,19,20,21]. Sustainable agriculture is socially just, ecologically sound, economically viable, and its paradigm aims to produce the food needed to achieve food security [22].
In the Strategy for Sustainable Development of Rural Territories of the Russian Federation for the period up to 2030, “sustainable development of rural territories” is understood as the stable socio-economic advancement of rural territories, including an increase in agricultural production volumes, an escalation in agricultural efficiency, achievement of full employment in the rural population, improving their standard of living, and the rational use of land [23,24].
In the framework of this study, the main criterion for sustainable development is the requirement for the dynamic property of maintaining a stable trend of increase/decrease in the characteristics of rural areas (each vertex of the cognitive map) in accordance with the requirements of expanded reproduction. We consider the sustainability of rural areas as a “complex dynamic property of the controllability class” [25].
Rural areas are positioned as open systems within a complex natural and economic territorial system, with weakly structured problems. The object of this study is the sustainable development of rural territories as open socio–ecological–economic systems within a rural territory. Their condition is influenced by a set of external and internal factors that determine the need for systemic research taking into account the most significant connections and interactions that affect the sustainable development of rural areas [26]. In this regard, methods for modeling the process of rural areas’ functioning are in demand, taking into account not only structured data (quantitatively expressed and measurable indicators and concepts) but also weakly structured data (expressed by qualitative indicators). In this paper, cognitive modeling tools are used to study the conditions for sustainable development of rural areas.
The purpose of this study is to model the cause-and-effect mechanism for ensuring sustainable development of rural areas and to analyze possible situations of its development under the influence of internal and external factors, in order to select the optimal strategy for sustainable development.
To achieve this, the following tasks were undertaken:
- -
- definition of concepts and factors influencing the system under research;
- -
- identification of indicators and interrelations of complex systems;
- -
- construction of a cognitive map “Sustainable development of rural areas” as a comprehensive system;
- -
- analysis of the properties of the cognitive map “Sustainable development of rural areas”;
- -
- qualitative analysis of the cognitive model, including analysis of properties and cycles;
- -
- impulse modeling and scenario analysis to determine the structural sustainability of the system for sustainable development of rural areas.
Rural development within regional economies is a broad area of research. There have been a lot of attempts to conduct studies on some selected dimensions of this area, including such traditional research methods and qualitative, quantitative, and mixed methods [27,28,29,30,31,32]. However, traditional research methods allow analysis of some single and easily solvable problems in agriculture without seeing the overall picture. Cognitive modeling of complex systems allows consideration of the overall picture of the area, taking into account all the interrelations, which distinguishes it from other research methods. Cognitive modeling is based on identifying the relationships and interactions of statistical and evaluation indicators, as well as on modeling systems with certain cause-and-effect relationships between elements [33,34,35].
Today, cognitive modeling is a method widely used for assessing interactions of complex weakly structured systems within the framework of modern theories of decision support and decision making. The possibilities and advantages of the cognitive approach in the field of sustainable development modeling have been clearly presented in various works [36,37]. The issues of developing methodological approaches to the use of cognitive models in various areas of the economy have been described in detail in the works of researchers [38,39]. Fuzzy cognitive maps are widely applied for evaluation in various socio-economic processes modeling, noting the possibility of using expert assessments and accumulated knowledge among their advantages [40,41,42].
A cognitive model is a formalized graphical representation of the relationships between concepts (notions, factors, indicators, and interacting systems). Cognitive modeling provides opportunities to study problems of the functioning of weakly structured complex systems consisting of separate but interconnected elements and subsystems, such as agricultural and regional economic systems.
Cognitive structuring is an effective tool to support strategic decision making, allowing identification of objects and connections between them when the control object and its external environment represent a complex of processes and factors that significantly influence each other. The use of impulse modeling in scenarios generated under various disturbing influences allows researchers to determine structural stability, predict behavior, and determine possible developmental directions for the systems under research [43].
The methodology of cognitive modeling of complex socio-economic systems has been successfully tested and applied to solving various problems. Cognitive modeling takes into account the features of weakly structured systems such as agriculture in rural areas, as has been confirmed by the results of research. In particular, cognitive strategies have been used to develop scenarios for achieving sustainable innovation growth within agro systems [44]. A cognitive map was constructed relating to the problem of managing rural areas’ integrated development [45]. The cognitive approach has been used in developing mechanisms for improving agricultural management based on environmental regulation of agricultural production [46,47]. System dynamics models that simulate the behavior of complex social systems have been developed to analyze the development of social capital in the agricultural sector to strengthen sustainable partnerships between farmers and stakeholders [48]. Dynamic modeling of sustainable farm development scenarios has been conducted using cognitive modeling [49]. A system dynamics model was used to assess the level of sustainability of agriculture, highlighting the important role of organic farming and biological control, and that research recommended re-specialization of agricultural production to reduce water consumption [50]. A scenario approach was applied to study the possibility of innovative development of agriculture [51]. Fuzzy cognitive mapping of scientific support and commercialization of innovations in the agro-industrial complex system has been constructed [52]. In this context, options for constructing cognitive maps have been developed and widely presented. However, the use of cognitive modeling for the analysis and scenario modeling of sustainable development of rural areas processes is not so widespread (due to the lack of necessary software support for modeling), and this study seems relevant from the standpoint of this problem.
Taking into account all of the above, this study continues the discussion on the directions of sustainable development of rural areas. The article presents new possible methodological approaches to assess the balance of elements of the sustainable development of rural areas and regional agriculture.
The present paper is organized as follows. The introduction discusses the research interest in the issues of sustainable development in the context of sustainable rural development within complex regional economic systems. Section 2 describes the research methodology. Section 3 presents the results of the cognitive modeling of sustainable development of rural territory. Section 4 provides the scenario analysis results, discussion, and the conclusions of this research.
2. Materials and Methods
Modern cognitive modeling methodology involves constructing a subject area of the research object, which can be displayed as a cognitive map. It allows visualizing the understanding of such complex systems as rural areas, identifying external factors and assessing options regarding their influence on the future state of the system, to solve problems relating to support for management decisions [26]. The cognitive map also allows study of the structural stability of systems, including impulse modeling and assessment of development scenarios.
To conduct cognitive modeling, a set of 24 most significant factors (concepts) was formed based on an expert survey and analysis of relevant works on the topic of the current study [53,54,55,56,57,58,59,60,61,62]. All the following indicators interact within the agro-ecosystem and affect its structural stability: rural population quality and standard of living, sustainable development of rural territories, food security, size of the rural population, the state of the regional economy, land, and other natural resources, national–cultural potential, rural population employment, rural population income, agricultural products, raw materials, food markets, labor markets, social infrastructure, the financial basis for rural development, quality of the education system, quality of the healthcare system, the scientific and personnel bases for rural development, interregional and intraregional social differentiation, the environmental situation, the geopolitical situation, state agrarian and food policy, interaction between federal and regional authorities, risks to sustainable development, agricultural production, and interregional and foreign economic exchange.
To achieve the objectives of this study, a list of the studied indicators and vertices was constructed, taking into account the influence of various factors, and a cognitive map G “Sustainable development of rural areas” was constructed (Figure 1). This represented a formalized description of the cause-and-effect relationships of the elements of a complex open socio–ecological–economic system in a rural area, including its quantitative and qualitative characteristics.
where V = {vi|vi∈V, i = 1, 2, …, k}—set of vertices (nodes, concepts, elements) for a cognitive map; E = {eij|eij∈E, i, j = 1, 2, …, k} is a set of arcs representing relationships (cause–effect relationships) between vertices [63,64].
G = <V, E>,
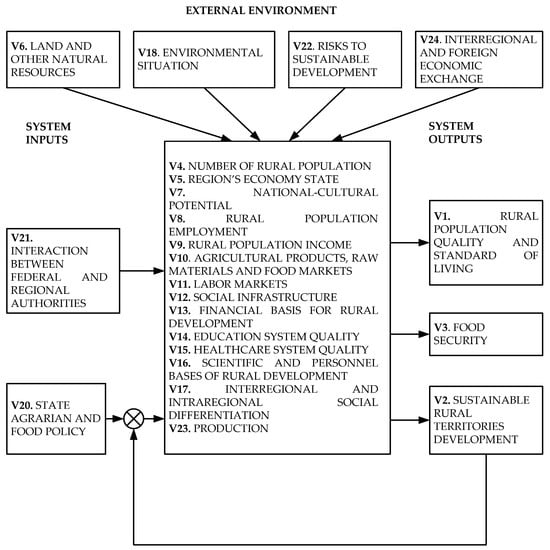
Figure 1.
Rural areas: input–output scheme.
The graph G corresponds to the matrix of relations AG
AG = [aij], aij = {1, if Vi is connected with Vj; 0, otherwise}
Various mathematical operations on AG allow us to analyze the properties of the cognitive model, as well as scenario modeling.
Conducting scenario modeling required preliminary development of a plan. When constructing a cognitive map, to select its vertices and to determine the cause-and-effect relationships between them, a socio-economical analysis and a series of brainstorming sessions (with 4 experts in the subject area) were conducted, which is traditional in the development of cognitive maps. To justify the plan, the “Sustainability of rural trajectories” system can be represented as a cybernetic “input–output” scheme, as shown in Figure 1. It is necessary to analyze the development trends of dynamic processes in situations where the parameters of the external and internal environment of the system begin to change alternately or simultaneously. When conducting a computational experiment, it is necessary to analyze various scenarios when introducing positive or negative impulses that trigger dynamic processes in the system into one or more vertices.
In the process of impulse modeling, scenarios were constructed for the development of situations that could arise in the system under the influence of external and internal disturbing and control factors or with possible changes in the basic factors.
As is known, scenario modeling occurs during the transition to model time in the form of modeling steps according to the following rule [65]:
where xi(n) is the value of the impulse at the vertex Vi at the previous moment—the simulation step (n); xi(n + 1)—at the moment of interest to the researcher (n + 1); fij is the impulse transformation coefficient; Pj(n) is the value of the impulse at the vertices adjacent to the vertex Vi; Qi(n) is the vector of disturbances and control actions introduced into the vertex Vi at the moment n.
The set of realizations of impulse processes is a “development scenario” that indicates possible trends in the development of situations. The situation in impulse modeling is characterized by a set of all Q and X values in each simulation step [66]. According to the formula of the impulse process, the calculations of the elements of the formula are performed by the software system [67], which produces the final result.
3. Results
3.1. Development of a Cognitive Map “Sustainable Development of Rural Territories” Within a Complex System
Table 1 shows the concepts of the cognitive map, the selection of which was carried out in accordance with the set goal, based on theoretical and expert knowledge in the field of rural area research. The vertices of the V are classified according to their purpose and possible role in the processes of changing situations in the system. The definition of the purpose of the vertices (“appointment”), necessary for designating their further role in the research, was determined by the authors of this study. The names are given in accordance with the recommendations proposed by the researchers of the Institute of Control Sciences of the Russian Academy of Sciences in the 1990s. The designation “Target” corresponds to the stated goal of the entire study and, consequently, the goal of constructing a cognitive map. The definition of the purpose of the vertices further facilitated the compilation of a plan for the computational experiment and the analysis of the obtained scenarios.

Table 1.
Vertices of the cognitive map “Sustainable development of rural territories”.
In this research, the cognitive modeling process was supported by the CMCS software package “Program for cognitive modeling and analysis of regional socio-economic systems” [67]. Figure 2 shows the cognitive map “Sustainable development of rural territories”, built in the CMCS software system.
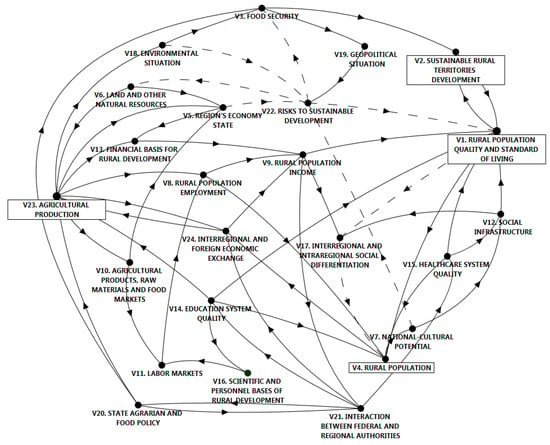
Figure 2.
Cognitive map “Sustainable development of rural territories”.
In Figure 2, the arcs representing the relationship between the vertices Vi and Vj are shown as solid and dotted lines. The influence of Vi on Vj in the situation under study can be positive (the “+1” sign above the arc, a solid arc) when an increase (decrease) in one factor leads to an increase (decrease) in another, or negative (the “−1” sign above the arc, a dotted arc) when an increase (decrease) in one factor leads to a decrease (increase) in another. The relationship matrix (Table 2) denotes the relationship between the concepts of the model. The last row and column of Table 2 contain numbers for kx, corresponding to the number of arcs in row x, and ky, corresponding to the number of arcs in column y.

Table 2.
Relationship between matrix AG and graph G.
3.2. Analysis of the Properties of the Cognitive Map “Sustainable Development of Rural Territories”
3.2.1. Analysis of Graph Vertices’ Properties
The degree (valence) P of graph vertices (the number of edges of graph G incident to vertex V) was determined. The results are presented in Table 3, from which it is evident that vertex V23 (agricultural production) had the highest degree, while the vertex influenced the maximum number of other vertices (P− = 6, the number of outgoing arcs), and was influenced by four vertices (P+ = 4, the number of incoming arcs). The next vertex with a high valence was vertex V1 (rural population quality and standard of living), P = 9; this vertex depended on six vertices (P+ = 4), i.e., The quality and standard of living may be directly influenced by V2 (sustainable rural territories’ development), V9 (..), V12 (..), V14 (..), V15 (..), V22 (..), and the quality and standard of living of the population directly influence sustainability (V2), population (V4), and reduction of the impact of interregional and intraregional social differentiation (V17).

Table 3.
Degrees of cognitive map vertices.
3.2.2. Analysis of Cognitive Map Paths
Analysis of cognitive map paths allows analysis of the reach ability of vertices and possible ways to reach vertex Vj from Vi, including the shortest (Figure 3) or the most efficient. Figure 3 and Figure 4 show three of 72 possible paths from vertex V22 (risks to sustainable development) to vertex V1 (the rural population’s quality and standard of living).

Figure 3.
Shortest path from vertex V22 to vertex V1 of cognitive map “Sustainable development of rural territories”.
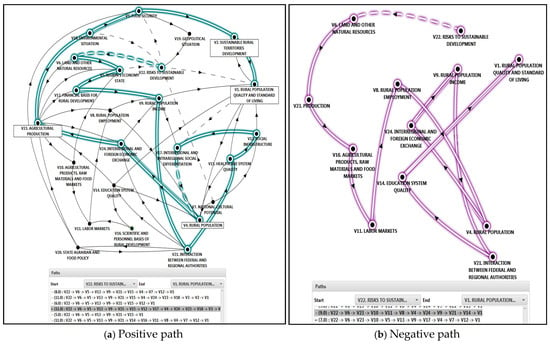
Figure 4.
Positive and negative paths from vertex V22 to vertex V1 of cognitive map “Sustainable development of rural territories”.
Among the graph paths, positive paths (paths with no or an even number of negative arcs) and negative paths (paths with an odd number of negative arcs) were distinguished. Figure 3 and Figure 4b show examples of negative arcs; Figure 4a shows one of the positive paths. The negative path from vertex V22 to vertex V1 (Figure 2) can be interpreted as follows. If the risks to the sustainable development of the rural territories increase/decrease, this leads to a decrease/increase in the quality and standard of living of the population. The analysis of all other paths from V22 to V1 is not so trivial; see, for example, the paths highlighted in Figure 4.
Vertex-to-vertex path analysis allows tracing of the possible consequences of changes in the vertices along the entire chain of causes and effects, interpreting the results, seeing possible theoretical contradictions, and in this case, refining the cognitive map “Sustainable development of rural territories”.
3.2.3. Analysis of Cognitive Map Cycles and Stability
In the process of studying this complex system, an analysis of the cognitive map “Sustainable development of rural territories” cycles was conducted. In total, there were 351 cycles in this model, among which 65 negative and 286 positive cycles were observed. Analysis of all cycles is mandatory when studying the structure of a cognitive map; there is a possibility of reducing the number of revisions due to the fact that the same elements are repeated in many cycles in the form of a sequence of vertices and arcs and do not require re-analysis. Note that a negative feedback cycle (circuit) is a cycle containing an odd number of negative arcs. Such a cycle is stabilizing, contributing to the stability of the system [68]. Figure 5 and Figure 6b show examples of negative cycles.
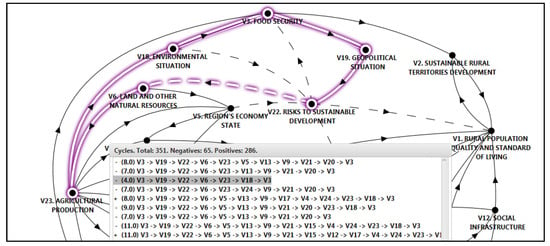
Figure 5.
One of the negative cycles for cognitive map “Sustainable development of rural territories”.
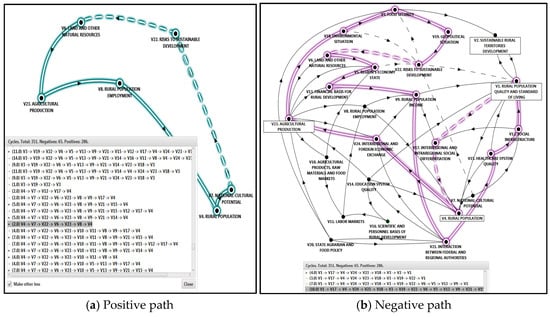
Figure 6.
Examples of positive and negative cycles for cognitive map “Sustainable development of rural territories”.
Figure 6a shows an example of one of the positive cycles (the accelerator cycle in the economy), consisting of six vertices: V23→V8→V4→V7→V22→V6→V23. There are two possible scenarios for the development of situations in this cycle. Let us assume that positive changes begin at one of the vertices, and that agricultural production grows (improves) (V23), which leads to a sequence of changes in states at the vertices V8 (rural employment grows), V4 (rural population numbers increase), V7 (national–cultural potential grows), V22 (risks to the sustainable development of the territory decrease), V6 (use of land and other natural resources improves), the changes are closed at V23, and the acceleration of these trends begins in a new circle. Acceleration can be reversed; if production begins to fall, this can lead to economic stagnation. Analysis of all cycles showed their consistency with theoretical and practical ideas about the structure of the real system.
The presence of an odd number (65) of negative cycles in the cognitive map indicates the structural stability of the model [69,70]. That is, if the designated concepts and connections between them are preserved in the real system, the system is structurally stable.
The stability of the system in relation to disturbances and the initial value is usually judged by the results of the analysis of the roots of the characteristic equation of the matrix of relations [71,72]. Figure 7 shows the results of calculating the root values. Since the maximum number by modulus |M| = 2.24 > 1, the model is not stable under the effect of disturbances, which is not an obstacle to scenario modeling.

Figure 7.
Fragment of root calculations for the characteristic equation of the matrix AG.
4. Discussion
In this study, a number of scenarios were developed and analyzed, including scenarios obtained by introducing disturbances into one, two, three or more vertices (assuming that the remaining vertices are in some initial “0” state). Single disturbances arising from the external environment: q22 = +1 (increase in risks to sustainable development), q19 = +1 and q19 = −1 (improvement/deterioration in geopolitical situation). Disturbances occurring within the system included growth in employment (q8 = +1) and income (q9 = +1) of the rural population, development of labor markets (q10 = +1) and agricultural products (q11 = +1), and a decline in the interregional and intraregional social differentiation of the population (q7 = −1). Disturbances introduced into several vertices were combinations of single impulses.
Table 4 shows a fragment of the experimental plan, the scenarios of which are discussed below.

Table 4.
Impulse modeling plan for the cognitive map “Sustainable development of rural territories” (fragment).
Scenario No. 1. Let us assume that agricultural production is developing; this is modeled by introducing a pulse q23 = +1 to the vertex V23. The remaining vertices are in the initial state (qi = 0). The disturbance vector Q1 = {q1 = 0; … q23 = +1; q24 = 0}. Table 5 and Figure 8 show the results of the impulse modeling.

Table 5.
Results of the computational experiment, Scenario No. 1.
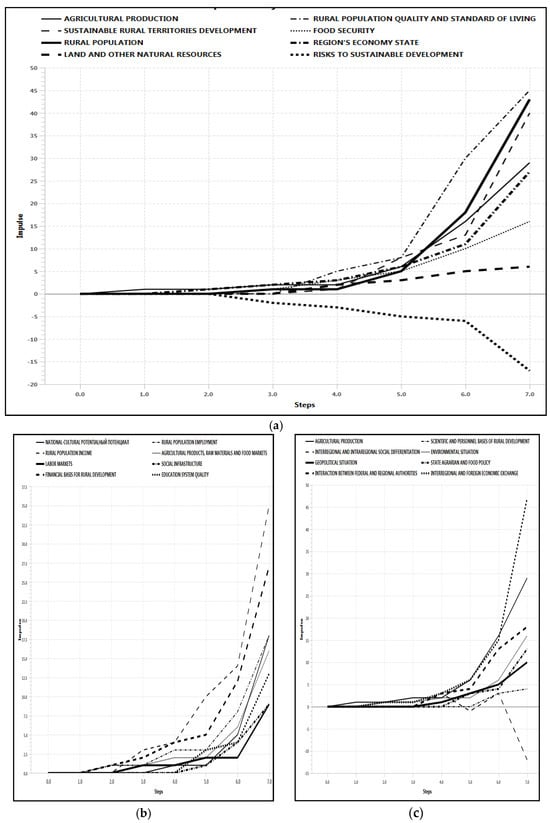
Figure 8.
(a–c) Graphs of impulse processes, Scenario No. 1.
Scenario №1 can be considered as “positive”. As can be seen from the data in Table 5 and Figure 6, the development of production gives an impetus to the consolidation of the growth trends of positive values of the indicators in all vertices of the cognitive map, except for vertices V22 (risks to sustainable development) and V17 (interregional and intraregional social differentiation), in which a steady decline is observed. Figure 8 shows the results of seven modeling steps, but, as the results of further steps of the impulse modeling show, the trends do not change further. As can be seen from the data in Table 5 and Figure 8, at the seventh step of modeling, production increases to 29 units, risk decreases by 17 units, quality and standard of living increase to 45 units, and sustainability increases to 40.
Scenario No. 2. Let us assume that the risks to sustainable development of rural areas are growing, which is modeled by introducing a pulse q22 = +1 to the vertex V22. The remaining vertices are in the initial state (qi = 0). The disturbance vector Q2 = {q1 = 0; …q22 = +1; … q24 = 0}. Table 6 and Figure 9 show the results of the impulse modeling.

Table 6.
Results of the computational experiment, Scenario No. 2.
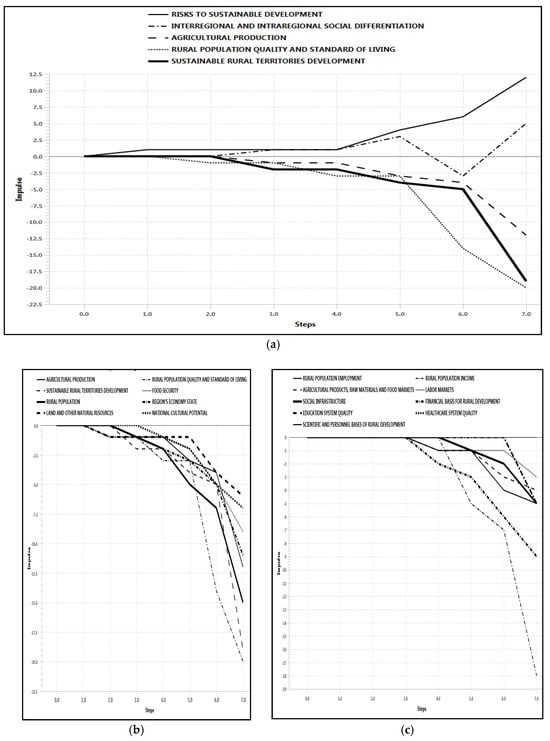
Figure 9.
(a–c) Graphs of impulse processes, Scenario No. 2.
The analysis of the results of modeling Scenario No. 2 shows the expected deterioration of the situations in the system. The growth in risk leads to significant decreases in the values of the indicators at all vertices (Figure 9b,c). The decrease is due to the increasing trends in the growth of risks from step to step of the modeling (Figure 9a). For example, at the second step of modeling, it is already clear that an increase in risk by 1 unit can lead to a decrease in the quality of life by 1 unit, and at the seventh step, an increase in risk by 12 units reduces the quality and standard of living by 20 units. However, such an effect can only be obtained under the assumption that throughout the modeling, the risk will not be countered by the current situations at the vertices and no other impacts (regulating or disturbing) on the vertices, for example, along paths (e.g., Figure 3 and Figure 4) or cycles (e.g., Figure 5 and Figure 6).
Let us also analyze how situations develop in the system if agricultural production begins to develop in the region, counteracting the impact of risks.
Scenario No. 3. Let agricultural production (q23 = +1) begin to develop in the “Rural Territory” system under conditions of increasing risk (q22 = +1); the disturbance vector Q3 = {q1 = 0; … q22 = +1; q23 = +1; q24 = 0}. Table 7 and Figure 10 show the results of the impulse modeling.

Table 7.
Results of the computational experiment, Scenario No. 3.
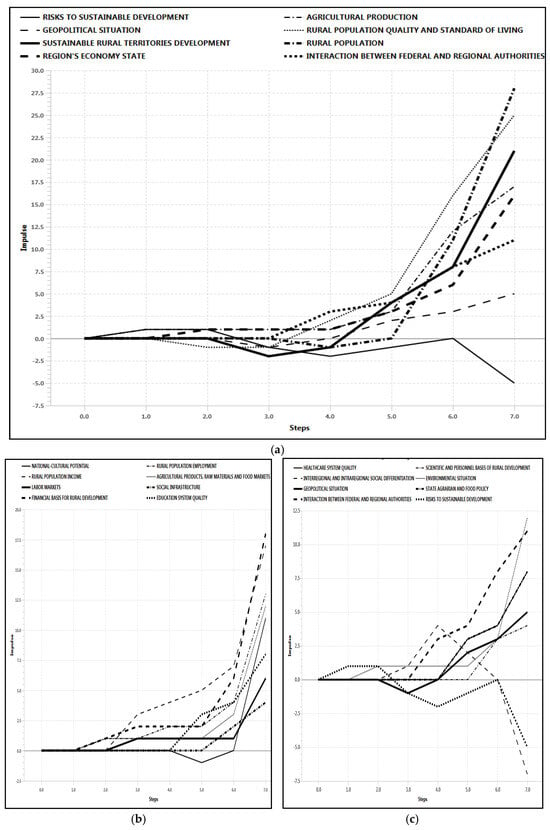
Figure 10.
(a–c) Graphs of impulse processes, Scenario No. 3.
Analysis of the simulation results (Table 7, Figure 10) shows that production development is able to withstand the risk. At the fourth step of the simulation, the decline in the quality of life caused by the growth in risk already begins to increase. At the seventh step of the simulation, growth in production by 5 units leads to a decrease in risks by 5 units, and the quality and standard of living increase by 25 units.
Thus, we can conclude that the development of agricultural production leads to an improvement in the development of situations in the system, and scenario No. 3 can be considered favorable. Here, we present the results of modeling the scenario in which disturbances are introduced into three vertices.
Scenario No. 4. Let us assume that the system is affected by risks (q22 = +1), but the scientific and personnel bases are strengthened in the system (q16 = +1) based on the strengthening of interaction between federal and regional authorities in this direction (q21 = +1) [25]. The disturbance vector Q4 = {q1 = 0; … q16 = +1; … q21 = +1; q22 = +1; q24 = 0}. Table 8 and Figure 11 show the results of the impulse modeling.

Table 8.
Results of the computational experiment, Scenario No. 4.
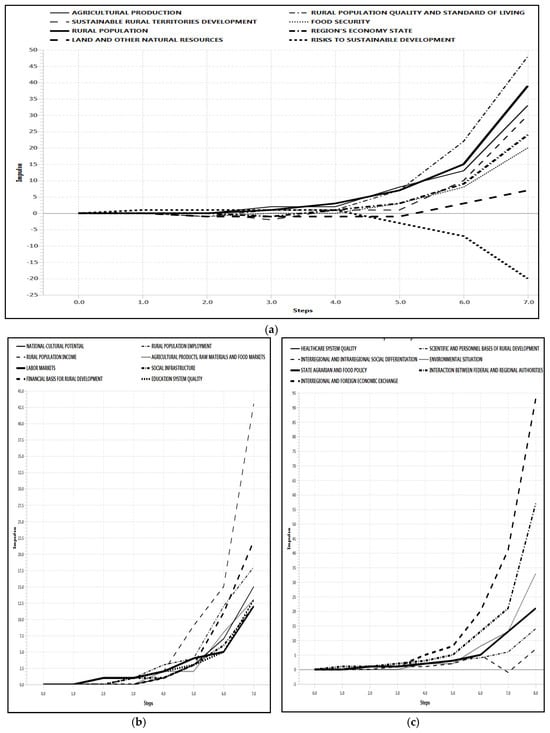
Figure 11.
(a–c) Graphs of impulse processes, Scenario No. 4.
The results of modeling Scenario No. 4 (Table 8 and Figure 11) are slightly better than those of Scenarios No. 1 and No. 3. Despite the risks existing in the system, improving the quality of the scientific and personnel base of the rural area and strengthening the interaction of federal and regional authorities lead to an increase in the quality of life (48 units) and sustainable development (30 units). Next, we further present the results of modeling one of the more complex scenarios, wherein disturbing impulses are simultaneously introduced into five vertices.
Scenario No. 5. Let us assume that agricultural production is developing (q23 = +1), rural employment is growing (q8 = +1), the quality of the education system is improving (q14 = +1), and the interaction of federal and regional authorities is strengthening (q21 = +1), but there are risks to sustainable development (q22 = +1); the disturbance vector Q5 = {q1 = 0;… q8 = +1; … q14 = +1; q21 = +1; q22 = +1; q23 = +1; q24 = 0}. Table 9 and Figure 12 show the results of the impulse modeling for scenario No. 5.

Table 9.
Results of the computational experiment, Scenario No. 5.
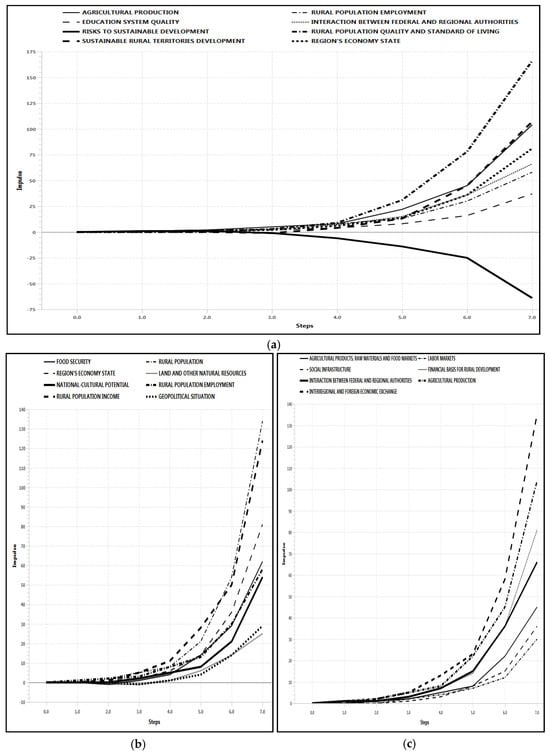
Figure 12.
(a–c) Graphs of impulse processes, Scenario No. 5.
Analyzing the data of Scenario No. 5, we see that it can be considered the best among those considered. Firstly, the tendencies of positively and negatively developing situations occur more intensively than in the previous scenarios. Secondly, the joint simultaneous impact of five factors on the system turns out to be more effective than the separate single unrelated impacts of individual factors, which is evident from the comparison table of the results of scenario modeling (Table 10).

Table 10.
Comparison of scenario modeling results.
Thus, the necessary interaction between federal and regional authorities, aimed at improving the quality of the education system and promoting the development of agricultural production and employment, makes it possible to counteract possible negative impacts of the external environment and, compared with other scenarios, significantly reduce the risks to sustainable development.
5. Conclusions
This paper demonstrates the possibilities of using the cognitive analysis methodology to solve the problems of assessing and managing sustainable rural development within the regional economy. To improve the balance of the system elements, a cognitive approach and analysis based on the construction of cognitive models were used. Cognitive modeling allowed assessment of weakly structured dependencies. To assess the sustainability of rural development, a toolkit for assessing and forecasting 24 indicators was developed. A cognitive map “Sustainable rural territories development” was constructed as a formalized description of the cause-and-effect relationships of elements within a complex open socio–ecological–economic system of a rural territory, including its quantitative and qualitative characteristics. Impulse and scenario modeling were carried out on this model and an analysis of variants of disturbing impulses and vectors of their impacts was conducted; as a result, the structural stability of the system was confirmed by analyzing the cycles of the cognitive map. The results of cognitive modeling of the sustainable development system in Russian agriculture indicate the need to improve existing mechanisms for planning and coordinating its elements at the federal and regional levels.
The presented methodological approaches enabled modeling of the behavior of the studied systems in response to disturbing effects, and analysis of possible forecast scenarios of development. The results of this study can be used as tools to support decision-making in substantiating strategies and developing a policy for the balanced development of rural areas within regional socio-economic systems. The conducted cognitive simulation modeling showed the possibility of sustainable development of rural areas under various conditions. Conclusions on the development of specific rural areas’ sustainability, as well as recommendations for developing strategies for their sustainable development, can be based on the results of cognitive simulation modeling. The cognitive simulation modeling tool used in this research cannot answer the question of what the numerical value of the indicator at each vertex (rural population, etc.) might be, but impulse modeling provides quantitative information on trends and the magnitude of changes at each vertex of the model, under the assumption that changes will begin at some of the vertices (or a set of vertices). This information allows researchers to compare the effect (impulse value) of disturbances at any step of modeling and thereby compare different scenarios. The software system used allows researchers to model a variety of scenarios of interest.
Cognitive simulation modeling enables this procedure, which has been confirmed by many years of experience in its development and application. For a meaningful cognitive study, systemic analysis of the economic, environmental, political, social, demographic, and resource status of the territory is necessary. For the practical implementation of the recommendations received by government bodies, it is desirable to create an appropriate information base, a monitoring system, an intelligent decision support system with a cognitive modeling block in the knowledge base, appropriate financial support, and management measures [25].
Thus, optimistic scenarios suggest significant positive changes in the socio-economic, environmental, and infrastructural development of rural areas, provided that the investment climate is radically improved, significant public and private investments are made, and local self-government is developed. This research allows us to conclude that the models are consistent with the possible real sustainable development of rural areas and to justify the necessary management decisions.
At this stage of studying the complex system “Sustainable rural territories’ development”, it has been possible to determine only its general structure (cognitive map) and the tendencies for the development of situations (scenarios) within this structure. This can be considered as a limitation on the use of the obtained results. However, a significant advantage of cognitive maps is considered to be that they can contain both quantitative and qualitative concepts (vertices), including factors of not only the internal but also the external environment of the system, which is not reflected in other types of simulation models of cause-and-effect relationships.
Further research directions into sustainable rural development may include the development of cognitive models of other types, for example, the development of models in the form of weighted oriented graphs, as well as in the form of functional graphs in which the connections between vertices are specified by certain functions, whereby it is possible to develop a model in the form of a hierarchical cognitive map. Scenario modeling on such models will allow researchers to propose quantitative and not only qualitative recommendations for the strategies being developed for the development of rural areas, as well as to compare the proposed recommendations with existing theories of rural development and sustainable development and existing strategies for the development of rural areas in various regions.
Author Contributions
Conceptualization, G.V.G. and E.L.M.; methodology, G.V.G.; software, G.V.G.; validation, A.A.F., G.V.G. and E.L.M.; formal analysis, G.V.G. and E.L.M.; investigation, G.V.G., E.L.M., A.A.F. and V.Y.K.; resources, A.A.F., E.L.M. and E.A.M.; data curation, G.V.G., E.L.M., and V.Y.K.; writing—original draft preparation, A.A.F., G.V.G., E.L.M., E.A.M. and V.Y.K.; writing—review and editing, A.A.F., G.V.G., E.L.M., E.A.M. and V.Y.K.; visualization, G.V.G., E.L.M., and V.Y.K.; supervision, E.L.M.; project administration, E.L.M.; funding acquisition, E.L.M. and A.A.F. All authors have read and agreed to the published version of the manuscript.
Funding
This research received no external funding.
Institutional Review Board Statement
Not applicable.
Informed Consent Statement
Not applicable.
Data Availability Statement
Publicly available datasets were analyzed in this study.
Conflicts of Interest
The authors declare no conflicts of interest.
References
- Sustainable Development Goals. Zero Hunger. The United Nations Official Website. Available online: https://www.un.org/sustainabledevelopment/ru/hunger/ (accessed on 28 February 2025).
- Sustainable Development Goals. Food Security and Nutrition and Sustainable Agriculture. The United Nations Official Website. Available online: https://sdgs.un.org/ru/topics/food-security-and-nutrition-and-sustainable-agriculture (accessed on 28 February 2025).
- Biermann, F.; Kanie, N.; Kim, R.E. Global governance by goal-setting: The novel approach of the UN Sustainable Development Goals. Curr. Opin. Environ. Sustain. 2017, 26, 26–31. [Google Scholar] [CrossRef]
- 68% of the World Population Projected to Live in Urban Areas by 2050, Says UN. The United Nations Official Website. Available online: https://www.un.org/ru/desa/68-world-population-projected-live-urban-areas-2050-says-un (accessed on 28 February 2025).
- Yin, X.; Chen, J.; Li, J. Rural innovation system: Revitalize the countryside for a sustainable development. J. Rural Stud. 2022, 93, 471–478. [Google Scholar] [CrossRef]
- Zsolt, P. Development of Rural Areas and Improving Their Resilience with Smart Solutions. Theory Methodol. Pract. 2020, 16, 31–40. [Google Scholar] [CrossRef]
- He, H.; Li, X.; Li, T. The Sustainable Development of Wetlands and Agriculture: A Literature Review. Agronomy 2025, 15, 746. [Google Scholar] [CrossRef]
- Rathika, S.; Ramesh, T.; Akanksha, M.; Udhaya, A.; Kavitha, M.P.; Subbulakshmi, S.; Selvarani, A.; Bhuvaneswari, J.; Rajakumar, D.; Natarajan, S.K.; et al. Conservation agriculture: A pathway to achieving sustainable development goals. Plant Sci. Today 2025, 12, 1–12. [Google Scholar] [CrossRef]
- Popescu, A.; Dinu, T.; Stoian, E. Efficiency of the agricultural land use in the European Union, Scientific Papers. Ser. Manag. Econ. Eng. Agric. Rural Dev. 2019, 19, 475–486. [Google Scholar]
- Rede, G.D.; Sangode, P.B.; Dikkatwar, R.; Sarda, V.; Singu, H.B. Relationship between food security, agriculture and the sustainable development goals: A bibliometric analysis. Agric. Resour. Econ. Int. Sci. E-J. 2025, 11, 288–316. [Google Scholar] [CrossRef]
- Guo, Z. New Stage of Agriculture Development, Agriculture High-Quality Development. J. Food Technol. Nutr. Sci. 2024, 1–3. [Google Scholar] [CrossRef]
- Ndhlovu, E. Conclusion: Agriculture: Africa’s Engine for Development and Prospects for Industrialisation. In Agriculture, Autonomous Development, and Prospects for Industrialization in Africa; Springer: Cham, Switzerland, 2025; pp. 303–318. [Google Scholar]
- Gamage, A.; Gangahagedara, R.; Gamage, J.; Jayasinghe, N.; Kodikara, N.; Suraweera, P.; Merah, O. Role of organic farming for achieving sustainability in agriculture. Farming Syst. 2023, 1, 100005. [Google Scholar] [CrossRef]
- Arumugam, U.; Manida, M. Sustainable Farming Management in India. Shanlax Int. J. Manag. 2023, 11, 54–60. [Google Scholar] [CrossRef]
- Skripkina, E.V.; Latyaheva, Z.I.; Lisitsina, J.V. Problems and ways of development of Russian agriculture. BIO Web Conf. 2025, 161, 00045. [Google Scholar] [CrossRef]
- Pezzey, J. Sustainable development concepts. World 1992, 1, 45. [Google Scholar]
- Pearce, D.; Barbier, E.; Markandya, A. Sustainable Development: Economics and Environment in the Third World; Edward Elgar: Aldershot, UK, 1990; 217p. [Google Scholar]
- Brundtland, G.H.; Mansour, K.h. Our Common Future; Oxford University Press: Oxford, UK, 1987; 383p. [Google Scholar]
- Robert, K.W.; Parris, T.M.; Leiserowitz, A. What is Sustainable Development? Goals, Indicators, Values, and Practice. Environ. Sci. Policy Sustain. Dev. 2005, 47, 8–21. [Google Scholar] [CrossRef]
- Mensah, J. Sustainable development: Meaning, history, principles, pillars, and implications for human action: Literature review. Cogent Soc. Sci. 2019, 5, 653531. [Google Scholar] [CrossRef]
- Vasilchenko, M.; Derunova, E.; Andryushchenko, S.; Shabanov, V. Conceptual Aspects of Management of Sustainable Development of the Agrifood Complex. Sci. Pap. Ser. Manag. Econ. Eng. Agric. Rural Dev. 2024, 24, 1021–1030. [Google Scholar]
- Cavatassi, R.; Salazar, L.; González- Flores, M.; Winters, P. How do agricultural programmes alter crop production? Evidence from Ecuador. J. Agric. Econ. 2011, 62, 403–428. [Google Scholar] [CrossRef]
- Strategy for Sustainable Development of Rural Territories of the Russian Federation for the Period up to 2030. Available online: http://static.government.ru/media/files/Fw1kbNXVJxQ.pdf (accessed on 28 February 2025).
- Kadomtseva, M.E. System of Indicators for Sustainable Development of the National Agro-Industrial Complex. Stud. Russ. Econ. Dev. 2024, 35, 99–108. [Google Scholar] [CrossRef]
- Saak, A.A.; Gorelova, G.V. Cognitive analysis of the possibility of sustainable development of rural areas. Nat. Sci. Humanit. 2024, 5, 297–305. [Google Scholar]
- Asanova, N.A. Cognitive modeling of the quality of life in rural areas. In Proceedings of the XXVI International Scientific and Practical Conference “Systems Analysis in Design and Management” (SAEC-2022), St. Petersburg, Russia, 13–14 October 2022; Volume 3, pp. 242–245. [Google Scholar]
- Johnson, T. Methods in Rural Development: Policy Analysis; Greenwood Press: Westport, CT, USA, 1996; 248p. [Google Scholar]
- Larsson, L.; Fuller, T.; Pletsch, C. Business and Community Approaches to Rural Development: Comparing government to local approaches. J. Rural. Community Dev. 2012, 7, 152–169. [Google Scholar]
- Strijker, D.; Bosworth, G.; Bouter, G. Research methods in rural studies: Qualitative, quantitative and mixed methods. J. Rural. Stud. 2020, 78, 262–270. [Google Scholar] [CrossRef]
- Dax, T. Shaping rural development research in Europe: Acknowledging the relationships between agriculture, regional and ecological development, an enhanced research strategy supported by the ERA-NET RURAGRI. Stud. Agric. Econ. 2014, 116, 59–66. [Google Scholar] [CrossRef][Green Version]
- Lu, Y.; Zhong, B.; Fang, Q. Research on Fiscal Support for Agriculture, Green Agricultural Productivity, and the Urban–Rural Income Gap: A PVAR Approach. Sustainability 2025, 17, 5443. [Google Scholar] [CrossRef]
- Graebin, A.C.; Weise, C.; Reichardt, K.; Neto, D.D. A Sustainability Index for Agrarian Expansion: A Case Study in Mato Grosso (Brazil). Sustainability 2025, 17, 5210. [Google Scholar] [CrossRef]
- Roberts, F.S. Discrete Mathematical Models with Application to Social, Biological and Environmental Problems; Prentice-Hall: Hoboken, NJ, USA, 1976; 559p. [Google Scholar]
- Napoles, G.; Espinosa, M.L.; Grau, I.; Vanhoof, K. FCM Expert: Software Tool for Scenario Analysis and Pattern Classification Based on Fuzzy Cognitive Maps. Int. J. Artif. Intell. Tools 2018, 27, 1860010. [Google Scholar] [CrossRef]
- Isaev, R.; Podvesovskii, A. Verification of Cause-and-Effect Relationships in Cognitive Models Using Visualization Metaphors of Fuzzy Cognitive Maps. Sci. Vis. 2020, 12. [Google Scholar] [CrossRef]
- Axelrod, R. The Structure of Decision: Cognitive Maps of Political Elites; Princeton University Press: Princeton, NJ, USA, 1976; 422p. [Google Scholar]
- Kosko, B. Fuzzy Cognitive Maps. Int. J. Man-Mach. Stud. 1986, 24, 65–75. [Google Scholar] [CrossRef]
- Ginis, L.A. Methodological basis of simulation and cognitive modelling technology of socio-economic systems. J. Phys. Conf. Ser. 2020, 1661, 012035. [Google Scholar] [CrossRef]
- Langley, P. Cognitive architectures: Research Issues and Challenges. Cogn. Syst. Res. 2009, 10, 141–160. [Google Scholar] [CrossRef]
- Gorelova, G.V. Cognitive Modeling of Complex Systems: State and Prospects. Lect. Notes Netw. Syst. 2022, 442, 212–224. [Google Scholar]
- Eden, C. Cognitive Mapping. Eur. J. Oper. Res. 1998, 36, 1–13. [Google Scholar] [CrossRef]
- Atkin, R.H. Combinatorial Connectivies in Social Systems. An Application of Simplicial Complex Structures to the Study of Large Organisations, Interdisciplinary Systems Research; Springer: Berlin/Heidelberg, Germany, 1997. [Google Scholar]
- Makarova, E.L.; Firsova, A.A. Computer Cognitive Modeling of the Innovative System for the Exploration of the Regional Development Strategy. In Proceedings of the CEUR-WS Second Workshop on Computer Modelling in Decision Making (CMDM 2017), Saratov, Russia, 9–10 November 2017; Volume 2018, pp. 113–125. [Google Scholar]
- Anokhina, M. Modeling of Strategy in the Management of Economic Growth for Agriculture. In Advances in Sustainable Development and Management of Environmental and Natural Resources; Apple Academic Press: Palm Bay, FL, USA, 2021. [Google Scholar]
- Podgorskaya, S.V.; Podvesovskii, A.G.; Isaev, R.A.; Antonova, N.I. Fuzzy cognitive models for socio-economic systems as applied to a management model for integrated development of rural areas. Bus. Inform. 2019, 13, 7–19. [Google Scholar] [CrossRef]
- Christen, B.; Kjeldsen, C.; Dalgaard, T.; MartinOrtega, J. Can Fuzzy Cognitive Mapping Help in Agricultural Policy Design and Communication? Land Use Policy 2015, 45, 64–75. [Google Scholar] [CrossRef]
- Jetter, A.J.; Kok, K. Fuzzy cognitive maps for futures studies—A methodological assessment of concepts and methods. Futures 2014, 61, 45–57. [Google Scholar] [CrossRef]
- Haryono, A.; Juniarti, I.; Matajat, K.; Suroso, A.I.; Soesilo, M. Partnership Development of Smallholder Coffee Cultivation: A Model for Social Capital in the Global Value Chain. Economies 2024, 12, 349. [Google Scholar] [CrossRef]
- Tuzhyk, K.; Hewelke, E.; Hewelke, P. Dynamic simulation of sustainable farm development scenarios using cognitive modeling. Ann. Wars. Univ. Life Sci. SGGW Land Reclam 2017, 49, 43–53. [Google Scholar] [CrossRef]
- Bastan, M.; Khorshid-Doust, R.R.; Sissi, S.D.; Ahmahvand, A. Sustainable development of agriculture: A system dynamics model. Kybernetes 2017, 47, 142–162. [Google Scholar] [CrossRef]
- Chernov, I.V.; Shelkov, A.B. Scenario approach to studying the possibilities of innovative development of agriculture in modern conditions. In Proceedings of the 15th International Conference “Management of Large-Scale Systems Development” (MLSD’2022), Moscow, Russia, 26–28 September 2020; pp. 996–1005. [Google Scholar]
- Sandu, I.; Derunova, E.; Voronov, A.; Zavivaev, N. Application of fuzzy cognitive models to assess the balance of elements of the system of scientific support and commercialization of innovations in the agro-industrial complex. Sci. Pap. Ser. Manag. Econ. Eng. Agric. Rural Dev. 2024, 3, 785–790. [Google Scholar]
- Popescu, A. Considerations on the main features of the agricultural in the European Union. Sci. Pap. Ser. Manag. Econ. Eng. Agric. Rural Dev. 2013, 13, 213–219. [Google Scholar]
- Klychova, G.S.; Tsypin, A.P.; Valiev, A.R. Statistical study of spatial and temporal development of agriculture at the meso-level. Vestn. Kazan State Agrar. Univ. 2021, 4, 105–114. [Google Scholar] [CrossRef]
- Yang, Y.; Zhang, Y.; Yang, Q.; Liu, J.; Huang, F. Coupling Relationship between Agricultural Labor and Agricultural Production Against the Background of Rural Shrinkage: A Case Study of Songnen Plain, China. Sustainability 2019, 11, 5804. [Google Scholar] [CrossRef]
- Merenkova, I.; Smyslova, O.; Kokoreva, A. Development models of rural areas: Theoretical approaches and formation specificity. IOP Conf. Ser. Earth Environ. Sci. 2019, 341, 012017. [Google Scholar] [CrossRef]
- Brown, C.; Yadav, L.P.; Zhang, J.; Zhouma, D. Sustainability of Agricultural Diversity in the Farm Households of Southern Tibet. Sustainability 2019, 11, 5756. [Google Scholar] [CrossRef]
- Bisaga, I.; Parikh, P.; Loggia, C. Challenges and Opportunities for Sustainable Urban Farming in South African Low-Income Settlements: A Case Study in Durban. Sustainability 2019, 11, 5660. [Google Scholar] [CrossRef]
- Derunova, E.A. The Foundation of the Agricultural Development State Regulation. Izv. Saratov Univ. (N. S.) Ser. Econ. Manag. Law 2020, 20, 284–291. [Google Scholar] [CrossRef]
- Rahma, H.; Fauzi, A.; Juanda, B.; Widjojanto, B. Development of a Composite Measure of Regional Sustainable Development in Indonesia. Sustainability 2019, 11, 5861. [Google Scholar] [CrossRef]
- Xiao, D.; Niu, H.; Fan, L.; Zhao, S.; Yan, H. Farmers’ Satisfaction and its Influencing Factors in the Policy of Economic Compensation for Cultivated Land Protection: A Case Study in Chengdu, China. Sustainability 2019, 11, 5787. [Google Scholar] [CrossRef]
- Lazíková, J.; Lazíková, Z.; Takáč, I.; Rumanovská, Ľ.; Bandlerová, A. Technical Efficiency in the Agricultural Business—The Case of Slovakia. Sustainability 2019, 11, 5589. [Google Scholar] [CrossRef]
- Makarova, E.L.; Firsova, A.A. Cognitive Modeling the Impact of a Regional System of Higher Education in the Innovative Development of the Region. Izv. Saratov Univ. (N. S.) Ser. Econ. Manag. Law 2015, 15, 411–417. [Google Scholar] [CrossRef]
- Firsova, A.A.; Makarova, E.L.; Tugusheva, R.R. Institutional Management Elaboration through Cognitive Modeling of the Balanced Sustainable Development of Regional Innovation Systems. J. Open Innov. Technol. Mark. Complex. 2020, 6, 32. [Google Scholar] [CrossRef]
- Kulba, V.V.; Kononov, D.A.; Kovalevsky, S.S.; Kosyachenko, S.A.; Nizhegorodtsev, R.M.; Chernov, I.V. Scenario Analysis of the Dynamics of the Behavior of Socio-Economic Systems; IPU RAS: Moscow, Russia, 2002; p. 122. [Google Scholar]
- Gorelova, G. Development of the region, cognitive research. Bull. Kadyrov Chechen State Univ. 2019, 33, 49–69. [Google Scholar]
- Gorelova, G.V.; Kalinichenko, A.I.; Kuzminov, A.N. Program for Cognitive Modeling and Analysis of Socio-Economic Systems of the Regional Level, Certificate of Registration of a Computer Program RU 2018661506; Rospatent: Moscow, Russia, 2018.
- Firsova, A.; Gorelova, G.; Makarova, E.L.; Makarova, E.A.; Chernyshova, G. Simulation Cognitive Modeling Approach to the Regional Sustainable Complex System Development for Improving Quality of Life. Mathematics 2023, 11, 4369. [Google Scholar] [CrossRef]
- Gorelova, G.; Melnik, E.; Safronenkova, I. The Problem Statement of Cognitive Modeling in Social Robotic Systems. Lect. Notes Comput. Sci. 2021, 12998, 62–75. [Google Scholar]
- Makarova, E.L.; Firsova, A.A. Cognitive analysis of the structural stability for the knowledge-intensive sectors of the regional economy. Izv. Saratov Univ. (N.S.) Ser. Math. Mech. Inform. 2022, 22, 401–412. [Google Scholar]
- Casti, J. Connectivity, Complexity and Catastrophe in Large-Scale Systems; John Wiley & Sons: Toronto, ON, Canada, 1979; 216p. [Google Scholar]
- Roberts, F. Graph Theory and Its Applications to Problems of Society; Society for Industrial and Applied Mathematics: Philadelphia, PA, USA, 1978; 122p. [Google Scholar]
Disclaimer/Publisher’s Note: The statements, opinions and data contained in all publications are solely those of the individual author(s) and contributor(s) and not of MDPI and/or the editor(s). MDPI and/or the editor(s) disclaim responsibility for any injury to people or property resulting from any ideas, methods, instructions or products referred to in the content. |
© 2025 by the authors. Licensee MDPI, Basel, Switzerland. This article is an open access article distributed under the terms and conditions of the Creative Commons Attribution (CC BY) license (https://creativecommons.org/licenses/by/4.0/).