Article

Geospatial Analysis of Patterns and Trends of Mangrove Forest in Saudi Arabia: Identifying At-Risk Zone-Based Land Use

by
Amal H. Aljaddani
Department of Physical Sciences-Geographic Information Systems Program, College of Science, University of Jeddah, Jeddah 21589, Saudi Arabia
Sustainability 2025, 17(13), 5957; https://doi.org/10.3390/su17135957 (registering DOI)
Submission received: 12 May 2025 / Revised: 13 June 2025 / Accepted: 26 June 2025 / Published: 28 June 2025

Abstract

Mangrove ecosystems are crucial coastal habitats that support life and regulate the Earth’s atmosphere. However, these ecosystems face prominent threats due to anthropogenic activities and environmental constraints. For instance, the Saudi Arabian coast is particularly vulnerable to species extinction and biodiversity loss due to the fragility of the ecosystem; this highlights the need to understand the spatial and temporal dynamics of mangrove forests in desert environments. Hence, this is the first national study to quantify mangrove forests and analyze at-risk zone-based land use along Saudi Arabian coasts over 40 years. Thus, the primary contents of this research were (1) to produce a new long-term dataset covering the entire Saudi coastline, (2) to identify the patterns, analyze the trends, and quantify the change of mangrove areas, and (3) to determine vulnerability zoning of mangrove area-based land use and transportation networks. This study used Landsat satellite imagery via Google Earth Engine for national-scale mangrove mapping of Saudi Arabia between 1985 and 2024. Visible and infrared bands and seven spectral indices were employed as input features for the random forest classifier. The two classes used were mangrove and non-mangrove; the latter class included non-mangrove land-use and land-cover areas. Then, the study employed the output mangrove mapping to delineate vulnerable mangrove forest-based land use. The overall results showed a substantial increase in mangrove areas, ranging from 27.74 to 59.31 km2 in the Red Sea and from 1.05 to 8.65 km2 in the Arabian Gulf between 1985 and 2024, respectively. However, within this decadal trend, there were noticeable periods of decline. The spatial coverage of mangroves was larger on Saudi Arabia’s western coasts, especially the southwestern coasts, than on its eastern coasts. The overall accuracy, conducted annually, ranged between 91.00% and 98.50%. The results also show that expanding land uses and transportation networks within at-risk zones of mangrove forests may have a high potential effect. This study aimed to benefit the government, conservation agencies, coastal planners, and policymakers concerned with the preservation of mangrove habitats.

1. Introduction

Mangrove forests are vital ecosystems in coastal tropical and subtropical territories between the latitudes of 30° N and 30° S at the equator [1]. Climate and environmental systems play a crucial role in mangrove forests, as these factors can enhance the growth and density of forests under warm, humid, and moderately warm conditions, which thrive between brackish and saline water [2]. Mangroves are among the most productive ecosystems, benefiting the environment and society by improving water quality, stabilizing coastlines, reducing erosion, and absorbing large amounts of greenhouse gases [3]. Additionally, mangroves protect coastal areas from extreme weather events by absorbing the effects of storm surges [4,5,6]. Given the vital role of mangrove ecosystems, several agencies, policymakers, and stakeholders have emphasized the importance of preserving the ecosystem and its resources, as they significantly contribute to human well-being and environmental health.
The United Nations adopted the 2030 Agenda in 2015, outlining 17 global goals related to sustainable development, abbreviated as SDGs, which outlines a plan for the well-being of humanity and the planet. Mangrove ecosystems play a crucial role in advancing SDGs, particularly those focused on eradicating poverty and hunger by providing vital resources as mangrove ecosystems enhance food security and support sustainable agriculture. Additionally, these ecosystems contribute to clean water availability and sanitation, which are vital for human well-being. Mangrove ecosystems promote decent work and economic growth while strengthening sustainable consumption and production practices. Additionally, they help to combat desertification, mitigate climate change, and foster a peaceful, inclusive society. These contributions enhance urban sustainability and resilience, supporting the achievement of the SDGs [7]. These goals are interconnected and contribute toward maintaining a balanced ecosystem and promoting human well-being. The Global Sustainable Development Report 2023 also emphasizes the preservation of natural resources and environmental systems to effectively address several SDGs derived from the United Nations [8]. The country’s progressive direction and futuristic vision for sustainable development programs include reducing carbon emissions, increasing afforestation and land reclamation, and protecting terrestrial and marine areas throughout the country. Accordingly, studying the status of mangrove forests along the western (The Red Sea) and eastern (Arabian Gulf) coasts in Saudi Arabia is essential for achieving several SDGs globally and locally [9]. Without comprehensive automated data, efforts to protect the environment and human well-being will be hindered.
Numerous studies were conducted globally and locally to monitor mangrove habitats. The 2022 ‘State of the World’s Mangrove Report’ revealed that the global spatial coverage of mangroves reached 147,000 km2 in 2020, reflecting a loss of 11,700 km2 since 1996 [5]. Additionally, over 80 species of mangroves are found globally, among which two types are inhabited mainly by Avicennia marina and a few groups of Rhizophora mucronate across the Red Sea and Arabian Gulf coasts [10]. Regionally, a study conducted across Gulf Cooperation Council (GCC) countries covering decadal periods showed that mangrove areas of Saudi Arabia increased by 2.73 times between 1986 and 2023, accounting for 40.9% of the entire mangrove coverage in the GCC [11]. Localized studies highlighted the degradation of mangrove habitats in regions, such as Jazan, Asir, Alleith, Rabigh Lagoon, and the northern Red Sea, due to urbanization, industrialization, and contamination [1,2,10,12,13,14,15]. For instance, Raid, A. S. Y. (2011) [15] conducted Landsat and Spot 5 with ground truth in the Alleith region to detect changes in a mangrove group. This research demonstrated deterioration of the mangrove forest due to climate change and the expansion of shrimp farms. Another study conducted by Almahasheer, H. (2018) [14] aimed to examine the spatial coverage of mangroves along the coastlines of the Arabian Gulf using NDVI and Landsat images in 2017; the results varied between increased, stable with a slight increase, and rare existence in the Gulf countries. Aljahdali, M. O. et al. (2021) (Aljahdali et al., 2021) focused on Rabigh Lagoon, located on the western coasts of Saudi Arabia and computed four indices, EVI, MSAVI, NDVI, and NDMI using Landsat between 1986 and 2019 [12]. The results show that the mangrove areas in the study period varied between three phases: degradation, slow recovery, and natural regrowth.
In addition, mangrove ecosystems are crucial coastal habitats that support life and regulate the Earth’s atmosphere. However, these ecosystems face major threats due to anthropogenic activities and environmental constraints [16]. The loss and degradation of mangroves pose a major risk to coastal ecosystems and human well-being. While the impact of these changes varies globally, arid regions, such as the Saudi Arabian coasts, are particularly vulnerable, with the potential for species extension and biodiversity loss due to ecosystem fragility [10]. Thus, anthropogenic activities have a leading role in impacting mangrove ecosystems, especially the mangrove areas adjacent to land use and transportation networks, which have a significant influence on the deterioration of forests and their noticeable shrinkage, specifically when mangrove characteristics are considered such as the limited chronological age of mangroves and the small, fragmented mangrove extent. To protect mangrove forests and maintain plant health, it is vital to establish at-risk buffer zones surrounding vulnerable mangrove ecosystems to enact regulations for their protection and preservation [17].
Despite the numerous abovementioned studies on mangrove distribution along the coasts of Saudi Arabia, prominent gaps exist in the current, nationwide data on the state of mangrove forests in Saudi Arabia. Hence, this is the first national study to quantify mangrove forests area and analyze at-risk zone-based land use and transportation networks to determine the vulnerable zoning along the Saudi Arabian coast over 40 years. This study aimed to address gaps in the literature on mangrove forest distribution, deterioration, and restoration, specifically focusing on the coasts of Saudi Arabia (1985–2024) using Landsat satellite time-series data and Earth-monitoring remote-sensing techniques. The dynamics monitored land-cover change dynamics by providing valuable information and a foundation for targeted and timely conservation strategies. In addition, the output of mangrove mapping for 40 years was employed to define the vulnerability areas and classify them into three risk levels, adjacent to land use and transportation networks, considering the shorter chronological age of mangroves as well as the small intermittent areas. To the extent of our knowledge, this is the first national study that offers an encompassing overview of mangrove forests over the past 40 years. The findings aim to improve our understanding of areas experiencing degradation, restoration, or growth and will contribute to the environmental regulations and preservation required to support sustainable development and ecosystem functions.
This study intended to accomplish the following specific objectives: (1) to generate a new long-term dataset with a fine 30 m spatial resolution covering the entire Saudi coastline over the last 40 years (1985–2024); (2) to identify the patterns, analyze the trends, and quantify changes in mangrove areas; (3) to determine the vulnerability of mangrove areas and at-risk zone-based land use and transportation networks; and (4) to inform government agencies, coastal planners, and policymakers about the findings of this study in order to intensify conservation efforts, diminish degradation, protect endangered mangrove species, and preserve existing natural habitats.

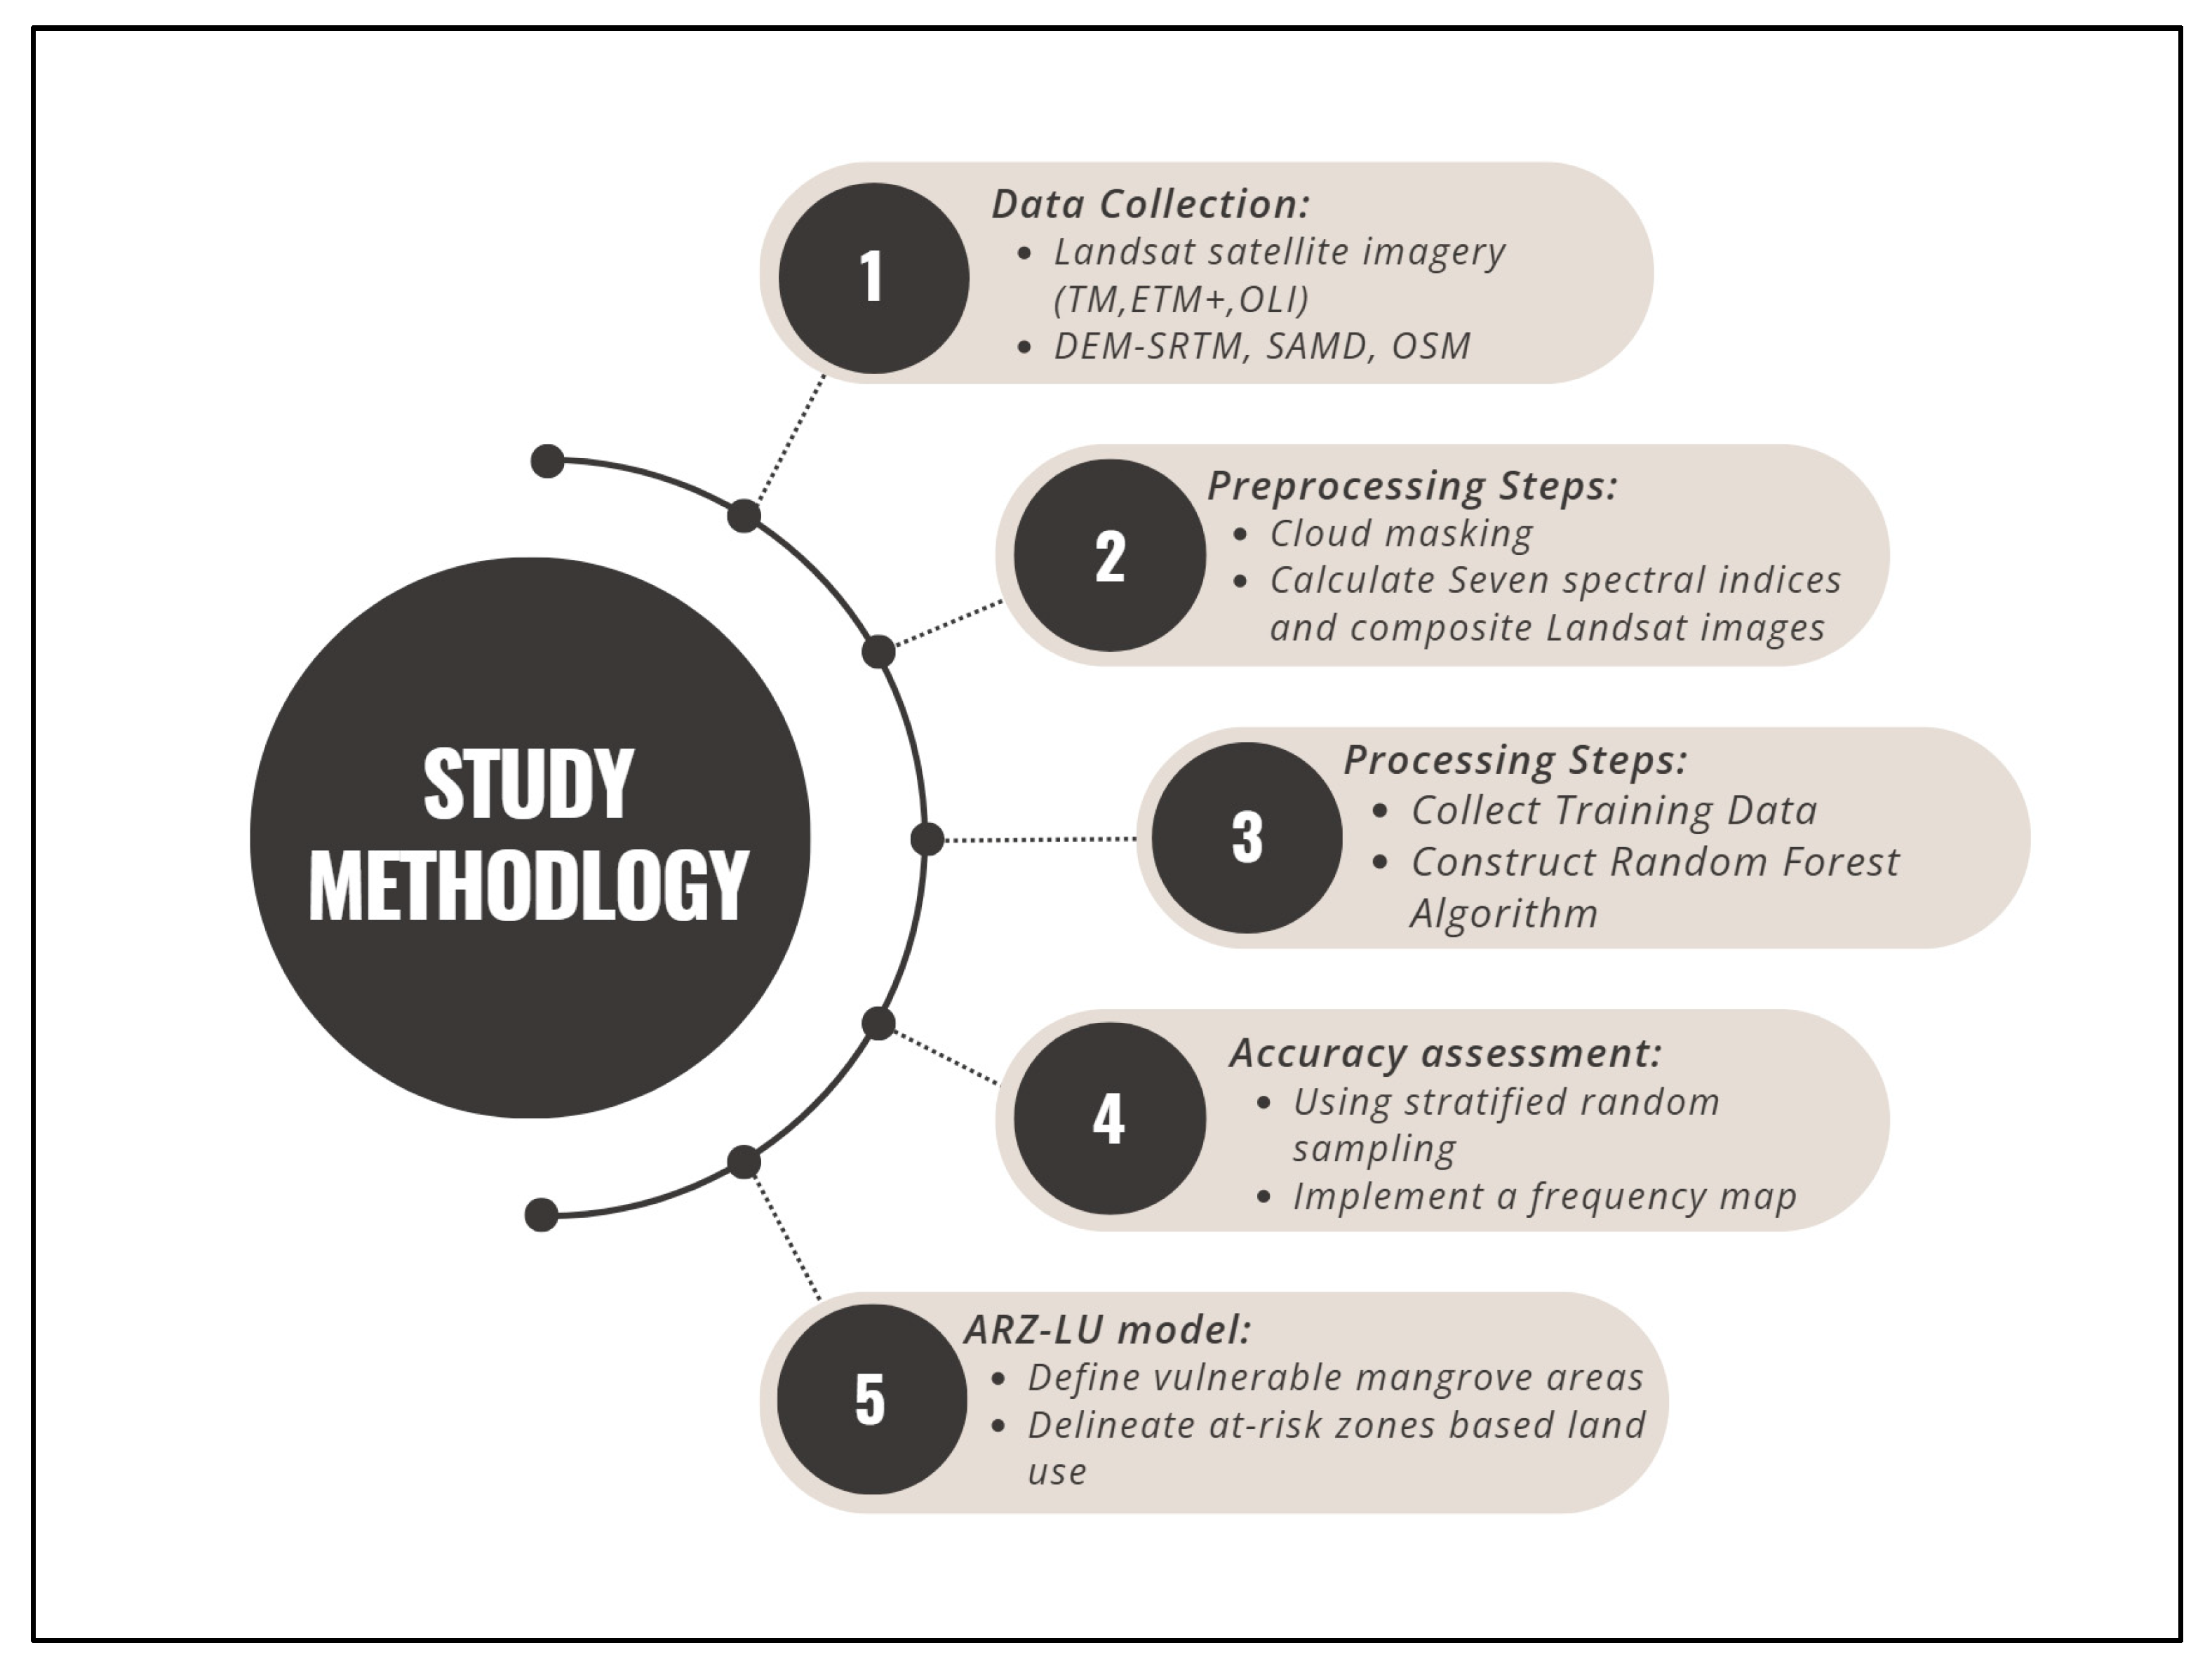
2. Study Area and Methods
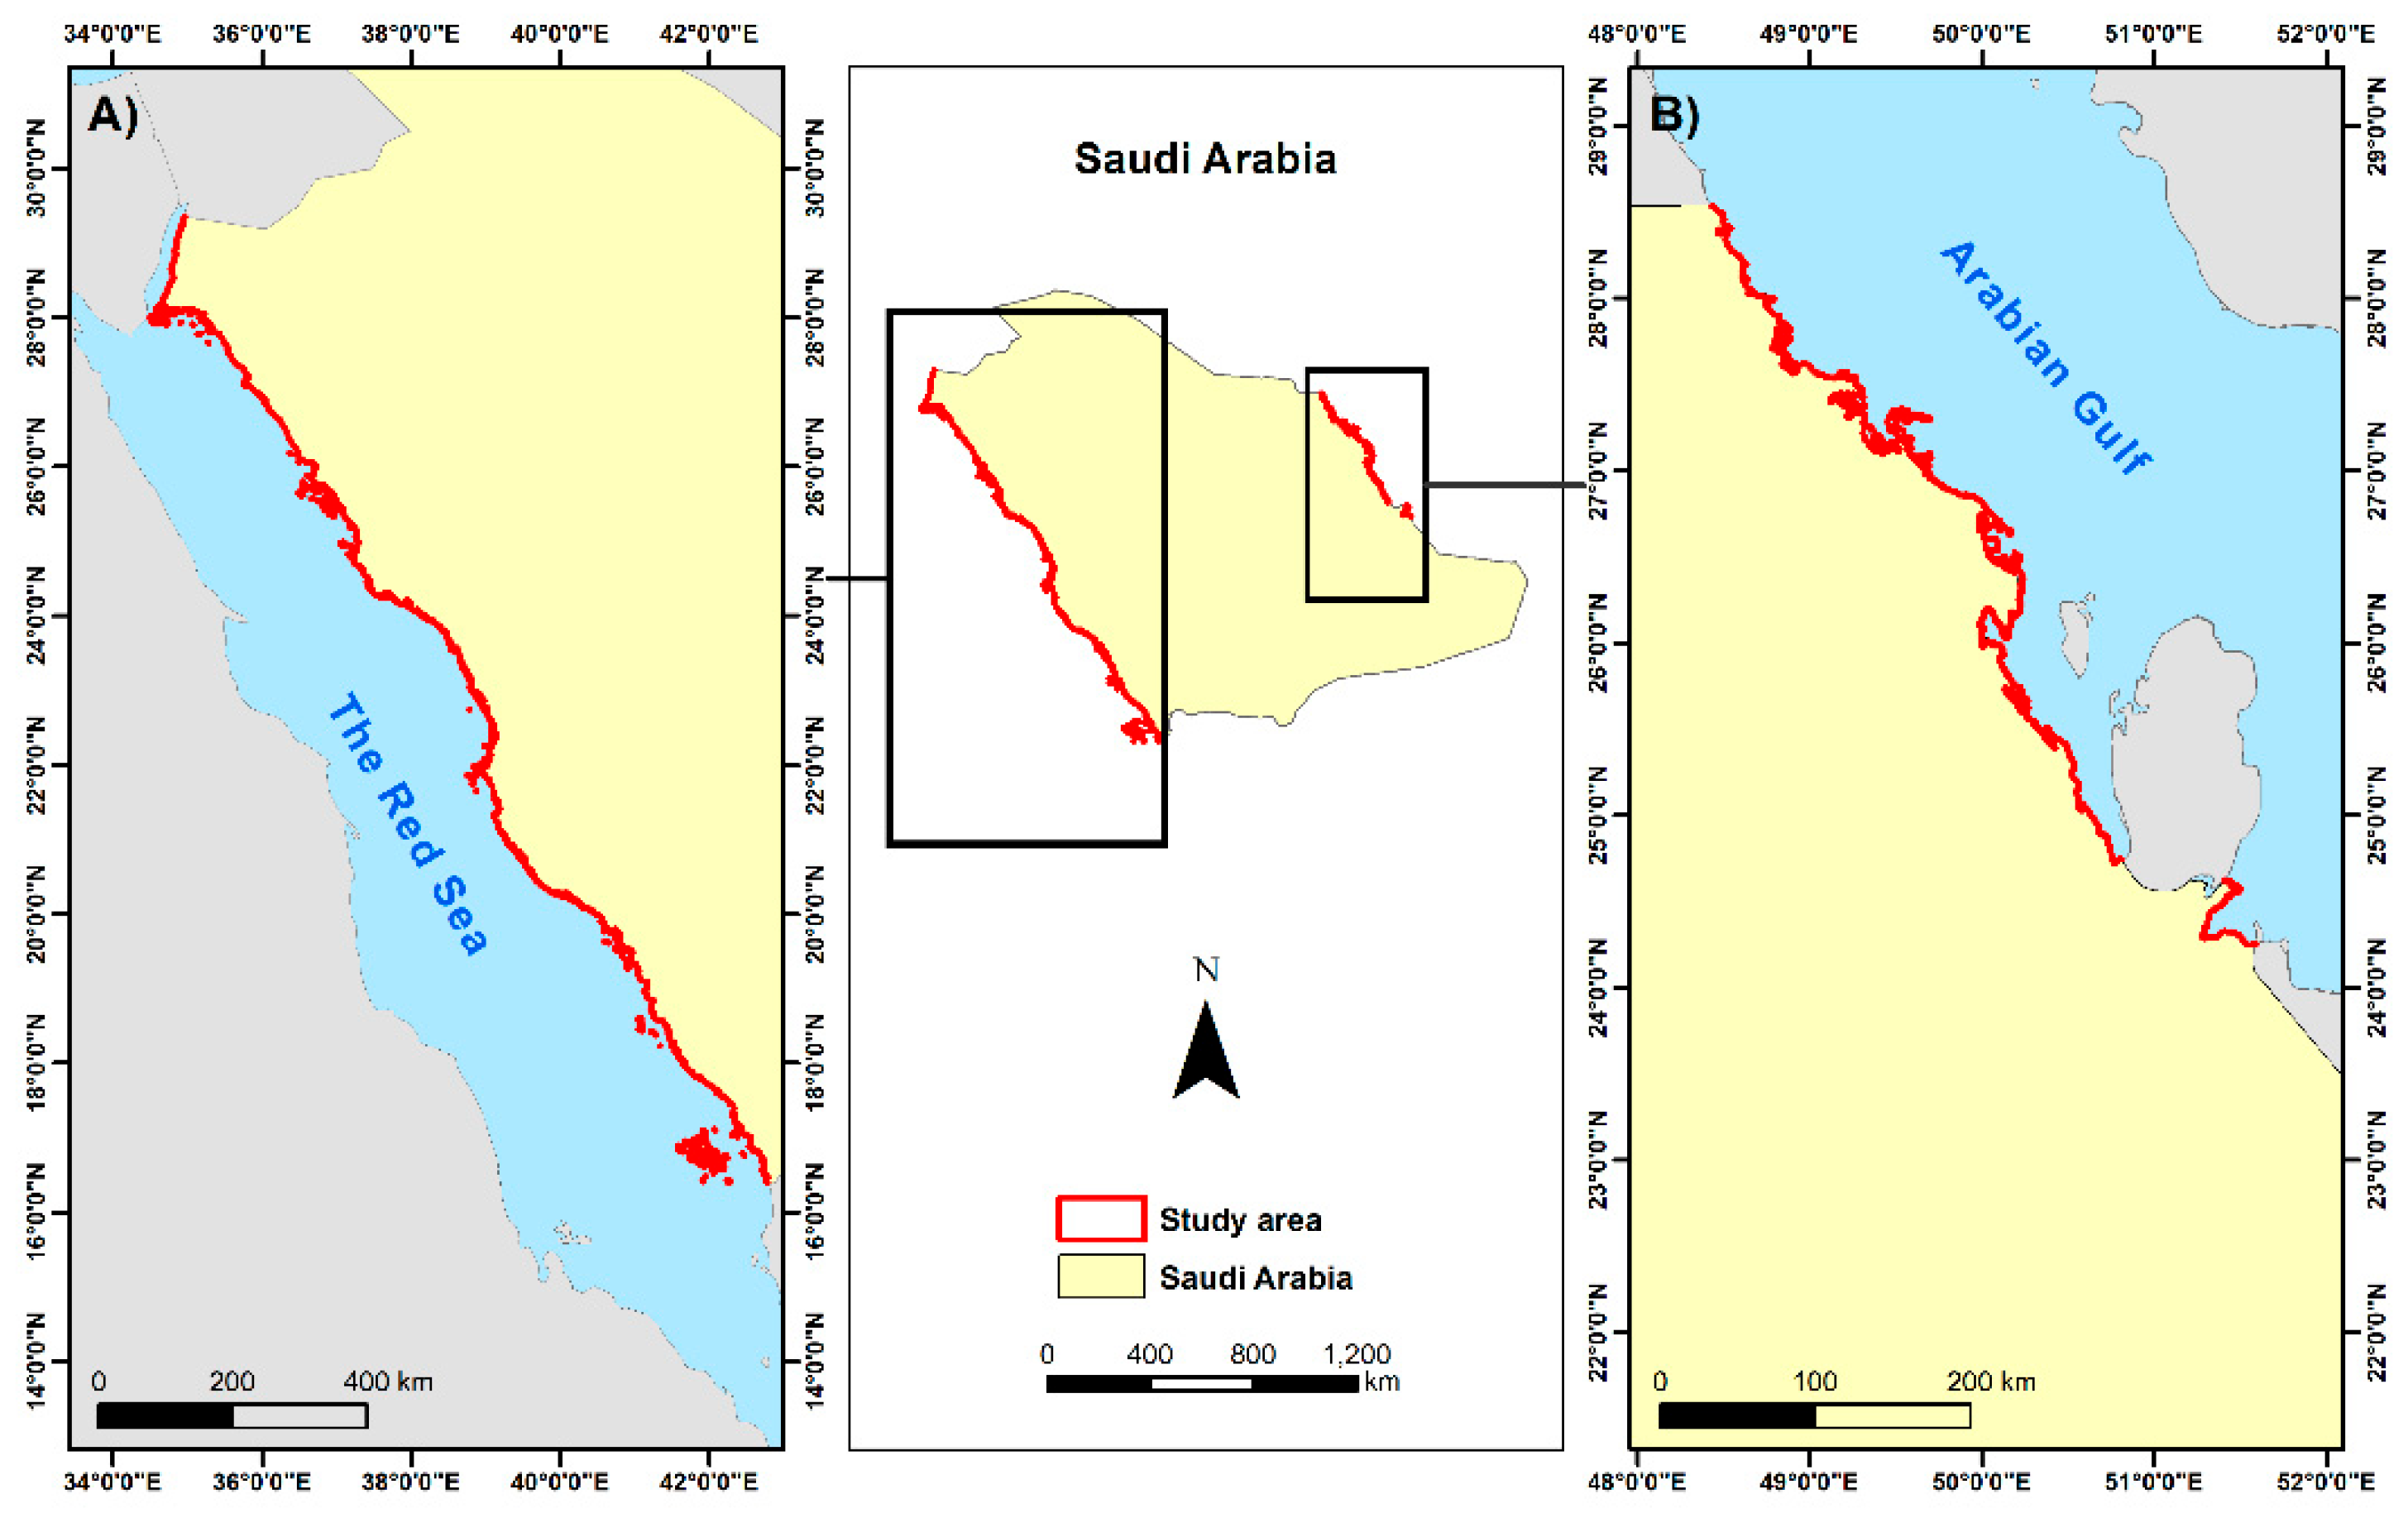
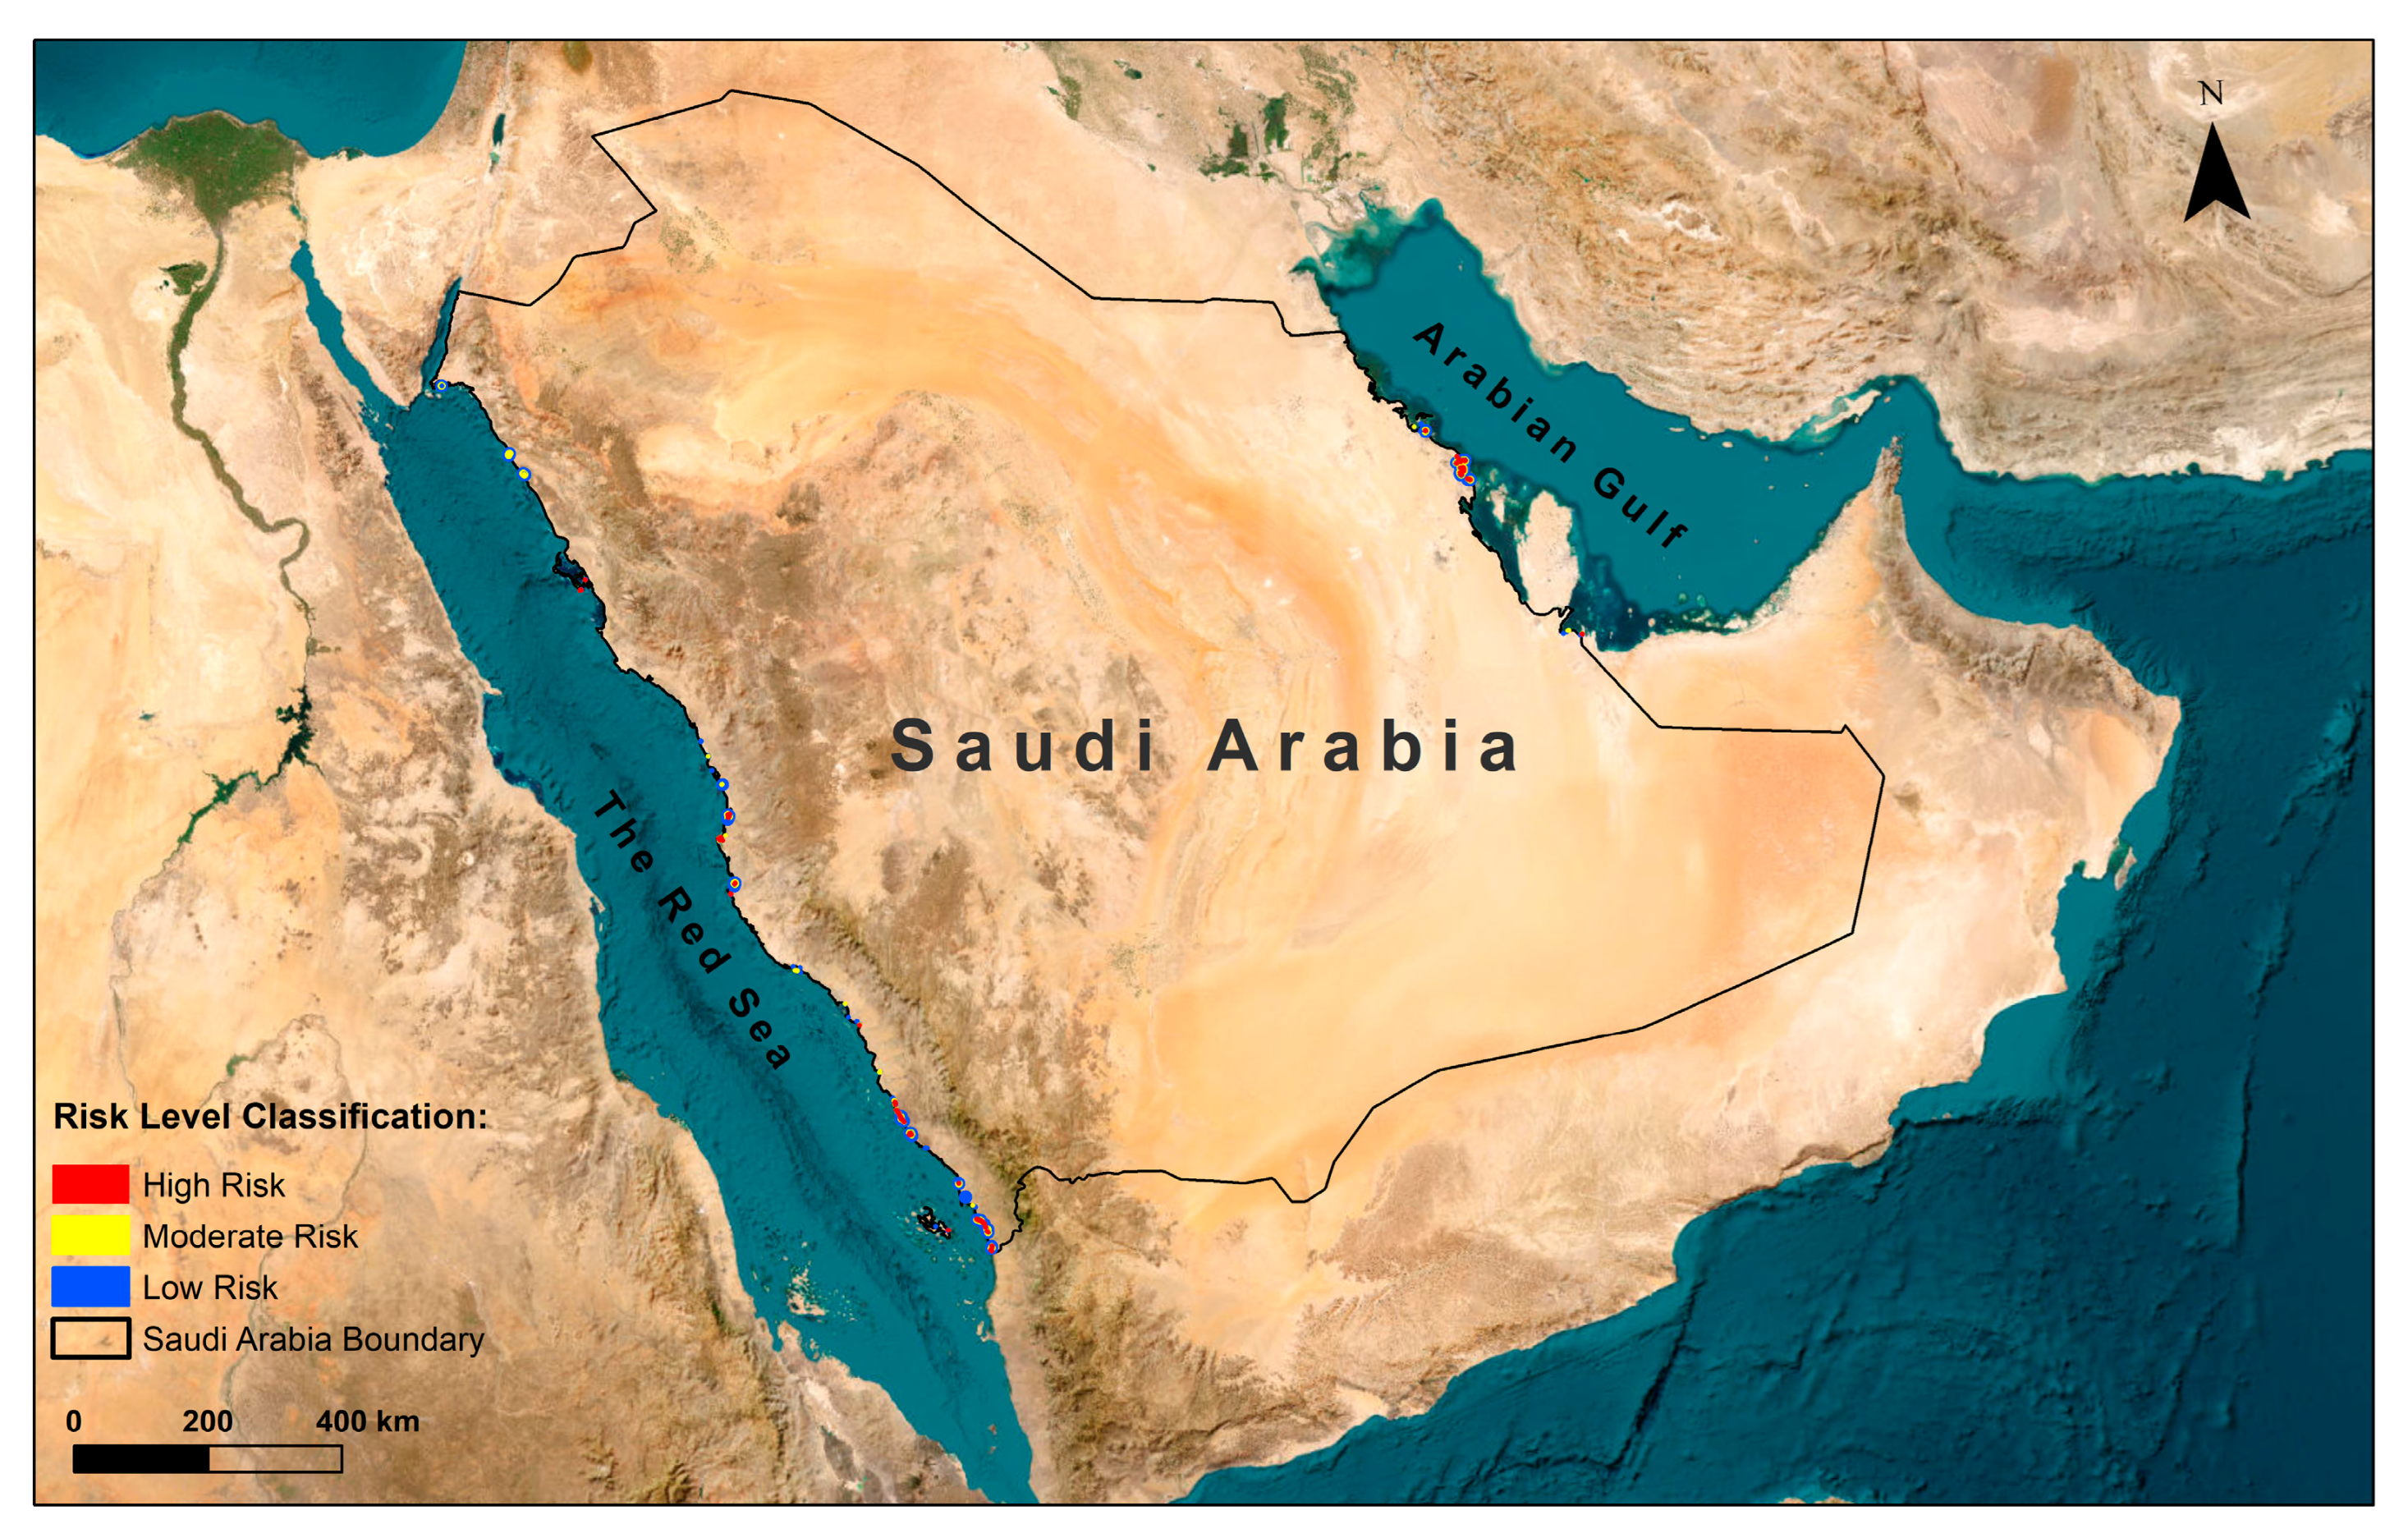
2.1. Study Area

The primary focus of this study is on the coastal territories of the Eastern and Western Kingdom of Saudi Arabia (Figure 1). The eastern coast overlooks the Arabian Gulf, which extends 560 km and comprises salt marshes and sandy areas, whereas the western coast overlooks the Red Sea. It extends approximately 1760 km and consists of sand and sedimentary rock fragments [18]. The eastern coast is situated between latitudes 23°41′ to 28°50′ North and longitudes 48°22′ to 51°29′ East. The western coast lies between latitudes 15°24′–29°52′ North and longitudes 33°54′–43°12′ East.
The coastline length in Saudi Arabia has prominently contributed to the diversity of the terrain and natural environment. Several valleys, such as Fatimah and Alhemd Wadi, are located on the western coast of the country and have external drainage into the Red Sea coast [19]. The Arabian Gulf coastal area is characterized by several marshes such as the Alryas and Aldabiah [19]. Additionally, both coasts are characterized by an abundance of bays, creeks, capes, coral reefs, and islands. Consequently, coastal areas in the east and west have diverse land uses and land covers, including developed, barren, grass, and agricultural lands, water, and forests. Mangrove forests are commonly located in coastal areas and are unevenly distributed along both coasts.
The climate of the study area is arid except for the semi-arid southwestern region of the country. During the summer, the coastal areas of the country experience temperatures ranging between 30–44 °C, whereas in winter, the temperature ranges between 15–28 °C [20]. Annual precipitation in most parts of the country is less than 150 mm, except for the southwestern region, which receives an average rainfall of 400–600 mm [21].

2.2. Data and Pre-Processing

2.2.1. Data Collection

During the mangrove mapping process, three pillars of Landsat satellite imagery were used, consisting of Landsat five (TM), seven (ETM+), and eight (OLI) for national-scale mangrove mapping over 40 years in Saudi Arabia (1985–2024). These Landsat images provided a long-term record, consistency interval, and fine 30 m spatial resolution data [22], which allowed for the detection and monitoring of mangrove localities by combining key spectral bands, particularly those that are effective for identifying vegetation areas. The spectra of the visible bands included Green (G) and Red (R); the infrared bands included Near InfraRed (NIR), and Shortwave InfraRed 1 and 2 (SWIR1 and SWIR2). In this study, we utilized the maskClouds function to identify and remove cloud- and cloud-shadow-contaminated pixels from the Landsat satellite imagery. This process was applied annually to enhance the usability of Landsat imagery, empowering an accurate process and holistic analysis of mangrove land cover mapping. In addition, Saudi Arabia has minimal cloud cover, with the skies remaining mostly clear or with lower cloud coverage, which helps in terms of the availability of Landsat images.
The elevation model (DEM) derived from the NASA shuttle radar topography mission (SRTM) dataset, with a spatial resolution of 30 m2, meaning 1 arcsecond, was utilized to outline the elevation of the mangrove ecosystems [23]. Furthermore, the global mangrove watch (GMW) shapefile dataset (version 3.0) and the 2018 mangrove distribution in Saudi Arabia (SAMD) for the 2018 shapefile dataset covering the entire coastline areas of Saudi Arabia, were obtained from the National Center for Vegetation Development, a branch of the Ministry of Environment Water and Agriculture (MEWA) abbreviated as NCVC, to develop vegetation cover and combat desertification. Both datasets effectively illustrate the spread and coverage of mangrove forests in the study area [24,25]. Administration boundary shapefile data for Saudi Arabia were obtained from the national general authority responsible for surveying and geospatial data management across the country (GEOSA) [19]. These were used to identify the boundaries of the land, inland, and marine areas of Saudi Arabia. This boundary helped to accurately pinpoint the study areas. In addition, land use and transportation network data were obtained from OpenStreetMap, which provides free geographic data [26]. The land use shapefile included different land use types, such as residential, commercial, industrial, and many others, while the transportation network included primary, secondary, and tertiary roads. Both data helped with the further spatial analysis of identifying at-risk buffer zones of vulnerable mangrove-based land use.

2.2.2. Pre-Processing of Mangrove Mapping

Mangrove mapping required preprocessing steps that is essential to ready the Landsat images for classification process. Here, each surface reflectance dataset from Landsat 5, 7, and 8, Collection 2, Level 2, Tier 1 was processed, which included cloud masking, computing different spectral indices, image compositing, temporal filtering, and applying masks according to elevation and index thresholds. This research used the Google Earth Engine (GEE), which is a robust platform based on cloud computing developed for large-scale processing and analysis of spatial and temporal data [27]. Masking clouds and cloud shadows were the first pre-processing step in order to mitigate the effect of cloud coverage and shadows on dense Landsat images, which is essential for distinguishing the vegetation regions from other land cover types in the imagery. For Landsat 7 data (ETM+), the scan line corrector (SLC) issue was resolved by utilizing a gap-filled imagery algorithm.
Further, the Landsat images were used for processing the spectral indices that distinguish mangrove forests from other types of vegetation. Hence, seven multispectral indices typically were computed and used for mangrove detection (Table 1). The following indices were used: (1) the most widely used index in evaluating the health of vegetation by analyzing chlorophyll levels is the normalized difference vegetation index (NDVI), the output values extend between +1 and −1, which represent higher values indicating healthy vegetation and lower values indicating degraded vegetation [28]; (2) The normalized difference mangrove index (NDMI) index was formulated to spotlight the spectral variations differentiating mangrove habitats from those of the other vegetation types by utilizing the two reflectance bands, i.e., Green and SWIR2 [29]; (3) The modified normalized difference water index (MNDWI) index was is computed using the reflectance bands of Green and SWIR1, enhancing the reflectance of water bodies while reducing land interference, thereby effectively differentiating between water and land [30]; (4) Band ratio 54 was computed using SWIR 1 divided by the NIR band; (5) Band ratio 35 was computed by dividing the Red band by SWIR 1; (6) The simple ratio, was used to identify the greenness of the study areas, which is based on the divided near infrared (NIR) by the Red band [31,32]; and (7) The green chlorophyll vegetation index (GCVI), a green vegetation monitoring index responding to the chlorophyll level of concentration in greener vegetation, was also used [33].
A Landsat image composite was generated utilizing the “median reducer” function, followed by a multi-step masking process. The masking process for defining the best threshold for the elevation, NDVI, and MNDWI data prioritized defining potential mangrove forest locations. After examining the study areas, the best thresholds for the NDVI index and MNDWI were found to be greater than 0.1 and −0.50, respectively. The former was used to distinguish mangrove areas, while the latter was used to differentiate between land and water bodies. In addition, SRTM elevation data were used to mask areas below 20 m because regions above this elevation are not typically associated with mangrove forests. The thresholds were selected by examining the study area and using each GMW and SAMD, along with SRTM elevation, NDVI, and MNDWI data, to assess mangrove distribution and perform annual mangrove classification accurately.

2.3. Mangrove Data Processing

2.3.1. Training Data

The training data for this study were collected from Saudi Arabian coastal areas along the western coasts of the Red Sea and eastern coasts of the Arabian Gulf to train a machine learning random forest algorithm. The primary objective was to ensure that each class contained stable and consistent pixels to yield accurate classification results. The training samples were collected in a single year, 2024, because this allows for a more accurate assessment of spatial coverage without the interfering impacts of temporal variability. Additionally, we used the years between 2002 and 2024 to track and examine consistent existing mangrove coverage and ensure the other land cover types of non-mangrove class. These samples were sourced from Landsat satellite imagery, high-spatial-resolution historical aerial imagery from advanced features, and extensive satellite images through Google Earth Pro. In addition to these sources, SAMD and GMW were used to track the spatial coverage of mangroves in the study zone; 867 and 570 samples were collected from the mangrove and non-mangrove classes, respectively. The sample collection process was systematically tested and evaluated; additional samples were incorporated as necessary. The key land-use and land-cover classes in this study were “mangrove” and “non-mangrove”, with the latter class including all other classes such as developed areas, roads, agricultural lands, rangelands, shrublands, water, and barren lands (Figure 2).

2.3.2. Random Forest Algorithm for Mangrove Classification

This study utilized the machine learning random forest algorithm for mangrove and non-mangrove classification. This classifier is an assemblage learning procedure that constructs several classification trees through training. Each tree was generated using a bootstrap sample, a segment randomly extracted from the training data. At each node, decisions are made using a stochastic selection of features. These producers increase the variety among trees, which mitigates overfitting and enhances the model’s capability to generalize new data. The final classification result is determined by voting, in which the class label predicted by most trees is selected, thereby improving both the accuracy and durability of the model [34]. The random forest classifier has been widely implemented in various remote sensing fields, including agriculture, croplands, forest cover, urban studies, and land use and land cover, to enhance classification results. It produces a higher accuracy assessment compared to other machine learning algorithms such as artificial neural networks (ANN), naive Bayes, and support vector machines (SVM) [22,35,36,37,38,39,40,41]. The random forest has been applied in various environments and climate zones globally and has consistently demonstrated higher accuracy. Thus, this study focuses on mapping mangrove forests over arid and semi-arid environments using random forest over other machine learning algorithms.
The random forest classifier was used to run the model with 100 trees and five randomly selected predictors per spilt, which were selected by default using the Gini impurity criterion. The random forest function of the smileRandomForest was applied to the GEE platform to select the spectral bands and properties of the land cover. The random forest model was suited to the study area for each year between 1985–2024. The spectral bands and seven variables were used to train the model. The random forest algorithm was trained with 80% of the collected samples; 20% was used to test the model and generate the overall accuracy of the model, ensuring a higher overall accuracy. As the training samples were consistently stable, the same training samples were used every year for over 40 years between 1985 and 2024. For the post-classification process, and after the generation of the classified map, a masking process using the connectedPixelCount function was used to reduce the noise of isolated pixels and generate more pixels of connected neighbors, thereby improving the clarity and accuracy of the output of classification images, which is a vital step in generating clear and interpretable results [30,42]. Consequently, the random forest algorithm generated mangrove cover maps along the Saudi Arabian coast from 1985–2024.

2.3.3. Estimating the Accuracy for Mangrove Forest

A probability sampling design and stratified random sampling were implemented, allowing for the accuracy of annual mangrove classification maps to be assessed [43]. The strata and methods used here followed those described previously [22]. The strata were outlined according to the inherent categories of the classification map and arranged into three primary groups: “probable change”, “stable mangrove”, and “stable non-mangrove”.
We classified each stratum using a frequency map derived from the superimposition of all annual classification maps for the Saudi Arabian coastal areas along the western coasts (the Red Sea) and eastern coasts (Arabian Gulf) between 1985–2024. The “stable mangrove” stratum can be labeled if a pixel on all 40 maps is categorized as mangrove. The “stable non-mangrove” stratum can be labeled if a pixel on all 40 maps is categorized as non-mangrove. The third stratum of “probable change” can be labeled if a pixel on all 40 maps is categorized as probable change. A random selection of 50 pixels was made for the stable mangrove stratum, 50 for the stable non-mangrove stratum, and 100 for the probable change stratum. As a result, 200 pixel locations and 8,000 pixel-year data samples were available for analysis over 40 years, spanning from 1985 to 2024 (Figure 3). Historical aerial images from Google Earth Pro and Landsat were assessed and interpreted to acquire reference information. Various Landsat color combinations, including, although not limited to, false—(red, green, and blue) and true—(SWIR-1, NIR, and Red) color composites were used, which facilitated spectral separation and improved visual interpretation, allowing us to distinguish between the mangrove class and other land-use and land-cover classes. Sample pixels were overlaid onto Google Earth Pro images categorized with high spatial resolution to facilitate the interpretation of each location. While assessing annual classifications, we labeled the reference sample pixels as belonging to either the mangrove or non-mangrove classes for each year. We computed standard accuracy assessment methods based on the error matrix Jenness and Wynne [44] reported. The three main accuracy assessments, consisting of the overall accuracy, user and producer accuracies were computed, as well as the two errors estimations, including commission and omission errors. Additionally, summary statistical methods, including the Kappa coefficient and F1 score, were used to measure the quality of the classification maps; the values ranged from 0 to 1, indicating the worst to the best, respectively. All computations were based on the error matrix and were performed 40 times for each year between 1985 and 2024 during the assessment of the annual classification maps. To validate the change map, the reference samples were categorized into one of three types according to each category of the pixels over 40 years: stable mangrove, stable non-mangrove, and mangrove change (which signified either mangrove gain or mangrove loss from 1985 to 2024).

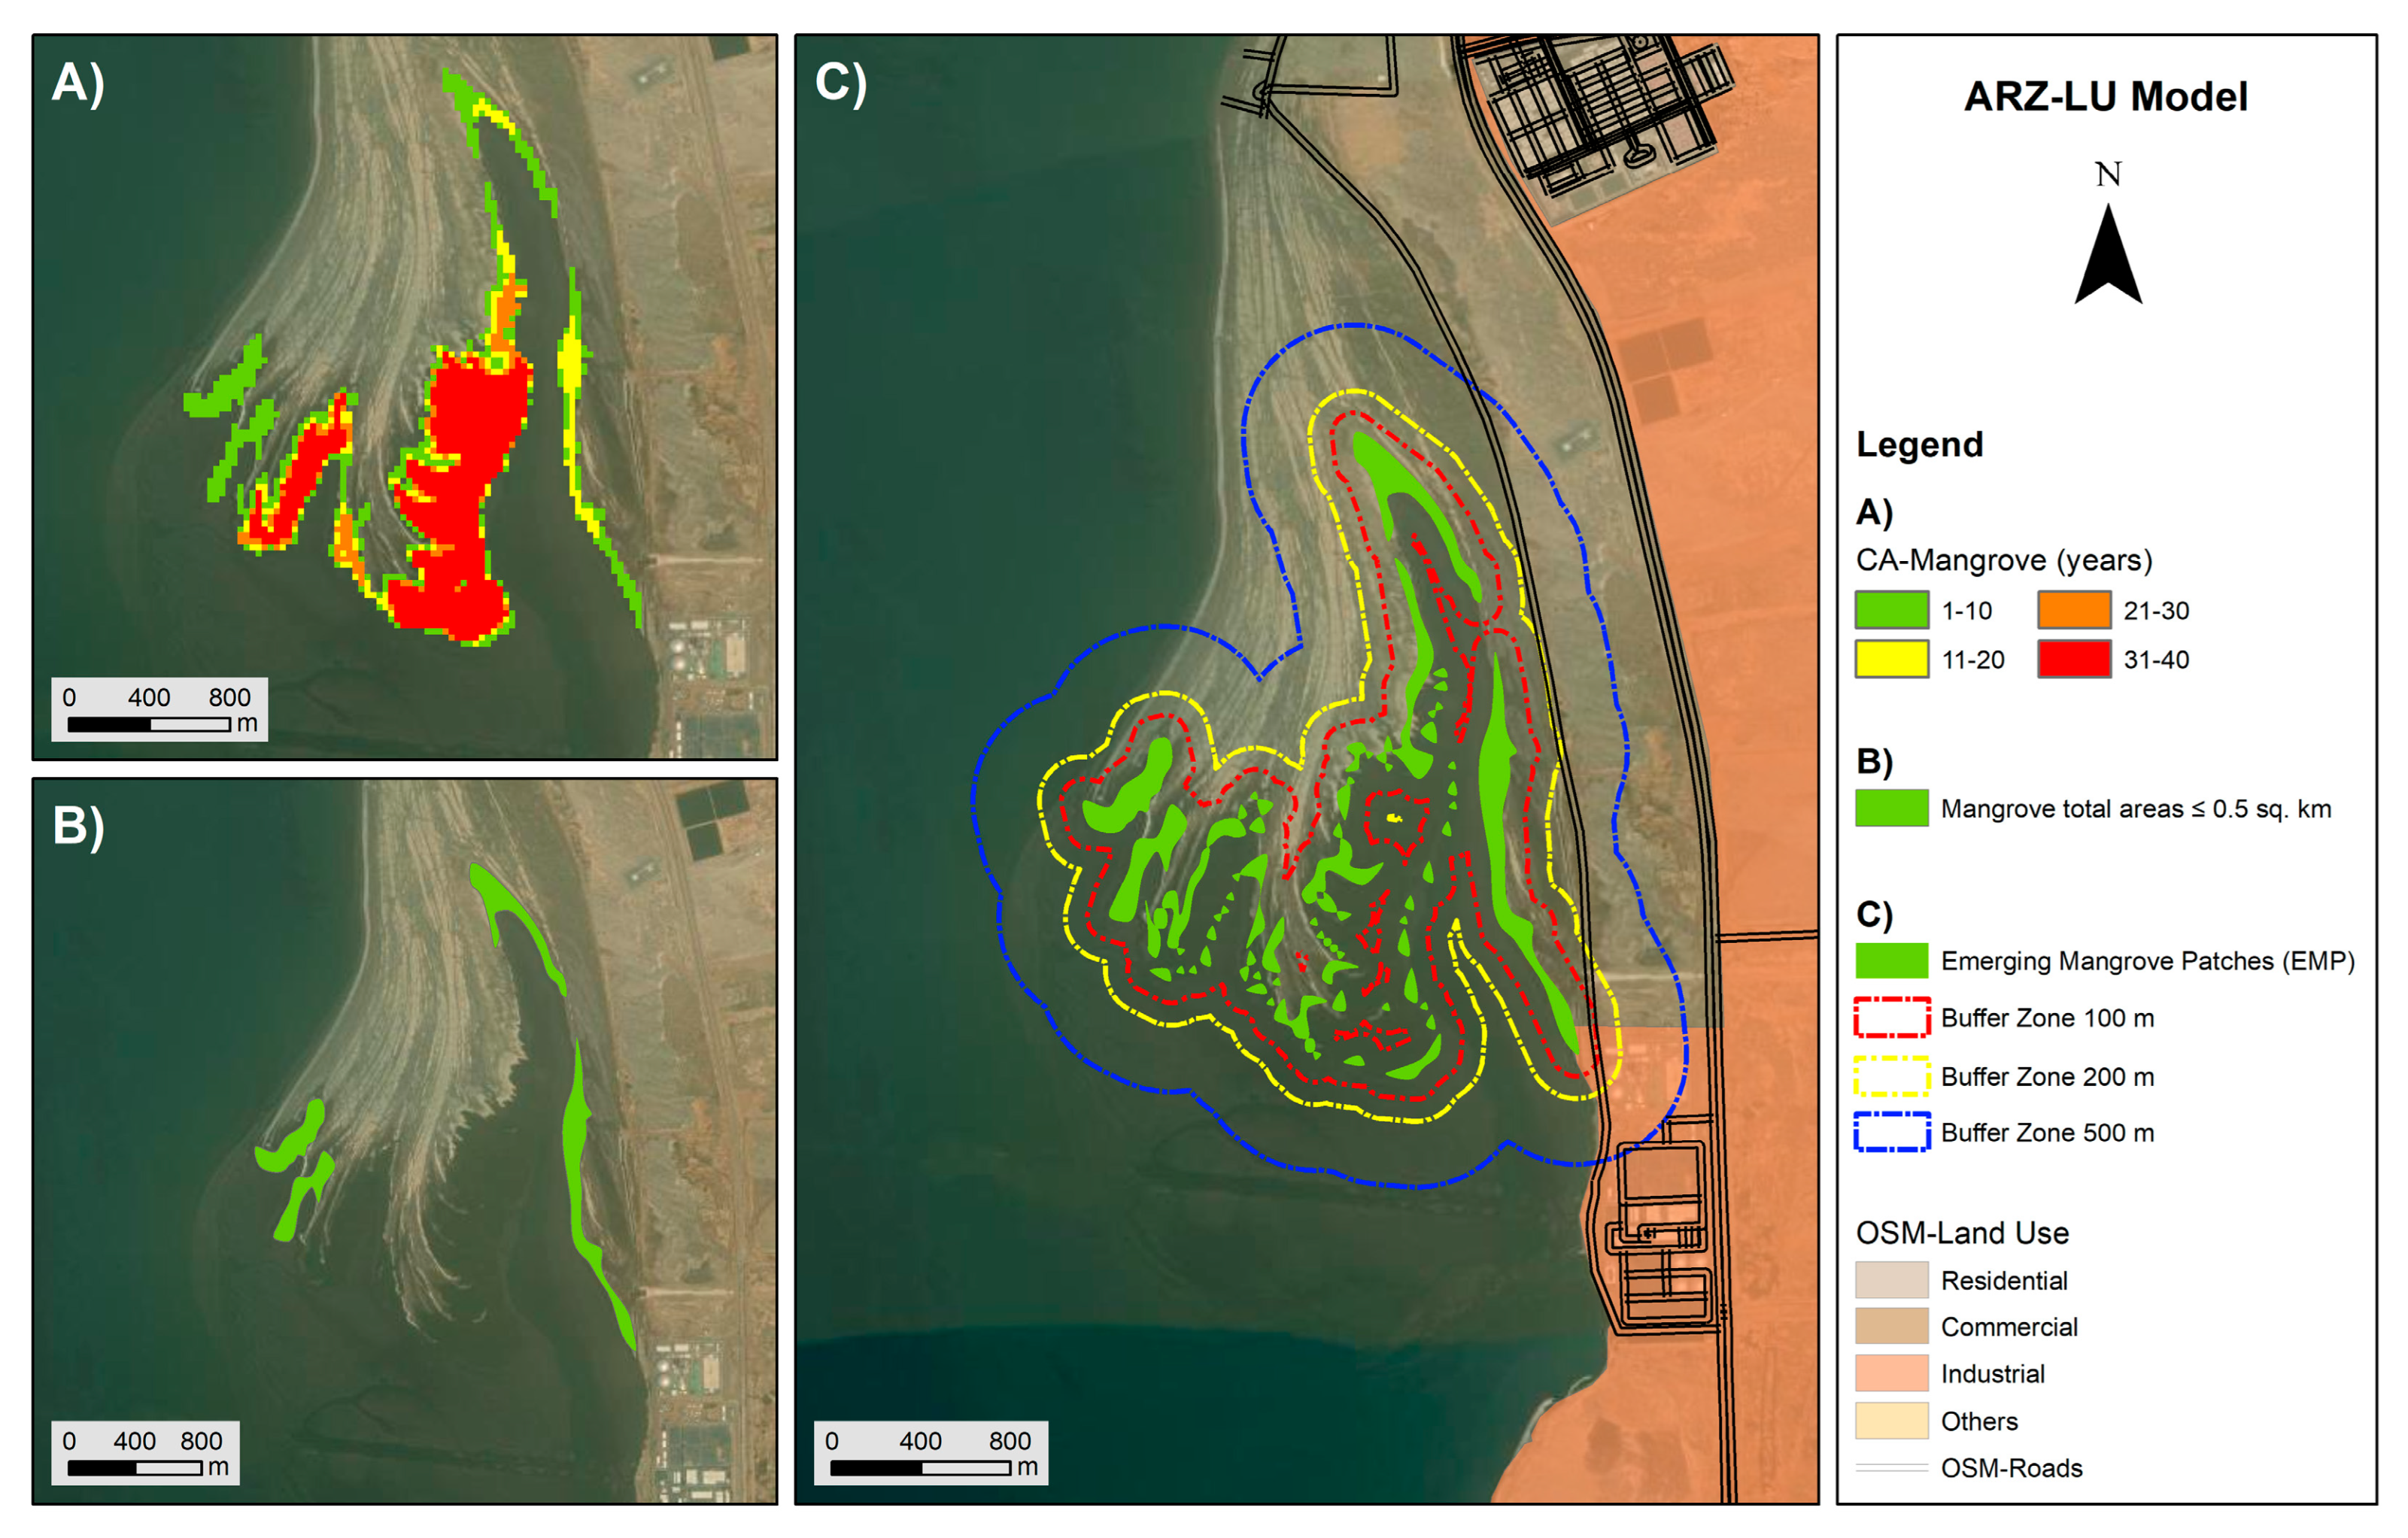
2.4. At-Risk Zone-Based Land Use (ARZ-LU) Model

Saudi Arabia is located in an arid and semi-arid environment, which impacts the density and distribution of the mangrove forests along the coasts of Saudi Arabia. In this study, mangrove forests in Saudi Arabia were characterized by their small, isolated, and scattered distribution as well as the limited lifespan of mangrove trees within the study period (40 years). Thus, the innovation of this study was to develop an At-Risk Zone-Based Land Use (ARZ-LU) model that aims to identify and understand the vulnerable mangroves (VM) and delineate at-risk zones based on land use and transportation networks. The VM can be determined by specifying the two main factors: the chronological age of mangrove forests (CAMF) (years), and the mangrove area. The CAMF refers to the age of the mangrove in each pixel, for 40 years, based on the mangrove status in this study. Specifically, any pixels with less than or equal to 20 years were considered vulnerable where the encounter declined. The term “age” refers to the time period of mangrove growth during the study period. The mangrove area along the coasts of Saudi Arabia was mostly under 1 km2, 0.5 km2, and under (≤0.5 km2) were determined as small, intermittent, and isolated patches and was used in this model. The threshold for vulnerable mangroves was chosen based on ecological studies in the literature indicating that the ecological function can be decreased in small patches of habitat, making the habitat more sensitive to degradation and species decline. Pellegrini et al. (2009) demonstrated that the ecosystem of mangrove forests, which are limited to sub-kilometric areas, is more vulnerable when exposed to human activities and environmental constraints [45]. Another study conducted by Bodin et al. (2006) in southern Madagascar, draws attention to the fact that removing small patches of forest contributes significantly to the decline of essential ecosystem services [46]. These observations support the use of a threshold of ≤0.5 km2 to specify vulnerable areas in our model.
Then, the CAMF and mangrove area layers were combined to form a single layer; these characteristics were a proxy of sensitive and vulnerable mangrove areas. In this model, the land use and transportation networks (LU-TN) model was used to define the area adjacent to or intersect with CAMF and the mangrove areas. While examining and observing the vulnerable mangroves, the study delineated three at-risk dissolved circular buffer zones: 100 m, 200 m, and 500 m. These distances were selected based on the needs of the vulnerable mangrove. The first vulnerable buffer zone is the 100 m vulnerable buffer zone, which aligns with the recommendations for urgent protection zones, and can capture the primary protective functions of mangrove forests against the influence of natural or human factors [47]. The second vulnerable buffer zone is the 200 m zone, which serves as an intermediate zone where the influence of mangroves begins to diminish. However, it still plays a significant role in biodiversity and the ecosystem. The third vulnerable buffer zone is the 500 m, which represents a broader area encompassing potential indirect impacts that can affect the mangrove health over time such as land use and land cover change, water quality degradation, pollution, and habitat fragmentation. Each at-risk buffer zone represents the degree of at-risk zones adjacent to/intersecting with land use and transportation, ranging from 100 m (high at-risk) to 200 m (moderate at-risk) and 500 m (less at risk but still at risk). Additionally, the land use and transportation networks intersected with each of the three buffer zones to identify the three risk level classifications: high, moderate, and low risk. Figure 4 summarizes the study methodology to illustrate the sequential stages from data collection to the ARZ-LU model.

3. Results

3.1. Accuracy Assessment for the Annual Classification Maps

The evaluation of user and producer accuracy and overall classification accuracy revealed consistently high performance levels throughout the study. The accuracy of the user for the mangrove class ranged between 91.43–97.33%, whereas the accuracy of the producer varied between 89.62–96.05%. For the non-mangrove class, the accuracy of the user ranged between 88.78–97.60%; the accuracy of the producer spanned between 92.55–98.43%. The overall classification accuracy during the study period ranged between 91.00–97.50% (Table 2). An additional statistical summary for the Kappa coefficient and F1-score was computed annually over 40 years (1985–2024), with results generated from the error matrix of the classification. The accuracy metrics generally remained above 0.80 throughout the years, indicating a substantial and almost perfect agreement. The Kappa coefficient ranged between 0.80–0.97, indicating a moderate to strong agreement. The F1-score altered between 0.89 and 0.97 during the study (Table 2). These results are in agreement with, and converged on, another study conducted by Mohan et al. (2024) [11], which reported the accuracy assessment for user’s and producer’s accuracy from 2003 to 2023, as well as the F1-score and Kappa coefficient, from 1986 to 2023, with values mostly above 80%.
Additionally, the errors in the multitemporal mangrove change map derived from the samples were quantified and evaluated. Generally, the accuracy of the change-detection map was significantly high. The accuracies of the user and producer varied between 83.92% and 94.00%, respectively. The accuracy of the user of the mangrove class was 87.00%, the lowest compared with that of the others, whereas the non-mangrove class was the highest, i.e., 94.00%. The accuracy of the producer was between 83.92% and 93.54% for the non-mangrove and changed classes, respectively, representing a higher accuracy assessment. Even with the variation in accuracies of the user and producer, the overall accuracy for the three classes reached (90.00%) (Table 3).

3.2. Characteristics of Mangrove Classification Results

The spatial and temporal distributions of mangrove classification maps along the Red Sea and Arabian Gulf coasts were generated using a random forest classifier during the study period (1985–2024). The trend of mangrove forests exhibits a non-linear pattern over time, characterized by three main phases: gradual growth, intermittent decline, and accelerated growth, as shown in Figure 5. Although the trend exhibited a non-linear growth pattern, a generally positive trend was dominant along the western coasts (the Red Sea) and eastern coasts (Arabian Gulf), as well as in the total mangrove areas. In addition, some areas showed fluctuations between decreasing and increasing over the 40 years, as shown in Figure 6. This figure presents classification maps providing three examples: two in the Red Sea and one distributed along the Arabian Gulf. In the Figure, each example represents land cover change, including four main classes: stable mangrove, stable non-mangrove, mangrove loss, and mangrove gain between 1985 and 2024 in the western example, while the eastern example represents changes between 2003 and 2024. The two examples distributed along the Red Sea were in the middle and southern Red Sea; all areas of the mangrove forests showed steady and substantial increases from 1985–2024, as shown in (Figure 6B,C). Compared with those in the Arabian Gulf, which initially had no mangrove areas before 2003, the mangrove areas started growing in 2003 and were concentrated in the middle of the eastern coasts of Saudi Arabia (Arabian Gulf) and continued to grow until 2024 (Figure 6D).
Table 4 represents the mangrove land cover transition matrix and is divided into four main categories: stable mangrove, mangrove loss, mangrove gain, and stable non-mangrove. Location B has the lowest percentage of mangrove gain, at about 2.945%, compared with Location C, which has 9.638%. Location D has the most significant increase among the other locations, at about 11.334%. The increase over 40 years in these three locations (B, C, D) specifically, and to Saudi Arabian coasts in general, is due to the natural and human-driven causes that helped to increase the mangrove forest such as sediment deposition, sea level stabilized, natural propagation, and mangrove reforestation, afforestation projects, and conservation policies. Generally, mangrove loss varied slightly and was lower in three locations. In Location B, mangrove loss was lower, at 0.091%, compared with other locations (C, 1.492%, and D, 0.408%). Losing mangroves in locations B and C, which are to the side of the Red Sea, could be a natural cause of mangrove loss, while the loss of mangroves in location D, on the urban side, is clearly due to human-driven causes such as urban development.
The annual mangrove areas were quantified across the Saudi Arabian coast along the coasts of the western coasts (the Red Sea) and the eastern coasts (Arabian Gulf) from 1985 to 2024. The analysis was conducted for the Red Sea, Arabian Gulf, and the total area over the study period. Overall, mangrove coverage consistently increased in the Red Sea region; it has a significantly larger mangrove area than that of the Arabian Gulf over the past 40 years, despite occasional declines in some years [2,10,13]. These declines align with a study conducted by Waleed et al. (2024) [48], which confirmed that several factors contribute to the decline in mangrove forests in the Middle East, including the accumulation of solid waste, unregulated animal grazing, habitat devastation, overtourism, and oil spills. Another interpretation of the decline in the south of Saudi Arabia is that the stress arises from natural factors such as water signation, salinity intrusion, and sediment deprivation [49]. In 1985, the mangrove forest in the Red Sea covered 27.74 km2 or 96.35% of the mangrove total area, while the Arabian Gulf covered 1.05 km2 or 3.64%. By 2004, a slight increase in mangrove coverage was observed in both regions, with the Red Sea and the Arabian Gulf expanding by 32.43 km2 (89.36%) and.86 km2 (11.89%), respectively. By 2024, the mangrove area exhibited a substantial increase compared with that in 1985 and 2004. The Red Sea mangrove coverage increased to 59.31 km2 (87.27%), whereas the Arabian Gulf reached 8.56 km2 (12.72%) of the total area. When comparing mangrove coverage between 1985 and 2024, the Red Sea exhibited a twofold increase from 27.74 km2 to 59.31 km2 with larger coverage, whereas the Arabian Gulf increased by eight times, from 1.05 to 8.56 km2 in 1985 and 2024, with smaller coverage. The mangrove areas along the Saudi Arabian coasts of both the Red Sea and Arabian Gulf reached 67.95 km2 and 28.79 km2 in 2024 and 1985, respectively (Table 5 and Figure 6).

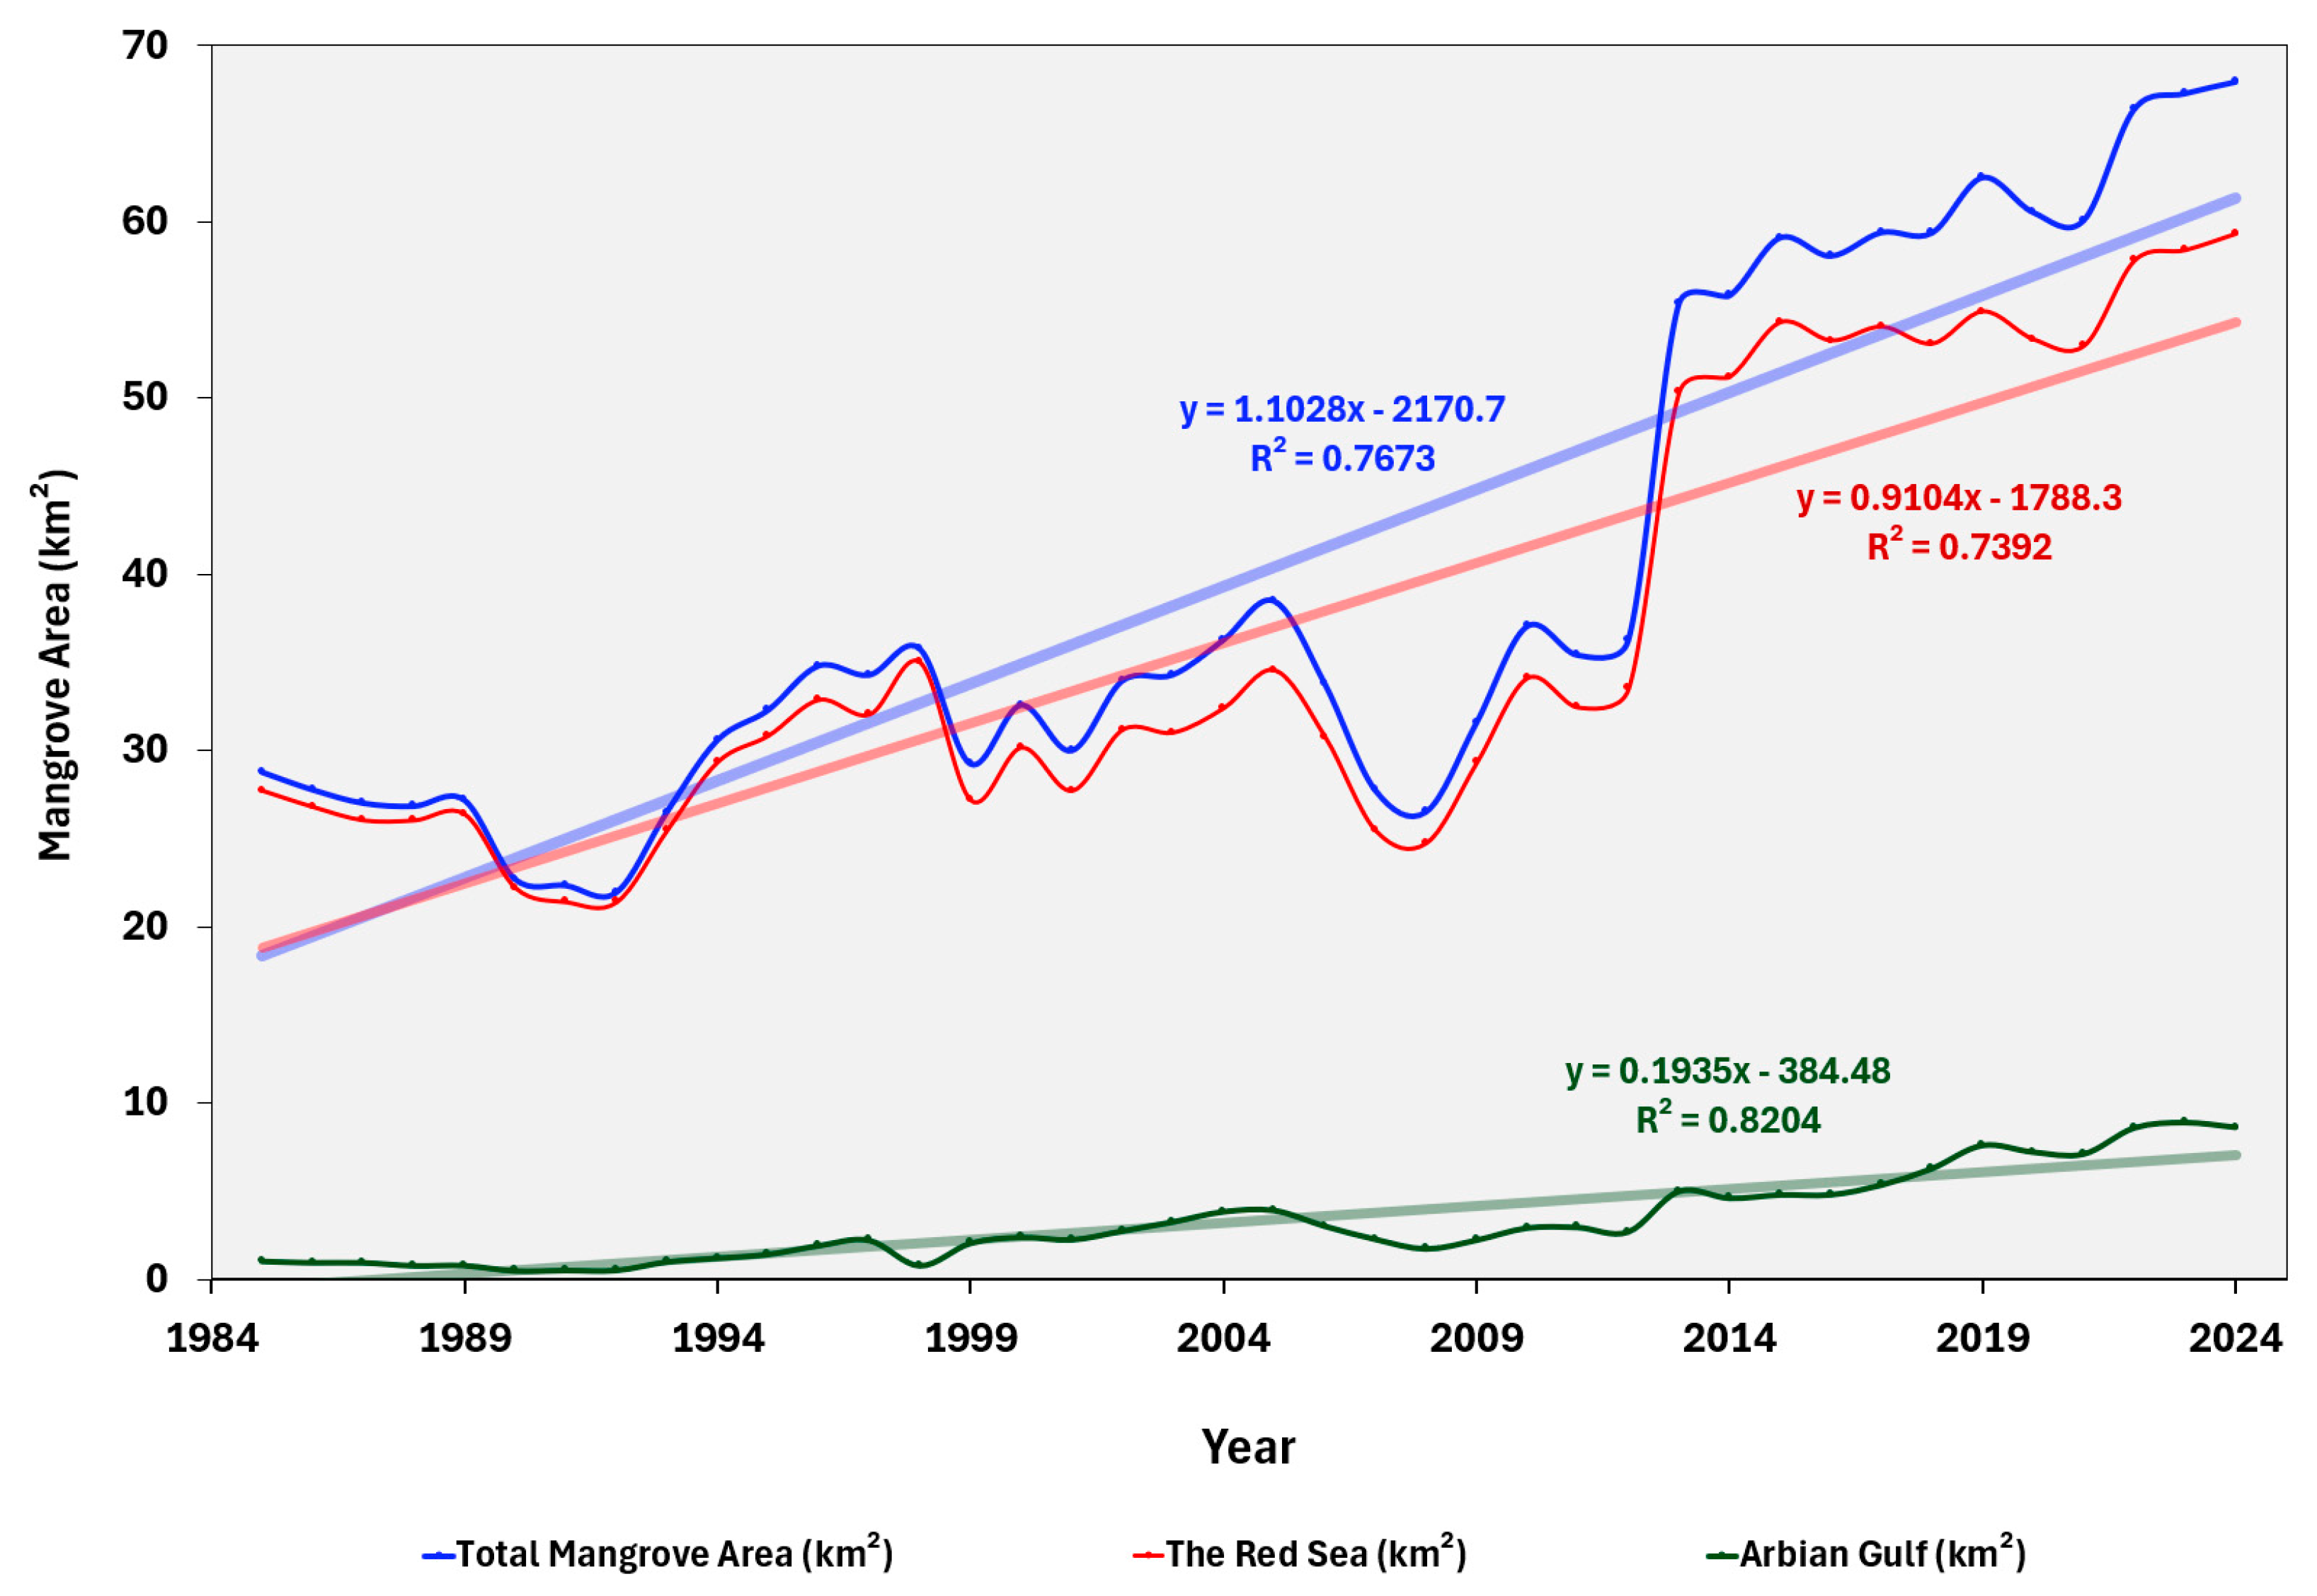
3.3. Multitemporal Mangrove Cover Change

The time-series change map represented four locations: three distributed in the Red Sea and one along the Arabian Gulf (Figure 7). As mangroves are primarily concentrated along the Red Sea, with fewer mangroves in the Arabian Gulf, three examples were provided from the Red Sea coasts and one example was provided from the Arabian Gulf. For mangrove loss, we provided two examples located on the Red Sea coasts, representing 1985, 2004, 2015, and 2024. The years were chosen to represent different time periods, illustrating the changes that occurred during these specified periods (Figure 7B,C). The changes that occur in locations B and C are due to animal grazing, local resource use, and aquaculture. Examples D and E show a significant increase during the study period; the overall trend shows mangrove coverage at these two locations with a small percentage of mangrove loss. These two examples represent central Red Sea coast locations. A decline in mangrove forests occurred in the dominant mangrove forests along the coast of Saudi Arabia. These increases are attributed to the plantation project’s afforestation and mangrove reforestation efforts, as well as the implementation of natural resource management policies.
Figure 8 shows the mangrove and non-mangrove transition in square kilometers along the coasts of Saudi Arabia. The three examples of B, C, and D are located on the western coasts of the Red Sea, while example E is located on the eastern coasts of the Arabian Gulf. Figure 8 shows location D, which has the highest increase among other locations (21.615%) and location E, which has (5.552%). This increase represents the combined effect of natural and human factors that facilitated the expansion of mangrove habitats over the study period. On the other hand, mangrove loss is generally still the lowest compared to mangrove gain. However, location C has the highest percentage of mangrove loss (1.101%) due to shrimp farming under the National Company for Shrimp Farming (NCSF) in the Alleith region, which plays a significant role in the degradation of the mangrove habitat [15], then location B would be the second highest percentage of mangrove loss (0.883%). In addition, the change rate between the four locations varied. Location D has the highest change rate (22.033); the lowest change rate is in location B (1.721%); thus, due to the most significant amount of mangrove in location D and the limited amount of mangrove area in the location B, these played a central role in the change rate.
Table 6 shows the mangrove and non-mangrove transition over three periods: 1985, 2000, and 2024, over the western coast (the Red Sea) and the eastern coasts (Arabian Gulf). The stable mangrove in the Red Sea is larger by 14.57 km2 than the stable mangrove in the Arabian Gulf, which is equal to 0.09 km2, which reflects the amount of mangrove forests on both coasts. The mangrove gain in the Red Sea was higher compared to the Arabian Gulf. However, there was a different transition of mangrove gain in the Red Sea, which had higher values, especially the transition from non-mangrove in 1985 and non-mangrove in 2000 to mangrove in 2024, with 27.66 km2, compared to the Arabian Gulf, which has 6.88 km2. Thus, the most dominant and larger area of mangroves is in the Red Sea compared with the Arabian Gulf.

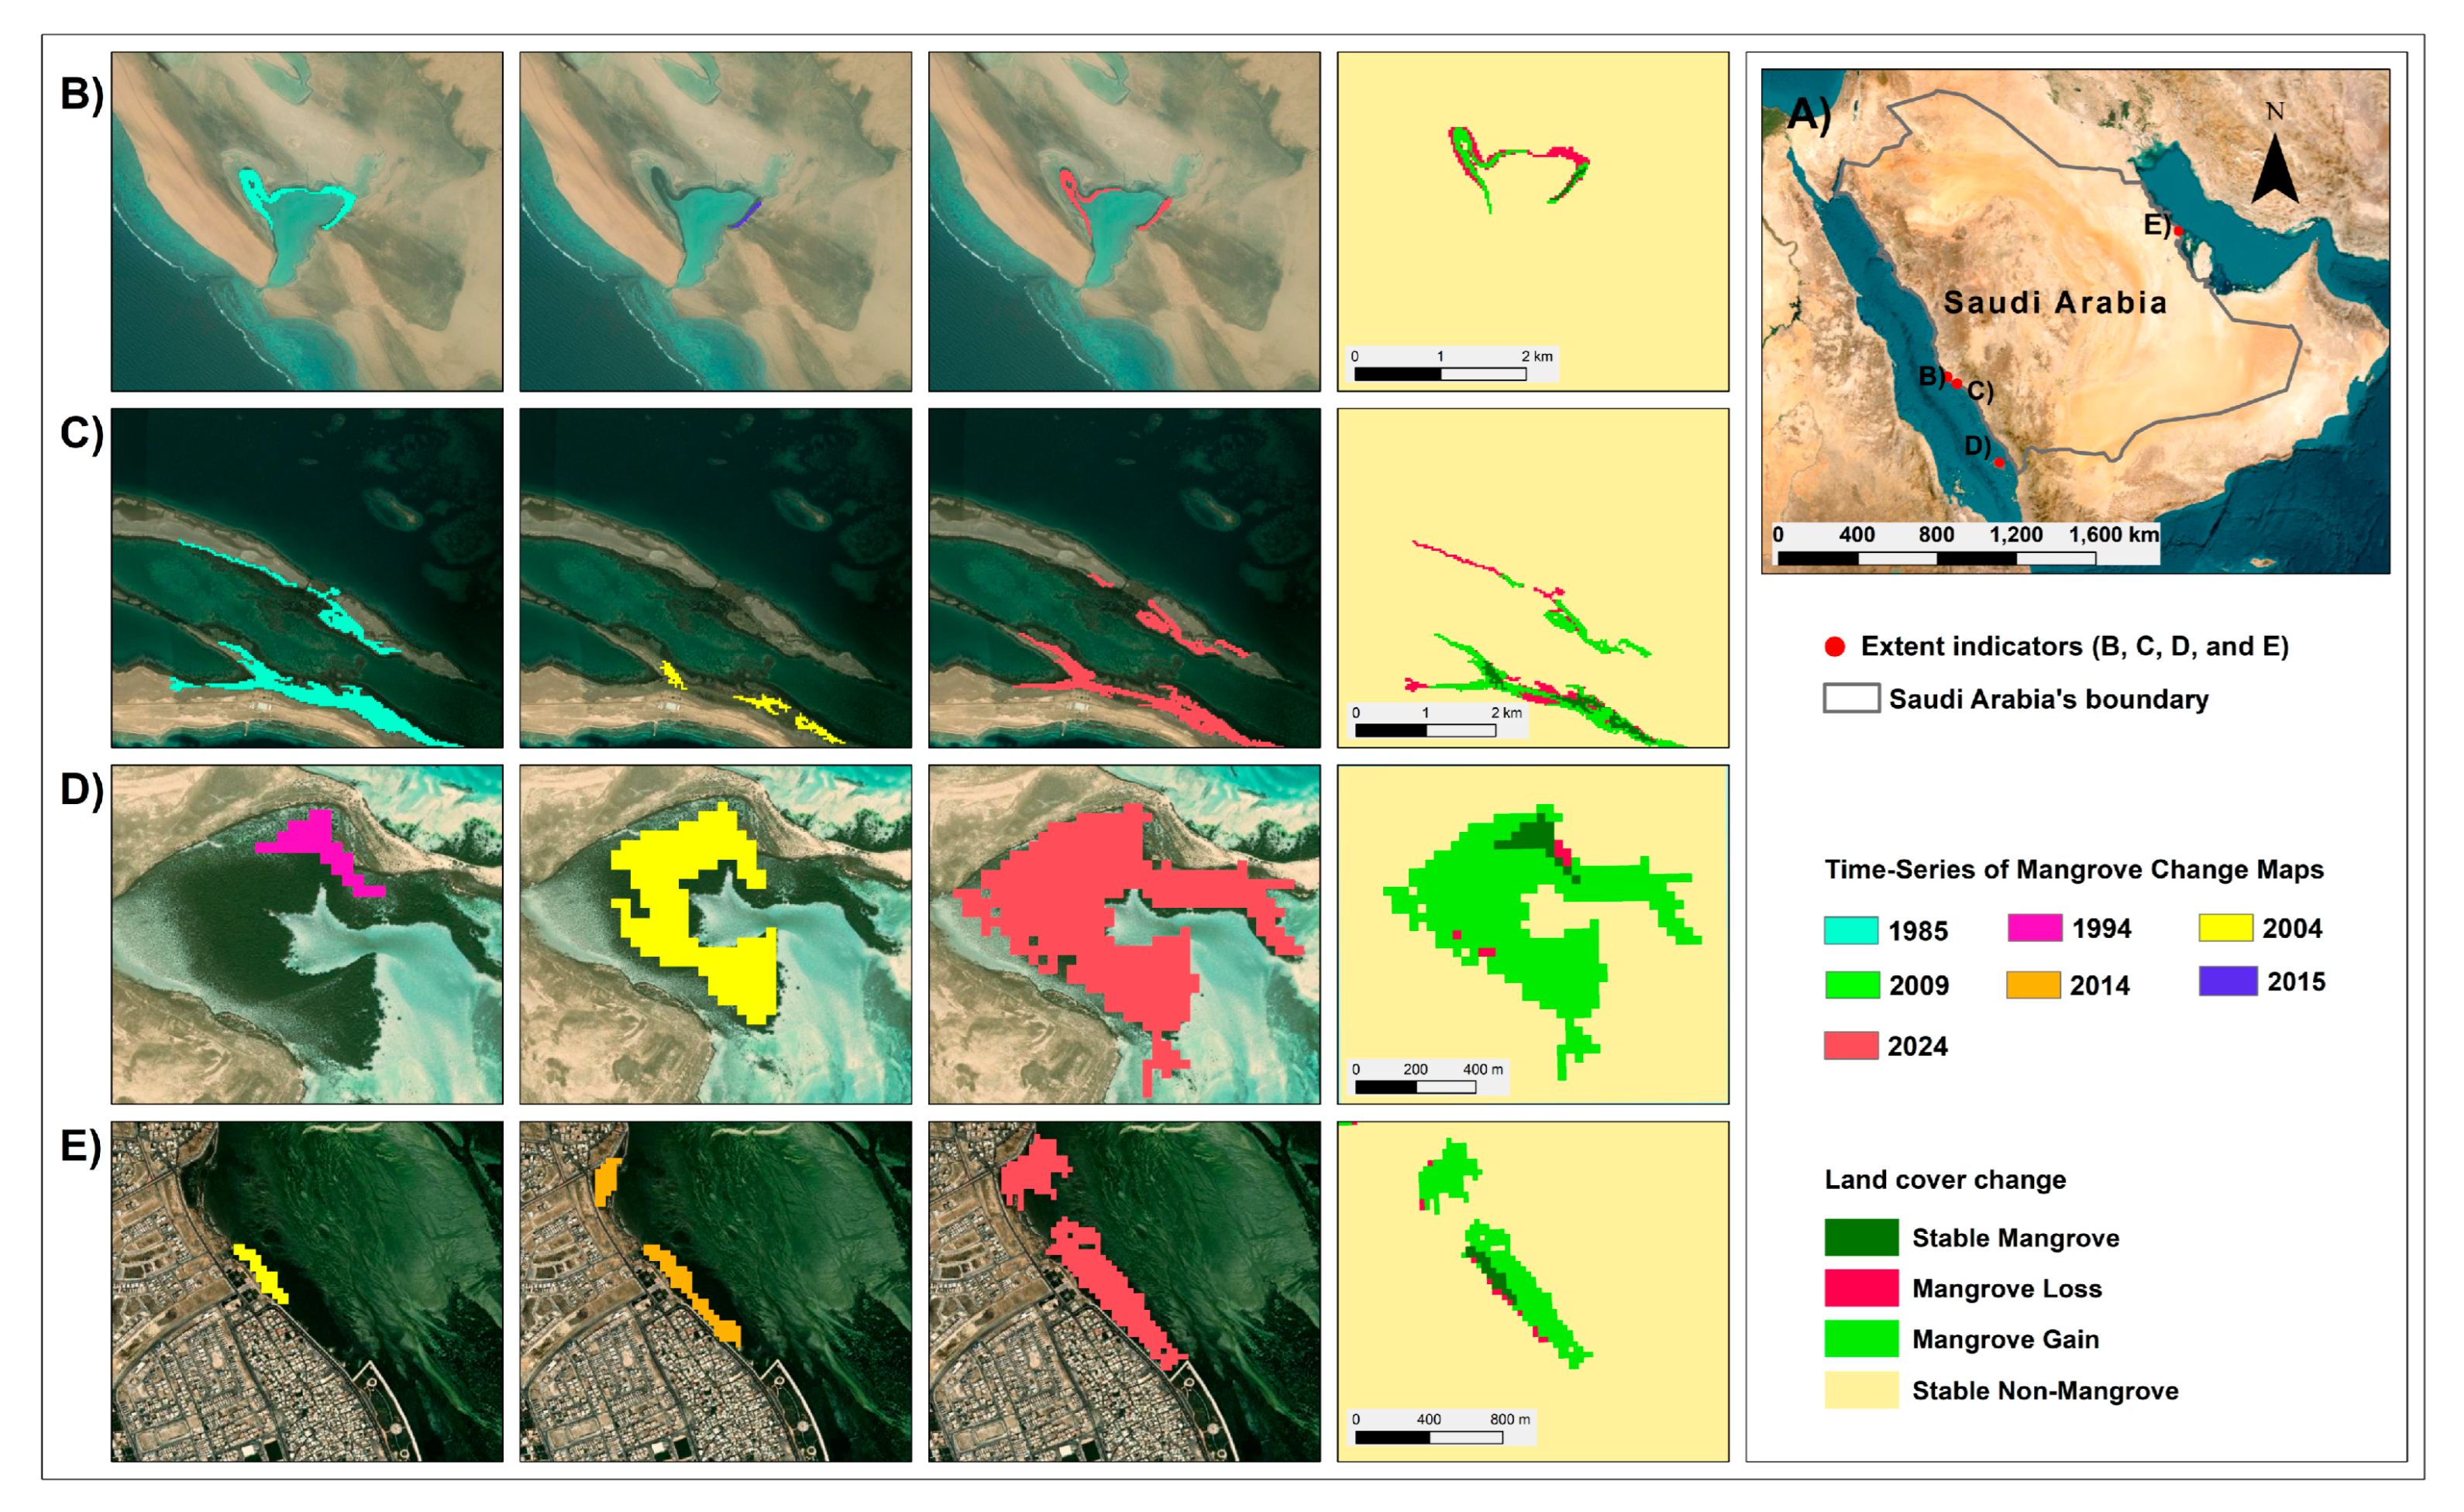
3.4. Identifying At-Risk Zones Based Land Use (ARZ-LU)

In the ARZ-LU model, the vulnerable mangroves, including the chronological age of mangrove areas, varies in distribution along the coast of Saudi Arabia. The ages between 21 and 40 were concentrated in the center of each mangrove’s patches. Other mangrove age areas between 1 and 20 years were expanded, surrounding the longer age areas; this represents the logical expansion of new mangrove areas, as shown in Figure 9A. The vulnerable mangrove areas also included mangrove areas that were less than or equal to 0.5 km2 spread along the coasts. Figure 9B shows the specified mangrove areas characterized as limited, isolated, or scattered along the coasts. The At-Risk Zones Based Land Use (ARZ-LU) shows three different zones ranging from 100 m (high at-risk) to 200 m (moderate at-risk) and 500 m (less at-risk but still at risk). The examples in Figure 9C show some expansion of industrial, residential, and transportation networks to the three zones. These expansions vary along the coasts whether adjacent or expanding into the three different at-risk zones of the vulnerable mangrove areas.

4. Discussion

This study is the first national-scale quantification and mapping of coastal mangrove coverage in both the western (the Red Sea) and eastern coasts (Arabian Gulf) of Saudi Arabia over 40 years, between 1985 and 2024. These 40 years provide a comprehensive overview of mangrove distribution and trends in Saudi Arabia and each location. Mangrove forests in Saudi Arabia are sparsely and sporadically distributed along the Red Sea’s western coasts and the Arabian Gulf’s eastern coasts. However, most mangrove trees are concentrated on the coast of the Red Sea, especially in the southern regions of Saudi Arabia, and have gradually diminished northward. The discoveries from this research show that the existence of mangroves over the study period varied, as repeated downfalls in mangrove areas were observed between years, as shown in Figure 5. Nevertheless, recovery and regrowth after degradation are also shown, with a significant increase in the total mangrove area, especially in the recent decades, with a prominent leap for mangrove habitats from 28.79 to 67.95 km2 between 1985 and 2024 (Table 5).
The downfalls and degradation shown in our results agreed with those of the deterioration observed in several studies investigating the status, distribution, and trend of mangroves for a specified time and location in Saudi Arabian coastal areas. For example, Aljahdali et al. (2021) showed that Rabigh Lagoon, located in the Red Sea, has encountered environmental pressure since the 1990s from land-use activities and camel grazing [12]. Another claim by Kumar et al. (2010) showed that some small areas of mangroves in the northern Red Sea were depleted between 2000 and 2001 due to land-use activities, including urban development and industrialization [2]. Additionally, El-Jhany (2009) conducted a ground survey, and, using Spot-4 for the year 2004 for the southern Red Sea, confirmed that human-induced actions and environmental stress were the leading cause of degradation and seriously impacted spatial mangrove coverage for 2004 [10]. Another degradation event occurred in Taut Bay, eastern Saudi Arabia between 1972 and 2011 because of pollution caused by industrial operations, waste disposal, urban restoration/expansion, and the Gulf War [13]. The degradation and decline occurred in 1990, 2000, 2001, and 2004, as well as between 1972 and 2011, confirming the results of this study, as shown in Figure 5.
The regrowth and recovery of mangrove habitat observed in this study showed a significant increase in mangrove habitat trends in the last decades, similar to those reported by Mohan et al. (2024) [11]. As shown in Figure 5 and Table 5; this resulted from numerous conservation management and practice policies led by the government of Saudi Arabia and many agencies, including, although not limited to, Aramco and the National Center for Vegetation Development (NCVC). Mangrove initiatives led by Aramco began in 1993, planting mangrove seedlings in different locations across the coastline of the Eastern Province and continued the planting of millions of mangroves until 2021 [50,51]. Additionally, since 2020, the NCVC, which was newly established in 2019, has been energetically planting 37 million mangrove tree saplings along Saudi Arabian coastal areas to aid other stakeholders and partners in achieving these goals, including Aramco, Ma’aden, Red Sea Global, and the local community; by 2030, the planting will reach 100 million mangrove trees [52,53]. Another report was published in 2023 about the Red Sea Global (RSG) initiative, which was launched in the same year. The RSG initiative is mainly focused on planting 50 million mangrove trees by 2030 [54]. Similar studies conducted in the United Arab Emirates (UAE) to monitor mangrove forests have confirmed that the expansion of the mangrove ecosystem is due to conservation practices and restoration efforts [55]. The planting millions of mangrove trees will be valuable to the country’s coasts if the proximity to land use and transportation networks is considered. Figure 9 presents an example of the expansion of industrial, residential, and transportation networks located within at-risk buffer zones surrounding vulnerable mangrove areas. Expanding land use without any regulation to protect sensitive ecosystems will make the area more susceptible to deterioration. Furthermore, the primary goals of the country are directions and initiatives related to sustainable development programs. The implemented conservation management and good practice policies will continue to conserve habitats generally, and mangroves specifically, to make the country more sustainable.
Figure 10 summarizes the results of this study, which quantifies mangrove land cover and identifies vulnerable zones based on the status of mangrove forests characterized by small patches of less than 0.5 km2, and less than or equal to 20 years, as determined by this study period. Figure 10 illustrates three levels of risk, representing the intersection of each zone with the land use and transportation networks. The high-risk area is located within 100 m of a highly vulnerable zone, which is the most exposed and least resilient area, marked in red. This high-risk level requires urgent attention and involves all parties in the countries related to the issue, including but not limited to government authorities, policymakers, coastal planners, urban developers, the private sector, conservation agencies, and local communities, to develop conservation frameworks for mangrove forests along these coasts. The high-risk level is located on the southern coast of the Red Sea, and a limited area in the center of the eastern coast that overlooks the Arabian Gulf. Next, the moderate-risk level, colored in yellow, has some exposure but is not critical. This level has a limited distribution along both coasts. The final level of risk represents a low risk, characterized by areas that are least affected or most resilient, located within a 500 m vulnerable zone. All three risk-level classifications require special attention to preserve the environment, sustain mangrove forests, and promote the role of sustainable development.
Several suggestions can play a prominent role in impactful policy enhancements for mangrove forests that are adjacent to land use and land cover, focusing on integrating conservation practices with sustainable development. For example, integrated coastal zone management aims to coordinate urban development with coastal ecosystem protection, ensuring that mangroves are not isolated or degraded by nearby development and will help to effectively conserve the ecosystems of mangrove forests. Additionally, stringent zoning and legal protection are another enhancement policy that will play a leading role in clearly defining zoning limits for destructive land uses, such as aquaculture, infrastructure, and agriculture, which are located near mangrove zones. As the results of this study indicate some degradation and deterioration, it is essential to refine an environmental impact assessment reform that will contribute effectively through environmental impact policies, ensuring informed land use decisions.
Overall, changes in the environmental conservation policies and laws in Saudi Arabia, especially those related to mangrove forests, contributed significantly to mangrove growth. The expansion of mangrove forest areas between 1985 and 2024 is evident in most regions of the country. However, the importance of policies and practices related to mangrove habitats will be more valuable if the transformation in land use and land cover in areas adjacent to mangrove habitats are considered, as these significantly impact conservation efforts and the potential degradation of these vital ecosystems.

5. Conclusions

This study presents the first national-scale methods and results regarding mangrove status, distribution, and trends along the western coast of the Red Sea and the eastern coasts of the Arabian Gulf in Saudi Arabia, spanning the period from 1985 to 2024. The study utilized dense Landsat satellite imagery (ETM 5, ETM+ 7, and OLI 8) processed through the GEE. Seven spectral indices and the included bands facilitated the classification of annual images using the random forest algorithm. By assessing the accuracy of annual classification maps and multitemporal mangrove change maps, I revealed important trends in mangrove forest dynamics over the past 40 years. The results indicate a significant subtidal expansion of mangrove areas from 28.79 to 67.95 km2 in 1985 and 2024, respectively. Although the findings highlight the positive impacts of conservation policies, management practices, and plantation projects on expanding mangrove coverage and rehabilitating degraded areas, more preservation practices are needed for vulnerable mangrove forests, utilizing the innovation of this study’s ARZ-LU model, which classifies the risk level into three different levels: high, moderate, and low-risk. The ARZ-LU model is important for regulating the usage of adjacent land use and transportation network areas to protect vulnerable mangrove areas and ensure continued plant health.
Although this study provides a long-term (40-year) comprehensive understanding of mangrove coverage along both western and eastern Saudi Arabian coasts, the findings are limited due to the Landsat medium spatial resolution. While these images can assist in identifying mangrove forests over large-scale areas, their lower resolution may hinder the detection of those in smaller or more fragmented areas, particularly in semi-arid and arid environments like the coasts of Saudi Arabia. The use of commercially available higher spatial resolution imagery could be an alternative for accurately identifying mangrove forests in such small-scale areas. To better understand the impact on mangrove forest areas, future research should focus on the role of land use and land cover, particularly in degraded areas adjacent to mangroves; this could also incorporate negative and positive driving forces. The hostile driving forces could include pollution, waste discharge, climate change (such as sea-level rise, temperature fluctuations, and precipitation changes), and anthropogenic drivers (including urbanization, agriculture, and aquaculture). The positive driving forces could include environmental awareness policies, conservation practices, coastal protection needs, climate change mitigation, and many other factors. Additionally, examining local and global land management practices aimed at conserving these ecosystems is crucial. The long-term annual mangrove land-cover maps provide essential information for scientists, government agencies, the private sector, stakeholders, and policymakers to enhance conservation efforts, land management strategies, and best practices for mangrove expansion and rehabilitating degraded areas, including: delineating vulnerable mangrove areas and potentially vulnerable areas; identifying the degradation areas for rehabilitation and plantation efforts; supporting coastal zone management and climate resilience planning; and guiding the decisions of sustainable development, such as ecotourism or mariculture site selection, to avoid ecologically sensitive areas.

Funding

This work was funded by the University of Jeddah, Jeddah, Saudi Arabia, under grant No. (UJ-24-DR-2568-1).

Institutional Review Board Statement

Not applicable.

Informed Consent Statement

Not applicable.

Data Availability Statement

The National Mangrove Forests Data of Saudi Arabia (1985–2024) are available in Zenodo at (https://doi.org/10.5281/zenodo.15680996).

Acknowledgments

The author gratefully acknowledges the University of Jeddah for its technical and financial support. Sincere thanks are also extended to the anonymous reviewers for their insightful comments and constructive feedback, which have significantly contributed to the improvement of this article.

Conflicts of Interest

The author declares no conflict of interest.

References

  1. Li, W.; El-Askary, H.; Qurban, M.A.; Li, J.; ManiKandan, K.P.; Piechota, T. Using Multi-Indices Approach to Quantify Mangrove Changes over the Western Arabian Gulf along Saudi Arabia Coast. Ecol. Indic. 2019, 102, 734–745. [Google Scholar] [CrossRef]
  2. Kumar, A.; Khan, M.A.; Muqtadir, A. Distribution of Mangroves along the Red Sea Coast of the Arabian Peninsula: Part-I: The Northern Coast of Western Saudi Arabia. Earth Sci. India 2010, 3, 28–42. [Google Scholar]
  3. Blanco-Sacristán, J.; Johansen, K.; Duarte, C.M.; Daffonchio, D.; Hoteit, I.; McCabe, M.F. Mangrove Distribution and Afforestation Potential in the Red Sea. Sci. Total Environ. 2022, 843, 157098. [Google Scholar] [CrossRef]
  4. Aye, W.N.; Wen, Y.; Marin, K.; Thapa, S.; Tun, A.W. Contribution of Mangrove Forest to the Livelihood of Local Communities in Ayeyarwaddy Region, Myanmar. Forests 2019, 10, 414. [Google Scholar] [CrossRef]
  5. Leal, M.; Spalding, M.D. The State of the World’s Mangroves. 2022. Available online: https://www.mangrovealliance.org/wp-content/uploads/2024/09/SOWM-2024-HR-1.pdf (accessed on 17 February 2024).
  6. Turschwell, M.P.; Tulloch, V.J.D.; Sievers, M.; Pearson, R.M.; Andradi-Brown, D.A.; Ahmadia, G.N.; Connolly, R.M.; Bryan-Brown, D.; Lopez-Marcano, S.; Adame, M.F.; et al. Multi-Scale Estimation of the Effects of Pressures and Drivers on Mangrove Forest Loss Globally. Biol. Conserv. 2020, 247, 108637. [Google Scholar] [CrossRef]
  7. United Nations Mangroves for Sustainable Development. Available online: https://unric.org/en/mangroves-for-sustainable-development/ (accessed on 16 February 2024).
  8. United Nations The Global Sustainable Development Report 2023. Available online: https://sdgs.un.org/gsdr/gsdr2023 (accessed on 16 February 2024).
  9. Saudi Climate Vision Championing Climate Action at Home and Abroad. Available online: https://www.sgi.gov.sa/saudi-climate-vision/?csrt=1643733478985877176 (accessed on 16 February 2024).
  10. El-Jhany, L.I. Present Status and Degredation Trends of Mangrove Forests on the Southern Red Sea Coast of Saudi Arabia. Am.-Eurasian J. Agric. Environ. Sci. 2009, 6, 328–340. [Google Scholar]
  11. Mohan, M.; Dutta Roy, A.; Montenegro, J.F.; Watt, M.S.; Burt, J.A.; Shapiro, A.; Ouerfelli, D.; Daniel, R.; de-Miguel, S.; Ali, T.; et al. Mangrove Forest Regeneration Age Map and Drivers of Restoration Success in Gulf Cooperation Council Countries from Satellite Imagery. Remote Sens. Appl. 2024, 36, 101345. [Google Scholar] [CrossRef]
  12. Aljahdali, M.O.; Munawar, S.; Khan, W.R. Monitoring Mangrove Forest Degradation and Regeneration: Landsat Time Series Analysis of Moisture and Vegetation Indices at Rabigh Lagoon, Red Sea. Forests 2021, 12, 52. [Google Scholar] [CrossRef]
  13. Almahasheer, H.; Al-Taisan, W.; Mohamed, M.K. Mangrove Deterioration in Tarut Bay on the Eastern Province of the Kingdom of Saudi Arabia. Pakhtunkhwa J. Life Sci. 2013, 1, 49–50. [Google Scholar]
  14. Almahasheer, H. Spatial Coverage of Mangrove Communities in the Arabian Gulf. Environ. Monit. Assess. 2018, 190, 85. [Google Scholar] [CrossRef]
  15. Yaseen, R.A.S. Study of Mangroves along with the Application of Remote Sensing and Geographical Information Systems (GIS), Within the Borders of National Prawn Company; King Abdulaziz University: Jeddah, Saudi Arabia, 2011. [Google Scholar]
  16. Saoum, M.R.; Sarkar, S.K. Monitoring Mangrove Forest Change and Its Impacts on the Environment. Ecol. Indic. 2024, 159, 111666. [Google Scholar] [CrossRef]
  17. Christensen, S.M.; Tarp, P.; Hjortsø, C.N. Mangrove Forest Management Planning in Coastal Buffer and Conservation Zones, Vietnam: A Multimethodological Approach Incorporating Multiple Stakeholders. Ocean Coast. Manag. 2008, 51, 712–726. [Google Scholar] [CrossRef]
  18. Luijendijk, A.P.; Kras, E.; Dagalaki, V.; Morelissen, R.; Hoteit, I.; Ranasinghe, R. Regime Shifts in Future Shoreline Dynamics of Saudi Arabia. Front. Mar. Sci. 2022, 8, 798657. [Google Scholar] [CrossRef]
  19. GEOSA Official Map of the Kingdom of Saudi Arabia. Available online: https://www.geosa.gov.sa/Documents/Maps/2023/2m_Eng_11ED.pdf (accessed on 16 February 2024).
  20. El-Rawy, M.; Batelaan, O.; Al-Arifi, N.; Alotaibi, A.; Abdalla, F.; Gabr, M. Climate Change Impacts on Water Resources in Arid and Semi-Arid Regions: A Case Study in Saudi Arabia. Water 2023, 15, 606. [Google Scholar] [CrossRef]
  21. CCKP Current Climate: Climatology, Trends and Variability. Available online: https://climateknowledgeportal.worldbank.org/watershed/92/climate-data-historical (accessed on 16 February 2024).
  22. Aljaddani, A.H.; Song, X.-P.; Zhu, Z. Characterizing the Patterns and Trends of Urban Growth in Saudi Arabia’s 13 Capital Cities Using a Landsat Time Series. Remote Sens. 2022, 14, 2382. [Google Scholar] [CrossRef]
  23. Farr, T.G.; Rosen, P.A.; Caro, E.; Crippen, R.; Duren, R.; Hensley, S.; Kobrick, M.; Paller, M.; Rodriguez, E.; Roth, L.; et al. The Shuttle Radar Topography Mission. Rev. Geophys. 2007, 45. [Google Scholar] [CrossRef]
  24. Bunting, P.; Rosenqvist, A.; Hilarides, L.; Lucas, R.M.; Thomas, N.; Tadono, T.; Worthington, T.A.; Spalding, M.; Murray, N.J.; Rebelo, L.-M. Global Mangrove Extent Change 1996–2020: Global Mangrove Watch Version 3.0. Remote Sens. 2022, 14, 3657. [Google Scholar] [CrossRef]
  25. NCVC Mangrove Database. Available online: https://ncvc.gov.sa/ar/digitalKnowledge/open-data/Pages/default.aspx (accessed on 11 May 2023).
  26. OpenStreetMap GCC States. Available online: https://download.geofabrik.de/asia/gcc-states.html (accessed on 1 February 2025).
  27. Gorelick, N.; Hancher, M.; Dixon, M.; Ilyushchenko, S.; Thau, D.; Moore, R. Google Earth Engine: Planetary-Scale Geospatial Analysis for Everyone. Remote Sens. Environ. 2017, 202, 18–27. [Google Scholar] [CrossRef]
  28. Ruan, L.; Yan, M.; Zhang, L.; Fan, X.; Yang, H. Spatial-Temporal NDVI Pattern of Global Mangroves: A Growing Trend during 2000–2018. Sci. Total Environ. 2022, 844, 157075. [Google Scholar] [CrossRef]
  29. Mondal, B.K.; Mahata, S.; Basu, T.; Das, R.; Patra, R.; Abdelrahman, K.; Fnais, M.S.; Praharaj, S. Analysis of the Post-Cyclonic Physical Flood Susceptibility and Changes of Mangrove Forest Area Using Multi-Criteria Decision-Making Process and Geospatial Analysis in Indian Sundarbans. Atmosphere 2024, 15, 432. [Google Scholar] [CrossRef]
  30. Chen, J.; Wang, Y.; Wang, J.; Zhang, Y.; Xu, Y.; Yang, O.; Zhang, R.; Wang, J.; Wang, Z.; Lu, F.; et al. The Performance of Landsat-8 and Landsat-9 Data for Water Body Extraction Based on Various Water Indices: A Comparative Analysis. Remote Sens. 2024, 16, 1984. [Google Scholar] [CrossRef]
  31. Fu, B.; He, X.; Yao, H.; Liang, Y.; Deng, T.; He, H.; Fan, D.; Lan, G.; He, W. Comparison of RFE-DL and Stacking Ensemble Learning Algorithms for Classifying Mangrove Species on UAV Multispectral Images. Int. J. Appl. Earth Obs. Geoinf. 2022, 112, 102890. [Google Scholar] [CrossRef]
  32. Chan-Bagot, K.; Herndon, K.E.; Puzzi Nicolau, A.; Martín-Arias, V.; Evans, C.; Parache, H.; Mosely, K.; Narine, Z.; Zutta, B. Integrating SAR, Optical, and Machine Learning for Enhanced Coastal Mangrove Monitoring in Guyana. Remote Sens. 2024, 16, 542. [Google Scholar] [CrossRef]
  33. Raj, N.; Pasfield-Neofitou, S. Assessment and Prediction of Sea Level and Coastal Wetland Changes in Small Islands Using Remote Sensing and Artificial Intelligence. Remote Sens. 2024, 16, 551. [Google Scholar] [CrossRef]
  34. Breiman, L. Random Forests. Mach. Learn. 2001, 45, 5–32. [Google Scholar] [CrossRef]
  35. Pande, C.B.; Srivastava, A.; Moharir, K.N.; Radwan, N.; Mohd Sidek, L.; Alshehri, F.; Pal, S.C.; Tolche, A.D.; Zhran, M. Characterizing Land Use/Land Cover Change Dynamics by an Enhanced Random Forest Machine Learning Model: A Google Earth Engine Implementation. Environ. Sci. Eur. 2024, 36, 84. [Google Scholar] [CrossRef]
  36. Teluguntla, P.; Thenkabail, P.S.; Oliphant, A.; Xiong, J.; Gumma, M.K.; Congalton, R.G.; Yadav, K.; Huete, A. A 30-m Landsat-Derived Cropland Extent Product of Australia and China Using Random Forest Machine Learning Algorithm on Google Earth Engine Cloud Computing Platform. ISPRS J. Photogramm. Remote Sens. 2018, 144, 325–340. [Google Scholar] [CrossRef]
  37. Aziz, G.; Minallah, N.; Saeed, A.; Frnda, J.; Khan, W. Remote Sensing Based Forest Cover Classification Using Machine Learning. Sci. Rep. 2024, 14, 69. [Google Scholar] [CrossRef] [PubMed]
  38. Sheykhmousa, M.; Mahdianpari, M.; Ghanbari, H.; Mohammadimanesh, F.; Ghamisi, P.; Homayouni, S. Support Vector Machine Versus Random Forest for Remote Sensing Image Classification: A Meta-Analysis and Systematic Review. IEEE J. Sel. Top. Appl. Earth Obs. Remote Sens. 2020, 13, 6308–6325. [Google Scholar] [CrossRef]
  39. Aviña-Hernández, J.; Ramírez-Vargas, M.; Roque-Sosa, F.; Martínez-Rincón, R.O. Predictive Performance of Random Forest on the Identification of Mangrove Species in Arid Environments. Ecol. Inf. 2023, 75, 102040. [Google Scholar] [CrossRef]
  40. Piao, Y.; Jeong, S.; Park, S.; Lee, D. Analysis of Land Use and Land Cover Change Using Time-Series Data and Random Forest in North Korea. Remote Sens. 2021, 13, 3501. [Google Scholar] [CrossRef]
  41. Svoboda, J.; Štych, P.; Laštovička, J.; Paluba, D.; Kobliuk, N. Random Forest Classification of Land Use, Land-Use Change and Forestry (LULUCF) Using Sentinel-2 Data—A Case Study of Czechia. Remote Sens. 2022, 14, 1189. [Google Scholar] [CrossRef]
  42. Wang, X.; Xiao, X.; Zhang, X.; Ye, H.; Dong, J.; He, Q.; Wang, X.; Liu, J.; Li, B.; Wu, J. Characterization and Mapping of Photovoltaic Solar Power Plants by Landsat Imagery and Random Forest: A Case Study in Gansu Province, China. J. Clean. Prod. 2023, 417, 138015. [Google Scholar] [CrossRef]
  43. Stehman, S.V. Sampling Designs for Accuracy Assessment of Land Cover. Int. J. Remote Sens. 2009, 30, 5243–5272. [Google Scholar] [CrossRef]
  44. Jenness, J.; Wynne, J.J. Cohen’s Kappa and Classification Table Metrics 2.0: An ArcView 3. x Extension for Accuracy Assessment of Spatially Explicit Models; US Geological Survey, Southwest Biological Science Center: Flagstaff, AZ, USA, 2005.
  45. Pellegrini, J.A.; Soares, M.L.; Chaves, F.O.; Estrada, G.C. A Method for the Classification of Mangrove Forests and Sensitivity/Vulnerability Analysis. J. Coast. Res. 2009, I, 443–447. [Google Scholar]
  46. Bodin, Ö.; Tengö, M.; Norman, A.; Lundberg, J.; Elmqvist, T. The Value of Small Size: Loss of Forest Patches and Ecological Thresholds in Southern Madagascar. Ecol. Appl. 2006, 16, 440–451. [Google Scholar] [CrossRef]
  47. Badola, R.; Ambastha, K.; Hussain, S.A. Hussain Valuing the Storm Protection Function of Mangroves: A Case Study from India. In Proceedings of the 12th World Forestry Congress, Quedec City, QC, Canada, 21–28 September 2003. [Google Scholar]
  48. Waleed, T.A.; Abdel-Maksoud, Y.K.; Kanwar, R.S.; Sewilam, H. Mangroves in Egypt and the Middle East: Current Status, Threats, and Opportunities. Int. J. Environ. Sci. Technol. 2025, 22, 1225–1262. [Google Scholar] [CrossRef]
  49. Al-Huqail, A.A.; Islam, Z.; Al-Harbi, H.F. Ecological Stress Modeling to Conserve Mangrove Ecosystem Along the Jazan Coast of Saudi Arabia. Land 2025, 14, 70. [Google Scholar] [CrossRef]
  50. Aramco Mangrove Initiatives. Available online: https://www.aramco.com/en/sustainability/environment/biodiversity-initiatives/mangrove-initiatives (accessed on 7 February 2025).
  51. National Geographic The Mangrove Solution. Available online: https://www.nationalgeographic.com/protecting-a-natural-kingdom/the-mangroves-solution/#:~:text=In%201993%2C%20Aramco%20began%20planting,regenerated%20from%20old%2Dgrowth%20forests. (accessed on 7 February 2025).
  52. United Nations Saudi Arabia. Saudi Arabia Empowering Communities and Ecosystems for Sustainable Mangrove Conservation and Management; United Nations Saudi Arabia: Riyadh, Saudi Arabia, 2024. [Google Scholar]
  53. Cavallito, M. Saudi Arabia Also Bets on Mangroves. Available online: https://resoilfoundation.org/en/environment/saudi-arabia-bets-on-mangroves/ (accessed on 7 February 2025).
  54. RSG Red Sea Global on Track to Plant 50 Million Mangrove Trees by 2030 with Launch of Dedicated Nursery. Available online: https://www.redseaglobal.com/en/w/media-center/red-sea-global-on-track-to-plant-50-million-mangrove-trees-by-2030-with-launch-of-dedicated-nursery/ (accessed on 20 May 2025).
  55. Tan, L.; Wu, H. Artificial Intelligence Mangrove Monitoring System Based on Deep Learning and Sentinel-2 Satellite Data in the UAE (2017–2024). arXiv 2024, arXiv:2411.11918. [Google Scholar]
Figure 1. Spatial extent of the research areas: (A) western Saudi Arabia’s coastal region, along with the Red Sea; and (B) eastern Saudi Arabia’s coastal region, along with the Arabian Gulf.
Sustainability 17 05957 g001
Figure 2. (A) Overview of collecting training samples for mangrove and non-mangrove classes along Saudi Arabian coasts; and (BD) mangrove and non-mangrove training samples from three varied locations in Saudi Arabia.
Sustainability 17 05957 g002
Figure 3. (A) Overview of a stratified random sampling design map for the Saudi Arabian coast along the western and eastern coasts; and (BD) three examples of sampling designs for three different locations.
Sustainability 17 05957 g003
Figure 4. Flowchart illustrating the study methodology.
Sustainability 17 05957 g004
Figure 5. Long-term trend in mangroves over 40 years (1985–2024).
Sustainability 17 05957 g005
Figure 6. (A) three extent indicators in Saudi Arabia; and (BD) three examples of temporal classification results of 1985, 2003, and 2024, including mangrove, classification map (CM), and surface reflectance (SR). Sample D does not comprise mangrove areas prior to 2003.
Sustainability 17 05957 g006
Figure 7. Time-series of mangrove change map between 1985 and 2024: (A) four extent indicators of B, C, D, and E; (B,C) mangrove loss along western coasts over a selected period; and (D,E) mangrove gain along the Red Sea and Arabian Gulf over a selected period. Land cover change shows in the four examples (BE).
Sustainability 17 05957 g007
Figure 8. Four examples of mangrove and non-mangrove transition over three different intervals based on Figure 7.
Sustainability 17 05957 g008
Figure 9. At-risk zones based on land use and transportation networks. (A) chronological age of mangrove areas over 40 years; (B) The vulnerable mangrove areas less than or equal to 0.5 km2; and (C) the At-Risk Zones Based Land Use (ARZ-LU) model.
Sustainability 17 05957 g009
Figure 10. Three risk-level classifications for mangrove forest areas.
Sustainability 17 05957 g010
Table 1. Spectral indices (SI) utilized for identifying mangrove forests, where B indicates each band of the surface reflectance.
SI DescriptionEquationReference
Vegetation index (NDVI) B N I R B R E D / ( B N I R + B R E D ) [28]
Mangrove Index (NDMI) B S W I R 2 B G R E E N / ( B S W I R 2 + B G R R E N ) [29]
Water Index (MNDWI) B G R E E N B S W I R 1 / ( B G R E E N + B S W I R 1 ) [30]
Band ratio 54 (BR54) B S W I R 1 / ( B N I R ) [32]
Band ratio 35 (BR35) B R E D / ( B S W I R 1 ) [32]
Simple ratio (SR) B N I R / ( B R E D ) [31]
Chlorophyll Index (GCVI) B N I R / ( B G R E E N ) 1 [33]
Table 2. Accuracy assessment of the user, producer, and overall accuracy; Kappa; and F1-score for mangrove and non-mangrove classes across Saudi Arabian coasts (1985–2024).
YearMangroveNon-MangroveOverall AccuracyKappaF1-Score
Accuracy of the User (%)Accuracy of the Producer (%)Accuracy of the User (%)Accuracy of the Producer (%)
198592.5393.9396.9996.2695.500.890.93
198997.0690.4194.7098.4395.500.900.94
199491.4390.1494.6295.3593.500.840.91
199995.9593.4296.0397.5896.000.910.95
200497.3396.0597.6098.3997.500.950.97
200997.2293.3396.0998.4096.500.920.95
201496.8192.8693.4097.0695.000.890.95
201994.7493.7594.2995.1994.500.880.94
202493.1489.6288.7892.5591.000.800.91
Table 3. Confusion matrix for mangrove change map temporal-spanning 40 years (1985–2024).
Reference Data
MangroveNon-MangroveChange
Classified mapMangrove4514
Non-mangrove1472
Change5887
User of Accuracy90.00%94.00%87.00%
Producer of Accuracy88.23%83.92%93.54%
Overall Accuracy90.00%
Table 4. Three examples of mangrove and non-mangrove transitions in three years intervals based on Figure 6.
Stable MangroveMangrove LossMangrove GainStable Non-Mangrove
Location (B)Area in sq km (%)0.669 (10.042%)0.006 (0.091%)0.196 (2.945%)5.793 (86.922%)
Total6.664
Change rate0.202 km2 (3.036%)
Location (C)Area in sq km (%)0.33 (7.218%)0.068 (1.492%)0.44 (9.638%)3.73 (81.651%)
Total4.568
Change rate0.508 km2 (11.131%)
Location (D)Area in sq km (%)0.02 (1.702%)0.005 (0.408%)0.134 (11.334%)1.025 (86.556)
Total1.184
Change rate0.139 km2 (11.742)
Table 5. Mangrove cover along the Saudi Arabian coasts was projected using the random forest algorithm at 5-year intervals (1985–2024).
YearMangrove (The Red Sea) (km2)Mangrove (Arabian Gulf) (km2)Mangrove Total (km2)
198527.741.0528.79
198926.400.8127.21
199429.381.2330.61
199927.192.0729.26
200432.433.8636.29
200929.342.2531.58
201451.204.6355.83
201954.917.6262.53
202459.318.6567.95
Table 6. Mangrove and non-mangrove transition in the Red Sea and Arabian Gulf over 40 years.
Mangrove and Non-Mangrove Transition in the Red Sea (1985, 2000, 2024)
1985→2000→2024StatusArea in (km2)
MangroveMangroveMangroveStable Mangrove14.57
MangroveMangroveNon-MangroveMangrove Loss1.76
MangroveNon-MangroveMangroveMangrove Gain5.52
MangroveNon-MangroveNon-MangroveMangrove Loss3.53
Non-MangroveMangroveMangroveMangrove Gain7.26
Non-MangroveMangroveNon-MangroveMangrove Loss2.08
Non-MangroveNon-MangroveMangroveMangrove Gain27.66
Non-MangroveNon-MangroveNon-MangroveStable Non-Mangrove80,550.05
Total 80,612.44
Change rate0.00059% Change in area47.82
Mangrove and Non-Mangrove Transition in Arabian Gulf (1985, 2000, 2024)
MangroveMangroveMangroveStable Mangrove0.09
MangroveMangroveNon-MangroveMangrove Loss0.31
MangroveNon-MangroveNon-MangroveMangrove Loss0.51
Non-MangroveMangroveMangroveMangrove Gain0.76
Non-MangroveMangroveNon-MangroveMangrove Loss0.99
Non-MangroveNon-MangroveMangroveMangrove Gain6.88
Non-MangroveNon-MangroveNon-MangroveStable Non-Mangrove11,608.97
Total 11,618.51
Change rate0.00081% Change in area 9.45
Note: The bold numbers in area in (km2) represent the mangrove gain in the Red Sea and Arabian Gulf.
Disclaimer/Publisher’s Note: The statements, opinions and data contained in all publications are solely those of the individual author(s) and contributor(s) and not of MDPI and/or the editor(s). MDPI and/or the editor(s) disclaim responsibility for any injury to people or property resulting from any ideas, methods, instructions or products referred to in the content.

