
Design Method for Platform-Aggregated Life Cycle Ecosystem

 ,
,  ,
,
Abstract
1. Introduction
2. Literature Review
3. Materials and Methods
3.1. Clarifying the Structure and Positioning of a PF-LCE
3.2. Policies for Designing a PF-LCE
3.3. A Method for Designing a PF-LCE
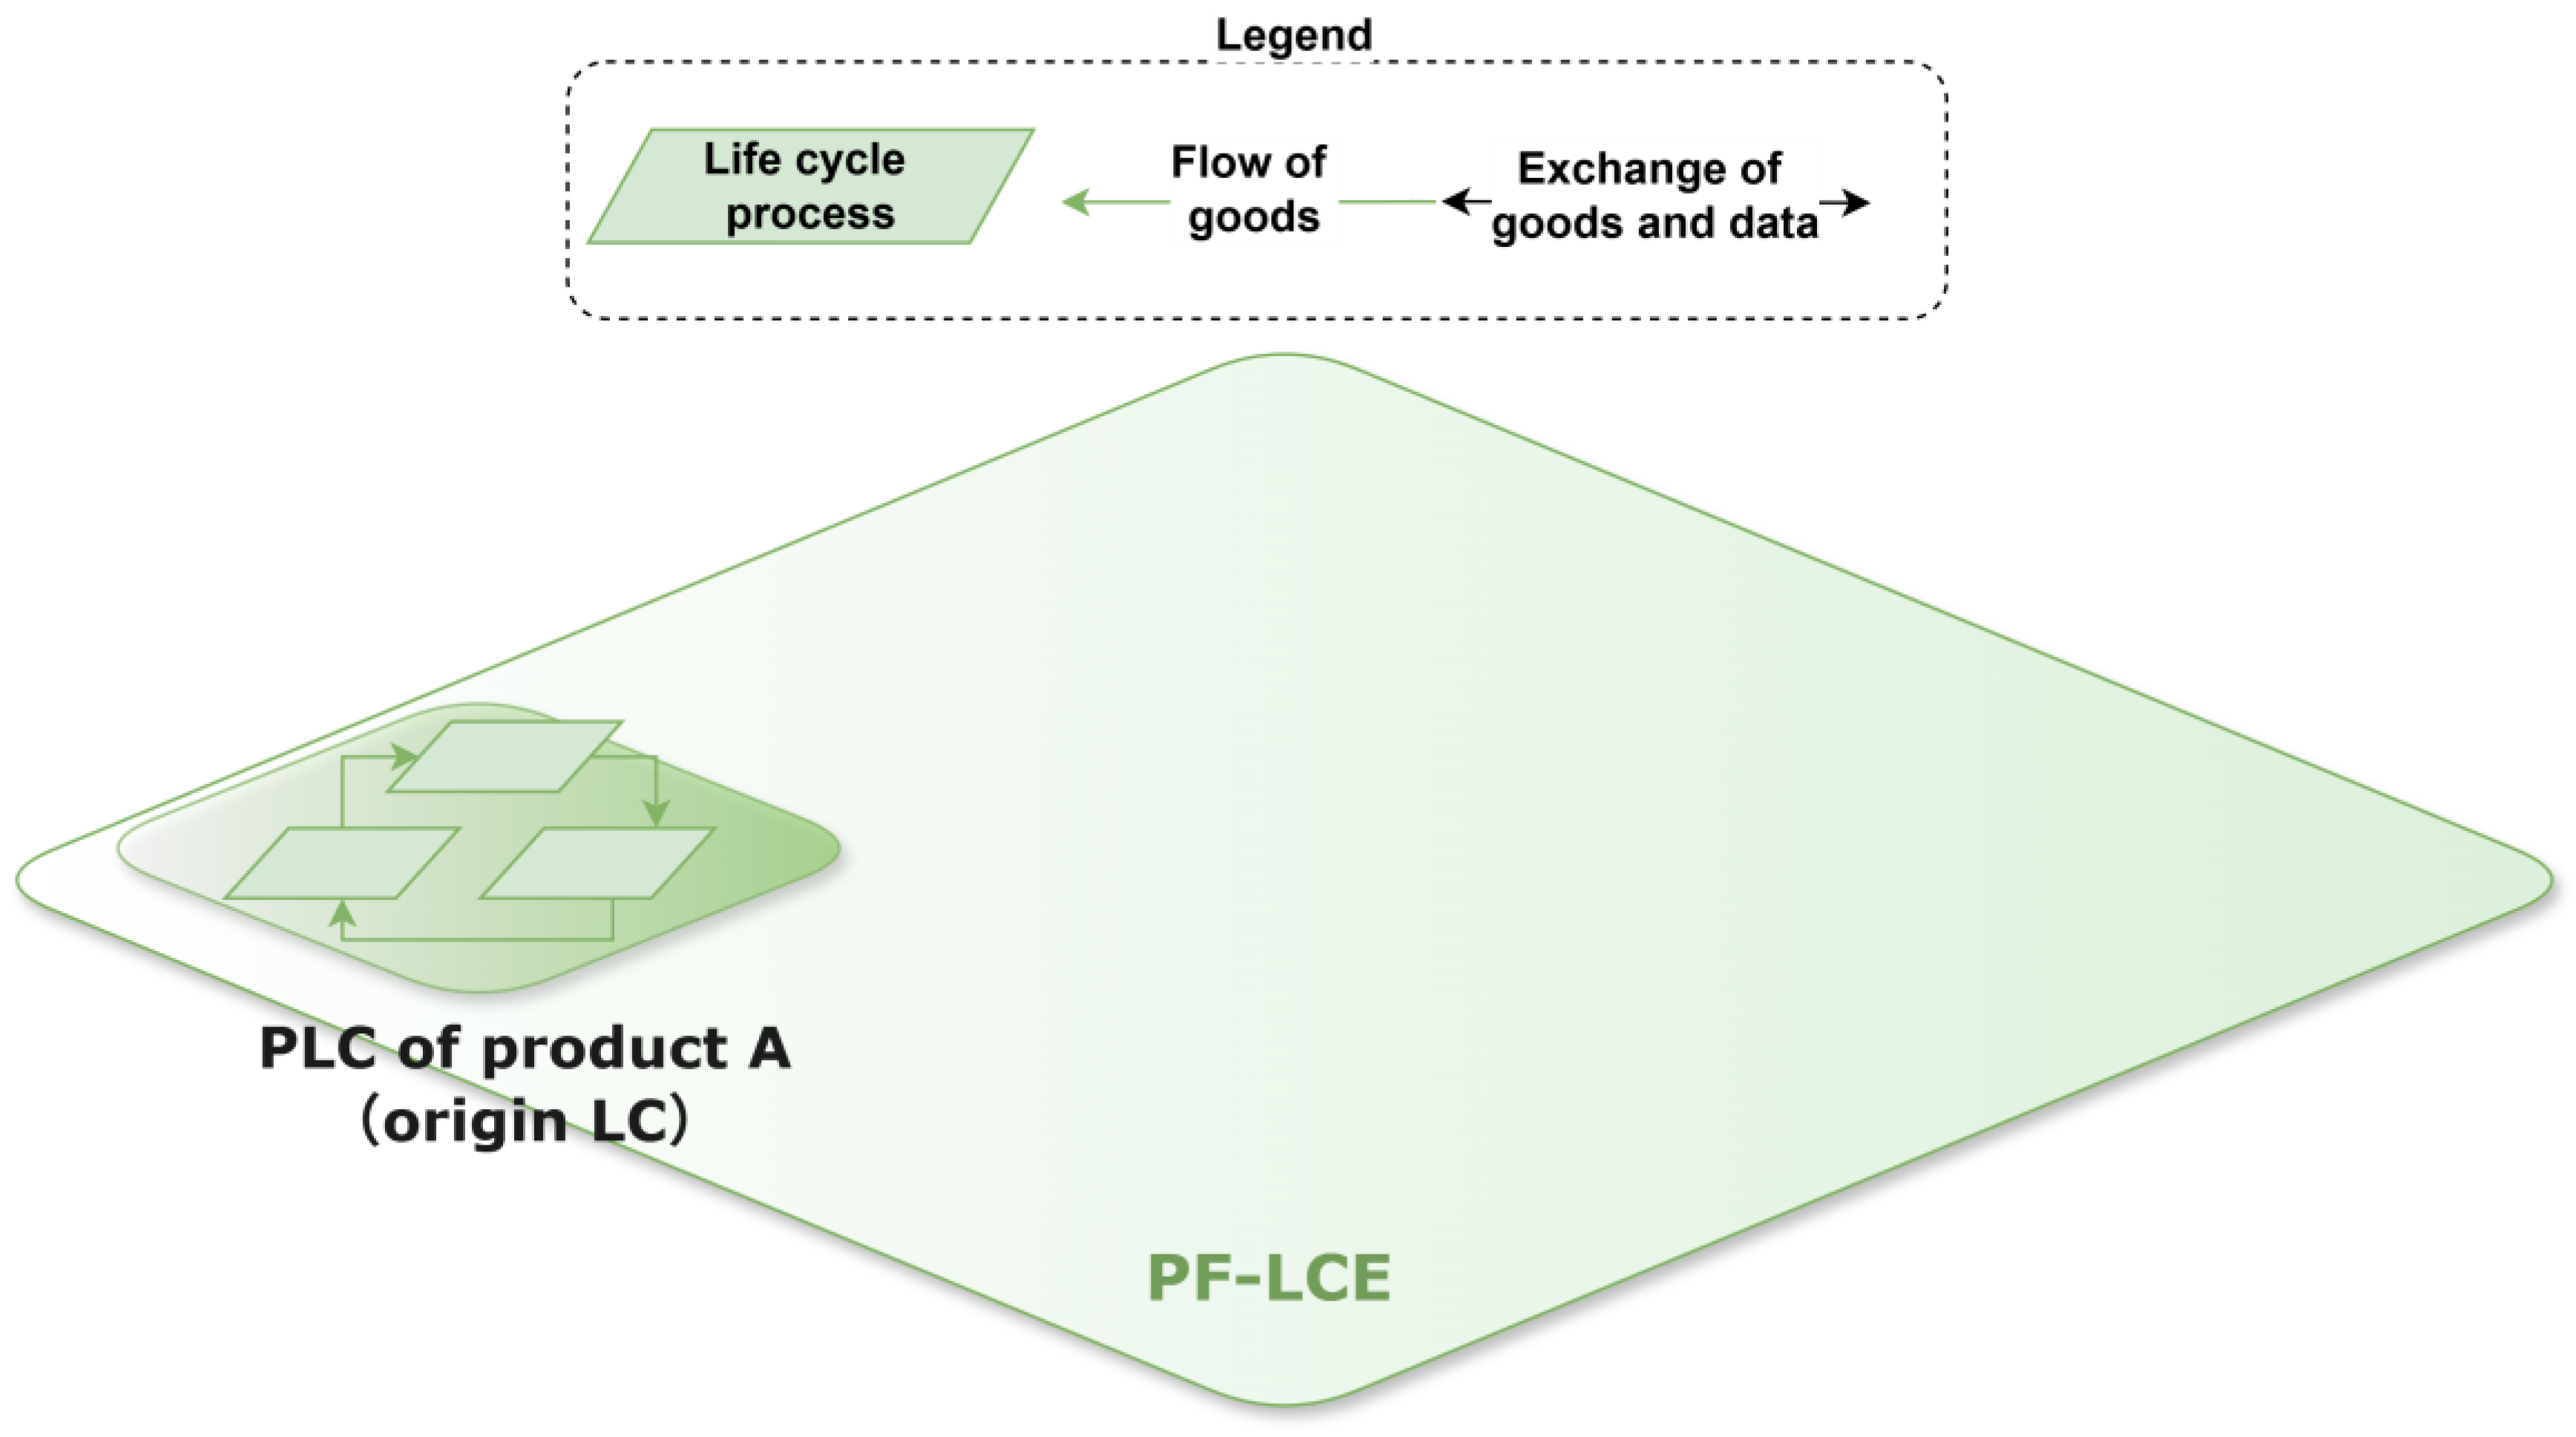
3.3.1. Step 1: Specify the Origin PLC
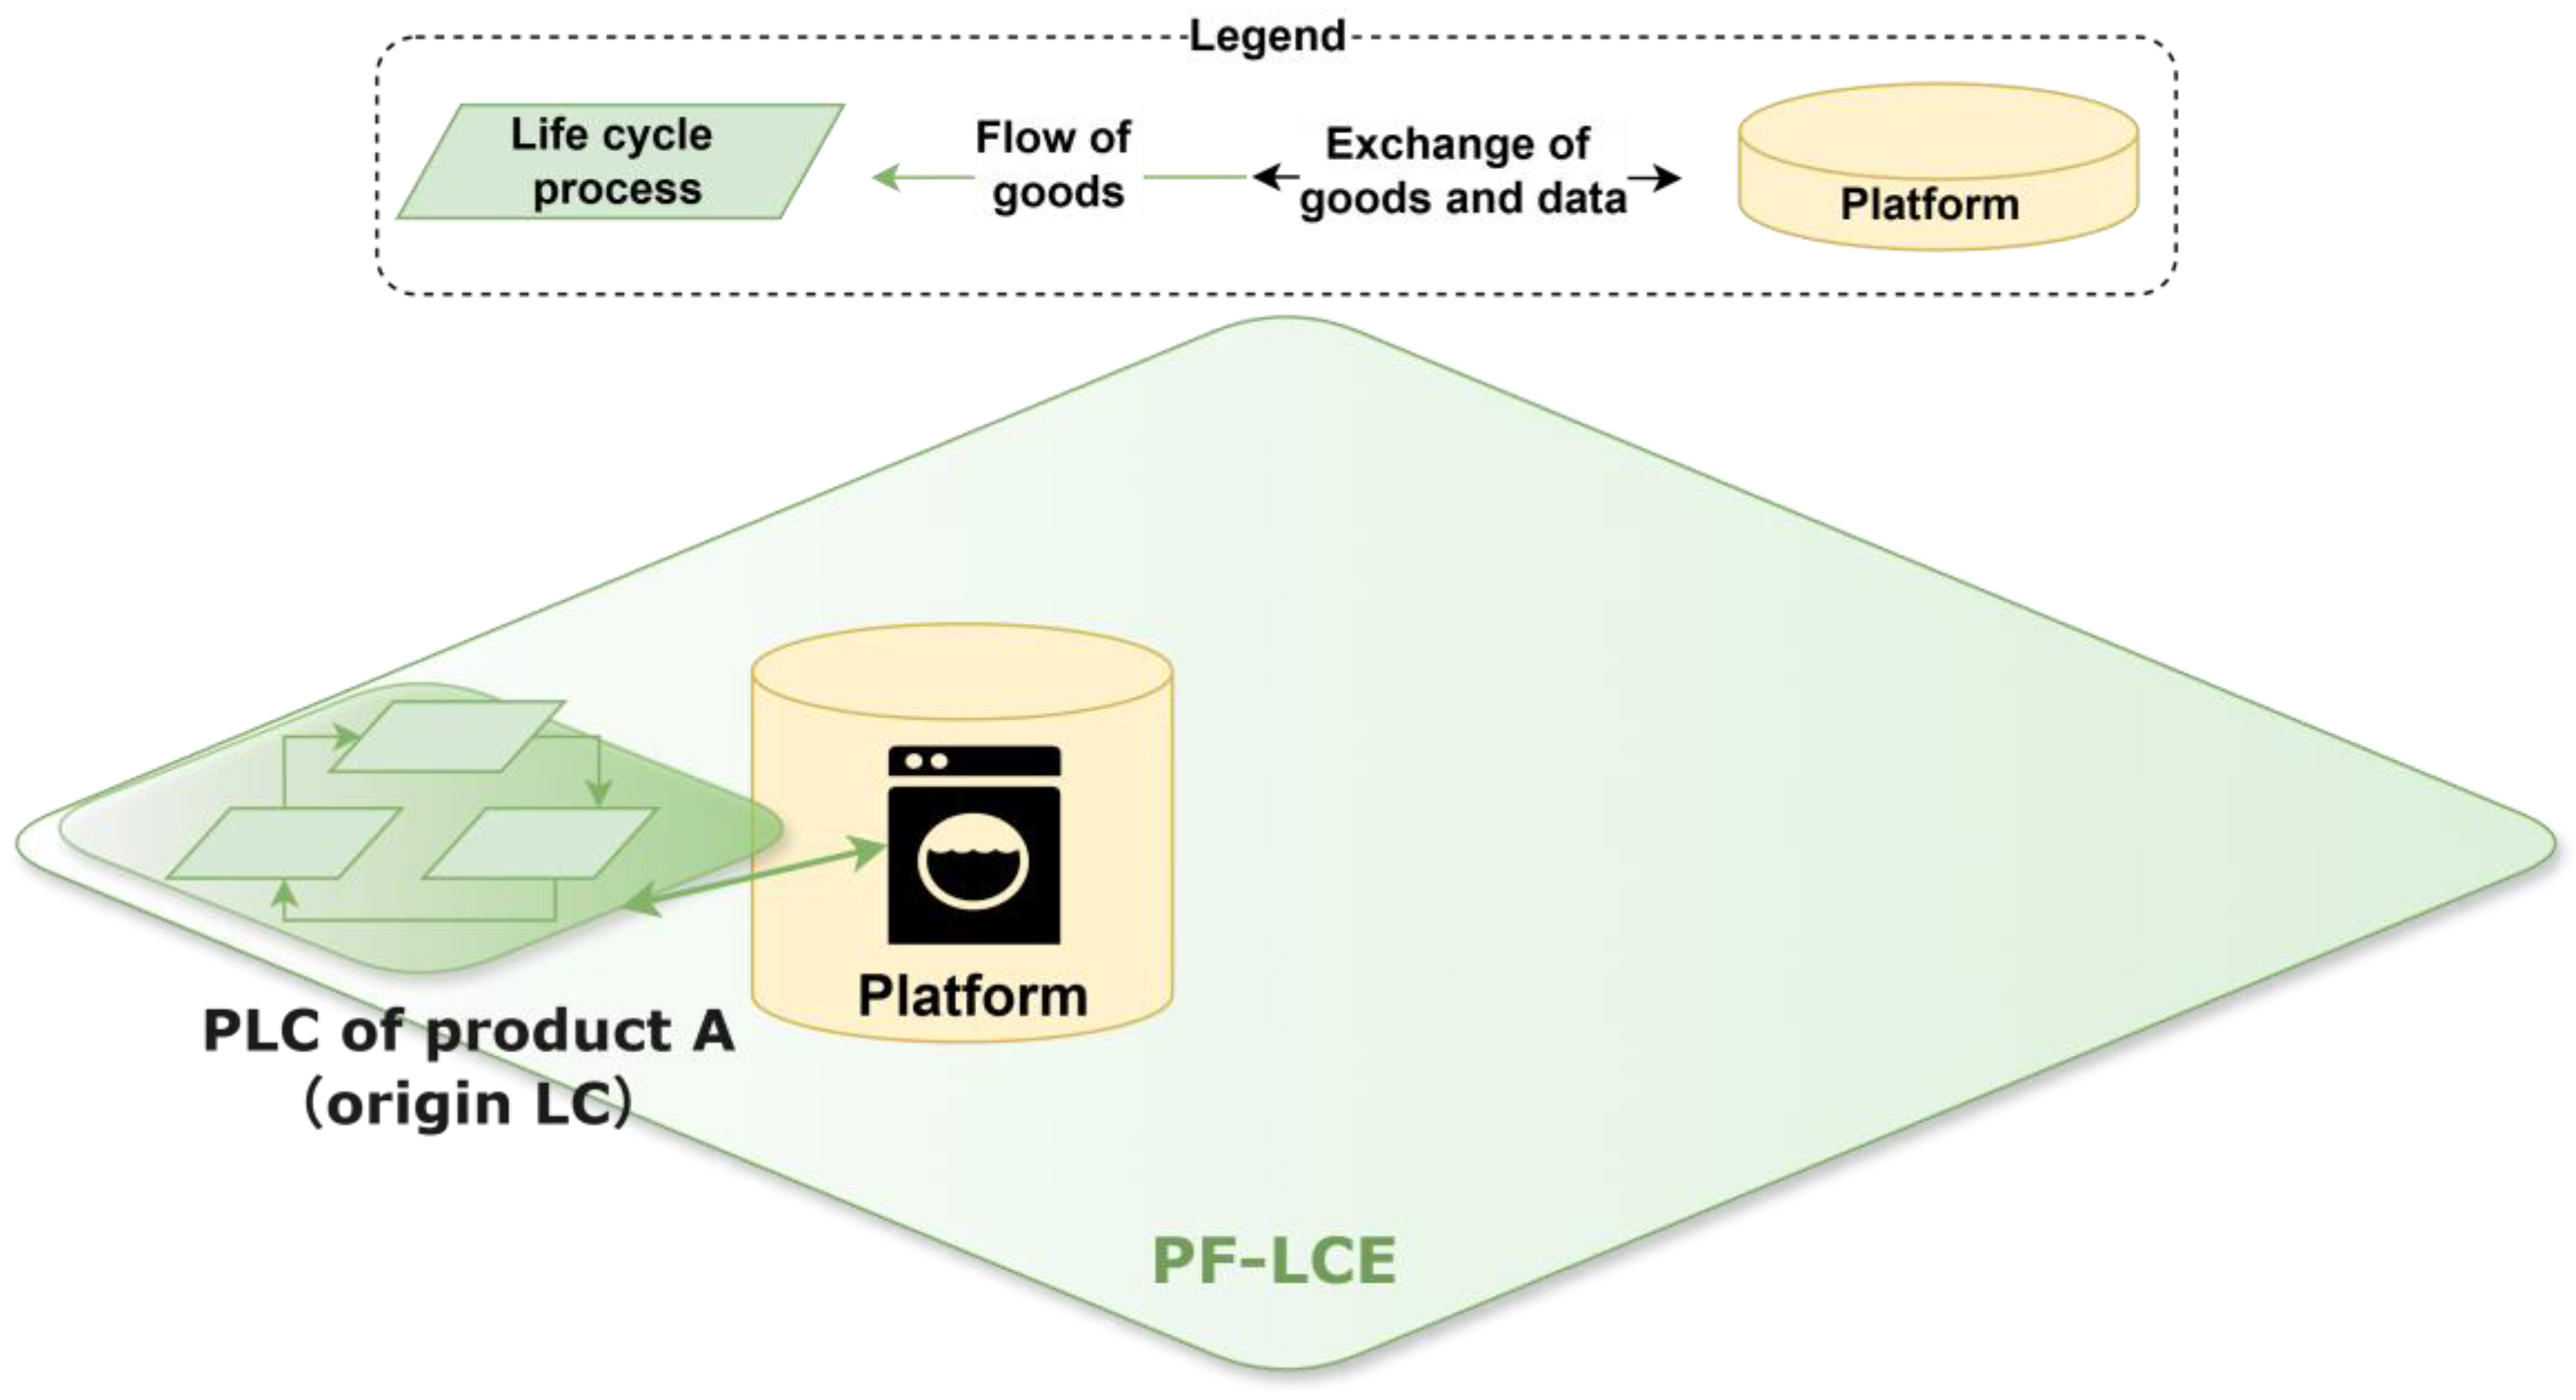
3.3.2. Step 2: Identify the Platform
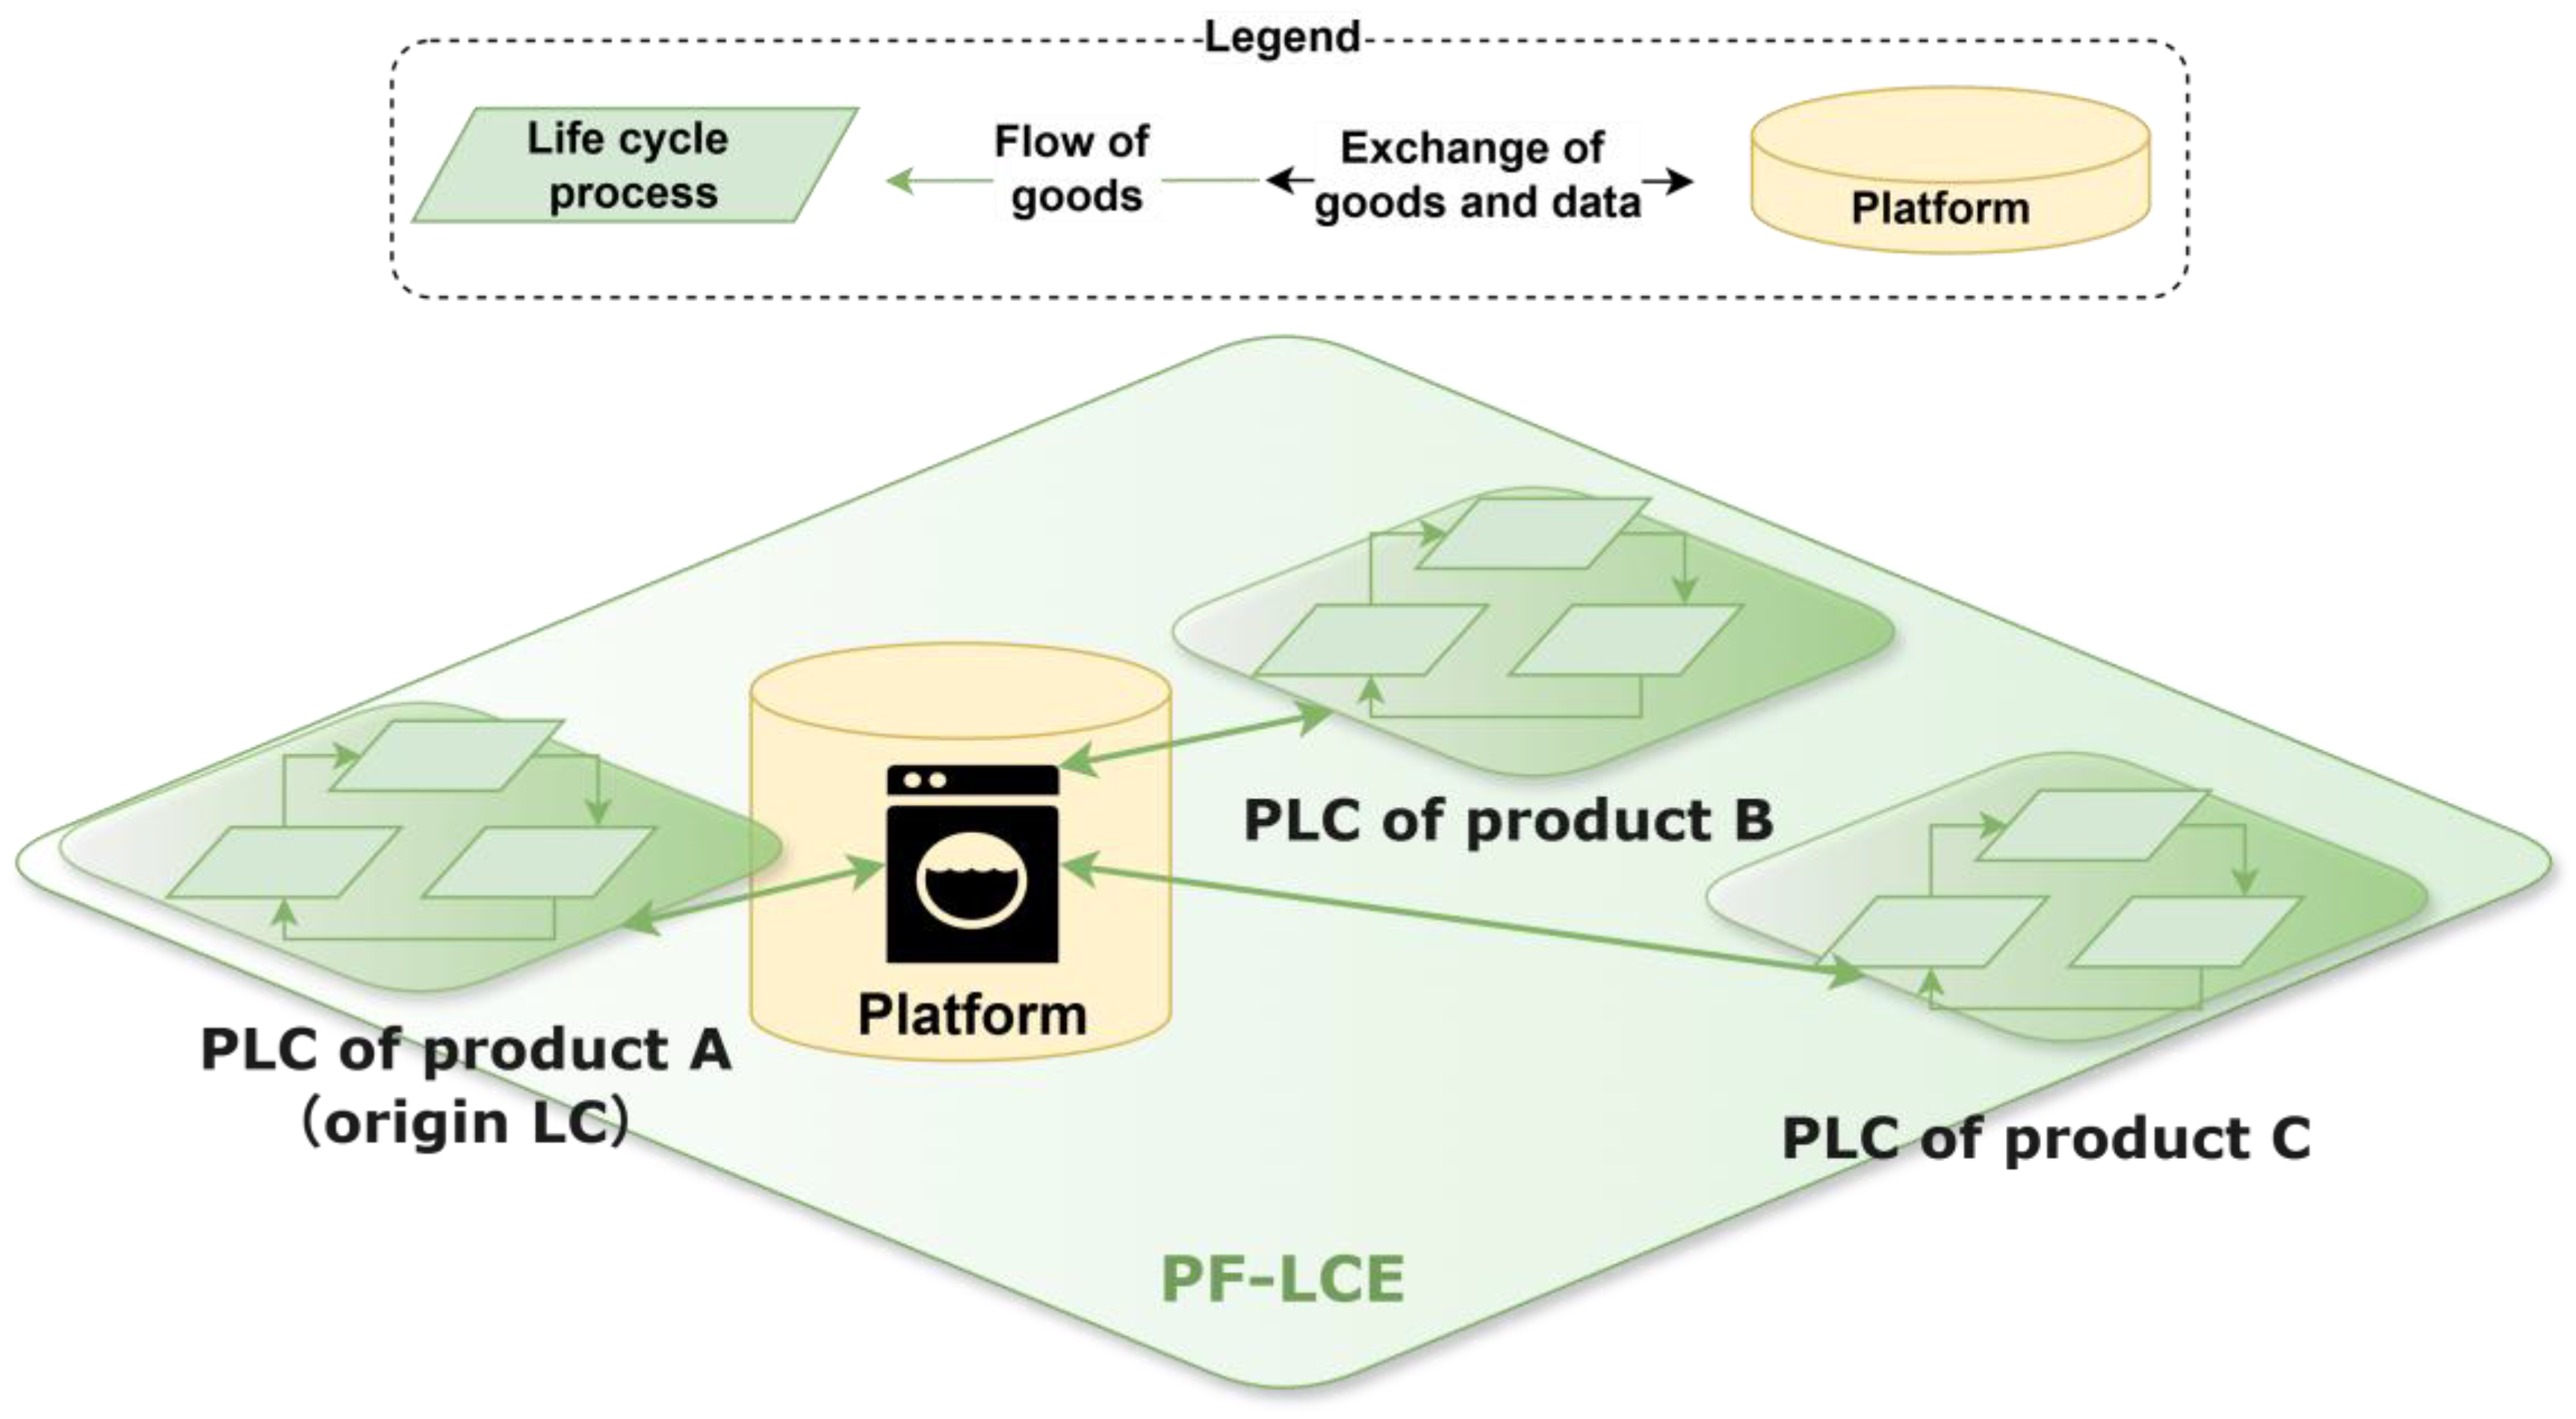
3.3.3. Step 3: Determine the PLCs That Participate in the PF-LCE
3.3.4. Step 4: Assess the PF-LCE
4. Case Study
4.1. Design of a PF-LCE
4.1.1. Step 1: Specify the Origin PLC
4.1.2. Step 2: Identify the Platform
4.1.3. Step 3: Determine the PLCs That Participate in the PF-LCE
- Shoes for flat-foot treatment
- Climbing shoes and running shoes
- Requests to use shoe storage compartments.
- Foot shape and gait patterns of consumers.
- Condition changes in commuting shoes (for example, dirty and worn).
- Foot odor.
- Requests for shoe storage compartment:
- Foot shape and gait data:
- Condition changes in commuting shoes:
- Foot odor:
4.1.4. Step 4: Assess PF-LCE
4.2. Simulation Scenarios
4.2.1. Common Settings
Scenario 1
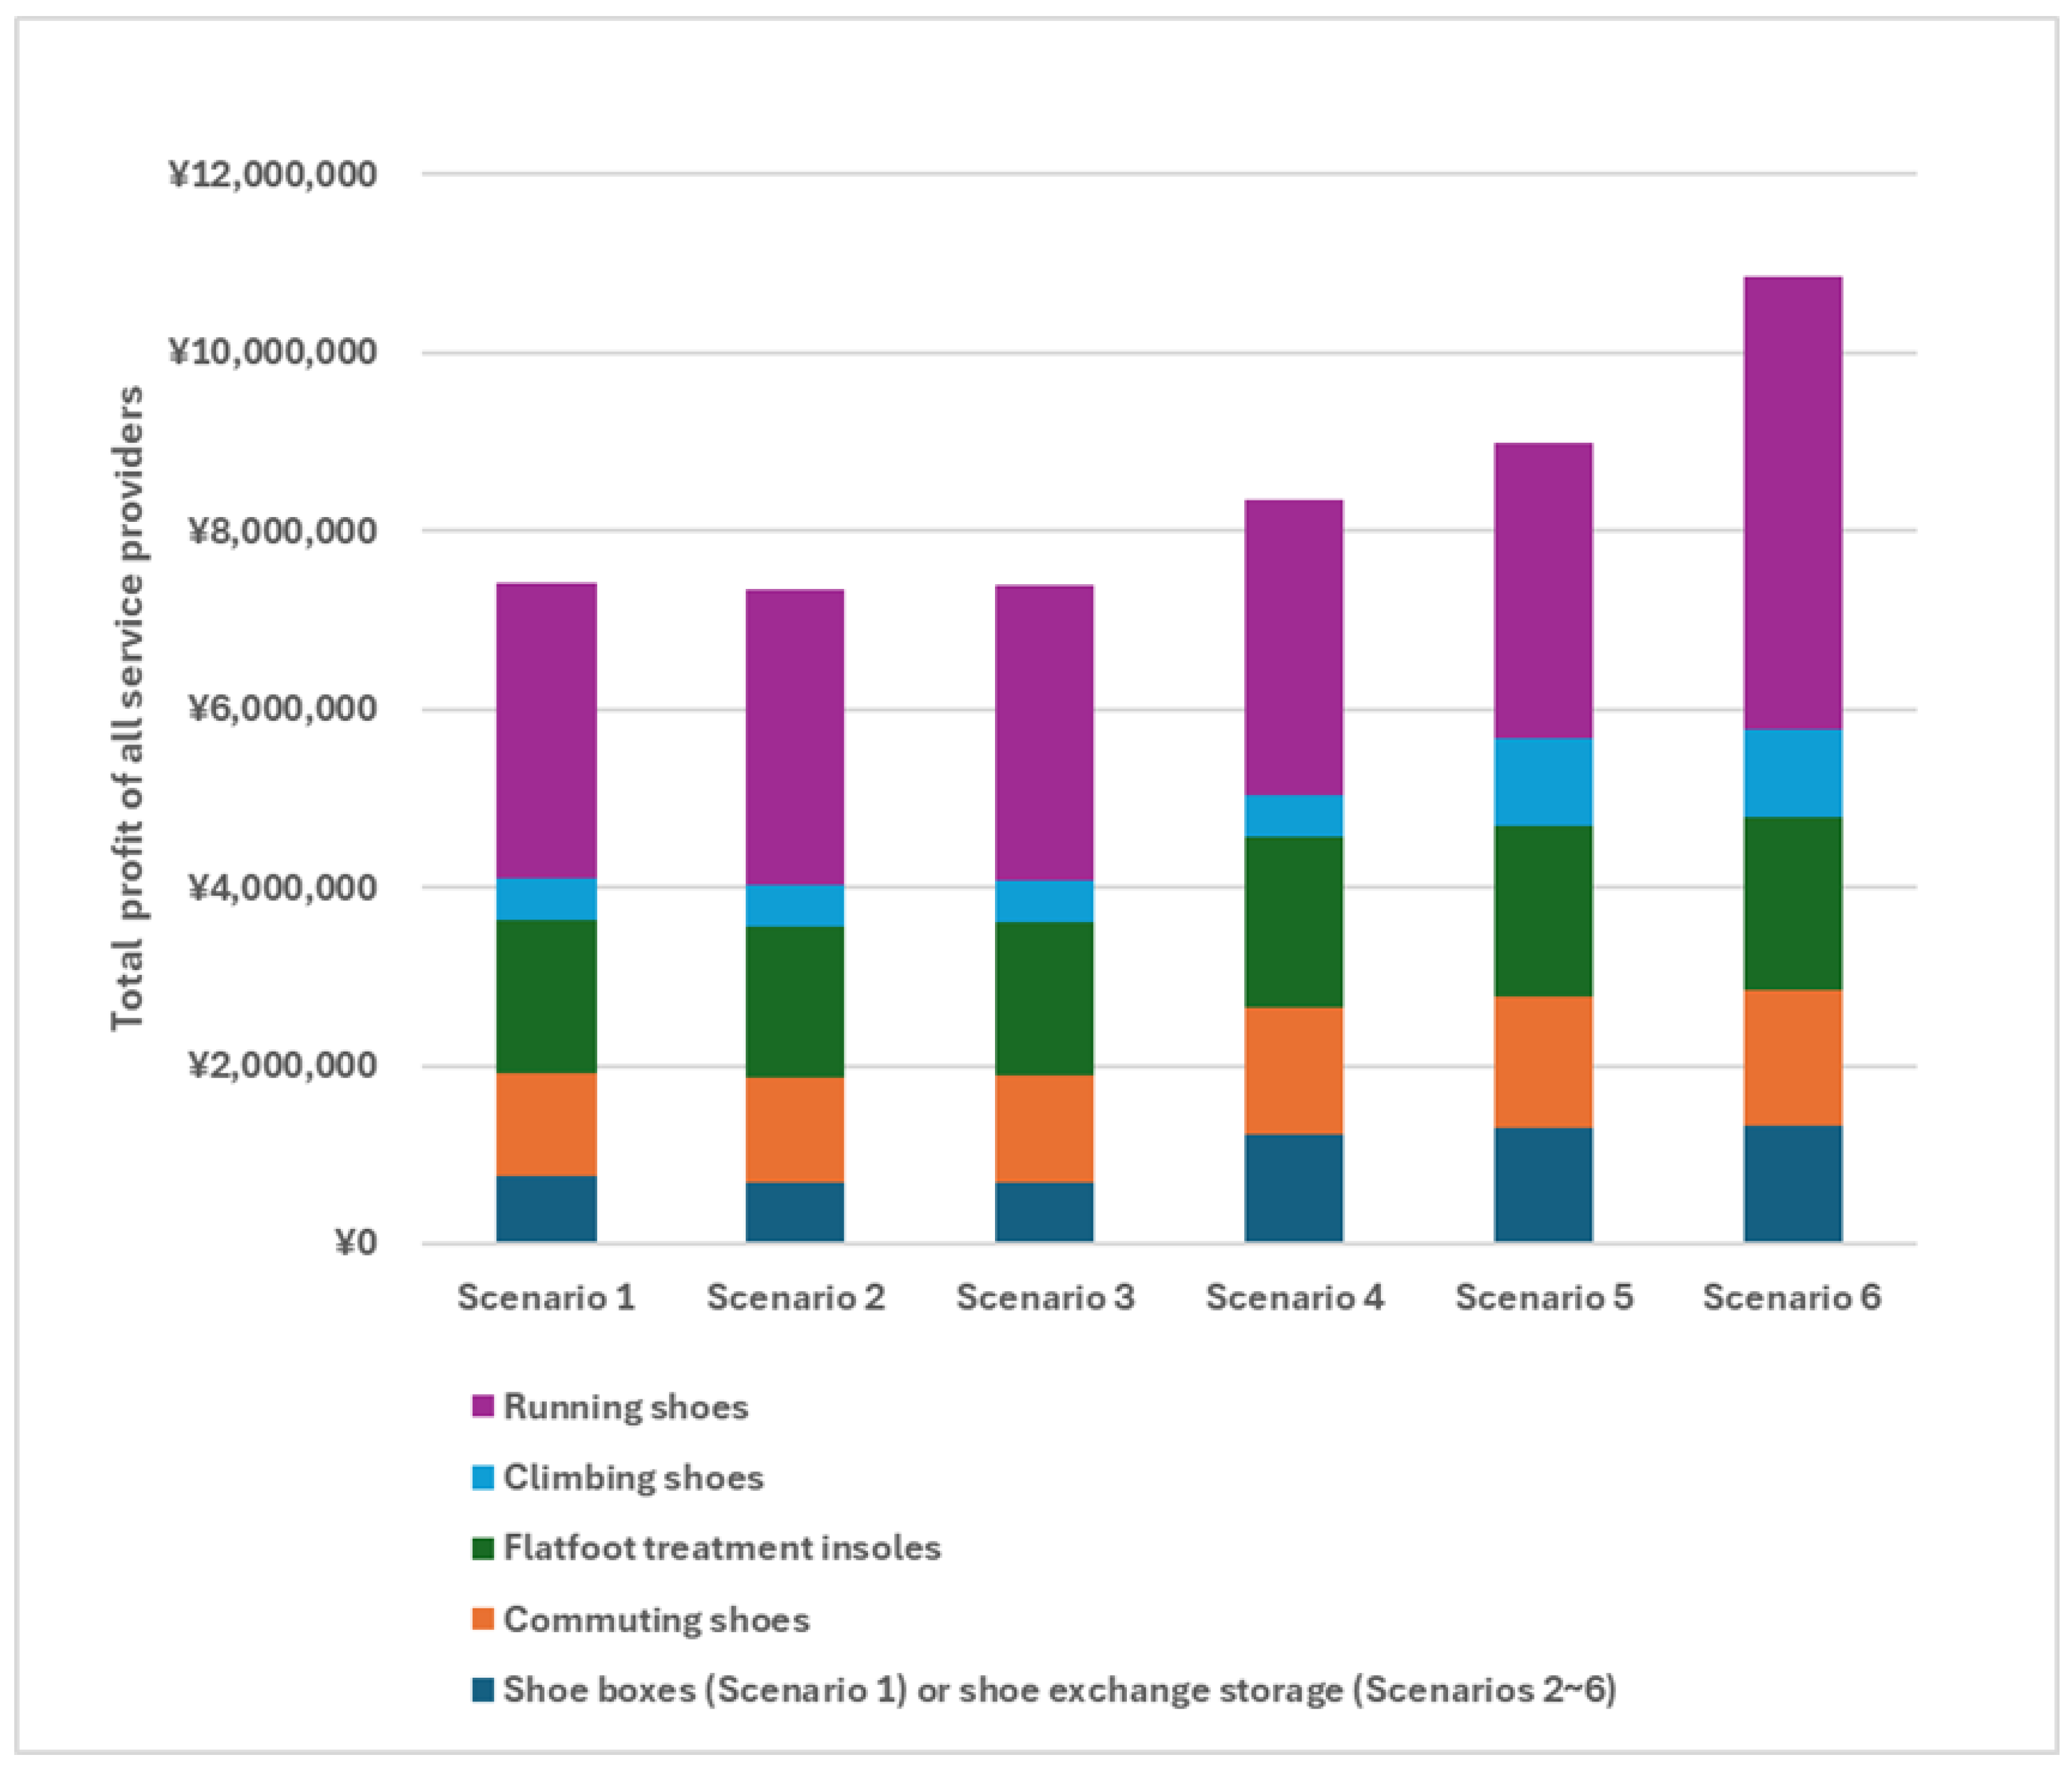
- Profits of the providers
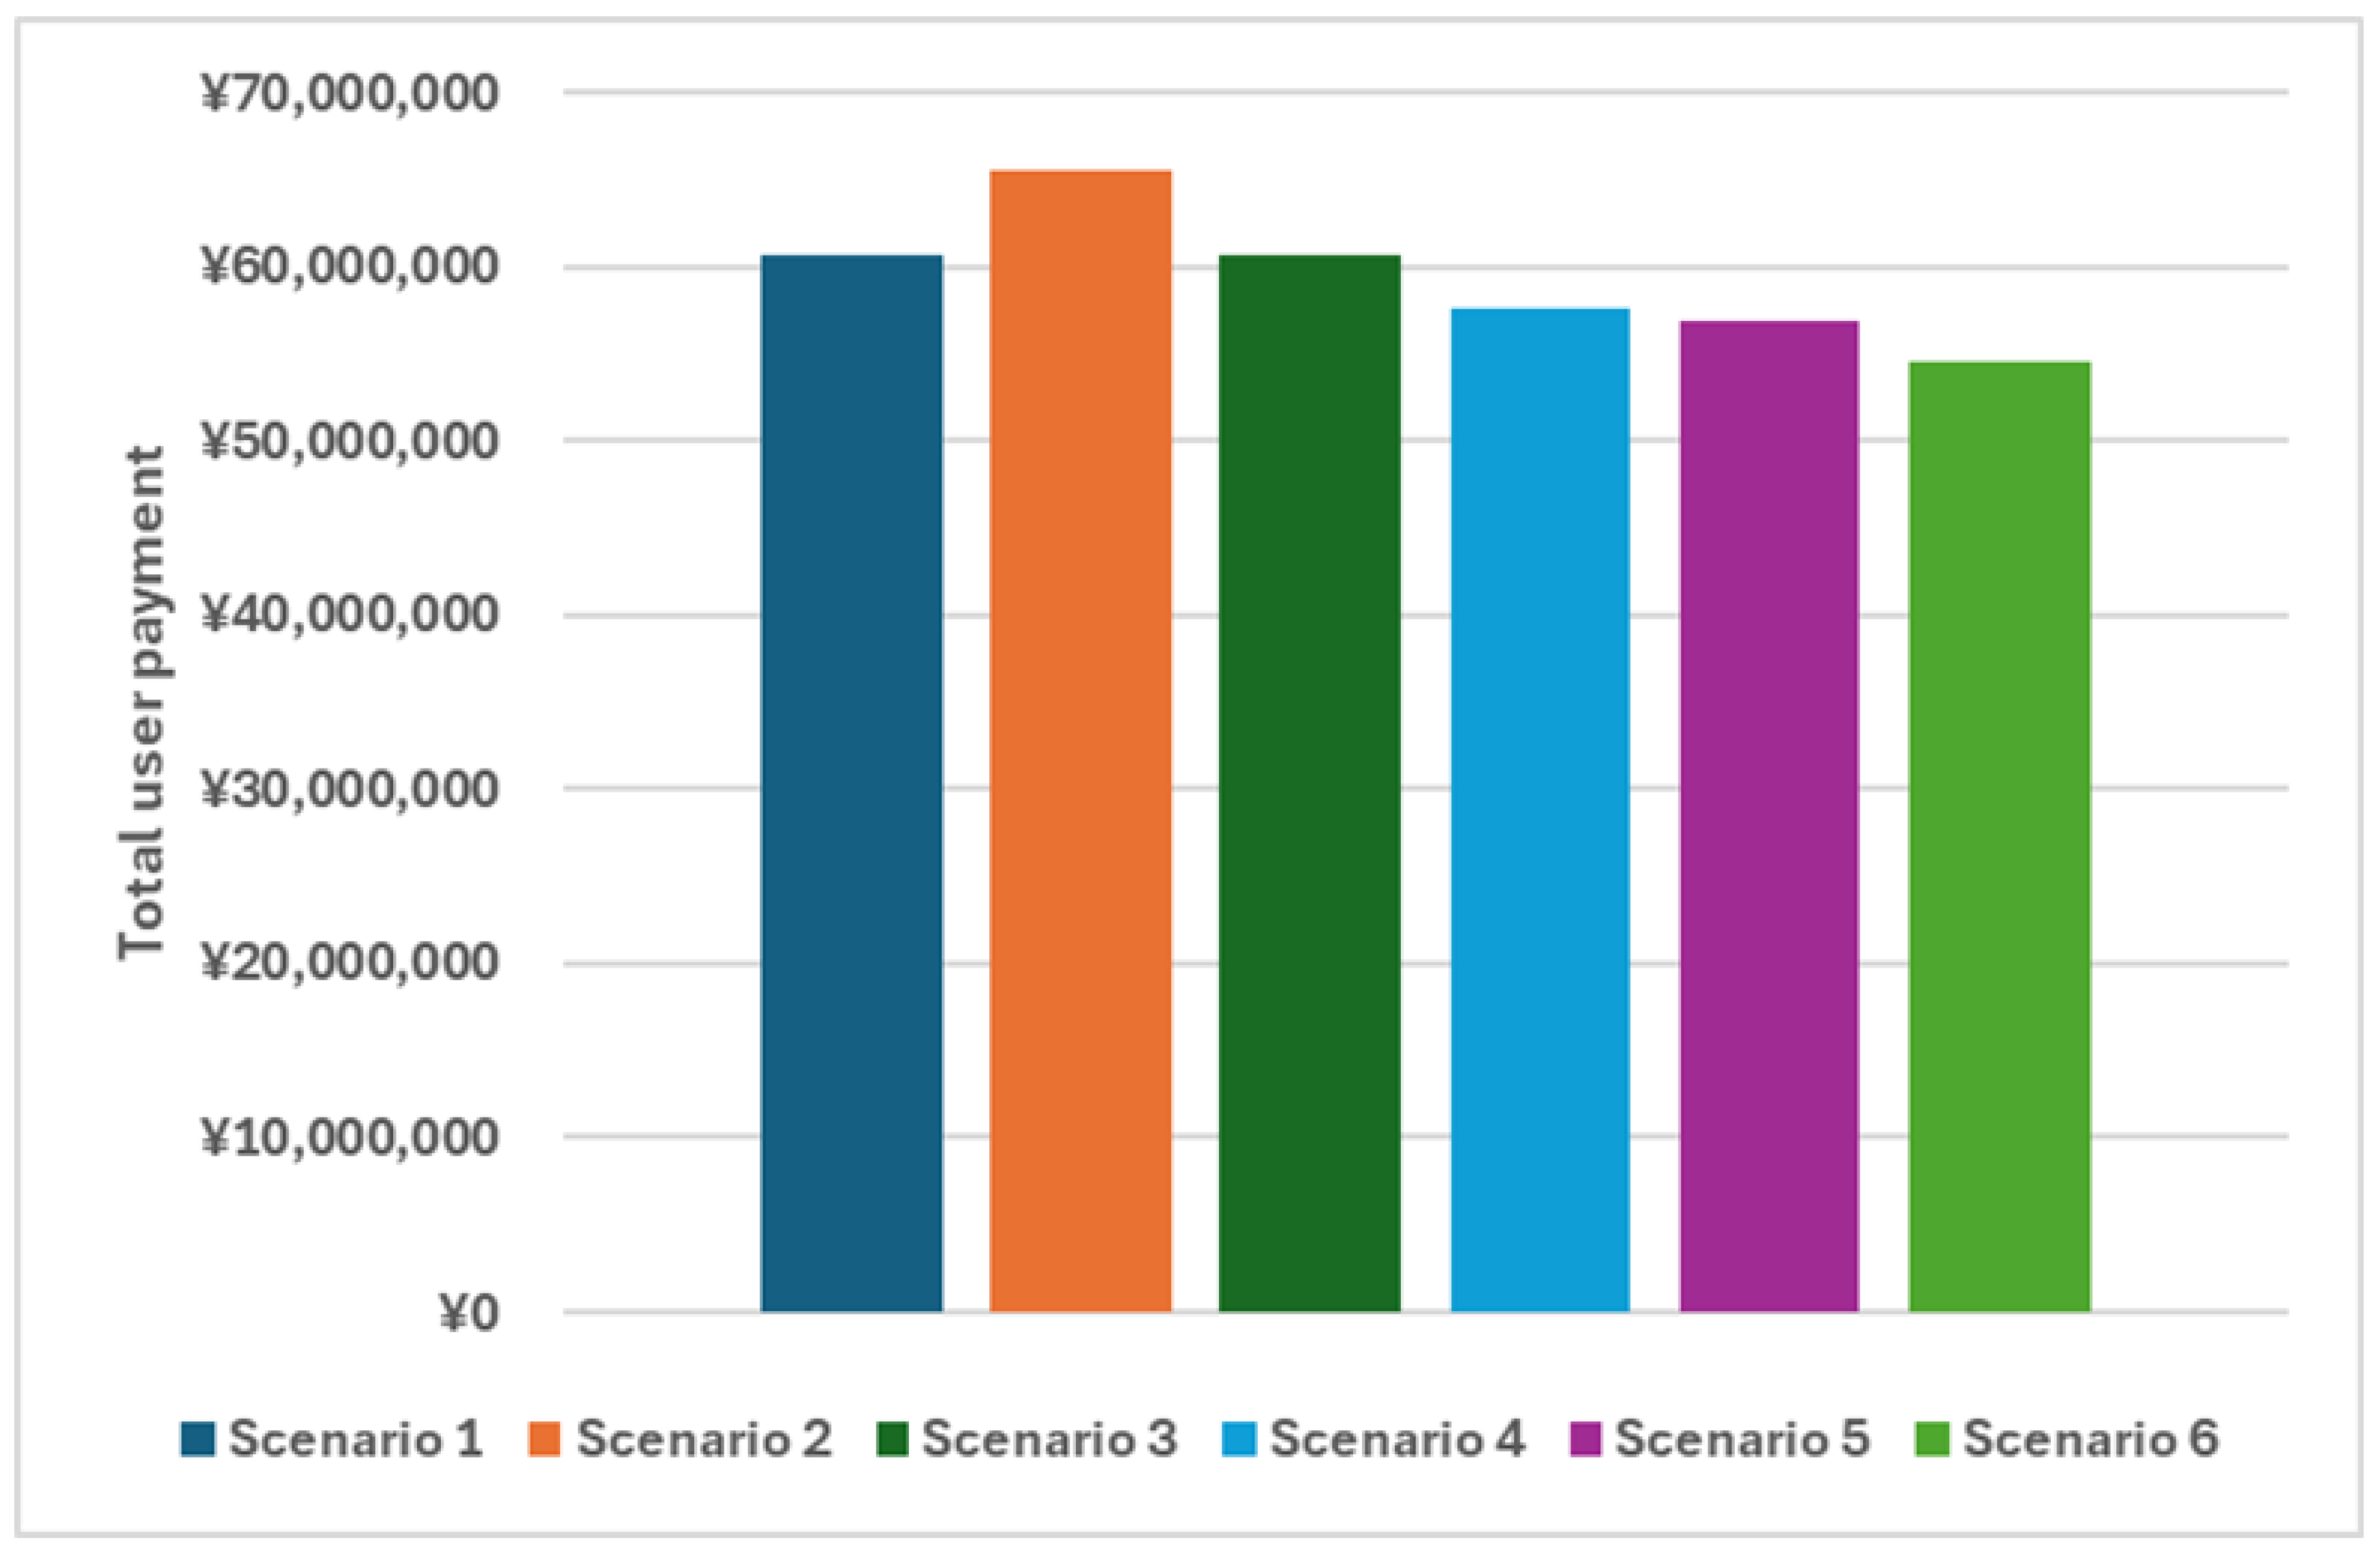
- Consumer payment
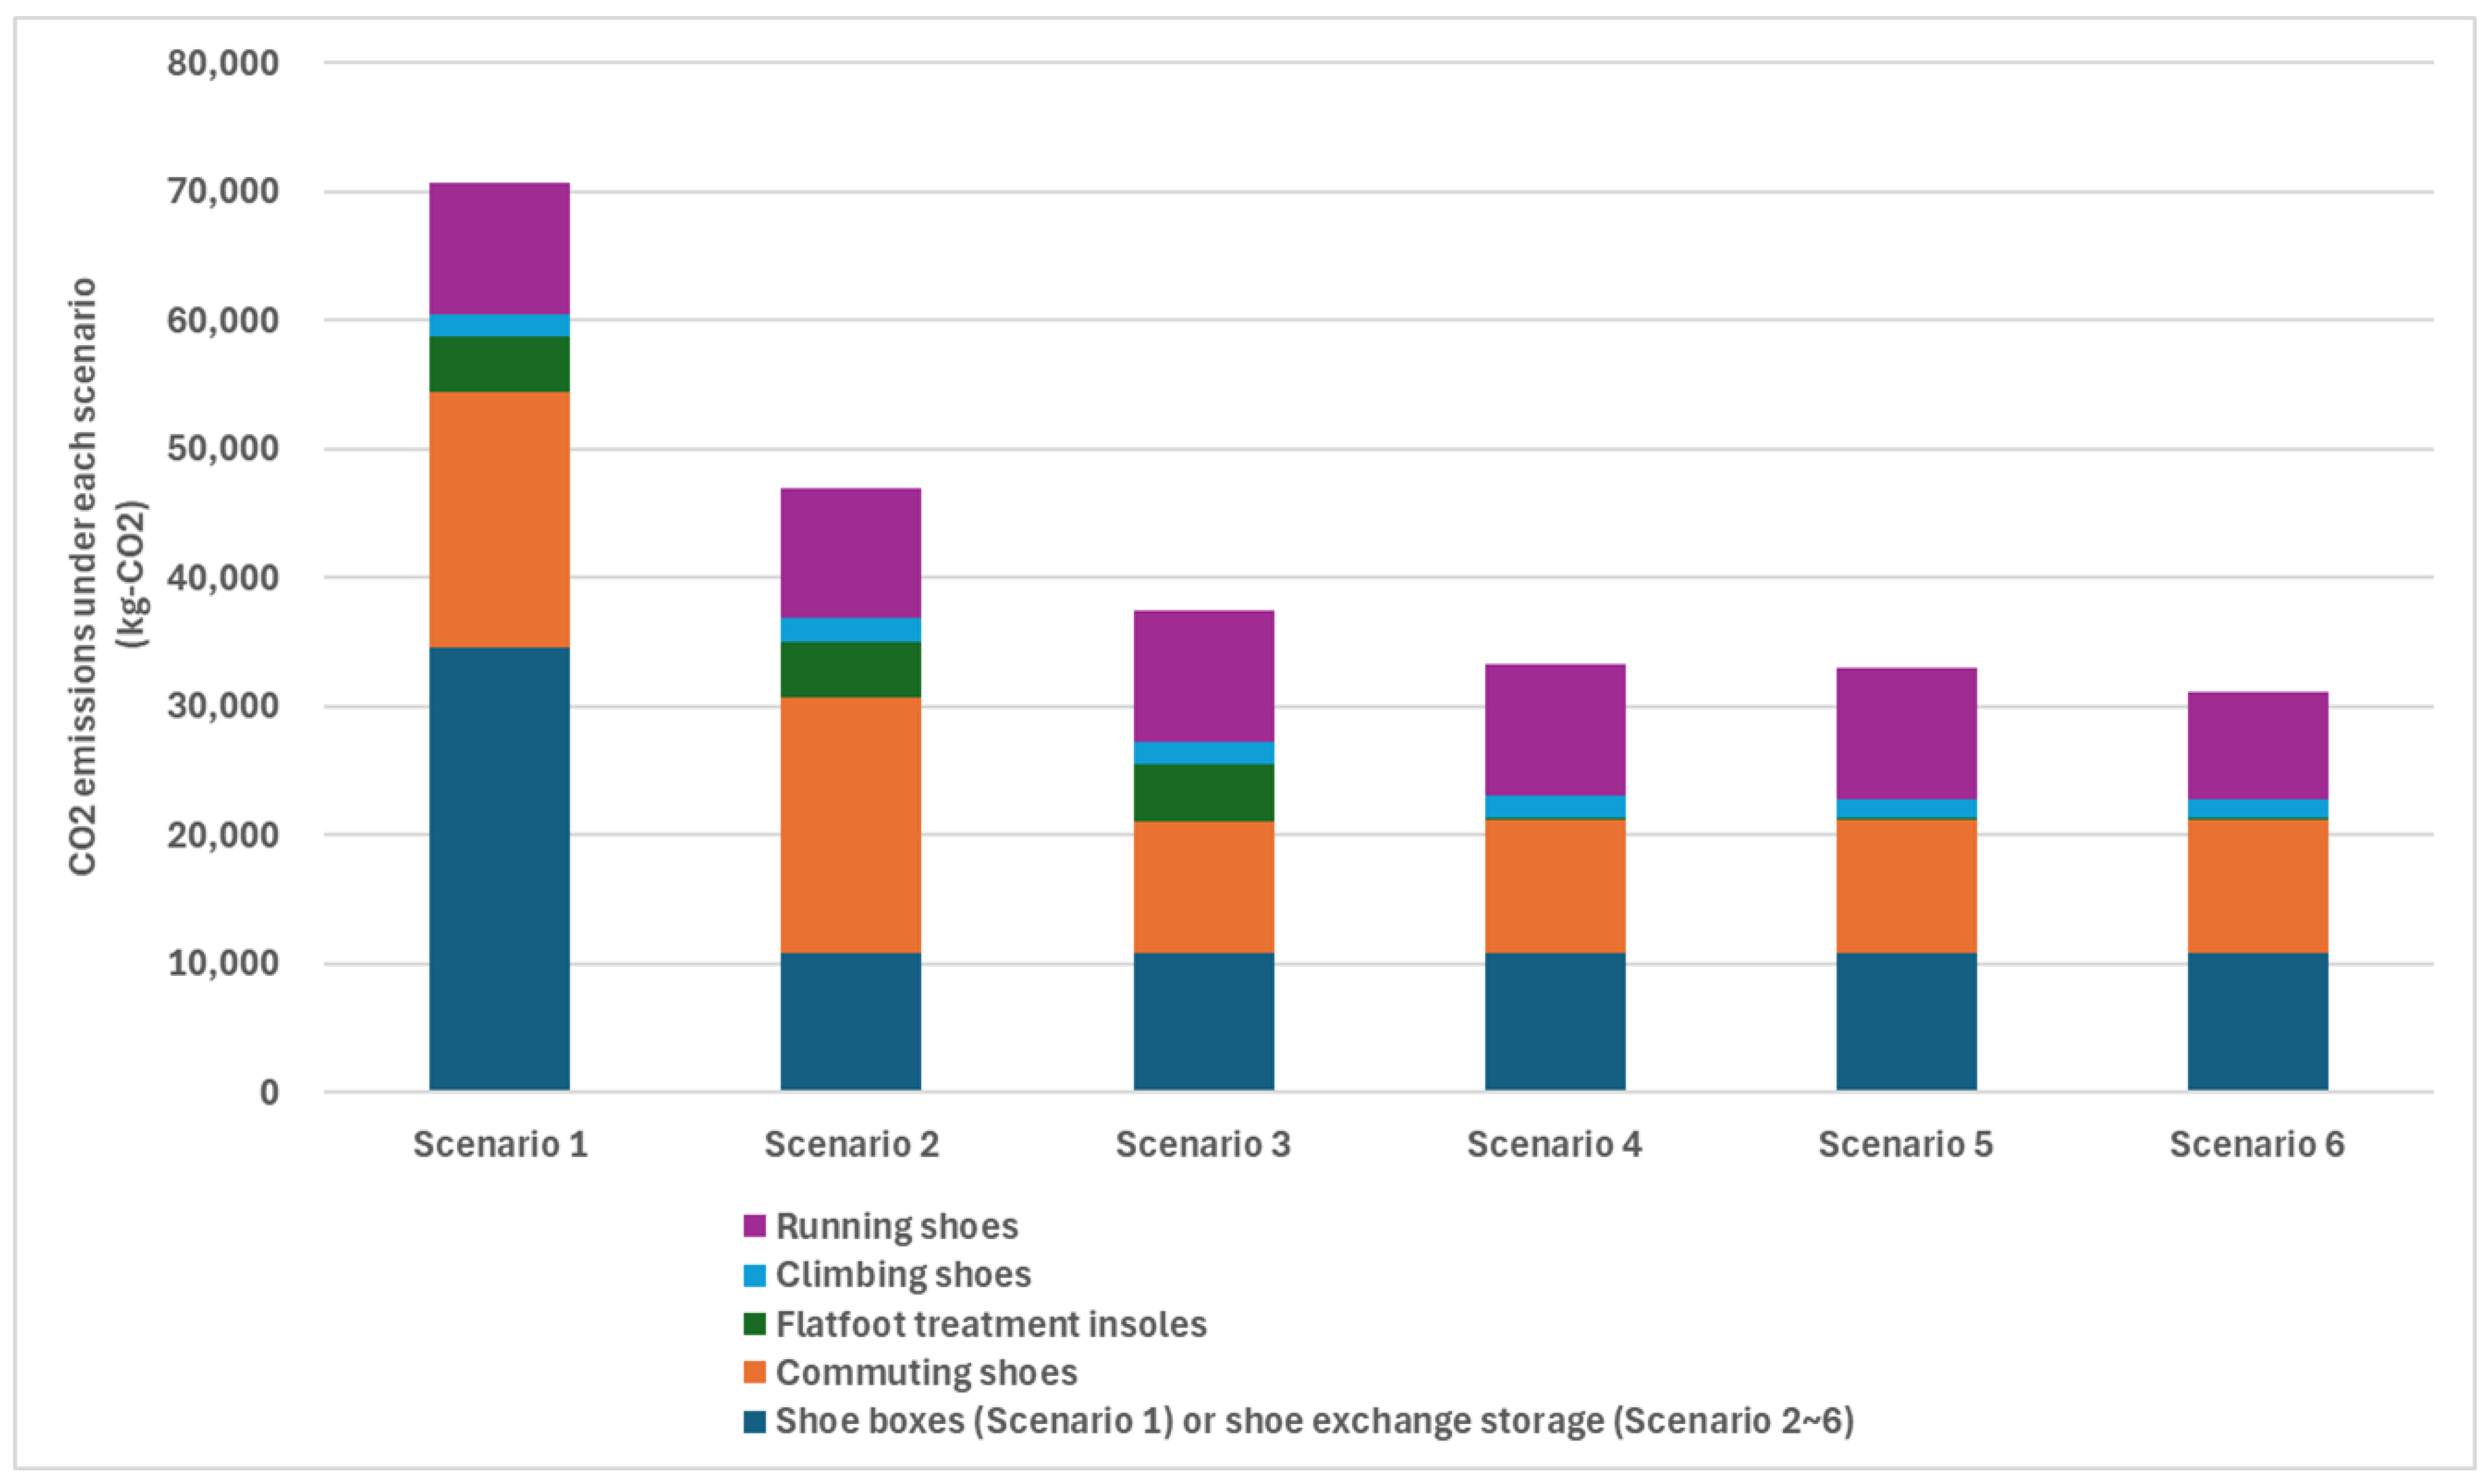
- CO2 emissions
Scenario 2
- Profits of the providers
- Consumer payment
- CO2 emissions
Scenario 3
- Profits of the providers
- Consumer payment
Scenario 4
- Profits of the providers
- Consumer payment
- CO2 emissions
Scenario 5
- Profits of the providers
- Consumer payment
- CO2 emissions
Scenario 6
- Profits of the providers
- Consumer payment
- CO2 emissions
4.3. Results
5. Discussion
6. Conclusions
Supplementary Materials
Author Contributions
Funding
Institutional Review Board Statement
Informed Consent Statement
Data Availability Statement
Acknowledgments
Conflicts of Interest
Abbreviations
| CE | Circular economy—An ecosystem that aims to reduce resource input and waste while maximizing the use of natural resources through cyclical material flow [4,5]. |
| IS | Industrial symbiosis—An ecosystem that includes diverse companies working together to improve resource efficiency and reduce waste through the exchange of materials and by-products [13,14]. |
| LC-IS model | Life cycle–information system model—A model that represents PLCs and products [47]. |
| LCS-ISS | Life cycle simulator with information system simulator—A simulator to simulate PLCs that exchange goods and data [47]. |
| MSP | Multi-sided platform—A platform facilitating interactions among diverse groups [31]. |
| PF-LCE | Platform-aggregated life cycle ecosystem—A type of business ecosystem composed of a platform and multiple interacting PLCs. |
| PLC | Product life cycle—The journey of a product from manufacturing to its ultimate disposal. It is defined by different processes such as manufacturing, use, refurbishment, and recycling [40]. |
References
- Ellen McArthur Foundation. Towards the Circular Economy. In Economic and Business Rationale for an Accelerated Transition; Ellen MacArthur Foundation: Cowes, UK, 2013. [Google Scholar]
- Del Vecchio, P.; Urbinati, A.; Kirchherr, J. Enablers of Managerial Practices for Circular Business Model Design: An Empirical Investigation of an Agro-Energy Company in a Rural Area. IEEE Trans. Eng. Manag. 2024, 71, 873–887. [Google Scholar] [CrossRef]
- Alcalde-Calonge, A.; Sáez-Martinez, F.J.; Ruiz-Palomino, P. Evolution of research on circular economy and related trends and topics. A thirteen-year review. Ecol. Inf. 2022, 70, 101716. [Google Scholar] [CrossRef]
- Geissdoerfer, M.; Savaget, P.; Bocken, N.M.P.; Hultink, E.J. The Circular Economy–A new sustainability paradigm? J. Clean Prod. 2017, 143, 757–768. [Google Scholar] [CrossRef]
- Korhonen, J.; Honkasalo, A.; Seppälä, J. Circular economy: The concept and its limitations. Ecol. Econ. 2018, 143, 37–46. [Google Scholar] [CrossRef]
- Kirchherr, J.; Reike, D.; Hekkert, M. Conceptualizing the Circular Economy: An Analysis of 114 Definitions; Elsevier B.V: Amsterdam, The Netherlands, 2017. [Google Scholar] [CrossRef]
- Kristensen, H.S.; Mosgaard, M.A. A review of micro level indicators for a circular economy–moving away from the three dimensions of sustainability? J. Clean Prod. 2020, 243, 118531. [Google Scholar] [CrossRef]
- Cecchin, A.; Salomone, R.; Deutz, P.; Raggi, A.; Cutaia, L. Relating industrial symbiosis and circular economy to the sustainable development debate. In Industrial Symbiosis for the Circular Economy: Operational Experiences, Best Practices and Obstacles to a Collaborative Business Approach; Springer: Cham, Switzerland, 2020; pp. 1–25. [Google Scholar]
- Domenech, T.; Bleischwitz, R.; Doranova, A.; Panayotopoulos, D.; Roman, L. Mapping Industrial Symbiosis Development in Europe_typologies of networks, characteristics, performance and contribution to the Circular Economy. Resour. Conserv. Recycl. 2019, 141, 76–98. [Google Scholar] [CrossRef]
- Sun, L.; Li, H.; Dong, L.; Fang, K.; Ren, J.; Geng, Y.; Fujii, M.; Zhang, W.; Zhang, N.; Liu, Z. Eco-benefits assessment on urban industrial symbiosis based on material flows analysis and emergy evaluation approach: A case of Liuzhou city, China. Resour. Conserv. Recycl. 2017, 119, 78–88. [Google Scholar] [CrossRef]
- Bocken, N.M.P.; De Pauw, I.; Bakker, C.; Van Der Grinten, B. Product design and business model strategies for a circular economy. J. Ind. Prod. Eng. 2016, 33, 308–320. [Google Scholar] [CrossRef]
- Iansiti, M. Strategy as Ecology. Harv. Bus. Rev. 2004, 82, 68–78. [Google Scholar]
- Moore, J.F. Predators and Prey: A New Ecology of Competition. Harv. Bus. Rev. 1993, 71, 75–86. [Google Scholar]
- Gawer, A. Platforms, Markets, Innovation; Edward Elgar Publishing: Cheltenha, UK, 2010. [Google Scholar]
- Tsujimoto, M.; Kajikawa, Y.; Tomita, J.; Matsumoto, Y. A review of the ecosystem concept—Towards coherent ecosystem design. Technol. Forecast. Soc. Change 2018, 136, 49–58. [Google Scholar] [CrossRef]
- Georgescu, A.; Peter, M.K.; Avasilcai, S. A business ecosystem framework for SME development through associative and non-associative business structures in the digital age. Cogent Bus. Manag. 2022, 9, 2143310. [Google Scholar] [CrossRef]
- Moore, J.F. The Death of Competition: Leadership and Strategy in the Age of Business Ecosystems; Harper Business: New York, NY, USA, 1996. [Google Scholar]
- Scaringella, L.; Radziwon, A. Innovation, entrepreneurial, knowledge, and business ecosystems: Old wine in new bottles? Technol. Forecast. Soc. Change 2018, 136, 59–87. [Google Scholar] [CrossRef]
- Kretschmer, T.; Leiponen, A.; Schilling, M.; Vasudeva, G. Platform ecosystems as meta-organizations: Implications for platform strategies. Strateg. Manag. J. 2022, 43, 405–424. [Google Scholar] [CrossRef]
- Hagiu, A.; Wright, J. Multi-sided platforms. Int. J. Ind. Organ. 2015, 43, 162–174. [Google Scholar] [CrossRef]
- Gawer, A.; Cusumano, M.A. Platform Leadership: How Intel, Microsoft, and Cisco Drive Industry Innovation; Harvard Business School Press: New York, NY, USA, 2002. [Google Scholar]
- Baldwin, C.Y.; Woodard, C.J. The architecture of platforms: A unified view. In Platforms, Markets and Innovation; Edward Elgar Publishing Ltd.: Northampton, MA, USA, 2009; pp. 19–44. [Google Scholar] [CrossRef]
- Eisenmann, T.; Parker, G.; Van Alstyne, M.W. Strategies for two-sided markets. Harv. Bus. Rev. 2006, 84, 92. [Google Scholar]
- Van Alstyne, M.W.; Parker, G.G.; Choudary, S.P. Pipelines, platforms, and the new rules of strategy. Harv. Bus. Rev. 2016, 94, 54–62. [Google Scholar]
- Jiao, J.; Simpson, T.W.; Siddique, Z. Product family design and platform-based product development: A state-of-the-art review. J. Intell. Manuf. 2007, 18, 5–29. [Google Scholar] [CrossRef]
- Mestre, A.; Cooper, T. Circular product design. A multiple loops life cycle design approach for the circular economy. Des. J. 2017, 20, S1620–S1635. [Google Scholar] [CrossRef]
- Gershenson, J.K.; Prasad, G.J.; Zhang, Y. Product modularity: Definitions and benefits. J. Eng. Des. 2003, 14, 295–313. [Google Scholar] [CrossRef]
- Facin, A.L.F.; De Vasconcelos Gomes, L.A.; De Mesquita Spinola, M.; Salerno, M.S. The Evolution of the Platform Concept: A Systematic Review. IEEE Trans. Eng. Manag. 2016, 63, 475–488. [Google Scholar] [CrossRef]
- Abdelkafi, N.; Raasch, C.; Roth, A.; Srinivasan, R. Multi-sided platforms. Electron. Mark. 2019, 29, 553–559. [Google Scholar] [CrossRef]
- Carroll, J.M.G.W.E.; Wang, Y.-M. Network Effects in Software Markets understanding network effects in software markets: Evidence from web server pricing. MIS Q. 2002, 26, 303–327. [Google Scholar]
- Baldassarre, B.; Schepers, M.; Bocken, N.; Cuppen, E.; Korevaar, G.; Calabretta, G. Industrial Symbiosis: Towards a design process for eco-industrial clusters by integrating Circular Economy and Industrial Ecology perspectives. J. Clean. Prod. 2019, 216, 446–460. [Google Scholar] [CrossRef]
- Zott, C.; Amit, R. Business model design: An activity system perspective. Long Range Plan. 2010, 43, 216–226. [Google Scholar] [CrossRef]
- Spagnoletti, P.; Resca, A.; Lee, G. A design theory for digital platforms supporting online communities: A multiple case study. J. Inf. Technol. 2015, 30, 364–380. [Google Scholar] [CrossRef]
- Barquet, A.P.B.; de Oliveira, M.G.; Amigo, C.R.; Cunha, V.P.; Rozenfeld, H. Employing the business model concept to support the adoption of product–service systems (PSS). Ind. Mark. Manag. 2013, 42, 693–704. [Google Scholar] [CrossRef]
- Allweins, M.M.; Proesch, M.; Ladd, T. The Platform Canvas—Conceptualization of a Design Framework for Multi-Sided Platform Businesses. Entrep. Educ. Pedagog. 2021, 4, 455–477. [Google Scholar] [CrossRef]
- Ritala, P.; Golnam, A.; Wegmann, A. Coopetition-based business models: The case of Amazon.com. Ind. Mark. Manag. 2014, 43, 236–249. [Google Scholar] [CrossRef]
- Han, J.; Heshmati, A.; Rashidghalam, M. Circular economy business models with a focus on servitization. Sustainability 2020, 12, 8799. [Google Scholar] [CrossRef]
- Burke, H.; Zhang, A.; Wang, J.X. Integrating product design and supply chain management for a circular economy. Prod. Plan. Control. 2023, 34, 1097–1113. [Google Scholar] [CrossRef]
- Tukker, A. Product services for a resource-efficient and circular economy—A review. J. Clean. Prod. 2015, 97, 76–91. [Google Scholar] [CrossRef]
- Umeda, Y.; Takata, S.; Kimura, F.; Tomiyama, T.; Sutherland, J.W.; Kara, S.; Herrmann, C.; Duflou, J.R. Toward integrated product and process life cycle planning—An environmental perspective. CIRP Ann. 2012, 61, 681–702. [Google Scholar] [CrossRef]
- Umeda, Y.; Nonomura, A.; Tomiyama, T. Study on life-cycle design for the post mass production paradigm. AI EDAM 2000, 14, 149–161. [Google Scholar] [CrossRef]
- Chauhan, C.; Parida, V.; Dhir, A. Linking circular economy and digitalisation technologies: A systematic literature review of past achievements and future promises. Technol. Forecast. Soc. Change 2022, 177, 121508. [Google Scholar] [CrossRef]
- Rusch, M.; Schöggl, J.P.; Baumgartner, R.J. Application of digital technologies for sustainable product management in a circular economy: A review. Bus. Strategy Environ. 2023, 32, 1159–1174. [Google Scholar] [CrossRef]
- Tamura, T.; Odagaki, R.; Kishita, Y.; Umeda, Y.; Miyake, G.; Matsuda, G.; Tajima, A. A Method for Simulating an Information System with Life Cycle Simulation. Int. J. Autom. Technol. 2024, 18, 774–785. [Google Scholar] [CrossRef]
- Stickdorn, M.; Schneider, J. This is Service Design Thinking: Basics, Tools, Cases; John Wiley & Sons: Hoboken, NJ, USA, 2012. [Google Scholar]
- Shimomura, Y.; Tomiyama, T. Service modeling for service engineering. In International Working Conference on the Design of Information Infrastructure Systems for Manufacturing; Springer: Berlin/Heidelberg, Germany, 2002; pp. 31–38. [Google Scholar]
- Bitner, M.J.; Ostrom, A.L.; Morgan, F.N. Service blueprinting: A practical technique for service innovation. Calif. Manag. Rev. 2008, 50, 66–94. [Google Scholar] [CrossRef]
- Kawakita, J. Hasso-Ho: Revised Edition–For Developing Creativity; Chuo Koron Shinsha: Tokyo, Japan, 2013; ISBN 4121801369. (In Japanese) [Google Scholar]
- Kawakita, J. Zoku Hasso-Ho: Development and Application of the KJ Method; Chuo Koron Shinsha: Tokyo, Japan, 2013; ISBN 4121002105. (In Japanese) [Google Scholar]
- MLTI, Investigation in Housing Complexes. 2024. Available online: https://www.mlit.go.jp/jutakukentiku/house/content/001750163.pdf (accessed on 14 August 2024).
- Ministry of Internal Affairs and Communications. 2022. 2020 Population Census of Japan: Basic tabulation on population and other characteristics. Available online: https://www.stat.go.jp/data/kokusei/2020/kekka/pdf/outline_01.pdf (accessed on 14 August 2024).
- Sunilabo. Survey on Lifespan of Sneakers. 2024. Available online: https://prtimes.jp/main/html/rd/p/000000006.000102094.html (accessed on 14 August 2024).
- MyVoice. Survey on Shoes (5th Edition). 2024. Available online: https://myel.myvoice.jp/products/detail.php?product_id=31409 (accessed on 17 March 2024).
- Masuyama, E.; Inoue, Y.; Nakamura, K.; Kenichi. Determining foot arch development period in children based on footprint analysis. Fac. Hum. Cult. Sci. Dep. Bull. Pap. 2012, 7, 25–36. [Google Scholar]
- MIAC. Survey on Time Use and Leisure Activities. 2024. Available online: https://www.stat.go.jp/data/shakai/2021/pdf/gaiyoua.pdf (accessed on 17 March 2024).
- Nitori Holdings Co., Ltd. Nitori Net Product Page. 2024. Available online: https://www.nitori-net.jp/ec/product/0625001s/ (accessed on 17 March 2024).
- Nitori Holdings Co., Ltd. Consolidated Profit and Loss Statement. 2024. Available online: https://www.nitorihd.co.jp/ir/performance/pl.html/. (accessed on 17 March 2024).
- Forestry Agency of Japan. FY2015 Report on the Promotion of Wood Use and Demonstration of Energy Saving and CO2 Reduction. 2016. Available online: https://www.rinya.maff.go.jp/j/riyou/mieruka/attach/pdf/kankyoukouken-6.pdf (accessed on 4 February 2025).
- MIAC. Retail Price Survey. 2024. Available online: https://www.e-stat.go.jp/dbview?sid=0003420453 (accessed on 14 August 2024).
- MIAC. Survey of Economic Structure. 2024. Available online: https://www.e-stat.go.jp/dbview?sid=0004007360 (accessed on 4 February 2025).
- Allbirds, Inc. Men’s Tree Runners. Online. 2024. Available online: https://www.goldwin.co.jp/ap/item/i/m/ABM240073 (accessed on 14 August 2024).
- ASICS Corporation. Visualize the Carbon Footprint. 2024. Available online: https://www.asics.com/jp/ja-jp/mk/sustainability/carbonfootprint (accessed on 4 February 2025).
- Sanshin Enterprises Co., Ltd. DSIS Sorbo Running Insoles. 2024. Available online: https://jpn.mizuno.com/ec/disp/attgrp/8ZA614/ (accessed on 4 February 2025).
- Allbirds, Inc. Men’s Wool & Tree Runner Insoles. 2024. Available online: https://www.allbirds.com/products/mens-runner-insoles (accessed on 4 February 2025).
- Mont-Bell Co., Ltd. Alpine Cruiser 800 Men’s. 2024. Available online: https://webshop.montbell.jp/goods/disp.php?product_id=1129628. (accessed on 4 February 2024).
- Allbirds, Inc. Mc Runner. 2024. Available online: https://www.allbirds.com/products/mens-superlight-tree-runners (accessed on 4 February 2025).
- NEC Corporation. A-Rrowg Product Page. 2022. Available online: https://jpn.nec.com/wellness/index.html#anc-03 (accessed on 25 June 2025).
- MIAC. Basic Survey of Information and Communications Industry. 2023. Available online: https://www.soumu.go.jp/johotsusintokei/statistics/data/jouhoutsuusin240329b.pdf (accessed on 14 August 2024).
- Life Cycle Assessment Society of Japan. Guidelines for Standardizing Environmental Efficiency Indicators for Electrical and Electronic Products. 2009. Available online: https://lca-forum.org/research/factorx/pdf/01.pdf (accessed on 14 August 2024).
- Japan Environmental Storage & Safety Corporation (JESCO). Environmental Report. Available online: https://www.jesconet.co.jp/content/000011752.pdf (accessed on 14 August 2024).
- Well Up Co., Ltd. Foot Checker. 2022. Available online: https://wellup.jp/healthcheck/footchecker.php (accessed on 14 August 2024).
- JRMA. Follow-Up Survey Results of the Carbon Neutral Action Plan. 2024. Available online: https://www.rubber.or.jp/kanri/download.php?file=page2.1.63.pdf&org=2023_CO2.pdf (accessed on 14 August 2024).
- Raspberry Pi 5. Raspberry Shop. 2025. Available online: https://raspberry-pi.ksyic.com/ (accessed on 10 March 2025).
- Mouser Electronics, Inc. Raspberry Pi SC1820 Carbon Removal Credits. 2025. Available online: https://www.mouser.jp/new/raspberry-pi/raspberry-pi-sc1820-carbon-removal-credit/ (accessed on 10 March 2025).
- Mizuno Corporation. Mizuno Foot Care Station. Available online: https://jpn.mizuno.com/shop/footcare_station (accessed on 17 March 2024).
- Pandremenos, J.; Paralikas, J.; Salonitis, K.; Chryssolouris, G. Modularity concepts for the automotive industry: A critical review. CIRP J. Manuf. Sci. Technol. 2009, 1, 148–152. [Google Scholar] [CrossRef]
- Catena-X. Business Areas in the Catena-X Ecosystem. Available online: https://catena-x.net/overview-use-case-cluster/ (accessed on 10 March 2025).
- Tao, F.; Zhang, Y.; Cheng, Y.; Ren, J.; Wang, D.; Qi, Q.; Li, P. Digital twin and blockchain enhanced smart manufacturing service collaboration and management. J. Manuf. Syst. 2022, 62, 903–914. [Google Scholar] [CrossRef]
- Yu, K.; Tan, L.; Aloqaily, M.; Yang, H.; Jararweh, Y. Blockchain-Enhanced Data Sharing with Traceable and Direct Revocation in IIoT. IEEE Trans. Ind. Inform. 2021, 17, 7669–7678. [Google Scholar] [CrossRef]
- MIAC. Item Information for Consumer Price Index. 2020. Available online: https://www.stat.go.jp/data/cpi/2020/kaisetsu/pdf/4-1.pdf (accessed on 14 August 2024).
- Daikin Industries Ltd. OptiTrack. 2023. Available online: https://www.itec.daikin.co.jp/DC/prd/opti/prd/price.html (accessed on 25 June 2025).
- Yamato Transport Co., Ltd. Fare Chart. 2022. Available online: https://www.kuronekoyamato.co.jp/ytc/search/estimate/ichiran.html (accessed on 14 August 2024).
- NTA. Statistical Survey of Actual Status for Salary in the Private Sector. 2022. Available online: https://www.nta.go.jp/publication/statistics/kokuzeicho/minkan/gaiyou/2022.htm (accessed on 14 August 2024).
- Japan Institute of Logistics Systems. Standard Calculation Method for Carbon Dioxide Emissions in Transport and Distribution. 2022. Available online: https://www.logistics.or.jp/green/pdf/04lems_3.pdf (accessed on 14 August 2024).
- MLTI. Vehicle Origin and Destination Survey. Available online: https://www.mlit.go.jp/report/press/content/001572498.pdf (accessed on 14 August 2024).
- Mizuno Corporation. Mizuno Running Support. 2023. Available online: https://jpn.mizuno.com/running/support/runningform (accessed on 14 August 2024).
- MHLW. National Health and Nutrition Survey. 2019. Available online: https://www.e-stat.go.jp/dbview?sid=0003224177 (accessed on 14 August 2024).
- MIAC. National Censonus: House Members of Families. 2019. Available online: https://www.e-stat.go.jp/dbview?sid=0003445109 (accessed on 14 August 2024).
- MIAC. National Census: House Members of Single-Mother Families. 2019. Available online: https://www.e-stat.go.jp/dbview?sid=0003445226 (accessed on 14 August 2024).
- MIAC. National Census: House Members of Single-Father Families. 2019. Available online: https://www.e-stat.go.jp/dbview?sid=0003445232 (accessed on 14 August 2024).


| Element | Detail |
|---|---|
| (1) PLCs | This element represents the PLCs that a PF-LCE encompasses. To clarify how the PLCs interacts with each other, the designers design how the stakeholders and products in each PLC send and utilize the goods and data in their activities. |
| (2) Platform | This element represents the platform in a PF-LCE. To clarify how the platform acts in mediating the goods and data, the designers design the function and activities of the platform. To mediate the various types of goods and data among various stakeholders, the platform should have functions and spaces for the mediation and be accessible for the stakeholders. Furthermore, the platform should incorporate digital infrastructure (such as software, blockchain, and Internet of Things devices) that enables data mediation. |
| (3) Goods and data exchanged among PLCs | This element represents the goods and data exchanged among PLCs. The platform (Element (1)) mediates the goods and data. |
| Element | Detail |
|---|---|
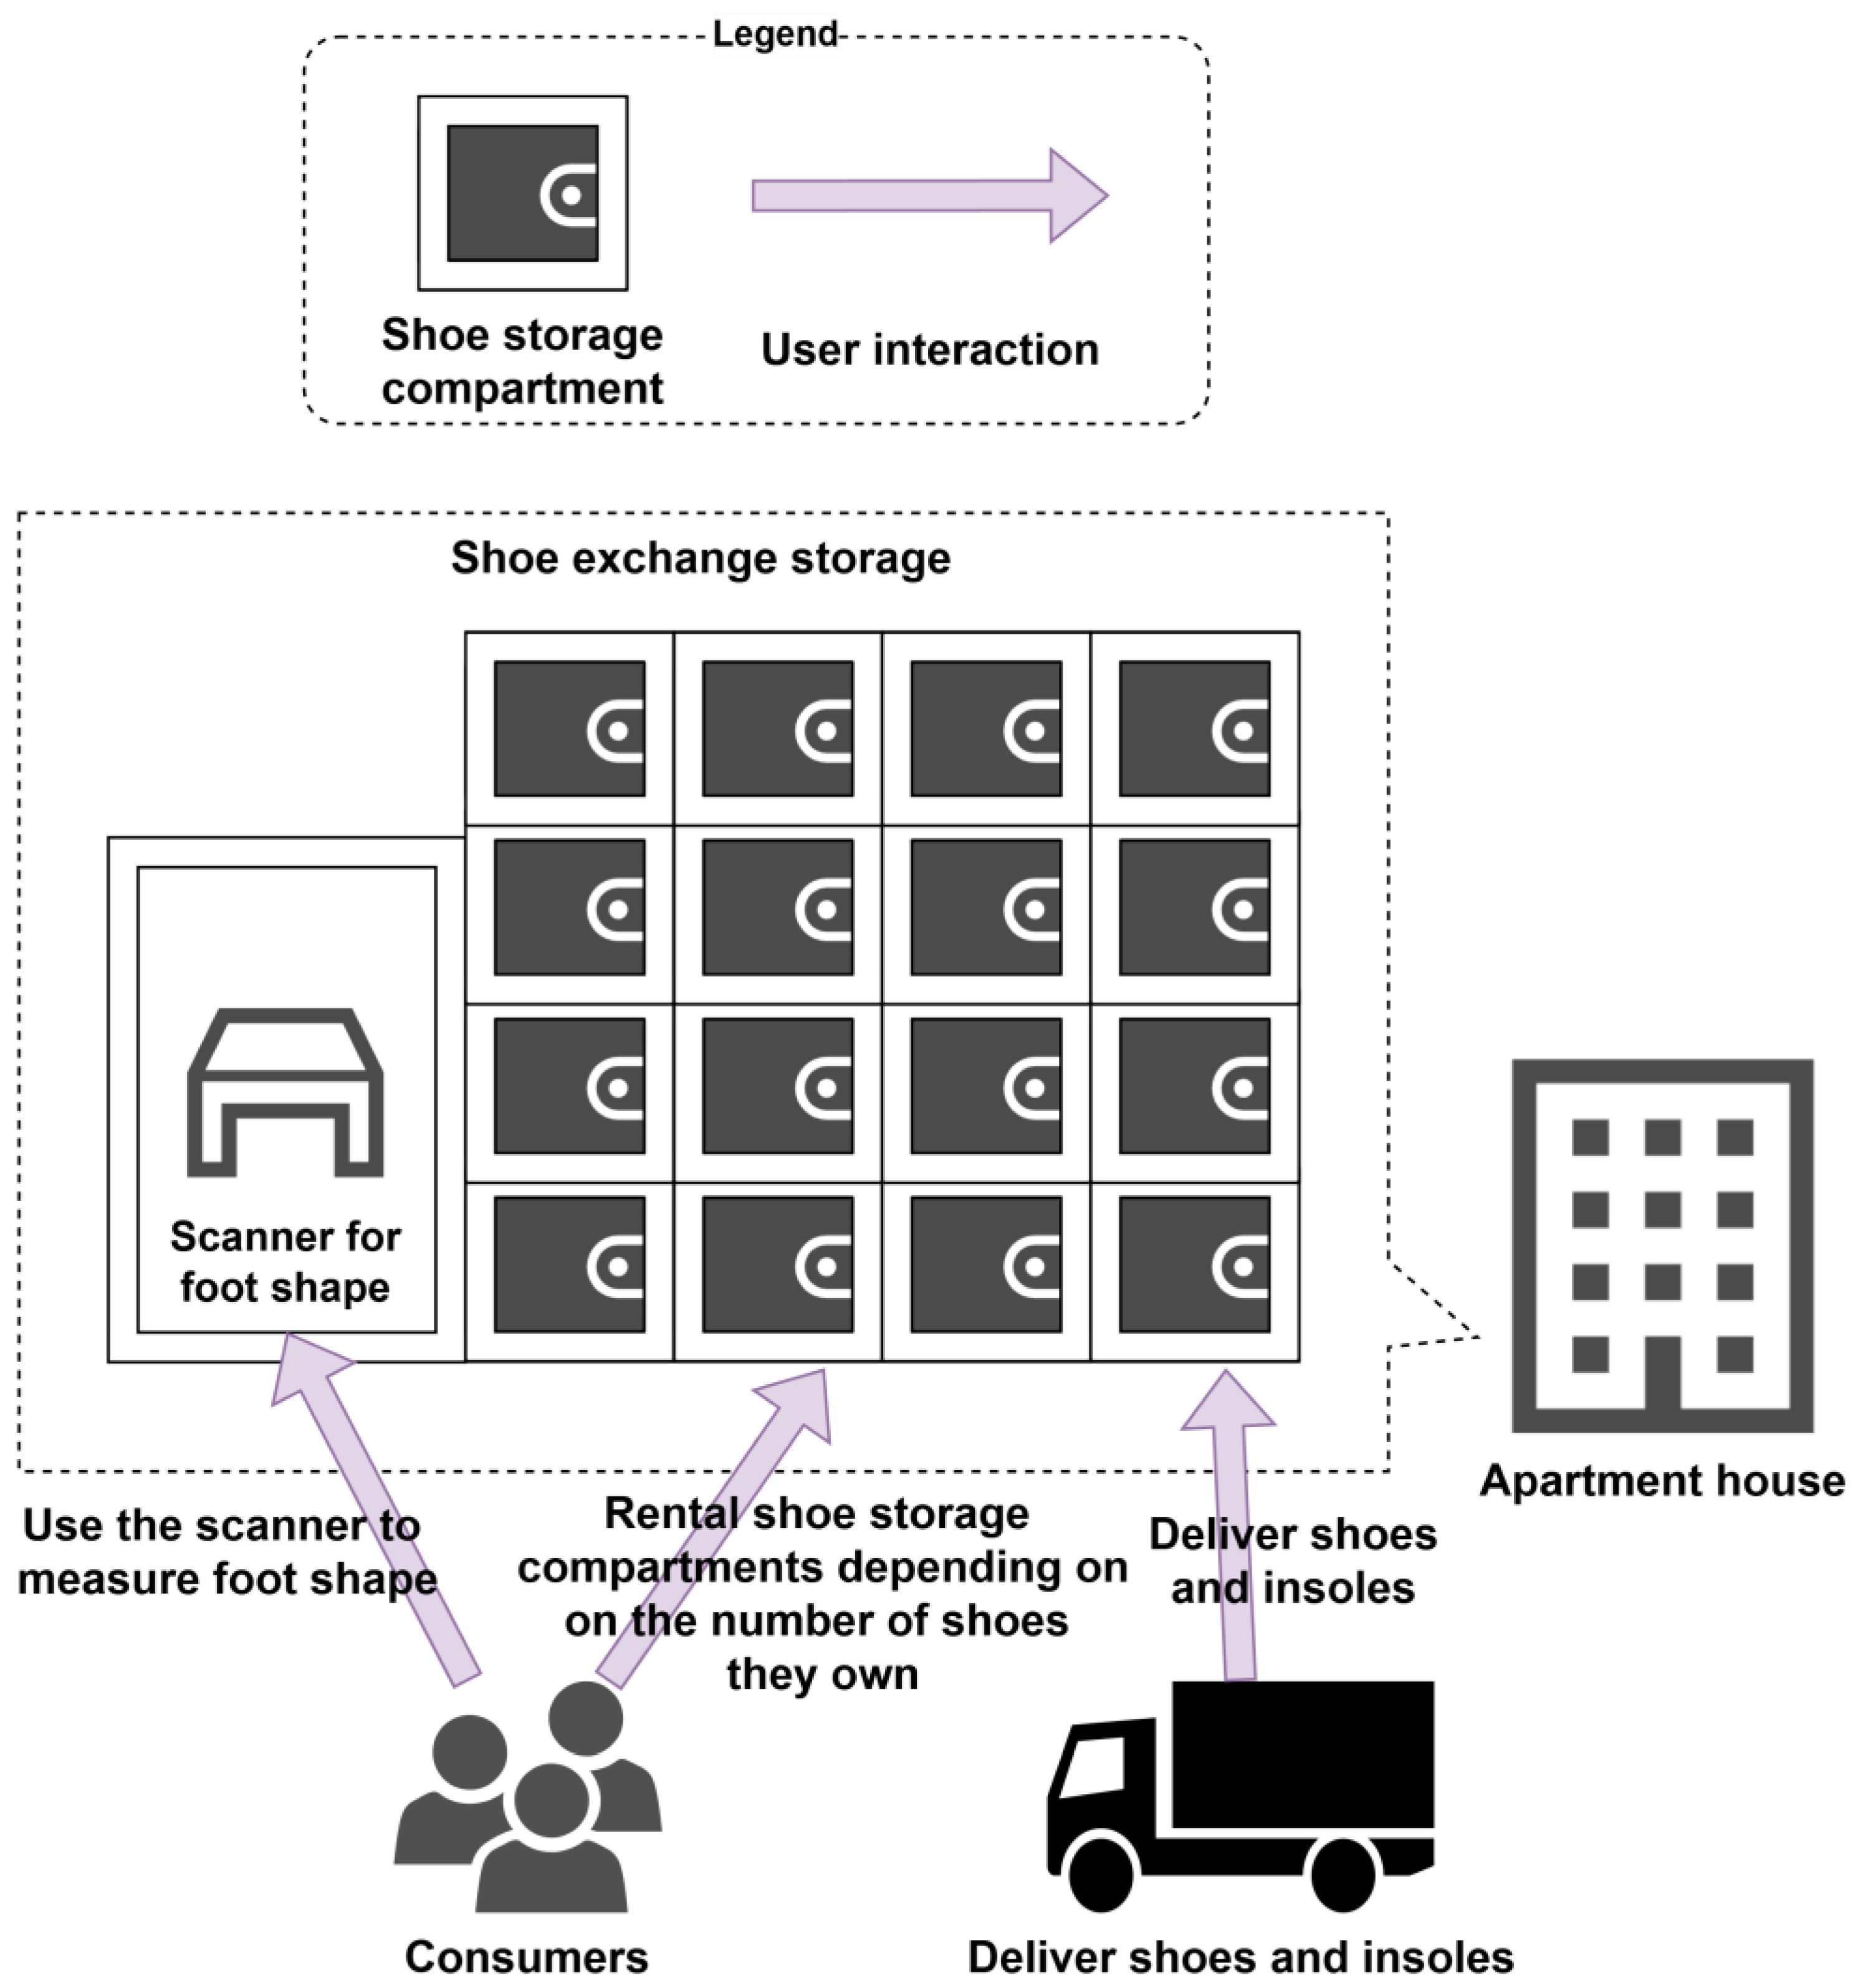
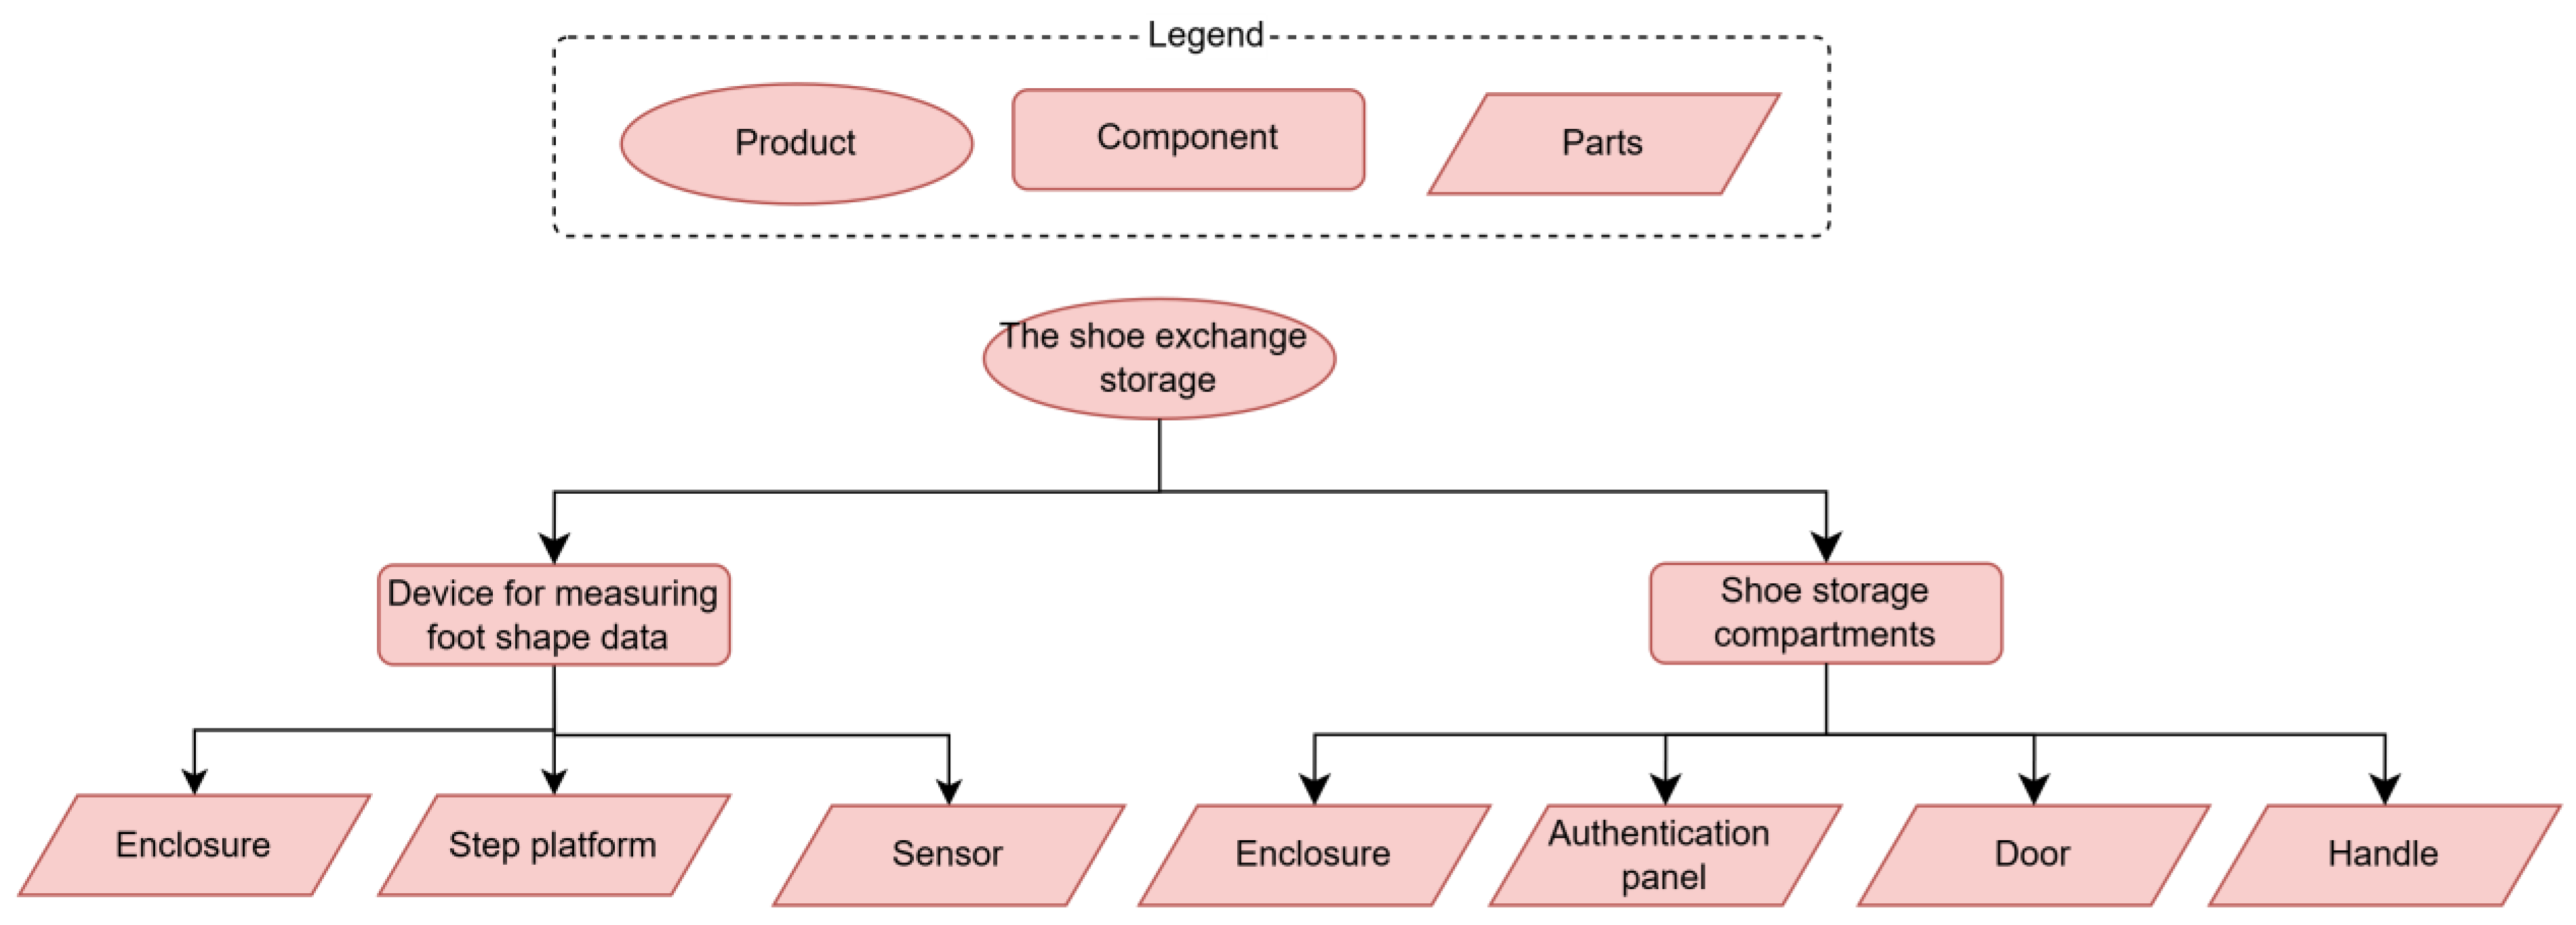
| (1) PLCs | PLC for commuting shoes: Commuting shoes are provided with a rental model. To collect gait data, the provider of the commuting shoes manufactures sensors for the data. Before consumers purchase flat-foot treatment insoles, running shoes, or climbing shoes, the provider inserts the sensors into the commuting shoes. By using the commuting shoes, the sensors collect the gait data and send it to the platform. After collecting data, the consumers pay a data measurement fee. In addition, flat-foot treatment insoles are able to be inserted into commuting shoes for combined use. PLC for the shoe exchange storage: In the case study, a single shoe box serves as a temporary storage location for the exchange of shoes between consumers and the company. We refer to the shoebox as the “shoe exchange storage” in the case study. The shoe exchange storage consists of multiple shoe storage compartments. A shoe storage compartment stores a pair of shoes. The consumers rent shoe storage compartments based on the number of shoes they own. PLC for flat-foot treatment insoles, climbing shoes, and running shoes: The flat-foot treatment insoles are used by inserting them into the commuting shoes. These insoles and shoes are provided with a product sales model. Before manufacturing them, the providers purchase foot shape and gait data from the providers of the shoe exchange storage and commuting shoes. |
| (2) Platform | The shoe exchange storage: The shoe exchange storage is installed on the 1st floor of an apartment house and equipped with a scanner to scan the foot shape. Before consumers purchase flat-foot treatment insoles, running shoes, or climbing shoes, the consumers use the scanner to scan their foot shape. After scanning, the shoe exchange storage stores the data and the consumers pay a data measurement fee. To send gait and foot shape data to the providers of flat-foot treatment insoles, climbing shoes, and running shoes, the shoe exchange storage is equipped with a single-board computer. It collects data from sensors and a scanner, stores the data locally, and then transmits it over the internet. |
| (3) Goods and data exchanged among PLCs | Goods: Commuting shoes, flat-foot treatment insoles, climbing shoes, and running shoes. Data: Requests to use shoe storage compartments, and foot shape and gait patterns of consumers |
| Product | Sell or Rental Price (JPY) | Manufacturing Cost (JPY) | CO2 Emissions for Manufacturing (kg-CO2) | CO2 Emissions for Disposal (kg-CO2) |
|---|---|---|---|---|
| Shoe box (Scenario 1) | 12,990 ([56]) | 11,735 ([56,57]) | 56.637 ([56,58]) | 0.22 ([56,58]) |
| Shoe storage space (Scenarios 2~6) | 10/step | 652 ([56,57]) | 3.147 ([56,58]) | 0.012 ([56,58]) |
| A pair of commuting shoes (Scenarios 1–2) | 10,953 ([59]) | 10,330 ([59,60]) | 9.028 ([61,62]) | 1.22 ([61,62]) |
| A pair of commuting shoes (Scenarios 3–6) | 55/step | 10,330 ([59,60]) | 9.028 ([61,62]) | 1.22 ([61,62]) |
| A pair of flat-foot treatment shoes (Scenarios 1–3) | 13,153 ([59,60]) | 11,223 ([59,60,63]) | 9.923 ([61,62,64]) | 1.341 ([61,62,64]) |
| A pair of flat-foot treatment insoles (Scenarios 4–6) | 2200 ([59,60,63]) | 1893 ([59,60,63]) | 0.895 ([62,64]) | 0.121 ([62,64]) |
| A pair of climbing shoes | 17,981 ([65]) | 16,958 ([59,60,65]) | 15.629 ([60,61,65]) | 2.11 ([61,62,65]) |
| A pair of running shoes | 17,152 ([66]) | 16,175 ([59,60,66]) | 4.13 ([60,61,66]) | 0.559 ([61,62,66]) |
| A sensor for measuring gait data | This product is not for sale or rental | 23,625 ([67,68]) | 3.1 ([67,69]) | 1.625 ([67,70]) |
| A scanner for measuring foot shape data | This product is not for sale or rental | 700,000 ([71]) | 3.254 ([71,72]) | 1.71 ([71,72]) |
| A single-board computer for storing and sending the data | This product is not for sale or rental | 21,120 ([73]) | 4.265 ([69,74]) | 2.235 ([70,74]) |
Disclaimer/Publisher’s Note: The statements, opinions and data contained in all publications are solely those of the individual author(s) and contributor(s) and not of MDPI and/or the editor(s). MDPI and/or the editor(s) disclaim responsibility for any injury to people or property resulting from any ideas, methods, instructions or products referred to in the content. |
© 2025 by the authors. Licensee MDPI, Basel, Switzerland. This article is an open access article distributed under the terms and conditions of the Creative Commons Attribution (CC BY) license (https://creativecommons.org/licenses/by/4.0/).
Share and Cite
Tamura, T.; Odagaki, R.; Kishita, Y.; Umeda, Y.; Miyake, G.; Matsuda, G.; Tajima, A. Design Method for Platform-Aggregated Life Cycle Ecosystem. Sustainability 2025, 17, 5939. https://doi.org/10.3390/su17135939
Tamura T, Odagaki R, Kishita Y, Umeda Y, Miyake G, Matsuda G, Tajima A. Design Method for Platform-Aggregated Life Cycle Ecosystem. Sustainability. 2025; 17(13):5939. https://doi.org/10.3390/su17135939
Chicago/Turabian StyleTamura, Tomoyuki, Ryota Odagaki, Yusuke Kishita, Yasushi Umeda, Gaku Miyake, Genichiro Matsuda, and Akio Tajima. 2025. "Design Method for Platform-Aggregated Life Cycle Ecosystem" Sustainability 17, no. 13: 5939. https://doi.org/10.3390/su17135939
APA StyleTamura, T., Odagaki, R., Kishita, Y., Umeda, Y., Miyake, G., Matsuda, G., & Tajima, A. (2025). Design Method for Platform-Aggregated Life Cycle Ecosystem. Sustainability, 17(13), 5939. https://doi.org/10.3390/su17135939