Article

Meeting 2030 Targets: Heat Pump Installation Scenarios in Italy

by
Giovanni Murano
1,*,
Francesca Caffari
1,
Nicolandrea Calabrese
1 and
Marco Dall’Ombra
2
1
Department Unit for Energy Efficiency (DUEE), Italian National Agency for New Technologies, Energy and Sustainable Economic Development (ENEA), 00196 Rome, Italy
2
Italian Association of HVAC System Manufacturers (Assoclima), 20161 Milan, Italy
*
Author to whom correspondence should be addressed.
Sustainability 2025, 17(13), 5938; https://doi.org/10.3390/su17135938
Submission received: 15 May 2025 / Revised: 18 June 2025 / Accepted: 20 June 2025 / Published: 27 June 2025
(This article belongs to the Special Issue Sustainability and Energy Performance of Buildings)

Abstract

The study examines the role of heat pumps (HPs) in achieving the targets set by the Italian National Integrated Energy and Climate Plan (PNIEC) for 2030, using official data and European-recognized calculation methodologies to quantify the renewable energy produced. Starting from the current stock analysis—21 million HPs installed in 2022, providing 39 GWth of thermal capacity—the research outlines potential growth scenarios based on installation trends from the past three years: Scenario A assumes 2.5 million HPs/year, (b) 2.2 million/year, and (c) 1.6 million/year. Only Scenario A, the most ambitious, achieves full compliance with 2030 targets by ensuring over 4723 ktoe of renewable energy produced. An additional Scenario D is analyzed, based on the lowest annual installed capacity observed in the past three years but with a modified technology mix emphasizing air-to-water (A/W) and ground-source water-to-water (W/W) HPs. This scenario still achieves the 2030 goals, reaching 66.04 GWth and 4859 ktoe of renewable energy. The results confirm that technology choices will be strategic to meet the targets. The study also highlights the importance of stable incentive policies, proper development of the industrial supply chain, and a plan for the technological upgrading of the existing systems stock.

1. Introduction

Heating and cooling account for approximately 50% of the total energy consumption in the European Union (EU), with more than 70% of this energy still derived from fossil fuels, primarily natural gas. In the residential sector, around 80% of the final energy consumption is due to space heating and domestic hot water (DHW) production. In this context, heat pumps (HPs) have emerged as a highly energy-efficient alternative to traditional boilers, offering notable energy savings, lower greenhouse gas emissions, and improved air quality [1].
According to the European Commission’s report on the competitiveness of clean energy technologies [2], HPs are pivotal for decarbonizing the heating and cooling sector within the EU. The importance of HPs is reinforced by major EU initiatives, including the European Green Deal, the “Fit for 55” package [3], and the REPowerEU plan [4], all aimed at accelerating their adoption. Consistent with the EU Green Deal goal of achieving climate neutrality by 2050, the REPowerEU plan aims to double the deployment rate of HPs. The objective is to install 10 million units over the next five years and an additional 30 million by 2030. Moreover, there is a strong focus on incorporating HPs into district heating networks, further supporting the decarbonization of urban infrastructure [1]. The EU market for HPs is expanding rapidly: regarding HPs primarily used for heating purposes, the European Heat Pump Association (EHPA) estimates that approximately 20 million units were installed by the end of 2022. A substantial annual growth rate is observed, with sales reaching 3 million units in 2022 [5].
Research and innovation in the sector are increasingly focused on improving the efficiency, compactness, and digital integration of HPs, as well as ensuring compliance with EU regulations, including the use of low-GWP (Global Warming Potential) refrigerants. The EU leads global innovation in this field, accounting for 48% of all HP patents filed between 2017 and 2019 [6]. In 2020, the HP industry generated a turnover of EUR 41 billion, employing approximately 318,800 individuals directly and indirectly. However, the sector faces challenges, such as a shortage of qualified installers and the need to scale up production capacity to meet domestic demand. Furthermore, the rise in imports, particularly from China, has resulted in a growing trade deficit [6]. To address these issues, the European Commission (EC) has proposed the creation of a “heat pump accelerator” [7], a platform designed to foster collaboration among institutions, Member States, and industry. This initiative aims to increase production capacity, improve vocational training, and provide a stable regulatory framework while also increasing public and private investments under the REPowerEU plan [1]. In 2023, the EC started working on an HP action plan, which included funding for the acceleration platform. The initiative aimed to foster sector growth across Member States and support the development of a strategic framework [2]. Moreover, the Net-Zero Industry Act underscores the importance of strengthening the EU’s manufacturing capacity in strategic clean technologies, including HPs, to maintain European leadership in this field [8]. To further advance their deployment, the EC has opened a public consultation to shape policies that strengthen collaboration between Member States, industry stakeholders, and institutions, ensuring a stable and supportive regulatory environment [9].
Several studies have explored the role of HPs in decarbonization strategies in European and international contexts, highlighting the growth potential and the barriers. For example, Peñaloza et al. [10] examined non-technical barriers to HP adoption across the EU, identifying financial and regulatory challenges that vary by country. Singh Gaur et al. [11] provided a global overview of the factors, trends, and barriers influencing the adoption of HPs, with a focus on projections and targets set for 2030 across various countries. The paper includes a detailed table summarizing policy measures from European countries (Austria, Estonia, Finland, France, Ireland, Italy, the Netherlands, Poland, Slovakia, and the UK) to support renewable heating in buildings. This table often includes specific goals for HP installations or renewable energy shares in heating by 2030. For instance, Austria aims for a 7.3% annual increase in air-source HPs, reaching 8% of the market by 2030; Estonia has set a renewable energy target of 1400 GWh for HPs by 2030; Finland is targeting 7 TWh of energy from HPs; Ireland plans for 600,000 HPs in residential buildings by 2030; the Netherlands aims for 5699 ktoe of energy from HPs; and Slovakia has set goals of 50 ktoe from GS-W/W HPs and 94 ktoe from other renewable HPs by 2030.
Fei Yu et al. [12] analyzed the techno-economic factors, user behaviors, and policies influencing HP adoption in the EU. They highlight how electrifying heating systems with HPs can lower domestic heating costs and reduce reliance on natural gas. However, high initial investment costs hinder widespread adoption. Financial incentives are decisive to improve cost-effectiveness, particularly for high-efficiency HPs (A++ label). The study also addresses challenges such as increased peak power demand and potential grid congestion. Long-term technological improvements and the growing deployment of HPs in China may help reduce costs in the EU.
McGuire et al. [13] argued that achieving climate targets, including the reduction in greenhouse gas (GHG) emissions by at least 55% by 2030 compared to 1990 levels, as set out in the European Green Deal, requires substantial changes in residential energy consumption. In this context, HPs are presented as an important driver for decarbonizing the residential sector. The study highlights Ireland’s target of installing 400,000 HPs in homes by 2024 under the Climate Action Plan (CAP), demonstrating both strong political commitment and a measurable goal for HP adoption, pointing to substantial growth by 2030. The article discusses Ireland’s “fabric-first” approach, which mandates high thermal efficiency in buildings (measured by the Heat Loss Indicator—HLI) as a prerequisite for HP subsidies, influencing the adoption of this technology. The study also explores modifications to the HLI criteria and the potential for installing HPs with “sub-optimal” performance as alternative strategies. The analysis suggests that incentive policies and technical requirements will directly impact HP installation rates. According to the authors, electricity prices and homeowners’ awareness are important for a cost-optimal transition to residential HPs. Installation trends will depend not only on policies but also on the perceived economic viability and consumer knowledge of the benefits of HPs. Further within the Irish context, Hadush Meles and Ryan [14] focused on modeling and simulating the adoption of HPs in the residential sector up to 2030. The study examines the adoption and diffusion decisions of HPs for residential heating in Ireland using an agent-based model and simulations until 2030. The study identifies three key factors that affect the adoption of HPs: (a) economic factors (comparing annual costs between existing heating systems and HPs, including initial costs, subsidies, and operational costs), (b) psychological factors (based on the Theory of Planned Behavior, taking into account attitudes, subjective norms, and perceived behavioral control towards HPs), and (c) social factors (the influence of social interactions and the number of peers who have adopted an HP). The survey reveals that respondents consider high initial costs, lack of awareness, and uncertainty about performance as the main barriers, while energy savings, increased home comfort, and environmental concerns are the main motivators. The base scenario of the simulation predicts that approximately 15% of Irish households (about 260,000 homes) will install an HP by 2030. The study mentions the Irish government’s goal of reaching 600,000 HPs by 2030 (including 400,000 in existing homes) and evaluates how the model’s projection aligns with this goal.
Merkel et al. [15] highlighted that the target scenario, aimed at achieving ambitious goals for primary energy reduction and increasing the share of renewable energy in the German residential sector, envisions a remarkable technological shift towards HPs. In the target scenario, there is an almost complete phase-out of gas and oil boilers by 2050 in favor of HPs and solar thermal systems. Sensitivity analysis shows that a more ambitious expansion of RES-E technologies in the electricity system leads to a considerable increase in electricity consumption by HPs. The study notes that in the target scenario, the potential of cogeneration systems is considerably reduced compared to the reference scenario, mainly due to the dominance of HPs. It suggests that decentralized cogeneration could serve as a transitional technology, with the greatest potential identified in the medium term (around 2030), before the widespread adoption of HPs.
Similarly, Roth et al. [16] examined various scenarios for the expansion of decentralized HPs in Germany by 2030, with a particular focus on the role of thermal storage. These scenarios project an increase in the number of HPs from 1.7 million in 2024 to 3, 6, or even 10 million units by the end of the decade. The study assesses the impact of this growth on the energy sector, considering electricity demand, generation, and storage capacity requirements, and the integration of renewable sources. It explores the advantages of flexible HPs equipped with thermal storage in accommodating variable renewable energy and reducing the need for conventional generation capacity and electricity storage. Furthermore, the authors quantify the potential reduction in natural gas consumption and CO2 emissions resulting from large-scale deployment of HPs.
Fischer et al. [17] examined the potential flexibility offered by residential HPs through a model-based approach. They highlighted the ability of HPs, when connected to thermal storage, to adjust their operation based on renewable energy availability, variable electricity prices, or local grid needs. This flexibility is seen as an important factor in the further adoption of HPs, particularly for enhancing the integration of renewable energy. The authors also discussed the growing implementation of the SG-Ready interface for remote control of new HPs in Germany, noting that this capability allows for a more adaptive response to grid requirements. They suggested that using SG-Ready signals improves flexibility compared to simply shutting off the HPs, indicating the untapped potential of this technology. With smarter controls, HPs could become even more beneficial to the energy system, thus encouraging broader installation.
Thomaßen et al. [18] highlighted the electrification of heating, particularly through HPs, as a key strategy for decarbonization and achieving renewable energy targets by 2030. The main challenges include high installation costs and the need to align building codes, subsidies, and tax policies to make HPs competitive with gas boilers. HPs, by providing flexibility in heating demand, can help balance the electricity grid, reducing the need for storage. Additionally, the effectiveness of HPs depends on the energy efficiency of buildings, with better performance in well-insulated ones. Projections show promising adoption in countries like Sweden and Finland, which have introduced a carbon tax, with the cost of heating for the end consumer being a key factor in driving adoption.
Saffari et al. [19] highlighted the importance of HP systems as a key tool in energy policies aimed at reducing carbon emissions, suggesting that their installation will likely increase to meet 2030 targets. The authors acknowledge that electric HPs may not be suitable for all residential buildings, particularly in challenging retrofitting scenarios or cold climates requiring high supply temperatures. In such cases, hybrid HPs (gas and electric) could offer an alternative. This distinction is useful for analyzing market segments with varying adoption rates for different types of HPs. The study shows that in deep renovation scenarios, both hybrid and electric HPs achieve important reductions in primary energy consumption (around 70%) and CO2 emissions (around 70%) compared to conventional oil boilers. The paper also points out that the slow pace of building stock renewal in the EU could limit the rapid spread of HPs but emphasizes the need for effective retrofit strategies, including HPs, to accelerate decarbonization.
Masternak et al. [20] emphasized that the number of HPs in the European market is projected to triple by 2030. In 2021, the total number of HPs installed across Europe reached 16.98 million, with air-source heat pumps (ASHPs) making up 90% of the market share. Despite the growing adoption of HPs, natural gas boilers still account for 46% of heating in the EU. The article compares the environmental impacts of ASHPs with those of natural gas boilers (NGBs), highlighting ASHPs’ potential to mitigate climate change in various scenarios. It notes that the environmental benefits of ASHPs vary significantly across 18 European countries, influenced by factors such as the local electricity grid mix and building stock. Furthermore, the use of R290 refrigerant, as opposed to R32, is identified as a key measure to reduce the climate and ozone depletion impacts of ASHPs.
Fotiou et al. [21] employed the PRIMES-BuiMo model to formulate decarbonization strategies for the EU’s building sector, offering valuable insights into energy consumption trends, renovation frequencies, and equipment replacement dynamics. In the decarbonization scenarios analyzed, the electrification of heating in EU buildings emerges as a dominant trend even in the short term: electricity shares almost double by 2030 compared to 2020 across all decarbonization scenarios due to the growing adoption of HPs. The study examines country-specific outcomes, such as Sweden, where households are largely already equipped with HPs, and Greece, where there is still greater reliance on fossil fuel boilers, making equipment replacement a more effective strategy.
Gradziuk et al. [22] provided a comprehensive analysis of HP adoption in Poland, a country still heavily reliant on coal. Despite its relatively low market share, the number of installations has increased more than twelvefold between 2011 and 2020. The focus of the study is on rural areas in Poland, which have limited access to centralized heating infrastructure and natural gas. In these regions, HPs offer a viable alternative to fossil fuels, helping to reduce air pollution. The study evaluates the economic competitiveness of HPs compared to electricity, LPG, and heating oil using the SPBT (Simple Payback Time) and LCOH (Levelized Cost of Heat) methods.
Trypolska et al. [23] analyzed the potential for HP adoption in Ukraine within the context of the transition to low-carbon energy sources, with a focus on the timeline extending to 2030 and beyond. Based on the TIMES-Ukraine model, the study indicates that lower investment costs for HPs could lead to their faster adoption compared to biomass heating systems, especially in urban single-family residences and buildings lacking centralized heating over the coming decade. The article devotes notable attention to Poland’s experience, which has seen the highest growth in Europe in installed HP capacity. The analysis of the factors driving this growth in Poland, such as incentive programs (“My Electricity” and “Clean Air”) and rising fossil fuel prices, offers valuable insights and parallels to predict trends in other European countries.
Campos et al. [24] examined the role of individual HPs and energy efficiency strategies across four different scenarios, aiming to assess their effectiveness in delivering cleaner and adequate heating in rural areas of Hungary. The study explores multiple scenarios that merge energy retrofitting measures with the use of HPs, showing that this combined strategy can significantly decrease both final energy demand and PM10 emissions. The analysis evaluates the flexibility of electricity demand by using individual HPs paired with hot water storage. Four scenarios are projected through 2040, each reflecting varying levels of energy retrofitting and HP deployment.
Watson et al. [25] evaluated the impact of large-scale adoption of electric compression HPs on electricity demand in Great Britain (GB). Using a statistical model based on real-world data from over 550 HPs installed in 2012, the study quantifies the additional load on the power infrastructure (generation and distribution) under different climate scenarios (current and future, up to 2050). For a cold year in the 2020s, full adoption of HPs in GB’s existing building stock would lead to a peak electricity demand of 78 GW and an annual demand of 189 TWh solely for HPs, doubling the peak demand and increasing total annual demand by about 60%. Future scenarios are based on reasonable assumptions about increasing the efficiency of heat pumps, future climate, and improving the efficiency of the residential building stock. The analysis suggests that in the 2050s an 80% adoption rate (without demand management) could reduce peak HP demand to 37 GW in a cold year.
The macroeconomic implications of HP adoption in the UK have also been explored. Gupta and Irvin [26] showed that large-scale deployment of HPs could significantly reduce carbon emissions when accompanied by the simultaneous decarbonization of the electricity supply, contributing to the UK’s 2050 goals. Katris et al. [27] further investigated the economic impacts, revealing how HP production and installation could provide a stimulus to the economy, offsetting rising energy costs.
Lysenko et al. [28] analyzed the climate and health implications of large-scale adoption of HPs and solar panels (photovoltaic, thermal, and hybrid photovoltaic-thermal) within technological packages (TP) across the EU-27 by 2050. The study assesses the economic valuation of these impacts in residential and commercial buildings, both renovated and newly constructed. Scaling up TP adoption (14% by 2030 and 43% by 2050) to replace conventional heating and cooling technologies would significantly reduce emissions in most countries, with variations depending on national replacement rates and baseline energy demand for heating and cooling. The authors predict that by 2050, TP implementation could result in emission reductions of 25% for NOx, 48% for NMVOCs, 51% for SO2, 30% for PM2.5, and 35% for GHGs, on average. This would represent a 22% greater reduction compared to the baseline scenario for 2050 and 11% more than the projection for 2030. Efkarpidis et al. [29] emphasized the synergy between HPs and renewable energy sources (RES) as fundamental for the decarbonization of the European residential sector and a strong incentive for their future installation. The strategies they propose are based on the concept of maximizing self-consumption. The evaluation of the impact of Time-of-Use (ToU) tariffs on HP operations highlights how energy policies and electricity pricing models can influence the cost-effectiveness and, consequently, the adoption of HPs.
Moving to the United States context, Rao et al. [30] emphasized that the electrification of homes through the adoption of electric heat pumps (EHPs) plays a key role in the country’s decarbonization. According to the study, the U.S. government’s long-term decarbonization strategy aims for HPs to account for 60% of heating appliance sales by 2030. The research highlights that individuals’ choices in heating technology are influenced by various factors, with a considerable variation in cost considerations. Other key aspects include comfort, reliability, demographic traits (such as being urban, young, and educated), and perceptions of new technologies. The article identifies multiple barriers to HP adoption, including high initial costs, a lack of familiarity with the technology, and the potential need for modifications to existing buildings (such as updates to heating systems, insulation, and electrical infrastructure).
Meanwhile, Hlavinka et al. [31] emphasized the importance of financial incentives in increasing HP adoption, particularly in the Pacific Northwest of the United States. Similarly, Salimian Rizi et al. [32] discussed trends in the U.S. residential sector, highlighting the need for stronger policy measures to support HP deployment as part of a broader electrification strategy.
Adamo et al. [33] examined strategies for advancing high-temperature HPs (HTHP), offering a detailed analysis of the policies implemented in some of the leading countries for emissions worldwide. Their research reveals that in 2022, global HP installations increased by 11%, with a 38% rise in Europe. In the United States, sales of HPs outpaced those of gas boilers for the first time. The authors underscore the growing significance of HPs, especially HTHPs and industrial HPs (IHPs), in industrial heating and district heating networks, as well as their crucial role in facilitating the integration of RES into the power grid. The study discusses various funding programs, tax incentives, and R&D initiatives implemented by governments in countries such as Australia, Canada, China, Japan, the European Union, and the United States to support HP development and adoption. For instance, China’s plans include a building sector electrification rate of 55% by 2025 and 65% by 2030, with a growth in HP capacity. The authors underline the importance of electrical grid infrastructure and supportive regulatory frameworks for the widespread adoption of HPs.
Abbasi et al. [34], in a review article, explored the key challenges associated with the adoption of HPs, highlighting issues such as high upfront investment, increased electricity consumption and peak demand, the need to upgrade building envelopes to increase thermal insulation, concerns over refrigerants, and both regulatory and social barriers, including user experience and the risk of exacerbating energy poverty in the absence of electricity price controls. On the benefits side, the review emphasizes the high energy efficiency of HPs, their ability to utilize RES, the dual functionality of reversible systems for both heating and cooling, their relatively low maintenance requirements, and the potential for integration with complementary technologies such as thermal storage, solar panels, and hybrid systems.
The studies cited above help contextualize the role of heat pumps within the framework of both national and European decarbonization targets. While this paper focuses specifically on the adoption of heat pumps, it is important to emphasize that their deployment must be part of a broader strategy. Such a strategy necessarily involves the parallel development of other technologies to achieve targets for increasing the share of renewable energy in the heating and cooling sector. These include systems based on bioenergy, solar thermal, geothermal, and hydrogen. Several studies have highlighted the importance of integrating multiple systems—for example, combining HPs with solar systems and thermal energy storage [11,16,17,24,28]. As highlighted in some of the referenced studies, when paired with heat pumps, thermal storage proves particularly effective in mitigating daily fluctuations in renewable energy generation. A forward-looking strategy should also include building renovation plans aimed primarily at reducing energy demand through improvements to the building envelope [13,34].
These considerations constitute implicit baseline assumptions of this study, as the evaluation is based on the targets set out in Italy’s Integrated National Energy and Climate Plan (PNIEC). Specifically, the share of renewable energy attributed by the plan to heat pumps is calculated in relation to the expected contributions of other technologies, as well as to the projected reduction in energy consumption resulting from the renovation of the existing building stock. Furthermore, the study focuses exclusively on calculating the share of renewable thermal energy produced, without considering the impact of heat pumps on electricity demand, which would necessarily require an analysis of energy storage solutions.
The study is structured into five main sections (Figure 1). First, it presents a detailed analysis of the annual market data for HPs in Italy. Following this, the study undertakes an estimation of the total stock of HPs in operation across the national territory. The third part is dedicated to the territorial disaggregation of this stock to consider the climatic specificities of the country. Based on these analyses, the fourth section focuses on the calculation of ambient energy produced by HPs in the reference year 2022. Finally, the fifth and concluding section presents the calculation of ambient energy projected in various future scenarios, developed considering different installation rates, to verify the potential achievement of the RES targets in the heating sector defined by the PNIEC by 2030.

2. Italian Goals

The Integrated National Energy and Climate Plan (PNIEC, June 2024 version [35]) outlines an increase in the share of renewable energy in the heating sector by 2030 (Table 1). Based on the PNIEC projections, this study aims to assess the contribution of ambient energy generated by electric compression HPs and to estimate the number of new installations required to achieve the growth targets. Despite the challenging objectives, preliminary data published by the EHPA in March 2025 indicate a contraction of the Italian HP market, estimated between 3% and 5% in 2024 compared to 2023 [36]. However, this decline hides different dynamics among market segments. The residential A/A HP sector, particularly split systems, experienced strong double-digit growth, driven by the replacement of older units from 2004 to 2009 and uncertainty over the future of the national incentive scheme in 2025, which boosted demand in late 2024 [36]. In contrast, sales of residential A/W and W/W HPs fell sharply by an estimated 35–40% due to the end of the “Superbonus” program (the “Superbonus” is an Italian measure, introduced in 2020, that provides a tax credit worth up to 110% of the cost of building renovations aimed at improving energy efficiency.), bringing the market back to 2021 levels. Hybrid systems were hit even harder, with an estimated 70% drop. HPs for DHW showed relative resilience, with a decline of only 5% [36].
The PNIEC foresees that, between 2021 and 2030, ambient energy produced by HPs will increasingly contribute to meeting RES targets, reaching over a quarter (26.7%) and, by 2030, almost a third (30.6%) of final consumption for heating and cooling services (Table 1). HPs represent one of the key technologies for achieving climate neutrality, thanks to the progressive decarbonization of the electricity needed for their operation, made possible by the expansion of RES. Their main strength lies in their high versatility, making them suitable for buildings of all types, both new and existing, intended for residential, commercial, industrial, or agricultural use.
The share of ambient energy considered in the PNIEC includes three main types of HPs, classified according to the source from which thermal energy is extracted (outdoor heat exchange):
  • Air-source HPs: these extract thermal energy from the ambient air.
  • Ground-source W/W HPs: these include systems that capture thermal energy from the ground.
  • Hydrothermal HPs: these utilize thermal energy from water sources (groundwater, lakes, etc.).
  • HPs can also be classified based on the type of fluid used for heat exchange within the building (indoor heat exchange).
  • Water-based: These transfer heat through a hydraulic circuit that powers hot water radiators or underfloor heating systems. Examples include A/W-HPs and most GS-W/W-HPs.
  • Air-based: as the name suggests, these use a wall-mounted unit to circulate warm air (or cool air if reversible).

3. Methodology for Estimating the Ambient Energy Produced by HPs

To calculate the share of renewable energy produced by heat pumps for different technologies, we referred to the Commission Decision of 1 March 2013 [37]. This establishes the guidelines that Member States must follow for the calculation, in accordance with Article 5 of Directive 2009/28/EC of the European Parliament and Council [38]. The document provides reference data for performing a “standard calculation” based on “cold”, “average”, and “warm” climatic conditions as defined by Commission Delegated Regulation 811/2013 [39]. These conditions correspond to the typical air temperature and global solar radiation values for the cities of Helsinki, Strasbourg, and Athens, respectively. Reference data are provided in Table 2.
Data processed by the portal: JRC Photovoltaic Geographical Information System (PVGIS)—European Commission PVGIS-ERA5: 2005–2023 [40].
Table 3 presents the reference conditions established by the EC Decision regarding the values of HHP and SPF (SCOPnet) for electric HPs, in accordance with Commission Delegated Regulation 811/2013 [37], as amended by the EU Official Journal (OJ) No. 8 of January 2014, p. 32 (2013/114/EU). Based on these data, it is possible to estimate the amount of renewable energy produced by HP technologies (Eres, Equation (2)) as a function of the total usable heat (Qusable, Equation (1)), estimated based on the heat produced by the HPs. This value, expressed in GWh, is calculated as the product of the rated heating capacity Prated and the annual equivalent operating hours of the HPs (HHP), according to the following formulas.
  Q u s a b l e = H H P · P r a t e d
  E r e s = Q u s a b l e · 1 1 S P F
The SPF factor in the formula corresponds to the net seasonal performance coefficient in active mode (SCOPnet) for electric HPs or the net seasonal primary energy index in active mode (SPERnet) for thermal HPs.
The analysis considers only HPs with an SPF greater than 1.15 ∙ 1/η. Assuming an energy system efficiency (η) of 45.5%, the minimum SPF for electric HPs (SCOPnet) included in the calculation of the share of energy from renewable sources under the directive is 2.5.

4. Climatic Classification of Italian Locations

The Commission Decision of 1 March 2013 [37] stipulates that, in the presence of heterogeneous climatic conditions within a country, the estimation of the installed capacity of HPs should be carried out separately for each climatic zone. In Italy, Presidential Decree No. 412 of 26 August 1993 [41] currently divides the territory into six climatic zones (A, B, C, D, E, and F). This decree [41] also sets specific limits on the maximum daily operating hours and the overall duration of the heating season, based on the climatic zone. Starting from this classification, Italian locations were grouped into the three categories outlined by [37]: cold climate, average climate, and warm climate, which refer to the temperature conditions characteristic of the cities of Strasbourg, Helsinki, and Athens, respectively.
Using heating degree days provided by EUROSTAT (average 2019–2023) [42], the absolute deviation from the three reference values (Helsinki, Strasbourg, and Athens) was calculated for each provincial capital city in Italy. Additionally, a supplementary rule was adopted: if, according to national legislative ref. [41], the majority of municipalities in the area of a provincial capital fall into climatic zones E (Heating Annual Degree Days between 2101 and 3000), and more than 25% fall into climatic zones F (Heating Annual Degree Days exceeding 3000), the capital was automatically classified under the cold climate cluster.
This methodology allowed for a comparison between the climatic conditions of national locations and those of the reference locations, enabling the classification of the Italian territory according to the classification outlined in ref. [37].
This approach was preferred over another methodology, mentioned in ref. [43], which follows a different logic, classifying the Italian provincial capitals exclusively based on heating and cooling annual degree days (average 2010–2019). This method also divides the provincial capitals into the three climatic categories (“warm”, “average”, and “cold”), but the classification follows the following rule: provincial capitals with less than 2000 annual heating degree days (HDDs) are considered “hot climate”, those with a value between 2000 and 3000 HDDs are classified as “moderate climate”, while capitals with more than 3000 HDDs fall into the “cold climate” category. However, the Italian climatic reality is significantly more complex and diverse, as within the same provincial capitals, there can be notable variations in HDDs between different municipalities. In fact, even within the same municipality, some locations may have different HDDs due to differences in altitude or microclimatic characteristics.
According to the assumptions adopted for this study, Table 4 shows the distribution of provincial capitals and their population across the 20 Italian regions. Additionally, the number of provincial capitals and their population are distributed in the three climatic condition areas (cold, average, and warm). The data reveals that most of Italy’s population lives in areas with a warm (50.9%) or average (37.9%) climate, while a smaller proportion is found in cold zones (11.2%). Similarly, the distribution of the capitals follows the same pattern, with 51.8% in warm areas, 36.4% in average areas, and 11.8% in cold areas.

5. Heat Pump Installations Based on Market Analysis

The number of HP technology systems/devices in operation for heat generation was estimated based on research conducted by AssoClima and edited by the Anima Research Office on the market for climate system components for the period 2008–2022 [45]. It was assumed that the Italian revenue, including both domestic production and imports, reflects the equipment effectively installed and operating in Italy.
As stated in ref. [37], “In warmer climates, reversible heat pumps are primarily installed for indoor cooling, although they can also provide heating in winter. These systems can be integrated into existing heating installations. In such cases, the installed capacity reflects the cooling demand rather than the heating provided. Since in these guidelines the installed capacity is an indicator of heating demand, this results in an overestimation of the actual amount of heat supplied. Therefore, an appropriate adjustment is necessary”. For this reason, in the case of mono- and multi-split systems, it was necessary to adjust the nominal heating capacity (Prated) of the national stock. The EHPA Heat Pumps Barometer 2024 [46] has updated the calculation method for A/A-HP sales mainly intended for heating by adopting new adjustment factors to exclude those primarily used for summer cooling. The new factor for 2023 is 11.3% for Italy, compared to the previous 9.5%, which was based on a 2013 Italian market survey.
From the data analysis (Table 5 and Table 6), it emerged that as of 2022, a total of 21,087,668 HP units were in operation, with a total thermal capacity used for heating of 39.04 GWth. Furthermore, it was found that most of these units (20,172,558) are intended for residential use, with a nominal heating capacity of 17.40 GWth recorded in this sector.
In the non-residential sector, on the other hand, there are 915,109 units, with a total thermal capacity of 21.63 GWth, reflecting the difference in the type of systems used.
The year 2022 was chosen as the baseline for the analyses, as it constitutes the most recent year with available recorded data in the PNIEC [35].
Looking at the spread of system typologies, A/A-HPs are by far the most common, representing 95.9% of the total with 20,225,070 units (Table 6). Despite this wide prevalence, their contribution to the thermal capacity used is 24.3 GWth, which accounts for 62.3% of the total. This is because they are primarily used for summer cooling. A/W-HPs, while only constituting 4.0% of the installed units (850,046 units), have a significant impact on the thermal capacity used, with 13.9 GWth, or 35.7% of the total. W/W-HPs, although they represent just 0.1% of the installed units (12,552 units), contribute 0.8 GWth to the overall thermal capacity, or 2.1% of the total.
Based on ref. [46], reversible A/A-HPs continue to represent the majority of sales, with Italy being the leading reference market for this technology. According to statistical surveys of ref. [45] on the market for climate system components, it also emerges that mono-split and multi-split air-cooled condensing systems are entirely imported, with no national production.
Figure 2 and Figure 3 show annual data from 2004 to 2023 regarding the number of HPs and the total annual thermal capacity, respectively. The increase in A/W-HPs is a sign of the gradual replacement of boilers, which were used together with split systems in the same households until 2010. Figure 4 presents a comparative chart of the overall data for the period 2008–2022, referring to the residential and non-residential sectors.
Based on the data analysis, regarding the residential sector, the following factors are believed to have contributed to the increase in installations of mono-split and multi-split systems (A/A-HPs):
  • Growth in demand and post-COVID context: The growing demand for residential air conditioners began in the post-COVID period and was further strengthened by increasingly hot summers, which led many users, even those who previously did not have an air conditioning system, to proceed with installation. The analysis of pre- and post-pandemic trends shows a clear increase in installations, confirming that changes in living habits and altered thermal comfort needs have significantly influenced this development.
  • Impact of economic incentives: In recent years, for the purchase and installation of mono-split and multi-split systems, the most used financial incentives have been the so-called “Bonus Casa” and “EcoBonus”, which provide a 50% or 65% discount in the form of tax deduction. These incentives have provided good coverage of investments for A/A-HPs, especially considering their relatively low cost. Consequently, the driving effect of the so-called “Superbonus”, providing tax deductions of up to 110%, was marginal, highlighting how less costly incentives had a greater impact in supporting this kind of technology in the residential sector.
  • Replacement of existing split systems: It is estimated that around 5.2 million mono-split systems (under 7 kWth) installed between 2004 and 2008 have reached their end-of-life, defined by regulations as 15 years, in recent years, forcing new installations. At the same time, only 3.9 million units were installed in the following five years (2009–2014). This suggests that, in the coming years, the replacement of existing systems now reaching the end of their life could have a moderate impact on the volume of new installations. It is therefore expected that in the next few years, the impact of replacing existing systems, which have reached the end of their life, will gradually decrease. Ref. [36] outlines the trends in the Italian HP market for 2024 by segment.
  • Residential A/A-HPs (split systems): This segment experienced double-digit growth in 2024. The increase is mainly attributed to the replacement of older units installed between 2004 and 2009, as well as uncertainty regarding the future of the incentive schemes in 2025, which stimulated purchases towards the end of 2024.
  • Residential A/W-HPs and W/W-HPs: Sales in this category have decreased by approximately 35% to 40%. The primary reason for this drop appears to be the end of the so-called “Superbonus” program, which had previously supported the market, bringing it back to 2021 levels. This highlights the strong dependence of this segment on government incentives.
  • Hybrid systems: this segment experienced an even sharper decline, with an estimated drop of 70%, suggesting a potential loss of appeal following regulatory or incentive changes.
  • HPs for DHW: this segment remained relatively resilient, with only a limited decline of 5%.
  • Commercial sector (VRF, A/W-HPs, and W/W-HPs): Unlike the residential sector (excluding A/A-HP systems), the commercial sector continued to show growth, supported by stable demand from businesses and industries, largely independent of incentives. This confirms the different market dynamics between the residential sector and specific segments of the non-residential market.
Despite the revised Energy Performance of Buildings Directive [47] foreseeing the cessation of financial incentives for the installation of single fossil fuel-powered boilers starting from 1 January 2025 [48], preliminary data for 2024 show a negative trend in the sales of A/W-HPs, a technology considered central for replacing traditional boilers. This slowdown in the HP market, particularly in the residential A/W-HPs segment [36], raises questions about its ability to replace fossil fuel boilers in a timely and large-scale manner in the absence of specific incentives and in a context of potential regulatory uncertainty.

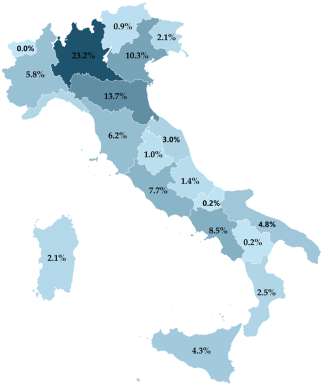
6. Territorial Breakdown: Climatic Location of the HP Stock

The location of the HP stock for heating systems in climatic areas is essential to ensure that the results are as close as possible to the actual territorial reality. The assignment was made by integrating two sources of information: (a) the distribution of the population residing in Italian regions (Table 4); (b) data on the diffusion of HPs across the national territory, provided by Assoclima and limited to hybrid systems by Assotermica. Assoclima represents a fundamental data source, as it conducts an annual statistical survey on the market for components used in air conditioning systems [45]. Each year, the survey provides insights into the overall market trends, focusing on product families with the highest revenue and market share. Over 40 companies contribute data on the production, import, export, and Italian market of products like monobloc and split air conditioners, VRF systems, roof top units, air treatment units, air- and water-cooled refrigeration units, HPs, terminal units, and A/A systems.
The integration of data has enabled an estimation of the geographical and climatic distribution of HP systems.
Table 7 shows the geographic distribution of HP technologies available on the market, broken down by region, technology type, and usage sector (residential and non-residential).
Table 8 presents the results concerning the final distribution of the HP stock by climate severity area, as described in the previous sections.

7. Scenarios for Achieving the PNIEC Objectives

Before proceeding with the definition of the scenarios, further baseline assumptions were established concerning the operational lifespan of the systems. The standard EN 15459–1:2018 [49], in Annex D (informative), specifies that for economic evaluations, the lifespan of HP systems ranges between 15 and 20 years. In the Italian Greenhouse Gas Inventory 1990–2021 [50] ISPRA provides the table “Average lifetimes and recovery at decommissioning for the Stationary air conditioning equipment”, shown below as Table 9, indicating a varying lifetime of the technology depending on the type of equipment considered.
For the purpose of simplifying the analysis, this study assumes that all HP systems have a lifetime of 15 years, regardless of the technology type. Table 10 presents the results related to the estimation of the renewable energy (Eres) produced by HP technologies, according to ref. [37].
The estimate made is consistent with the data reported by GSE in 2022 [51], which states 2744 ktoe of ambient energy for heating and DHW and 308 ktoe of ambient energy for cooling, for a total of 3052 ktoe.

8. Results

To assess the market’s ability to achieve the PNIEC targets, four possible annual HP installation scenarios were defined until 2030. These scenarios are based on historical installation data, considering market trends and the effectiveness of incentive policies. Referring to three different years (2022, 2021, and 2020), the scenarios differ not only in the number of units installed annually but also in the average capacity of the HPs (Table 11) and the technology mix (Figure 5). Preliminary data from 2024 [36] suggest that the Italian HP market is undergoing a transitional phase, with strong growth in some segments offset by significant declines in others, particularly following the removal or reduction of incentives.
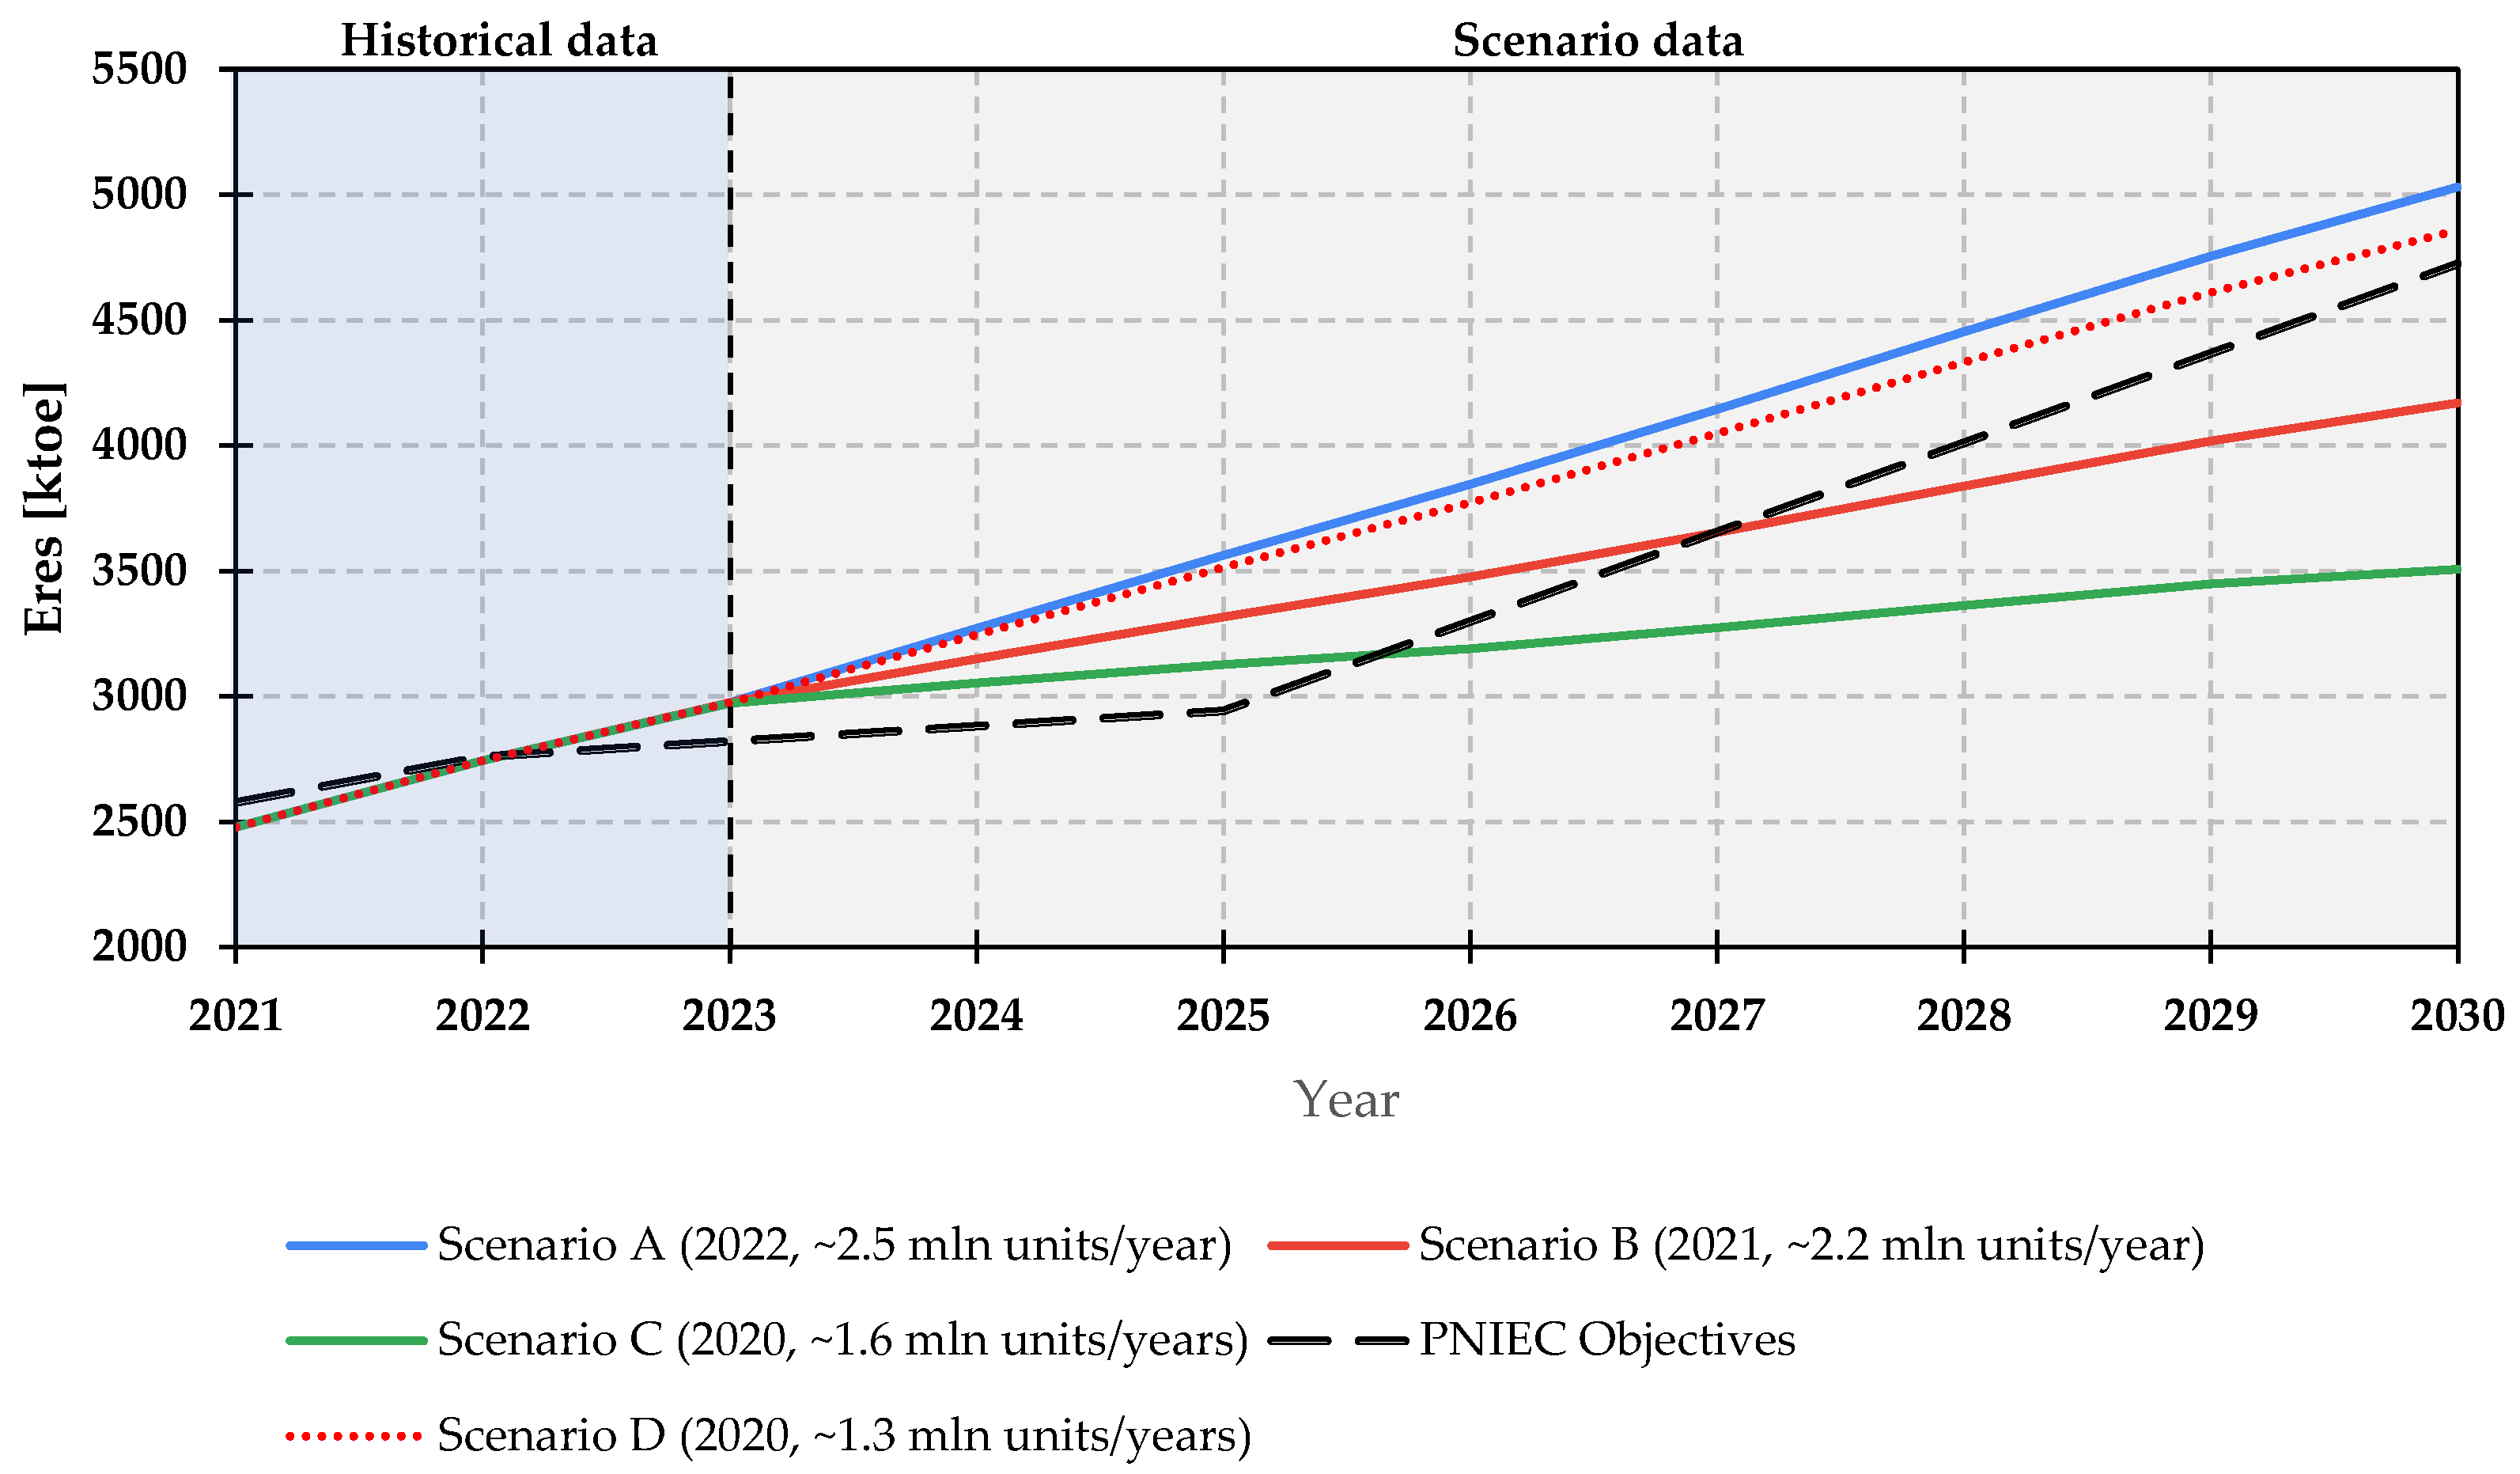
  • Scenario A (2022): This scenario assumes an installation rate equal to that recorded in 2022, approximately 2.5 million units per year. This represents the highest installation level reached so far and is considered an ambitious goal but achievable with appropriate support policies. If maintained consistently until 2030, this pace would exceed the PNIEC target, ensuring 31.81 million HPs installed and an adjusted thermal capacity of 69.82 GWth.
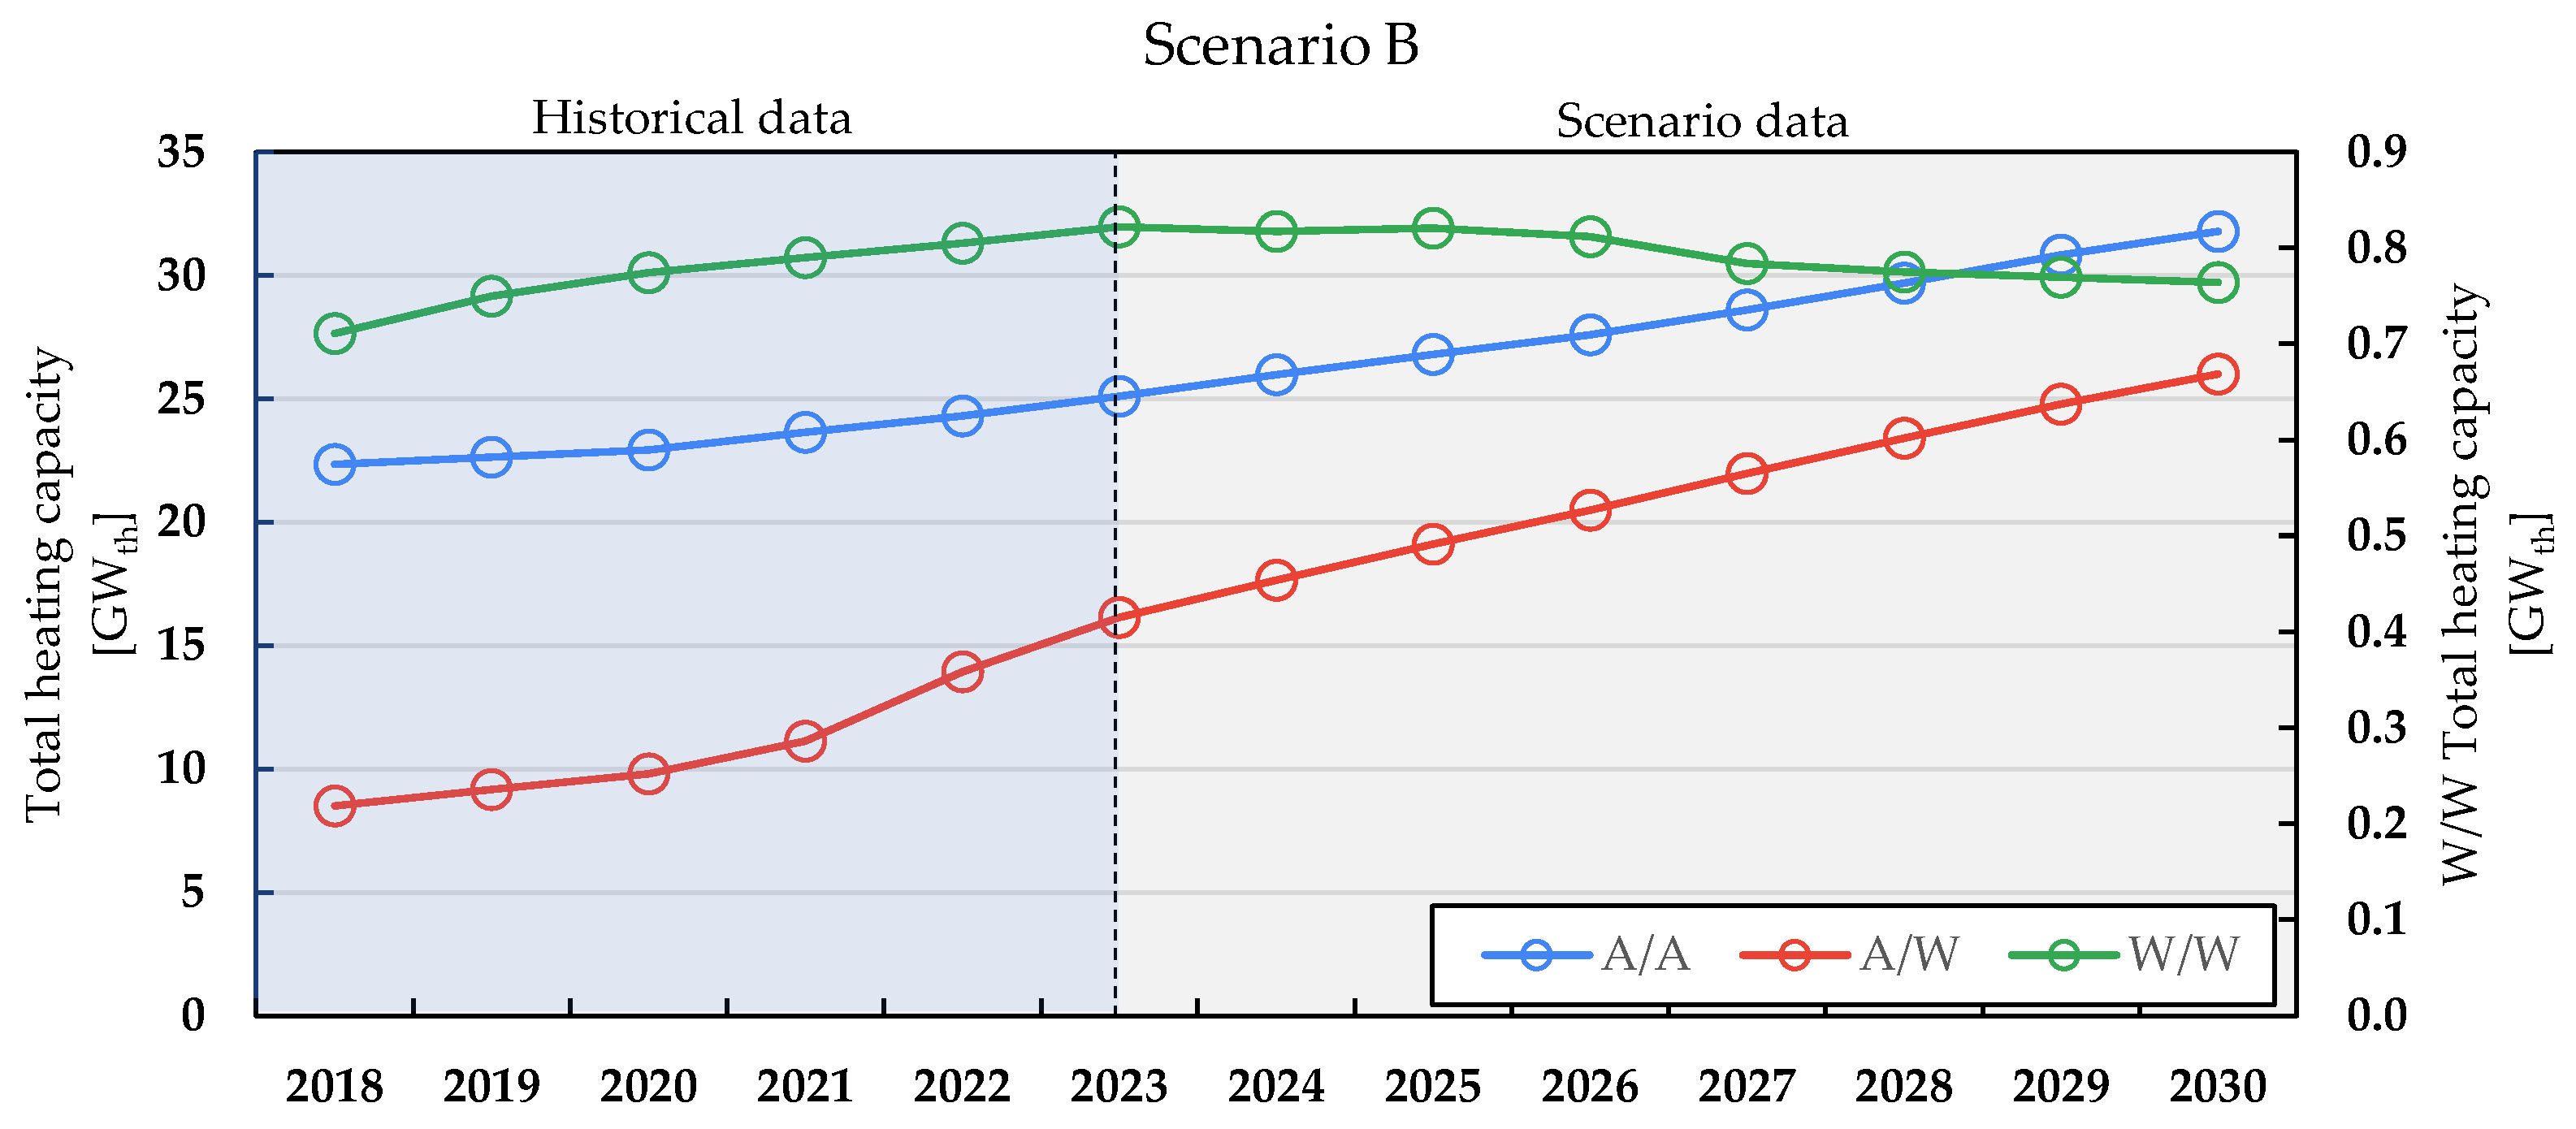
  • Scenario B (2021): This scenario considers an installation rate of 2.2 million units per year, with an adjusted thermal capacity of 58.53 GWth. This growth level would be sufficient to meet the PNIEC targets until 2025, but it would be insufficient for 2030, where an additional 4 million units are required to meet the goal. To bridge the gap and reach the final target, an increase in the installation rate would be necessary from 2027 onward, with installations reaching approximately 3.2 million units per year in the last four years of the reference period.
  • Scenario C (2020): This is the most conservative scenario, based on an annual installation rate of 1.6 million units, in line with the 2016–2020 average, and an adjusted thermal capacity of 49.85 GWth. This scenario would only meet the PNIEC targets for 2025 but would create a gap for the 2030 target, requiring about 8.9 million units. To catch up, the installation rate would need to nearly double from 2026 onward, reaching about 3.4 million units annually in the last five years.
  • Scenario D (2020, with a different distribution of HPs): This additional scenario has been developed based on the assumption of a total installed heating capacity equal to the minimum value recorded in the three years preceding 2023, but with a different technological mix of HPs used in the residential sector. Specifically, the scenario involves a partial replacement of A/A units with A/W and W/W models while maintaining the same total heating capacity. Even under this configuration, the targets set for 2030 are achieved. It should be noted that, unlike for A/A systems, thermal capacity for A/W and W/W HPs has been fully considered without any adjustment, which facilitates the achievement of the targets. A detailed breakdown of the number of machines used by technology is provided in Appendix A.
The results show that the most aggressive scenario (A) can ensure full achievement of the PNIEC targets by 2030, while the other two scenarios (B and C) would require significant acceleration in the second half of the decade. An additional scenario (D), based on the same overall heating capacity (Prated,eff) as Scenario C but with a different distribution of HP technologies installed in residential settings, also reaches the 2030 targets. In fact, in Scenario D, the strategy involves the partial replacement of A/A-HPs with A/W-HPs and W/W-HPs. This shows that the type of HPs used is just as important as the total number installed. The latter scenario, as shown in Figure 5, further highlights the strategic importance of promoting technological advancement and the deployment of A/W-HP and W/W-HP systems to fully exploit the installed thermal capacity for the achievement of renewable heating targets of the PNIEC.
Another source of uncertainty is the market and industrial supply chain’s ability to sustain such a rapid increase in installations.
In 2022, the HP industry in Europe directly hired about 161,632 individuals, with roughly 80,000 working in installation-related tasks [6,52]. The estimated total number of heating system installers in Europe is around 1.5 million [6]. Industry associations estimate that by 2030, an extra 500,000 to 750,000 skilled workers will be necessary, with around 50% of the existing workforce needing retraining [31]. Based on the IEA’s Announced Pledges Scenario [1], the worldwide need for installers may increase fourfold by 2030, nearing 850,000 [53]. According to the REPowerEU goals, the quantity of certified installers within the IEA framework is anticipated to increase from 40,000 in 2019 to 110,000 by 2030 [53]. In addition to the numerical lack of employees, the industry encounters obstacles related to deficiencies in HP-specific skills within educational programs and the absence of mutual recognition of qualifications.
Therefore, it will be necessary to carefully plan incentive policies and develop support measures for installers and manufacturers to ensure stable and sustainable growth.
Table 11 provides a summary of data derived from the simulated scenarios.
Figure 6 provides a dynamic graphical representation of the estimated evolution over time of the renewable energy (Eres) produced by HPs in Italy, projected through to 2030 based on the four installation scenarios simulated in the study.
Figure 7, Figure 8, Figure 9 and Figure 10 detail the evolution of total heating capacity by HP type across the four scenarios, highlighting differences in growth trajectories between 2023 and 2030.
Scenario A—2022 (Figure 7) represents the most ambitious outlook in terms of HP deployment, reflecting a context in which supportive public policies, targeted economic incentives, and technological innovation converge to drive a rapid transformation of the heating sector. In this scenario, the capacity associated with A/A-HP systems increases from 24 to 33 GWth (+35%) between 2022 and 2030, following a steady upward trend. The growth in A/W-HP technology is even more pronounced, with capacity rising from 14 to 36 GWth (+161%) over the same period, an increase of 20 GWth in just seven years. The W/W-HP segment remains constant at about 0.8 GWth throughout the entire time frame. As a result, the total installed heating capacity reaches approximately 70 GWth by 2030, marking an increase of over 79% compared to 2022. In this context, A/W-HP technology surpasses A/A-HP in terms of installed capacity, confirming its role as the primary driver of future growth due to its higher seasonal efficiency and compatibility with low-temperature hydronic heating systems.
Scenario B—2021 (Figure 8), by contrast, outlines a more moderate but consistent growth trajectory. A/A-HP systems increase from 24 to 32 GWth (+31%) between 2022 and 2030, while the A/W-HP segment expands from 14 to 26 GWth (+87%). The W/W-HP capacity again remains stable at about 0.8 GWth. Total heating capacity in this scenario reaches approximately 59 GWth by 2030, reflecting a more balanced development across the main technologies and a gradual narrowing of the gap between A/W-HP and A/A-HP systems.
Scenario C—2020 (Figure 9) presents the most conservative evolution, characterized by slow growth and an early stabilization of values. A/A-HP systems grow only slightly, from 24 to 28 GWth (+17%) between 2023 and 2030, while A/W-HP systems increase from 14 to just 21 GWth (+48%) over the same period. The W/W-HP segment remains unchanged at about 0.8 GWth. Consequently, total installed capacity reaches only 50 GWth in 2030, depicting a scenario in which the adoption of HP technologies slows and stabilizes, likely due to the absence of strong enabling policies or structural changes in the heating market.
Scenario D—2020 (Figure 10) presents a strategic shift in the technological mix of HPs, where the annual total heating capacity remains aligned with that of Scenario C (8.7 GWth), but with a different distribution of HP technologies. In this scenario, A/A-HP systems show a modest increase, from 24.3 GWth in 2022 to 26.4 GWth in 2030 (+8.6%). This represents a stable, incremental growth in line with historical trends, suggesting that A/A-HP systems continue to dominate the market, even at a slower pace. The A/W-HP systems, on the other hand, experience growth, from 13.9 GWth in 2022 to 38.9 GWth in 2030 (+179%). This increase reflects a marked shift towards more energy-efficient technologies, with A/W-HP systems overtaking A/A-HP in terms of installed capacity by 2030, much like in Scenario A. The rapid expansion of A/W-HP systems shows their increasing role in the heating market. The W/W-HP segment, however, remains largely stable in 2030. As a result, the total installed heating capacity in Scenario D reaches 66 GWth by 2030, marking an increase of approximately 69.2% from the 2022 baseline. This total capacity increase reflects the substantial adoption of A/W-HP technology, which becomes the primary driver of growth within this scenario.

9. Impact of HP Type in Future Scenarios

In Italy, in 2022, the majority of installed HPs were A/A-HPs units (95.9% of the total). Although A/W-HPs represented a smaller share (4.0%), they contributed significantly to the thermal capacity used for space heating (35.7%). W/W-HPs (including GS-W/W-HPs) remained much less widespread.
To facilitate the achievement of the PNIEC targets, two additional future scenarios could be considered, each emphasizing the increased adoption of specific HP technologies:
  • In this scenario, an increase in the installation of A/W-HPs is assumed, replacing traditional boilers. This would have a direct impact on the decarbonization of both space heating and DHW production. A/W-HPs use hydronic heating systems (radiators, underfloor heating), offering a more seamless transition for users already accustomed to such systems. Furthermore, when properly sized for local climatic conditions, they can operate efficiently even in average and cold climates. A higher number of installed A/W-HPs, particularly when replacing fossil fuel boilers, would lead to a more substantial reduction in CO2 emissions in the residential sector, thus making a contribution to the PNIEC’s decarbonization objectives.
  • This scenario promotes the installation of W/W-HPs, paired with low-enthalpy geothermal systems. These HPs take advantage of the more stable temperature of the ground or water sources, generally achieving higher Seasonal Performance Factors (SPFs) compared to A/A-HPs, especially in colder climates. Although their current adoption is limited, a wider deployment of this technology could significantly increase the share of renewable energy used for heating without requiring additional electricity consumption. However, their installation often entails higher initial investment costs and may require site-specific interventions. Despite recent national regulatory simplifications, large-scale adoption of this technology will require additional incentives and the removal of existing administrative and informational barriers.
A gradual transition toward a higher share of A/W-HPs and W/W-HPs in the installed base could represent an effective strategy to move beyond the current reliance on A/A-HP systems, often primarily used for cooling, and maximize the contribution of HPs to the PNIEC’s renewable heating targets.
Another important factor to consider in achieving the targets is the geographical location where HPs will be installed. In colder climate zones, A/W-HPs and W/W-HPs can offer better performance for space heating, especially when integrated with low-temperature heating systems such as underfloor heating or low thermal inertia radiators, and when installed in buildings with good thermal insulation. GS-W/W-HPs, thanks to the stable temperature of the ground, can ensure high efficiency even during the coldest periods. In mild and warm climate zones, A/A-HPs have been widely adopted, often for summer cooling. However, A/W-HPs can also represent an efficient solution for winter heating and DHW production, replacing traditional gas boilers and contributing to decarbonization. Therefore, an effective strategy should include differentiated incentives based on HP type and climatic zone, promoting the installation of the most suitable and efficient technologies for the specific heating needs of each geographical area. For example, greater incentives could be allocated for W/W-HPs in colder regions or for high-efficiency A/W-HPs replacing old boilers across all climate zones.

10. Discussion

The results presented in the previous sections highlight both the opportunities and the challenges on the path toward the decarbonization of the heating sector in line with the objectives of the PNIEC. It is essential to interpret our findings in the broader context of European trends and policies. As highlighted in other research [18], the electrification of the heating sector through HPs is recognized as a promising route for decarbonization across the EU. However, the adoption rate and specific goals vary significantly among Member States. For example, while some Nordic and Eastern countries may initially show lower electrification rates, they foresee acceleration in the future, even replacing biomass and district heating.
The analysis of policies adopted in countries like Germany, with the Smart-Grid-Ready interface for HPs [17], or Ireland, with its support schemes and specific targets [11,14], can provide valuable insights for refining Italian strategies.
The growth of heat pumps must be considered within the broader context of the simultaneous development of multiple technologies. In Italy, the PNIEC assigns heat pumps a crucial role while also highlighting the need to increase the deployment of other solutions. As shown in Table 1, the 2030 scenario aims to promote the use of biomethane to reduce reliance on natural gas. Additionally, solar thermal energy is expected to play an increasing role in integrated systems for efficient and renewable heat production, also supported by the promotion of seasonal thermal storage. In contrast, the installation of biomass heating systems is expected to be limited, prioritizing those with high environmental standards and efficiency. Finally, although still limited, hydrogen use is projected to increase, particularly in hard-to-abate industrial sectors [35].
Despite growing interest, the large-scale adoption of HPs in Italy faces several barriers. In addition to the high initial costs often cited [30], there are structural challenges related to the suitability of existing buildings for low-temperature heating systems. However, it is important to note that while low-temperature systems optimize the seasonal performance of HPs, they are not the only option. High-temperature HPs, which can be paired with radiators, also offer competitive COP values and can serve as a viable alternative in these contexts. As highlighted by Roca Reina et al. [54], high-temperature HPs and hybrid HPs were specifically developed to address the challenge of avoiding extensive building renovations or adjustments to existing hydronic systems. Operating at temperatures compatible with traditional radiators, these technologies can support the decarbonization process, offering significant potential for reducing energy consumption and CO2 emissions (ranging from 40% to 70%, depending on the European region). However, their specific performance, such as COP, may vary when compared to low-temperature HP systems.
Information gaps between consumers and installers regarding the benefits and operation of HPs, as well as the shortage of qualified installers, represent further challenges. Compared to the Irish experience [14], it emerges that some factors other than just economic ones, such as social networks and consumer characteristics, play an important role in adoption decisions. The Italian regulatory and political context must evolve to create more favorable conditions, such as through updated building regulations and effective fiscal incentives.
The transition to electrified heating will inevitably lead to an increase in electricity demand [16,18]. Therefore, it is essential to consider the impact on the Italian electricity grid and the need for infrastructure investments to ensure the stability and adequacy of the system. At the same time, HPs offer potential for demand-side management (DSM) and flexibility of the electricity system, especially when combined with thermal storage systems [24]. Leveraging this flexibility, for example through dynamic tariffs and price signals, can help optimize grid use and the integration of intermittent renewable sources.
The technological landscape of HPs is diverse, including A/W-HPs, A/A-HPs, GS-W/W-HPs, hybrid, and high-temperature systems [11]. In Italy, characterized by considerable regional climate variability, it is important to promote the technology best suited to each specific context. For example, GS-W/W-HPs, while offering high levels of efficiency [11], may be underutilized due to regulatory or informational barriers.
Cost and incentive analysis are central to understanding the speed and scope of HP adoption. Financial incentives, such as those mentioned for various European countries [11,35], prove to be essential tools for overcoming the barrier of high initial investment. It is important to consider the adoption of targeted, long-term mechanisms, also taking into account the total life cycle costs of HPs compared to fossil alternatives.
Although our analysis primarily focused on the residential and commercial sectors, it is important to highlight the growing potential of HPs in the industrial sector, particularly for processes requiring low- and medium-temperature heat. Further research is needed to assess in detail the specific opportunities and challenges for the Italian industry.

11. Limitations of the Study

The study considers four growth scenarios for the installation of HPs: Scenario A (reference year 2022), Scenario B (reference year 2021), Scenario C (reference year 2020), and Scenario D (reference year 2020, with a different technology mix). While these scenarios provide a structured representation of potential market developments, they are based on historical data and fixed assumptions and therefore may not reflect possible future changes in policy, technological innovation, supply chain dynamics, or user behavior. Moreover, the study does not account for ongoing climate change, which could significantly alter heating and cooling needs over time, nor does it consider the implications of using different climate data sources (e.g., EUROSTAT, IEA, ERA5) with varying methodologies and temporal coverage.
When calculating the renewable energy produced by HPs (Eres) to assess the achievement of the PNIEC objectives, the study excludes the energy used for cooling, which is a simplification that could affect the overall results. The use of reference values for Heating Performance Coefficient (HHP) and Seasonal Performance Factor (SPF, or SCOPnet) provided by the EC for various types of HPs further represents a generalization. The actual performance of HPs installed in Italy may differ from these standard values due to specific technical characteristics, installation conditions, and user habits. Furthermore, the calculation we use is of a standard type and does not account for the real performance characteristics of the HP units, instead relying on reference values from the applicable standards. The study also assumes a 15-year lifespan for all HP systems for simplicity. However, this assumption may not be entirely accurate, as there is variability in the average lifespan based on the type of equipment. A further element of uncertainty is represented by the adjustment factor (11.3%) applied to A/A-HPs in order to estimate the capacity actually used for heating, thereby excluding units used solely for cooling.
These limitations should be considered when interpreting the study’s findings and considering their implications for energy policies.

12. Conclusions

The analysis highlights the key role that HPs can play in Italy’s energy transition and in achieving the goals set by the PNIEC for 2030. However, meeting these targets requires a comprehensive strategic plan that includes economic support measures, regulatory simplification measures, and adequate training for sector operators.
The study has shown that the incentive policies implemented in recent years have placed Italy on the right path. The PNIEC requires that, by 2030, HPs contribute 4723 ktoe of renewable energy. At an annual installation rate of 2.5 million units, the number sold in 2022, the 2030 targets would not only be met but exceeded. Under this scenario, the installed HP stock in Italy would correspond to a total heating capacity of 69.82 GWth and renewable energy production of 5029 ktoe. Assuming a shift in the market over the coming years, characterized by a decline in small A/A-HP installations and a rise in A/W-HPs, an annual installation rate of only 1.3 million new units would be sufficient to meet the 2030 targets.
The presented scenarios show that achieving the objectives depends both on the volume of installations and the type of technology installed. Additional factors must also be taken into account, first of all the continued availability of incentives to ensure economic feasibility. The following points outline the key elements to be addressed to enable strategic development:
  • The continuity of incentives will be necessary to support market demand. Tax deductions have proven effective in stimulating the adoption of HPs, but policy uncertainty over their maintenance has unsettled the market. The scenarios presented have highlighted that, with the incentives foreseen in the 2025 financial law (covering the period until 2027), the goals can only be met up to the end of 2025. However, starting from 2026, a revision of support measures will be essential, with planning extended until 2030. Stable and long-lasting measures will therefore need to be implemented. To ensure the effectiveness of future policies, it will be necessary to implement stable, predictable, and diversified support mechanisms. In addition to tax deductions, alternative or complementary incentives could include direct grants, low-interest loans, and income-based subsidies, which are already widely used across the EU. For example, France applies a reduced VAT rate of 5.5% to a range of HP technologies and complements this with subsidies and targeted support. Italy could consider adopting similar fiscal measures to reduce upfront costs and ensure broader access to HP technologies. Moreover, rebalancing the tax burden on electricity bills and introducing flexible electricity tariffs—especially for users adopting renewable or smart systems—could improve the long-term economic appeal of HPs. Promoting flexible use (e.g., operation during off-peak hours) would also help consumers reduce costs and support grid efficiency.
  • The evolution of regulations could play a decisive role. The European Green Deal and the directives on the decarbonization of the building sector are pushing toward the adoption of more efficient and environmentally friendly technologies. A significant impact on the HP sector is also expected from Regulation (EU) 2024/573 [55] on fluorinated greenhouse gases, which provides for the gradual phase-out of high-GWP HFCs, commonly used as refrigerants in these systems. The regulation also promotes the adoption of natural or low-climate-impact refrigerants, with important implications for the design, manufacturing, and installation of heat pump technologies. Adapting the Italian regulatory framework in line with these trends will be essential.
  • The demand for electric HPs is expected to grow significantly in the coming years, particularly in the residential sector. In Italy, there are about 6 million non-condensing boilers, and replacing them with electric HPs would represent a strategic choice in the short to medium term for decarbonization. As stressed by [56], special attention should be given to the segment of HPs with capacity below 18 kWth for the residential sector. To avoid losing competitiveness and market share to countries that have already implemented support programs, it is essential to incentivize targeted investments and policies to support domestic production. A timely and effective intervention can foster the growth of this segment and strengthen the role of the Italian industry in the European energy landscape.
  • The role of the industrial supply chain cannot be underestimated. In fact, national production accounts for around 59% of the main components used in HPs sold in Italy, while EU production covers around 90% of the European Union. However, focusing on HPs below 18 kW, which are essential for the decarbonization of the residential sector, Italian production represents less than 30% of units sold in the country. This limited national share highlights a strategic weakness in a sector that is expected to see significant expansion, as shown by our scenarios [56]. Furthermore, Italy’s dependence on industry is particularly pronounced for compressors, a key component recognized as a significant bottleneck in the supply chain for domestic systems (p < 50 kW). Increasing production and improving the availability of components and materials will be decisive to support the growth of installations without creating bottlenecks.
  • Awareness and training are key elements in promoting the adoption of HPs. Many end users and sector operators are still not fully aware of the benefits of these technologies, making informational campaigns and professional development programs necessary.
  • The results of Scenario D have demonstrated that achieving the PNIEC objectives is possible not only through a high total volume of installations (as in Scenario A) but also by focusing on a technological mix that prioritizes A/W-HPs and W/W-HPs. These technologies, due to their higher effective contribution to renewable heat production per installed unit, can compensate for a lower overall number of units installed, still ensuring the achievement of the objectives.
  • Encouraging greater use of GS-W/W-HPs is also essential. Despite the simplifications introduced by the Italian Ministerial Decree of 30 September 2022 [57], this technology continues to be underutilized and struggles to find widespread adoption.
Looking beyond 2030, it will be important not only to achieve the set goals but also to ensure a sustainable growth trajectory that can lead Italy toward a gradual reduction in emissions in the heating sector. The evolution of technologies and the improvement in the efficiency of HPs can further contribute to this process, consolidating the role of these solutions within the national energy mix.
Achieving the PNIEC goals is possible, but it requires coordinated effort among institutions, industry, and consumers. A long-term strategy, based on targeted incentives, technological innovation, and awareness, will be essential to driving the energy transition in the heating and cooling sector.

Author Contributions

Conceptualization, G.M., F.C., M.D. and N.C.; methodology, G.M., F.C., M.D. and N.C.; software, G.M., F.C., M.D. and N.C.; validation, G.M., F.C., M.D. and N.C.; formal analysis, G.M., F.C., M.D. and N.C.; investigation, G.M., F.C., M.D. and N.C.; resources, G.M., F.C., M.D. and N.C.; data curation, G.M., F.C., M.D. and N.C.; writing—original draft preparation, G.M., F.C., and N.C.; writing—review and editing, G.M., F.C., and N.C.; visualization, G.M., F.C., M.D. and N.C.; supervision, G.M., F.C., M.D. and N.C.; project administration, G.M., F.C., M.D. and N.C. All authors have read and agreed to the published version of the manuscript.

Funding

This research received no external funding.

Institutional Review Board Statement

Not applicable.

Informed Consent Statement

Not applicable.

Data Availability Statement

Further data supporting the conclusions of this article will be made available by the authors on request.

Conflicts of Interest

The authors declare no conflict of interest.

Abbreviations

Prated,eff = Actual thermal capacity [GWth];
Prated,adj = Adjusted thermal capacity [GWth]. The adjustment factor has been applied to A/A-HP (mono-split and multi-split) used in residential settings.
A/A-HPAir-to-Air Heat Pumps
A/W-HPAir-to-Water
ASHPsAir Source Heat Pumps
DHWDomestic Hot Water
ECEuropean Commission
EHPAEuropean Heat Pump Association
GS-W/W-HPGround-Source Air-to-Water Heat Pumps
GWPGlobal Warming Potential
HDDsAnnual Degree Days
HTHPHigh-Temperature Heat Pumps
LCOHLevelized Cost of Heat methods
NGBsNatural Gas Boilers
PNIECItalian National Integrated Energy and Climate Plan
RESRenewable Energy Sources
RT&PRoof Top and Package
SPBTSimple Payback Time
SPFsSeasonal Performance Factors
W/W-HPWater-to-Water Heat Pumps

Appendix A

Table A1 (Scenario D) compared to the 2020 reference scenario, anticipates an important transformation in the technological mix of HPs installed in residential buildings. Specifically, it projects a 40% reduction in both mono-split and multi-split units. At the same time, the scenario estimates an annual increase of 217,836 A/W-HPs with a capacity of up to 10 kWth, 90,772 A/W-HPs with a capacity between 10 and 17 kWth, and a 5% increase in W/W-HPs, including ground-source systems, with a capacity of up to 17 kWth.
Table A1. Number of HPs and technology mix assumed in Scenario D.
TypeScopeTechnologyPrated,effEresAnnual
Installation
Total HP Units
kWthGWhUnitsUnits
AIR–AIRR.Mono-Split P < 72362669,72614,784,643
R.Multi-Split 1084211,1344,505,136
AIR–WATERR.A/W P < 1013,512243,2512,043,680
R.A/W 11 < P < 179609105,698939,133
R.Hybrid * 287218,618396,429
R.A/W18 < P < 501762373967,737
WATER–WATERR.W/W **P < 171035596487
WATER–WATERR.W/W ** 18 < P < 501301652726
AIR–AIRN.R.Mono-Split P > 7551634,103591,206
N.R.VRF P < 1916227529120,576
N.R.VRF20 < P < 3029017264117,393
N.R.VRFP > 3050917643123,295
N.R.RT&P P < 29431281837
N.R.RT&P 30 < P < 722212554540
N.R.RT&P 73 < P < 1203001903519
N.R.RT&PP > 12011393996593
AIR–WATERN.R.A/W51 < P < 1001972197130,070
N.R.A/W101 < P < 200200888414,556
N.R.A/W201 < P < 35015453526086
N.R.A/W351 < P < 5009401362368
N.R.A/W501 < P < 700721861329
N.R.A/W701 < P < 90020517278
N.R.A/W901 < P < 120059065
WATER–WATERN.R.W/W51 < P < 100123691278
N.R.W/W101 < P < 200214621132
N.R.W/W201 < P < 35026752750
N.R.W/W351 < P < 50010312184
N.R.W/W501 < P < 7008210108
Total [GWh] 56,506 -
Total [ktoe] 4858.7 -
Total (units) -1,314,05223,773,134
* Gas boiler + Electric HP; ** GS-W/W-HP included.

References

  1. International Energy Agency. The Future of Heat Pumps. World Energy Outlook Special Report. 2022. Available online: https://energy.ec.europa.eu/topics/energy-efficiency/heat-pumps_en (accessed on 18 March 2025).
  2. European Commission. Report from the Commission to the European Parliament and the Council Progress on Competitiveness of Clean Energy Technologies. 2022. Available online: https://eur-lex.europa.eu/legal-content/EN/TXT/?uri=celex:52022DC0643 (accessed on 17 March 2025).
  3. Council of the European Union. Fit for 55: Delivering the EU’s 2030 Climate Target on the Way to Climate Neutrality. Available online: https://www.consilium.europa.eu/en/policies/fit-for-55/ (accessed on 17 March 2025).
  4. European Commission. Commission Staff Working Document—Communication from the Commission to the European Parliament, the European Council, the Council, the European Economic and Social Committee, and the Committee of the regions. 2022. Available online: https://eur-lex.europa.eu/legal-content/EN/TXT/?uri=SWD%3A2022%3A230%3AFIN (accessed on 17 March 2025).
  5. European Heat Pump Association. European Heat Pump Market and Statistics Report 2023. Available online: https://www.ehpa.org/news-and-resources/publications/european-heat-pump-market-and-statistics-report-2023/ (accessed on 18 March 2025).
  6. Lyons, L.; Georgakaki, A.; Kuokkanen, A.; Letout, S.; Mountraki, A.; Ince, E.; Shtjefni, D.; Joanny, G.; Eulaerts, O.D.; Grabowska, M. Clean Energy Technology Observatory: Heat Pumps in the European Union—2022 Status Report on Technology Development, Trends, Value Chains and Markets; Publications Office of the European Union: Luxembourg, 2022. [Google Scholar] [CrossRef]
  7. European Commission. Heat Pump Accelerator Platform. Available online: https://energy.ec.europa.eu/topics/energy-efficiency/heat-pumps/heat-pump-accelerator-platform_en (accessed on 18 March 2025).
  8. European Commission—Green Deal Industrial Plan. Net-Zero Industry Act. Available online: https://commission.europa.eu/strategy-and-policy/priorities-2019-2024/european-green-deal/green-deal-industrial-plan/net-zero-industry-act_it (accessed on 18 March 2025).
  9. European Commission. Heat Pumps Action Plan: Online Consultation Launched by the Commission to Accelerate Roll-Out Across E.U. Available online: https://energy.ec.europa.eu/news/heat-pumps-action-plan-online-consultation-launched-commission-accelerate-roll-out-across-eu-2023-06-07_en (accessed on 18 March 2025).
  10. Peñaloza, D.; Mata, É.; Fransson, N.; Fridén, H.; Samperio, Á.; Quijano, A.; Cuneo, A. Social and Market Acceptance of Photovoltaic Panels and Heat Pumps in Europe: A Literature Review and Survey. Renew. Sustain. Energy Rev. 2022, 155, 111867. [Google Scholar] [CrossRef]
  11. Singh Gaur, A.; Fitiwi, D.Z.; Curtis, J. Heat Pumps and Our Low-Carbon Future: A Comprehensive Review. Energy Res. Soc. Sci. 2021, 71, 101764. [Google Scholar] [CrossRef]
  12. Yu, F.; Feng, W.; Luo, M.; You, K.; Ma, M.; Jiang, R.; Leng, J.; Sun, L. Techno-Economic Analysis of Residential Building Heating Strategies for Cost-Effective Upgrades in European Cities. iScience 2023, 26, 107541. [Google Scholar] [CrossRef] [PubMed]
  13. Mc Guire, J.; Balyk, O.; Petrović, S.N.; Moran, P.; Gallachóir, B. Ó; Daly, H. Advancing Cost-Optimal Residential Decarbonisation Pathways: An Examination of Heat Pumps and Thermal Efficiency. Energy Build. 2024, 317, 114383. [Google Scholar] [CrossRef]
  14. Meles, T.H.; Ryan, L. Adoption of renewable home heating systems: An agent-based model of heat pumps in Ireland. Renew. Sustain. Energy Rev. 2022, 169, 112853. [Google Scholar] [CrossRef]
  15. Merkel, E.; McKenna, R.; Fehrenbach, D.; Fichtner, W. A model-based assessment of climate and energy targets for the German residential heat system. J. Clean. Prod. 2017, 142, 3151–3173. [Google Scholar] [CrossRef]
  16. Roth, A.; Gaete-Morales, C.; Kirchem, D.; Schill, W. Power sector benefits of flexible heat pumps in 2030 scenarios. Commun. Earth Environ. 2024, 5, 718. [Google Scholar] [CrossRef]
  17. Fischer, D.; Wolf, T.; Wapler, J.; Hollinger, R.; Madani, H. Model-Based Flexibility Assessment of a Residential Heat Pump Pool. Energy 2017, 118, 853–864. [Google Scholar] [CrossRef]
  18. Thomaßen, G.; Kavvadias, K.; Jiménez Navarro, J.P. The Decarbonisation of the EU Heating Sector through Electrification: A Parametric Analysis. Energy Policy 2021, 148, 111929. [Google Scholar] [CrossRef]
  19. Saffari, M.; Keogh, D.; De Rosa, M.; Finn, D.P. Technical and Economic Assessment of a Hybrid Heat Pump System as an Energy Retrofit Measure in a Residential Building. Energy Build. 2023, 295, 113256. [Google Scholar] [CrossRef]
  20. Masternak, C.; Meunier, S.; Reinbold, V.; Saelens, D.; Marchand, C.; Leroy, Y. Potential of Air-Source Heat Pumps to Reduce Environmental Impacts in 18 European Countries. Energy 2024, 292, 130487. [Google Scholar] [CrossRef]
  21. Fotiou, T.; Fragkos, P.; Zisarou, E. Decarbonising the EU Buildings|Model-Based Insights from European Countries. Climate 2024, 12, 85. [Google Scholar] [CrossRef]
  22. Gradziuk, P.; Siudek, A.; Klepacka, A.M.; Florkowski, W.J.; Trocewicz, A.; Skorokhod, I. Heat Pump Installation in Public Buildings: Savings and Environmental Benefits in Underserved Rural Areas. Energies 2022, 15, 7903. [Google Scholar] [CrossRef]
  23. Trypolska, G.; Gradziuk, P.; Semeniuk, A.; Podolets, R.; Diachuk, O. Advancing Heat Pump Adoption in Ukraine’s Low-Carbon Energy Transition. Energies 2024, 17, 6110. [Google Scholar] [CrossRef]
  24. Campos, J.; Csontos, C.; Harmat, Á.; Csüllög, G.; Munkácsy, B. Heat Consumption Scenarios in the Rural Residential Sector: The Potential of Heat Pump-Based Demand-Side Management for Sustainable Heating. Energy Sustain. Soc. 2020, 10, 40. [Google Scholar] [CrossRef]
  25. Watson, S.D.; Crawley, J.; Lomas, K.J.; Buswell, R.A. Predicting Future GB Heat Pump Electricity Demand. Energ. Build. 2023, 286, 112917. [Google Scholar] [CrossRef]
  26. Gupta, R.; Irving, R. Possible Effects of Future Domestic Heat Pump Installations on the UK Energy Supply. Energ. Build. 2014, 84, 94–110. [Google Scholar] [CrossRef]
  27. Katris, A.; Turner, K.; Calvillo, C.F.; Zhou, L. The Importance of Heat Pump Cost Reduction and Domestic Supply Chain Development in the Presence of Persisting Energy Price Shocks. Energy Strat. Rev. 2024, 55, 101518. [Google Scholar] [CrossRef]
  28. Lysenko, O.; Yaramenka, K.; Mata, É.; Burgoa Francisco, F.; Gabaldon Moreno, A.; Lidfeldt, M.; Verdugo González, F. Positive Climate and Health Impacts from Upscaled Use of Heat Pumps and Solar Panels in Technology Packages in EU-27 by 2050. Sustain. Prod. Consum. 2024, 44, 221–233. [Google Scholar] [CrossRef]
  29. Efkarpidis, N.A.; Vomva, S.A.; Christoforidis, G.C.; Papagiannis, G.K. Optimal Day-to-Day Scheduling of Multiple Energy Assets in Residential Buildings Equipped with Variable-Speed Heat Pumps. Appl. Energy 2022, 312, 118702. [Google Scholar] [CrossRef]
  30. Rao, N.; Siam, M.R.K.; Bond, T.C. A Critical Review of Heat Pump Adoption in Empirical and Modeling Literature. iScience 2025, 28, e111666. [Google Scholar] [CrossRef] [PubMed]
  31. Hlavinka, A.N.; Mjelde, J.W.; Dharmasena, S.; Holland, C. Forecasting the Adoption of Residential Ductless Heat Pumps. Energy Econ. 2016, 54, 60–67. [Google Scholar] [CrossRef]
  32. Salimian Rizi, B.; Lee, J.; Heidarinejad, M. Trends for the Installation of Heat Pumps in the US Residential Buildings. Sustain. Energy Technol. Assess. 2025, 73, 104080. [Google Scholar] [CrossRef]
  33. Adamo, A.; Martin, H.; Hoz, J.d.l.; Rubio, J. A Review of Worldwide Strategies for Promoting High-Temperature Heat Pumps. Appl. Sci. 2025, 15, 839. [Google Scholar] [CrossRef]
  34. Abbasi, M.H.; Abdullah, B.; Ahmad, M.W.; Rostami, A.; Cullen, J. Heat Transition in the European Building Sector: Overview of the Heat Decarbonisation Practices through Heat Pump Technology. Sustain. Energy Technol. Assess. 2021, 48, 101630. [Google Scholar] [CrossRef]
  35. Ministry of the Environment and Energy Security. National Integrated Energy and Climate Plan. 2024. Available online: https://www.mase.gov.it/sites/default/files/PNIEC_2024_revfin_01072024.pdf (accessed on 18 March 2025).
  36. European Heat Pump Association. Why Did Heat Pump Sales Drop in 2024? 2025. Available online: www.ehpa.org/news-and-resources/news/why-did-heat-pump-sales-drop-in-2024/ (accessed on 18 March 2025).
  37. European Commission. Commission Decision of 1 March 2013 Establishing the Guidelines for Member States on Calculating Renewable Energy from Heat Pumps from Different Heat Pump Technologies Pursuant to Article 5 of Directive 2009/28/ECof the European Parliament of the Council (Notified Under Document C(2013) 1082) Text with EEA Relevance. 2.0.1.3./.1.1.4./.E.U; Official Journal of the European Union: Luxembourg, 2013; Available online: https://eur-lex.europa.eu/eli/dec/2013/114(1)/oj/eng (accessed on 18 March 2025).
  38. European Parliament and Council. Directive 2009/28/EC of 23 April 2009 on the Promotion of the Use of Energy from Renewable Sources and Amending and Repealing Directives 2001/77/EC and 2003/30/EC; (Text with EEA Relevance); Official Journal of the European Union: Luxembourg, 2009; Available online: https://eur-lex.europa.eu/legal-content/en/ALL/?uri=celex:32009L0028 (accessed on 18 March 2025).
  39. European Commission. Commission Delegated Regulation (EU) No 811/2013 of 18 February 2013 Supplementing Directive 2010/30/EU of the European Parliament and of the Council with Regard to the Energy Labelling of Space Heaters, Combination Heaters, Packages of Space Heater, Temperature Control and Solar Device, and Packages of Combination Heater, Temperature Control and Solar Device; (Text with EEA Relevance); Official Journal of the European Union: Luxembourg, 2013; Available online: https://eur-lex.europa.eu/legal-content/EN/ALL/?uri=CELEX:32013R0811 (accessed on 18 March 2025).
  40. European Commission. JRC Photovoltaic Geographical Information System (PVGIS). Joint Research Centre, European Commission: Italy21024. Available online: https://re.jrc.ec.europa.eu/pvg_tools/en/ (accessed on 18 March 2025).
  41. Presidential Decree No. 412 of 26 August 1993. Regulations Establishing the Minimum Energy Performance Requirements for Buildings and Thermal Equipment. Official Gazette of the Italian Republic, 1 November 1993.
  42. European Commission Cooling and Heating Degree Days by Country—Monthly Data. Eurostat. Available online: https://data.europa.eu/data/datasets/qpz4216lvn91t1vf3v2nkq?locale=en (accessed on 18 March 2025).
  43. Eurostat. SHARES Tool Manual. European Commission. 2023. Available online: https://ec.europa.eu/eurostat/documents/38154/4956088/SHARES+tool+manual-2021.pdf/11701ebe-1dae-3b00-4da4-229d86d68744?t=1664793455773 (accessed on 18 March 2025).
  44. Comuni Italiani. Province Italiane per Abitanti. Available online: https://www.comuni-italiani.it/provincep.html (accessed on 18 March 2025).
  45. Assoclima. Statistical Survey by Assoclima, Edited by Anima Research Office, on the Market for Components for Air Conditioning Systems. Anima. Available online: https://www.anima.it/associazioni/elenco/assoclima/attivita/pubblicazioni/studi-di-mercato.kl (accessed on 18 March 2025).
  46. EurObserv’ER. Heat Pumps Barometer 2024; EurObserv’ER: Paris, France, 2024; Available online: https://www.eurobserv-er.org/heat-pumps-barometer-2024/ (accessed on 18 March 2025).
  47. European Parliament, Council of the European Union. Directive (EU) 2024/1275 of the European Parliament and of the Council of 24 April 2024 on the Energy Performance of Buildings (Recast). Official Journal of the European Union: Luxembourg, 2024; pp. 1–60. Available online: https://eur-lex.europa.eu/eli/dir/2024/1275/oj/eng (accessed on 18 March 2025).
  48. European Commission. Communication on the Gradual Phase-out of Financial Incentives for Single Heating Systems Powered by Fossil Fuels under the Directive on the Energy Performance of Buildings. Official Journal of the European Union: Luxembourg, 2024; Available online: https://eur-lex.europa.eu/legal-content/IT/TXT/HTML/?uri=OJ:C_202406206 (accessed on 18 March 2025).
  49. European Committee for Standardization (CEN). Energy Performance of Buildings. Heating Systems and Cooling Systems in Buildings—Part 1: Economic Evaluation Procedure for Building Energy Systems. Module M1-14; EN 15459-1:2018; CEN: Brussels, Belgium, 2018. [Google Scholar]
  50. ISPRA. Italian Greenhouse Gas Inventory 1990-2021 National Inventory Report 2023; ISPRA: Rome, Italy, 2023. Available online: https://www.isprambiente.gov.it/files2023/pubblicazioni/rapporti/rapporto_383_2023.pdf (accessed on 18 March 2025).
  51. Gestore dei Servizi Energetici (GSE). Thermal Sector—National Monitoring of Renewable Energy; Gestore dei Servizi Energetici (GSE): Rome, Italy, 2025; Available online: https://www.gse.it/dati-e-scenari/monitoraggio-fer/monitoraggio-nazionale/settore-termico (accessed on 18 March 2025).
  52. European Heat Pump Association (EHPA). Market Data; EHPA: Brussels, Belgium, 2025; Available online: https://www.ehpa.org/market-data/ (accessed on 6 June 2025).
  53. Assoclima. Libro Bianco sulle Pompe di Calore—Quarta Edizione [White Paper on Heat Pumps—Fourth Edition]; Assoclima: Milan, Italy, 2023; Available online: https://www.anima.it/kdocs/2097876/libro_bianco_sulle_pdc_quarta_ed_agosto_2023.pdf (accessed on 6 June 2025).
  54. Roca Reina, J.C.; Carlsson, J.; Volt, J.; Toleikyte, A. Alternatives for Decarbonising High-Temperature Heating Facilities in Residential Buildings. Energies 2025, 18, 235. [Google Scholar] [CrossRef]
  55. European Parliament and Council. Regulation (EU) 2024/573 of 7 February 2024 on Fluorinated Greenhouse Gases, Amending Directive (EU) 2019/1937 and Repealing Regulation (EU) No 517/2014. 2024. Available online: https://eur-lex.europa.eu/eli/reg/2024/573/oj/eng (accessed on 18 March 2025).
  56. Assoclima; TEHA Group. The Role of Heat Pumps in Italy: State of the Art Development Opportunities 2025. Available online: https://www.anima.it/kdocs/2174900/executive_summary_eng.pdf (accessed on 18 March 2025).
  57. Ministero della Transizione Ecologica. Decree of 30 September 2022, Prescriptions for the Installation of Heat Production Systems from Geothermal Resources, Intended for Heating and Cooling Buildings and Measures for the Simplification of the Installation of Such Systems. Gazzetta Ufficiale Della Repubblica Italiana, No. 240, 30 September 2022. 2022. Available online: https://www.gazzettaufficiale.it/eli/id/2022/10/14/22A05770/SG (accessed on 18 March 2025).
Figure 1. Research procedure adopted in the study.
Sustainability 17 05938 g001
Figure 2. Number of HPs from 2004 to 2023.
Sustainability 17 05938 g002
Figure 3. Annual total thermal capacity from 2004 to 2023 [MWth].
Sustainability 17 05938 g003
Figure 4. Distribution of total thermal capacity in GWth (a) and HPs (b) as of 2022 (count referring to the years 2008–2022).
Sustainability 17 05938 g004
Figure 5. Total thermal capacity in the considered scenarios.
Sustainability 17 05938 g005
Figure 6. HP system installation scenarios (growth of ambient energy associated with heating service in ktoe).
Sustainability 17 05938 g006
Figure 7. Evolution of total heating capacity in Scenario A.
Sustainability 17 05938 g007
Figure 8. Evolution of total heating capacity in Scenario B.
Sustainability 17 05938 g008
Figure 9. Evolution of total heating capacity in Scenario C.
Sustainability 17 05938 g009
Figure 10. Evolution of total heating capacity in Scenario D.
Sustainability 17 05938 g010
Table 1. The 2030 growth targets for the share of renewable energy in the heating sector (ktoe) (Source: Table 13 of the PNIEC [35]).
Year2021202220252030
Numerator11,06110,62612,49017,634
Gross heat production from RES373373519537
Final RES consumption for heating and cooling10,68810,25211,97017,097
of which biomethane (1)009963186
of which other bioenergy (1)7477682770187464
of which solar247263494699
of which geothermal115110167208
of which hydrogen0012315
of which ambient energy2849305232845225
Denominator—final gross consumption in the thermal sector57,06851,53850,88449,159
Renewable energy share (FER-C) (%)19.40%20.60%24.50%35.90%
Possible contribution from waste heat and renewable electricity (flexibility) (2)450
Renewable energy share with flexibility (%) 36.50%
(1) The contribution refers to solid biomass, biogas (including biomethane), and bioliquids (including biodiesel and bio-LPG) that meet sustainability requirements. (2) Assumption of the cumulative contribution from annual increases between 2021 and 2030 of renewable electricity used for heating and waste heat recovered through district heating systems.
Table 2. Climatic characteristics of the reference locations.
Climatic ConditionsReference LocationAverage Annual Temperature Average Annual Solar IrradianceTotal Annual Solar Irradiation
°CW/m2kWh/m2
ColdHelsinki7.01112.8988
AverageStrasbourg11.4139.51222
HotAthens18.1203.91786
Table 3. Reference values for different types of HPs [37].
Climatic Conditions
ColdAverageWarm
HP Energy SourceEnergy Source Distribution MediumHHPSPF
SCOPnet
HHPSPF
SCOPnet
HHPSPF
SCOPnet
Air-source energyair/air19702.517702.612002.7
air/water17102.516402.611702.7
air/air (reversible)19702.57102.61202.7
air/water (reversible)17102.56602.61202.7
exhaust air/air6002.56602.67602.7
exhaust air/water6002.56602.67602.7
Geothermal energyground/air24703.220703.213403.2
ground/water24703.520703.513403.5
Hydrothermal heatwater/air24703.220703.213403.2
water/water24703.520703.513403.5
Table 4. Distribution of provincial capitals in each Italian region and their resident population [44] across Italian regions, classified by climatic conditions.
Italian RegionClimatic Conditions
ColdAverageWarm
Provincial Capitals PopulationProvincial Capitals PopulationProvincial Capitals Population
Abruzzo001301,91031,020,337
Basilicata00002570,365
Calabria000051,965,128
Campania000055,839,084
Emilia-Romagna1448,89983,999,94200
Friuli Venezia Giulia1531,4663686,40600
Lazio001157,42045,740,704
Liguria001850,0713715,236
Lombardy21,050,296108,968,51000
Marches002515,5012648,973
Molise00185,8051224,644
Piedmont53,379,04831,013,47800
Apulia000064,063,888
Sardinia000081,653,135
Sicily000095,056,641
Tuscany003996,92483,119,094
Trentino-South Tyrol21,062,8600000
Umbria001660,6901228,218
Aosta Valley1126,8830000
Veneto1205,78164,701,74800
Total136,805,2334022,938,4055730,845,447
Percentage distribution11.8%11.2%36.4%37.9%51.8%50.9%
Table 5. HPs in operation as of 2022 (corresponding to sales from 2008 to 2022).
Quantity
HP
Total Installed Thermal Capacity
UnitsGWth
TOTAL21,087,668(110.31)
39.04 **
Residential20,172,558(88.68) *
17.40 **
A/A-HP19,352,532(80.36) *
9.08 **
A/W-HP810,9758.14
W/W-HP90510.19
Not residential915,10921.63
A/A-HP872,53715.22
A/W-HP39,0715.79
W/W-HP35010.62
* Actual data. ** For mono-split and multi-split units intended for residential use, the data is obtained by applying an adjustment factor of 11.3%.
Table 6. Summary overview of HPs in operation as of 2022 (corresponding to sales from 2008 to 2022).
TypeUnit in Operation%Prated,eff GWth%Prated,adj GWth%
A/A-HP20,225,07095.9%95.686.60%24.3 (*)62.30%
A/W-HP850,0464.0%13.912.60%13.935.70%
W/W-HP12,5520.1%0.80.70%0.82.10%
Total21,087,668100.0%110.3100.00%39.04100.00%
Prated,eff = actual thermal capacity [GWth]; Prated,adj = adjusted thermal capacity (used in the scenarios) [GWth]. (*) The adjustment factor has been applied to A/A-HPs (mono-split and multi-split) used in residential settings.
Table 7. Distribution of HP stock (Sources: Assoclima and Assotermica for Hybrid Systems).
Stock (A)Stock (B)
Sustainability 17 05938 i001Sustainability 17 05938 i002
ApplicationType and SizeApplicationType and Size
A/A–R.Mono-Split (Prated < 7 kWth)A/A–R.Multi-Split
A/A–N.R.Mono-Split (Prated > 7 kWth)A/W–R.Hydronic HP (Prated < 17 kWth)
A/A–N.R.Roof Top and Package A/A–N.R.VRF (Prated < 16 kWth)
A/W–R.A/W (18 > Prated > 50 kWth)A/A–N.R.VRF (Prated > 16 kWth)
A/W–N.R.A/W (Prated > 50 kWth)A/W–R.Hybrid Systems (Gas boiler + HP)
W/W–R.W/W (GS-W/W-HPs) (Prated < 17 kWth)
Legend: R—residential; NR—not residential; A/A—air to air; A/W—air to water; W/W—water to water.
Table 8. Percentage distribution of the HP stock by type and climate area.
Climatic Conditions
Stock DistributionColdAverageWarm
Stock (A)10.6%50.7%38.7%
Stock (B)12.8%48.5%38.8%
Table 9. Expected average lifetime by equipment type.
Type of EquipmentAverage Lifetime
[Years]
Room air conditioner12
Mono-split, multi-split, VRF15
Packaged, roof top18
Precision air conditioning22
Only cooling chiller25
HP chiller20
Hybrid machines25
Table 10. Estimate of the share of gross final consumption for heating thermal energy covered by renewable sources in 2022 (stock from 2008 to 2022).
TypeScopeTechnologyPrated,eff [kWth]Eres [GWh]HP Units
AIR–AIRR.Mono-Split P < 7226714,864,192
R.Multi-Splitn.a.11964,488,341
AIR–WATERR.A/W P < 102152325,550
R.A/W 11 < P < 171963190,591
R.Hybrid (Gas boiler + Electric HP)n.a.1727238,288
R.A/W18 < P < 50152656,546
WATER–WATERR.W/W (ground source included)P < 17845599
R.W/W (ground source included) 18 < P < 501623452
AIR–AIRN.R.Mono-Split P > 75675563,784
N.R.VRF P < 19120793,835
N.R.VRF20 < P < 30221196,436
N.R.VRFP > 304021101,847
N.R.Roof Top and Package P < 29391731
N.R.Roof Top and Package 30 < P < 722284723
N.R.Roof Top and Package 73 < P < 1203173689
N.R.Roof Top and Package P > 12010836492
AIR–WATERN.R.A/W51 < P < 100141521,124
N.R.A/W101 < P < 200145910,887
N.R.A/W201 < P < 35010744308
N.R.A/W351 < P < 5006471670
N.R.A/W501 < P < 700440819
N.R.A/W701 < P < 900138185
N.R.A/W901 < P < 12007178
WATER–WATERN.R.W/W51 < P < 1001411425
N.R.W/W101 < P < 2002281162
N.R.W/W201 < P < 350212587
N.R.W/W351 < P < 500103189
N.R.W/W501 < P < 7006786
N.R.W/W701 < P < 9003635
N.R.W/W901 < P < 12002317
Total [GWh] 31,911-
Total [ktoe] 2744-
Total (units) -21,087,668
Table 11. Summary of results from the scenarios.
Scenario 2030Million [HPs/Year]Total Number [Million Units]Prated [GWth]Prated,adj [GWth]Eres
[ktoe]
(*)
Eres PNIEC
[ktoe]
(**)
Estimated Missing HP Units to Achieve the PNIEC Goal [Million Units]
A—20222.531.81165.6069.8250294723-
B—20212.229.76150.5158.5341683.96
C—20201.625.72137.0749.8535058.94
D—2020 ***1.323.78137.0766.044859-
(*) Eres considers the ambient energy associated with heating and DHW services, while it does not consider the ambient energy for cooling. (**) The PNIEC forecasts, for 2030, an Eres of 5225 ktoe, including the ambient energy destined for heating, DHW, and cooling. In the present analysis, the ambient energy for cooling has been excluded on a lump-sum basis, estimating it at 9.61% of the PNIEC goal. This share was determined by calculating the average of the data collected by GSE from 2021 to 2023, thereby adjusting the goal for heating and DHW alone to 4723 ktoe. This is an assumption, and this share could vary over time. (***) The scenario considers the same effective Prated as in Scenario C, but with a different distribution of HP units in the residential sector.
Disclaimer/Publisher’s Note: The statements, opinions and data contained in all publications are solely those of the individual author(s) and contributor(s) and not of MDPI and/or the editor(s). MDPI and/or the editor(s) disclaim responsibility for any injury to people or property resulting from any ideas, methods, instructions or products referred to in the content.

