Article

The “Daily Challenge” Tool: A Practical Approach for Managing Non-Conformities in Industry

1
Faculty of Economics, “1 Decembrie 1918” University of Alba Iulia, 15-17 Unirii Street, 510009 Alba Iulia, Romania
2
Faculty of Engineering Hunedoara, Politehnica University Timişoara, 5 Revolutiei Street, 331128 Hunedoara, Romania
3
Sanitary Veterinary and Food Safety Directorate of Alba County, 7A Lalelelor Street, 510217 Alba Iulia, Romania
4
Solina România S.R.L., 7 Calea Ciugudului Street, 510382 Alba Iulia, Romania
*
Author to whom correspondence should be addressed.
Sustainability 2025, 17(13), 5918; https://doi.org/10.3390/su17135918
Submission received: 27 April 2025 / Revised: 25 June 2025 / Accepted: 26 June 2025 / Published: 27 June 2025

Abstract

Non-conformities—deviations from established standards or procedures—can significantly impact product quality and process performance. Although various tools and methodologies exist, current research lacks an integrated, deferred, and corrective approach to non-conformance management that bridges day-to-day operations with systematic quality control. The proposed tool aims to address this gap by providing a practical framework that combines batch data processing using the “Daily Challenge” tool with structured problem solving and corrective strategies. It serves as a comprehensive decision-making tool for systematically managing deviations. The methodology begins with identifying non-conformities through data collection and direct observation, followed by focused reporting and active discussion during departmental meetings. Issues are then categorized based on their frequency, operational impact, and resource requirements to determine the appropriate resolution path—whether through immediate correction or detailed analysis using structured tools such as the “Daily Challenge” sheet. It integrates well-established methodologies such as 5M and PDCA into a structured, daily workflow for resolving non-conformities. Implemented solutions are evaluated for effectiveness with ongoing monitoring to ensure continuous improvement. A key feature of this system is the use of the “Daily Challenge” form, which facilitates documentation, accountability, and knowledge retention—helping to reduce the recurrence of similar situations. The case studies illustrate the methodology through two examples: a labeling issue involving the omission of quantity information on product labels due to operator oversight and the management of production downtime caused by equipment and sensor failures. Although a standard existed, the errors revealed the need for reinforced procedures. Corrective actions included revising procedures, retraining personnel, repairing and recalibrating equipment, enhancing maintenance protocols, and using visual documentation to enhance process understanding. The “Daily Challenge” tool provides a replicable framework for managing non-conformities across various industries, aligning operational practices with quality assurance goals. By integrating structured analysis, clear documentation, and corrective strategies, it fosters a culture of continuous improvement and compliance.

1. Introduction

Within any organization, actions are guided by requirements imposed by policies, legislation, or standards aimed at achieving objectives [1]. Conformance functions as a coordination mechanism, reducing uncertainty in organizational activities [2]. However, deviations from these requirements, ranging from minor to more serious, frequently occur. These deviations lead to the emergence of non-conformities that negatively impact the organization’s performance [3].
In the broader context of Industry 4.0, recent research emphasizes the strategic role of integrated digital systems—including Digital Twins, AI, and IoT—in enhancing operational efficiency, enabling real-time decision-making, and fostering sustainable innovation across production and quality management functions [4,5,6].
Non-conformities in industry often arise due to challenges in adapting production processes, materials used, or resource management. These issues are frequently linked to the integration of new solutions or changes within existing systems that may not yet be fully optimized or controlled.
Considering the complexity of technological workflows, operators must find or adapt solutions for monitoring and controlling the entire process. Thus, it is necessary to analyze useful information that can be used to identify plausible factors leading to non-conformities [7]. For this purpose, it is essential to clearly define and integrate key terms to ensure a common understanding within the methodology. An incident is any unplanned event with the potential to cause injury, illness, damage to equipment, products, or the environment, or disrupt activities, requiring rapid action to minimize harm or disruption [8]. A problem represents a situation, obstacle, or difficulty that needs to be identified and resolved; it can be general, not necessarily related to standards, arise from unexpected inefficiencies, and may not immediately impact regulatory conformance [9]. A non-conformity is a specific deviation from legal requirements, organizational policies, standards, or procedures where a clear requirement has not been met; it is a formal issue that may lead to serious consequences like penalties and requires corrective and preventive actions to avoid recurrence [10]. While all non-conformities are problems, not all problems are non-conformities. Incidents are unforeseen events that may cause risks and demand swift intervention. Corrective actions are measures taken to eliminate causes of non-conformities or other undesirable situations to prevent their recurrence [11].
Non-conformities are a common factor in the operation of a company. It is imperative to constantly investigate the causes and sources of irregularities [12]. The purpose of identifying a non-conformity is to facilitate improvement [13].
Non-conformities are deviations from established standards, regulations, or specifications that can impact quality, safety, and operational efficiency across industries [14], such as automotive, food, pharmaceuticals, construction, aerospace and defense, energy, and oil and gas. Each sector faces unique challenges in maintaining conformance, with potential risks to consumer safety, product integrity, and business operations [15]. In the food industry, non-conformity issues generally arise due to the failure to adhere to good hygiene practices and discrepancies between the actual execution and the established HACCP system [16]. It is essential for producers, retailers, and consumers to guarantee food safety [17]. Failure to comply with food safety regulations leads to significant risks to public health, including the emergence of foodborne illnesses, product quality deterioration, and economic losses [18]. Additionally, violations of standards can result in the loss of consumer trust and legal penalties for the involved organizations, thereby affecting their reputation and stability [19].
The repercussions of non-conformities highlight the critical importance of adhering to food safety standards and instructions [20]. These not only protect public health but also support the integrity and success of businesses [21]. A commitment to food safety is essential for preventing non-conformities and promoting a culture of responsibility and trust within the industry [22].
Due to its direct impact on public health, this paper focuses specifically on the bottled water industry within the broader food sector. The general goal of developing the bottled water industry is closely tied to the continuous growth of the population and aligned with global socio-economic imperatives, the sustainable use of resources, and consumption management on a global scale [23,24]. In this context, it is important to understand the sacrality of water as a fundamental principle, promoting respect for this vital resource and implementing sustainable practices to ensure fair and responsible access to water for present and future generations [25].
Although several approaches to non-conformance management exist, recent research lacks a comprehensive, periodic, data collection-based, and preventive system that integrates structured problem solving with operational feedback, especially in contexts where continuous improvement is essential. However, current systems for managing non-conformities often suffer from several limitations: they are reactive rather than preventive, lack integration across departments, and do not offer real-time traceability or the structured prioritization of root causes. These shortcomings hinder the ability of organizations to respond swiftly and effectively to emerging issues, especially in industries like bottled water production, where both quality and conformance are critical. To address these challenges, this paper introduces the “Daily Challenge” tool, a structured, proactive, and integrated framework designed to improve the detection, analysis, correction, and prevention of non-conformities. Unlike traditional systems, INCMS embeds non-conformity management directly into daily operational decision-making, offering a complete methodology that includes structured problem formulation, visual documentation, cause prioritization using the 5M model, corrective action planning, monitoring, and standardization.
The added value of the “Daily Challenge” tool lies in its ability to combine classical quality tools with a practical, hands-on, decision-support instrument—the “Daily Challenge” sheet—which facilitates batch data processing, team accountability, and action traceability. Moreover, by incorporating the PDCA (Plan–Do–Check–Act) cycle as a foundational mechanism, the “Daily Challenge” tool ensures continuous improvement and adaptability in dynamic production environments. The “Daily Challenge” tool is effective in managing non-conformance issues in production by providing a structured approach to detect, fix, and prevent failures. This approach benefits both operational performance and client satisfaction.
Therefore, this paper not only presents case studies on a specific non-conformity in the bottled spring water technological flow but also proposes a replicable model that strengthens operational resilience, regulatory conformance, and sustainable process improvement. The implementation of the “Daily Challenge” tool contributes to a culture of food safety, transparency, and shared responsibility that is aligned with both internal objectives and external regulatory requirements.

2. Methodology for Non-Conformity Management—The “Daily Challenge” Method

2.1. Methodological Background

We developed a generalized methodology for managing non-conformities to address issues in the material or informational flow and to ensure the safety of bottled water. This methodology includes the identification, documentation, and classification of non-conformities; root cause analysis (using tools like the 5M model); the planning of corrective action; and continuous monitoring through the PDCA cycle. Compared to traditional systems, which often remain reactive and fragmented, the Daily Challenge method integrates classic quality tools into a unified and proactive process, optimizing operational efficiency and compliance with regulations.
This methodology promotes operational efficiency and supports regulatory compliance. It is conceived as a flexible framework that can be adapted to various industry contexts where quality and safety considerations are critical.

2.2. Overview of the “Daily Challenge” Method

This method was chosen to overcome the main limitations of existing non-conformance management systems, which are often reactive, fragmented, and lack effective traceability. It provides a proactive, structured approach that embeds non-conformity management into daily operations. By combining classic quality tools, the practical “Daily Challenge” sheet enables the batch data processing of non-conformities, ensures clear accountability, and supports traceability. The method prioritizes root causes, assigns responsibilities, and uses the PDCA cycle for continuous improvement. Such an approach leads to faster problem resolution, better prevention, and improved operational performance—especially important in quality-critical industries. In the context of this research, the term “integrated” refers to the conceptual integration of various manual methods and processes into a unified framework. The goal is to develop a coherent methodology that can be applied across different industries, not to propose a digital solution.
To validate the applicability of the “Daily Challenge” tool, two case studies were conducted within the bottled water production process. These case studies demonstrate how the proposed methodology can be effectively implemented in a real-world, quality-critical environment, ensuring operational excellence and regulatory compliance. The need for this methodology stems from its ability to manage and control non-conformities, helping companies maintain high operational standards and comply with regulations. While validated in the bottled water industry, the structure and approach of the Daily Challenge tool are applicable to other industries facing similar challenges in process compliance and quality assurance.
In any field of activity, the problems encountered, the non-conformities, can be viewed positively, and are often referred to as the “Daily Challenge” that arises; they must be identified, analyzed, resolved, and monitored to ensure they do not recur.

2.3. Steps of the Methodology

The description of the steps required for problem management is presented in Figure 1.
The purpose of developing the non-conformity management decision-making tool is to identify the root causes that led to the reported non-conformity, determine solutions for its remediation, and define the actions that need to be taken to prevent its recurrence in the future.
Step 1—Identification and Classification of Non-conformities
The reported problems can be classified based on the source of the non-conformity into two streams: material and informational. Table 1 presents the classification of the main types of non-conformities that can be identified within the material and informational streams.
The reported problems across both material and informational flows were addressed using a unified problem solving approach facilitated by the Daily Challenge tool. In the material flow, the main techniques included production process analysis—which identified issues such as equipment downtime, bottlenecks in line configuration, and inconsistent task sequencing—resource reallocation, equipment maintenance, and optimization tools such as 5S, visual management, and standardization. For the informational flow, problem resolution was supported through cross-departmental collaboration, the application of visual management strategies, and the enforcement of standardization procedures.
Figure 2 presents a high-level overview of the process for identifying non-conformities based on two main flows/sources.
The first step in preparing for the problem analysis involves selecting the problems to be analyzed from the non-conformities identified in the material or informational flow. The flowchart in Figure 2 presents a higher-level process overview where these specific categories are encompassed within broader categories such as quality and operational issues.
Step 2—Collection of Relevant Data
Next, it is necessary to collect data regarding the reported non-conformities. For the problem analysis, these are collected based on the identified non-conformities; for quality-related issues, these are collected from the department meeting; for production, productivity, or other aspects related to the department’s activity, respectively, from process analysis; and for 5S-related issues, these non-conformities are collected from product/service safety or security issues (depending on the industry, such as automotive, food, pharmaceuticals, construction, aerospace and defense, energy, and oil and gas), technical issues, or administrative issues.
Step 3—Formation of the Analysis Team
The reporting of problems at the department or general meeting is carried out by the department head. The moderator of the problem analysis meeting is chosen from the management of the area where the non-conformity occurred and will be someone who is very familiar with the processes in the area where the non-conformity happened so that they can understand the events as well as possible, adding more value to the analysis process and its results.
To identify the optimal solutions for resolving the identified non-conformities, the moderator forms a team consisting of operators and representatives from the department where the non-conformity was generated, representatives from the “supplier” and “customer” departments of the department where the non-conformity was generated, and representatives from support departments such as quality, technical, etc.
Step 4—Classification of Non-conformity Severity
In Figure 3, details are presented about the classification of problems that facilitate the prioritization of interventions and the proper allocation of resources based on the impact of each non-conformity.
Problems are classified based on their severity into simple, medium, and major categories. To ensure a consistent and objective categorization of the identified issues, a classification system was introduced based on three key criteria: frequency of occurrence, operational impact, and resource requirements for resolution. Each issue was evaluated using a simple scoring system (1—low, 2—moderate, 3—high) across these dimensions. Based on the total score (ranging from 3 to 9), the problems were classified as follows:
-
Simple (score 3–4): Low-frequency issues with minimal operational impact, typically resolved through routine actions.
-
Medium (score 5–6): Moderate-impact problems requiring coordination between departments and targeted corrective measures.
-
Major (score 7–9): High-impact non-conformities affecting safety, quality, or compliance, demanding immediate action and management involvement.
This method ensures the rapid identification of priorities, efficient allocation of resources, and minimization of associated risks, thereby contributing to the improvement of processes and enhancing organizational performance.
A simplified scoring method was deliberately chosen to ensure practical, rapid implementation in operational contexts. While more advanced tools offer detailed analysis, they require time and expertise, potentially slowing decisions. This approach supports agile non-conformance management, with future research encouraged to explore more precise risk evaluation methods.
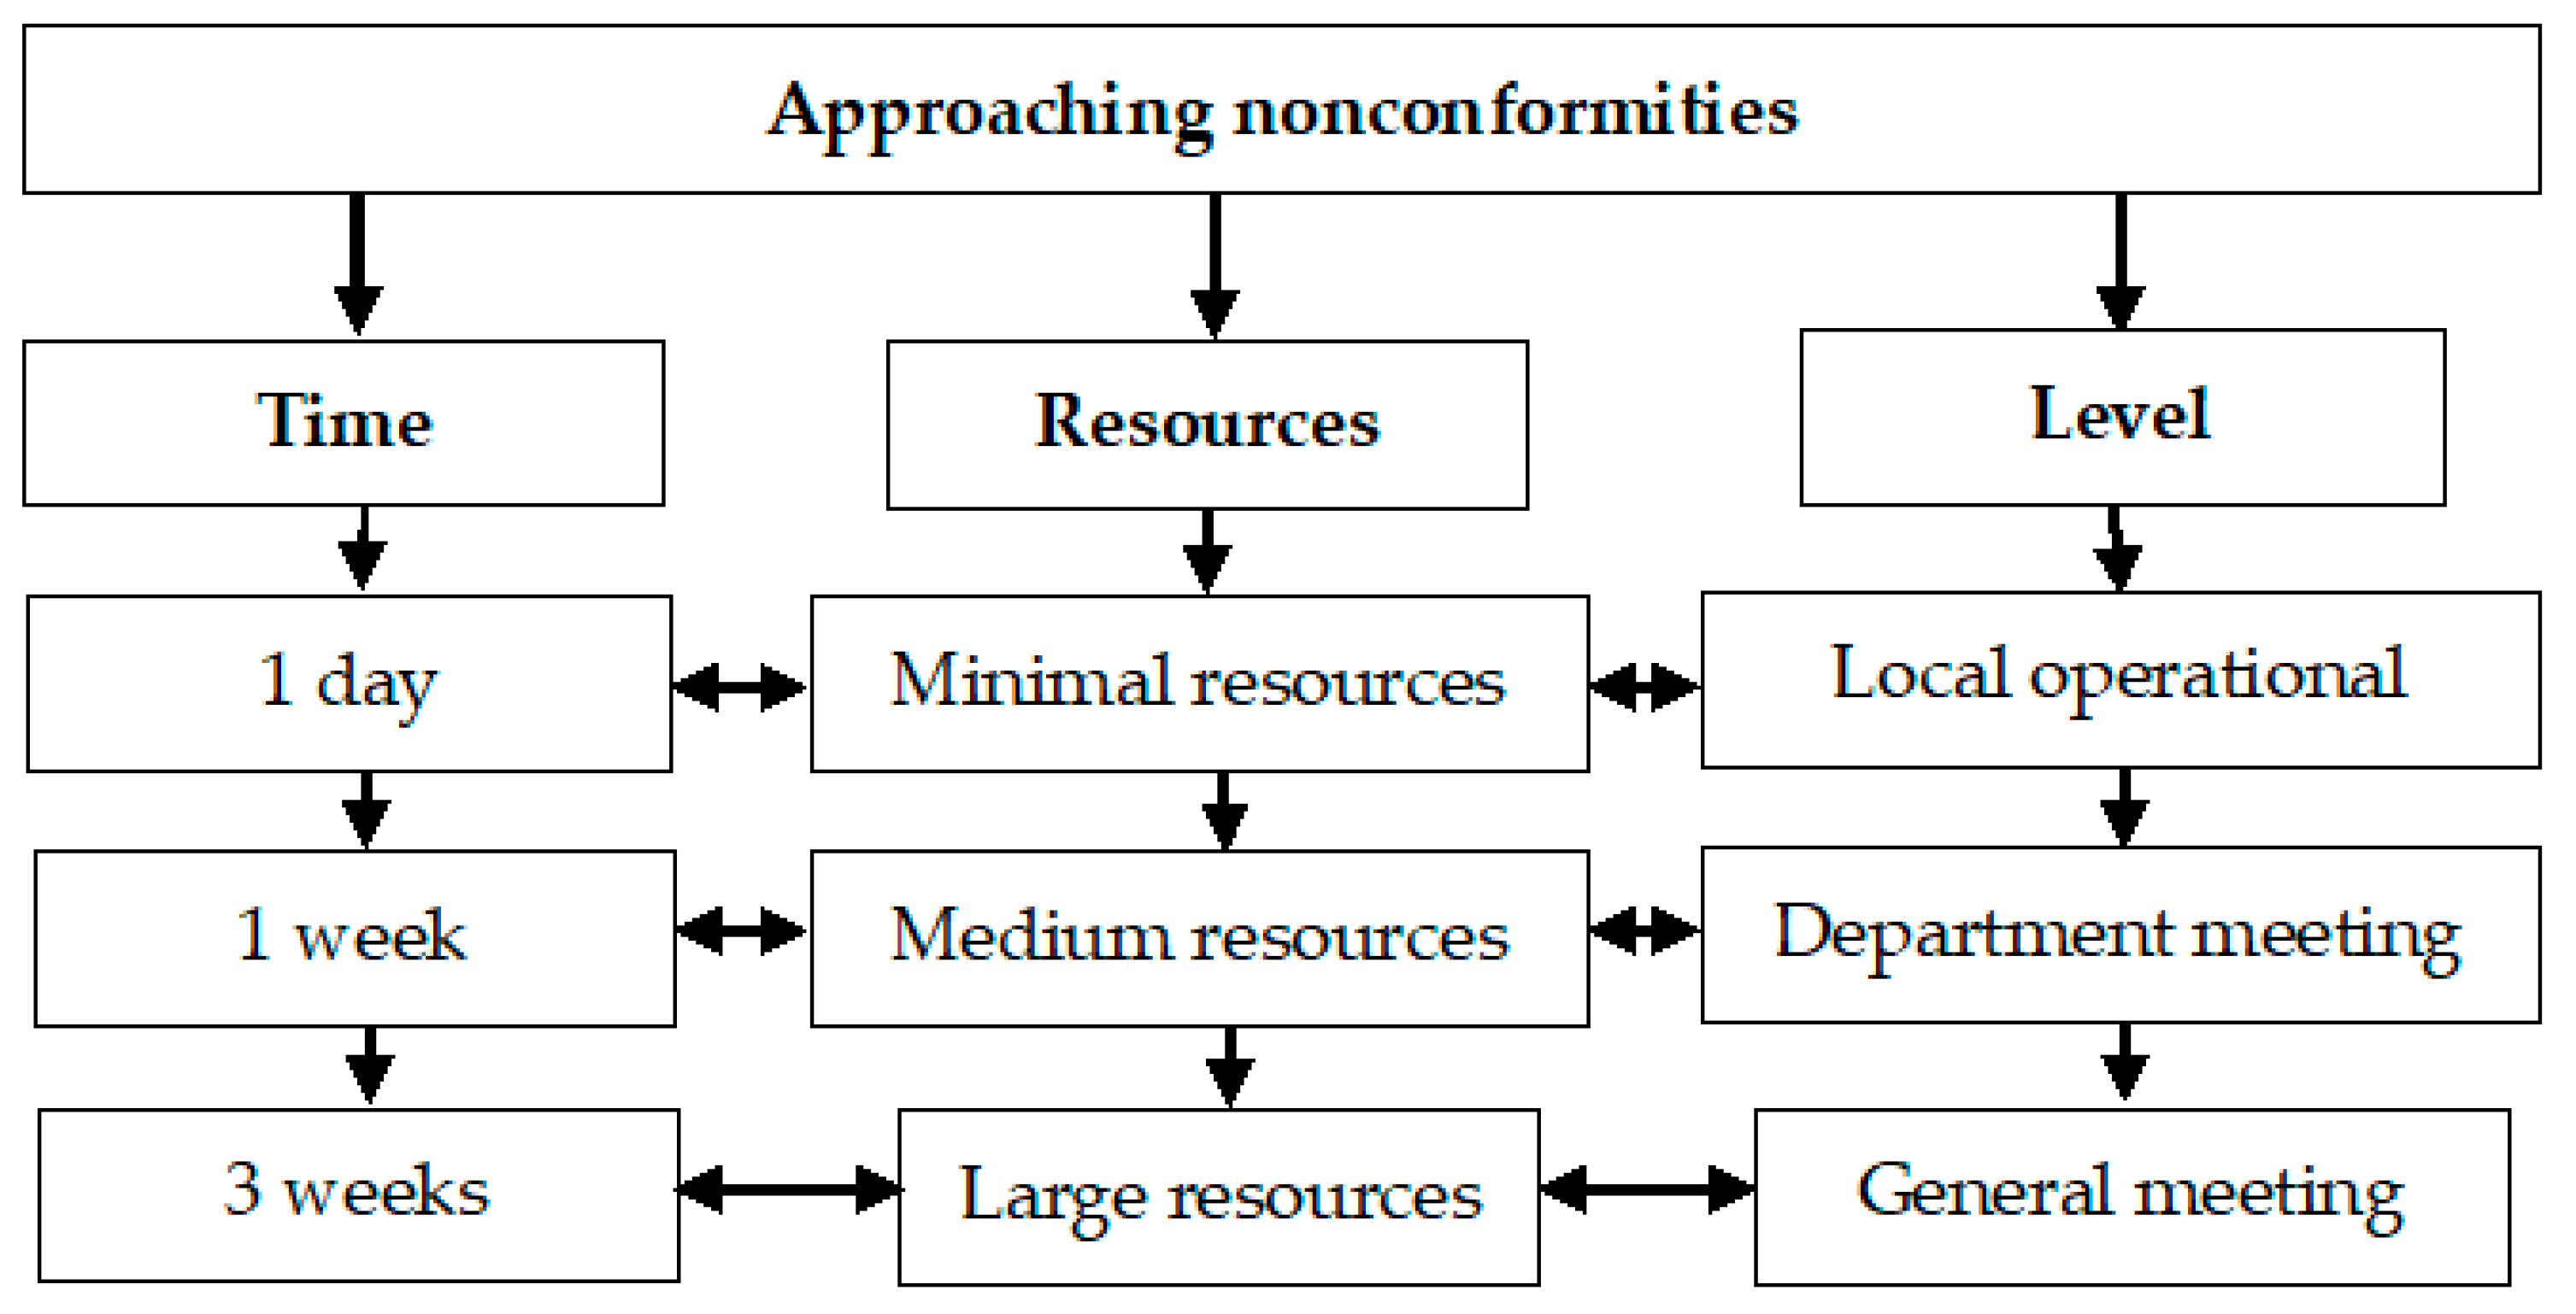
Figure 4 presents the level of non-conformities, the approach taken to address them, and the resources allocated based on the resolution time.
Figure 5 illustrates and highlights the priority level of each category of non-conformities and the corresponding allocation of resources to ensure effective and timely remediation.
Step 5—Description of the Problem Analysis Process
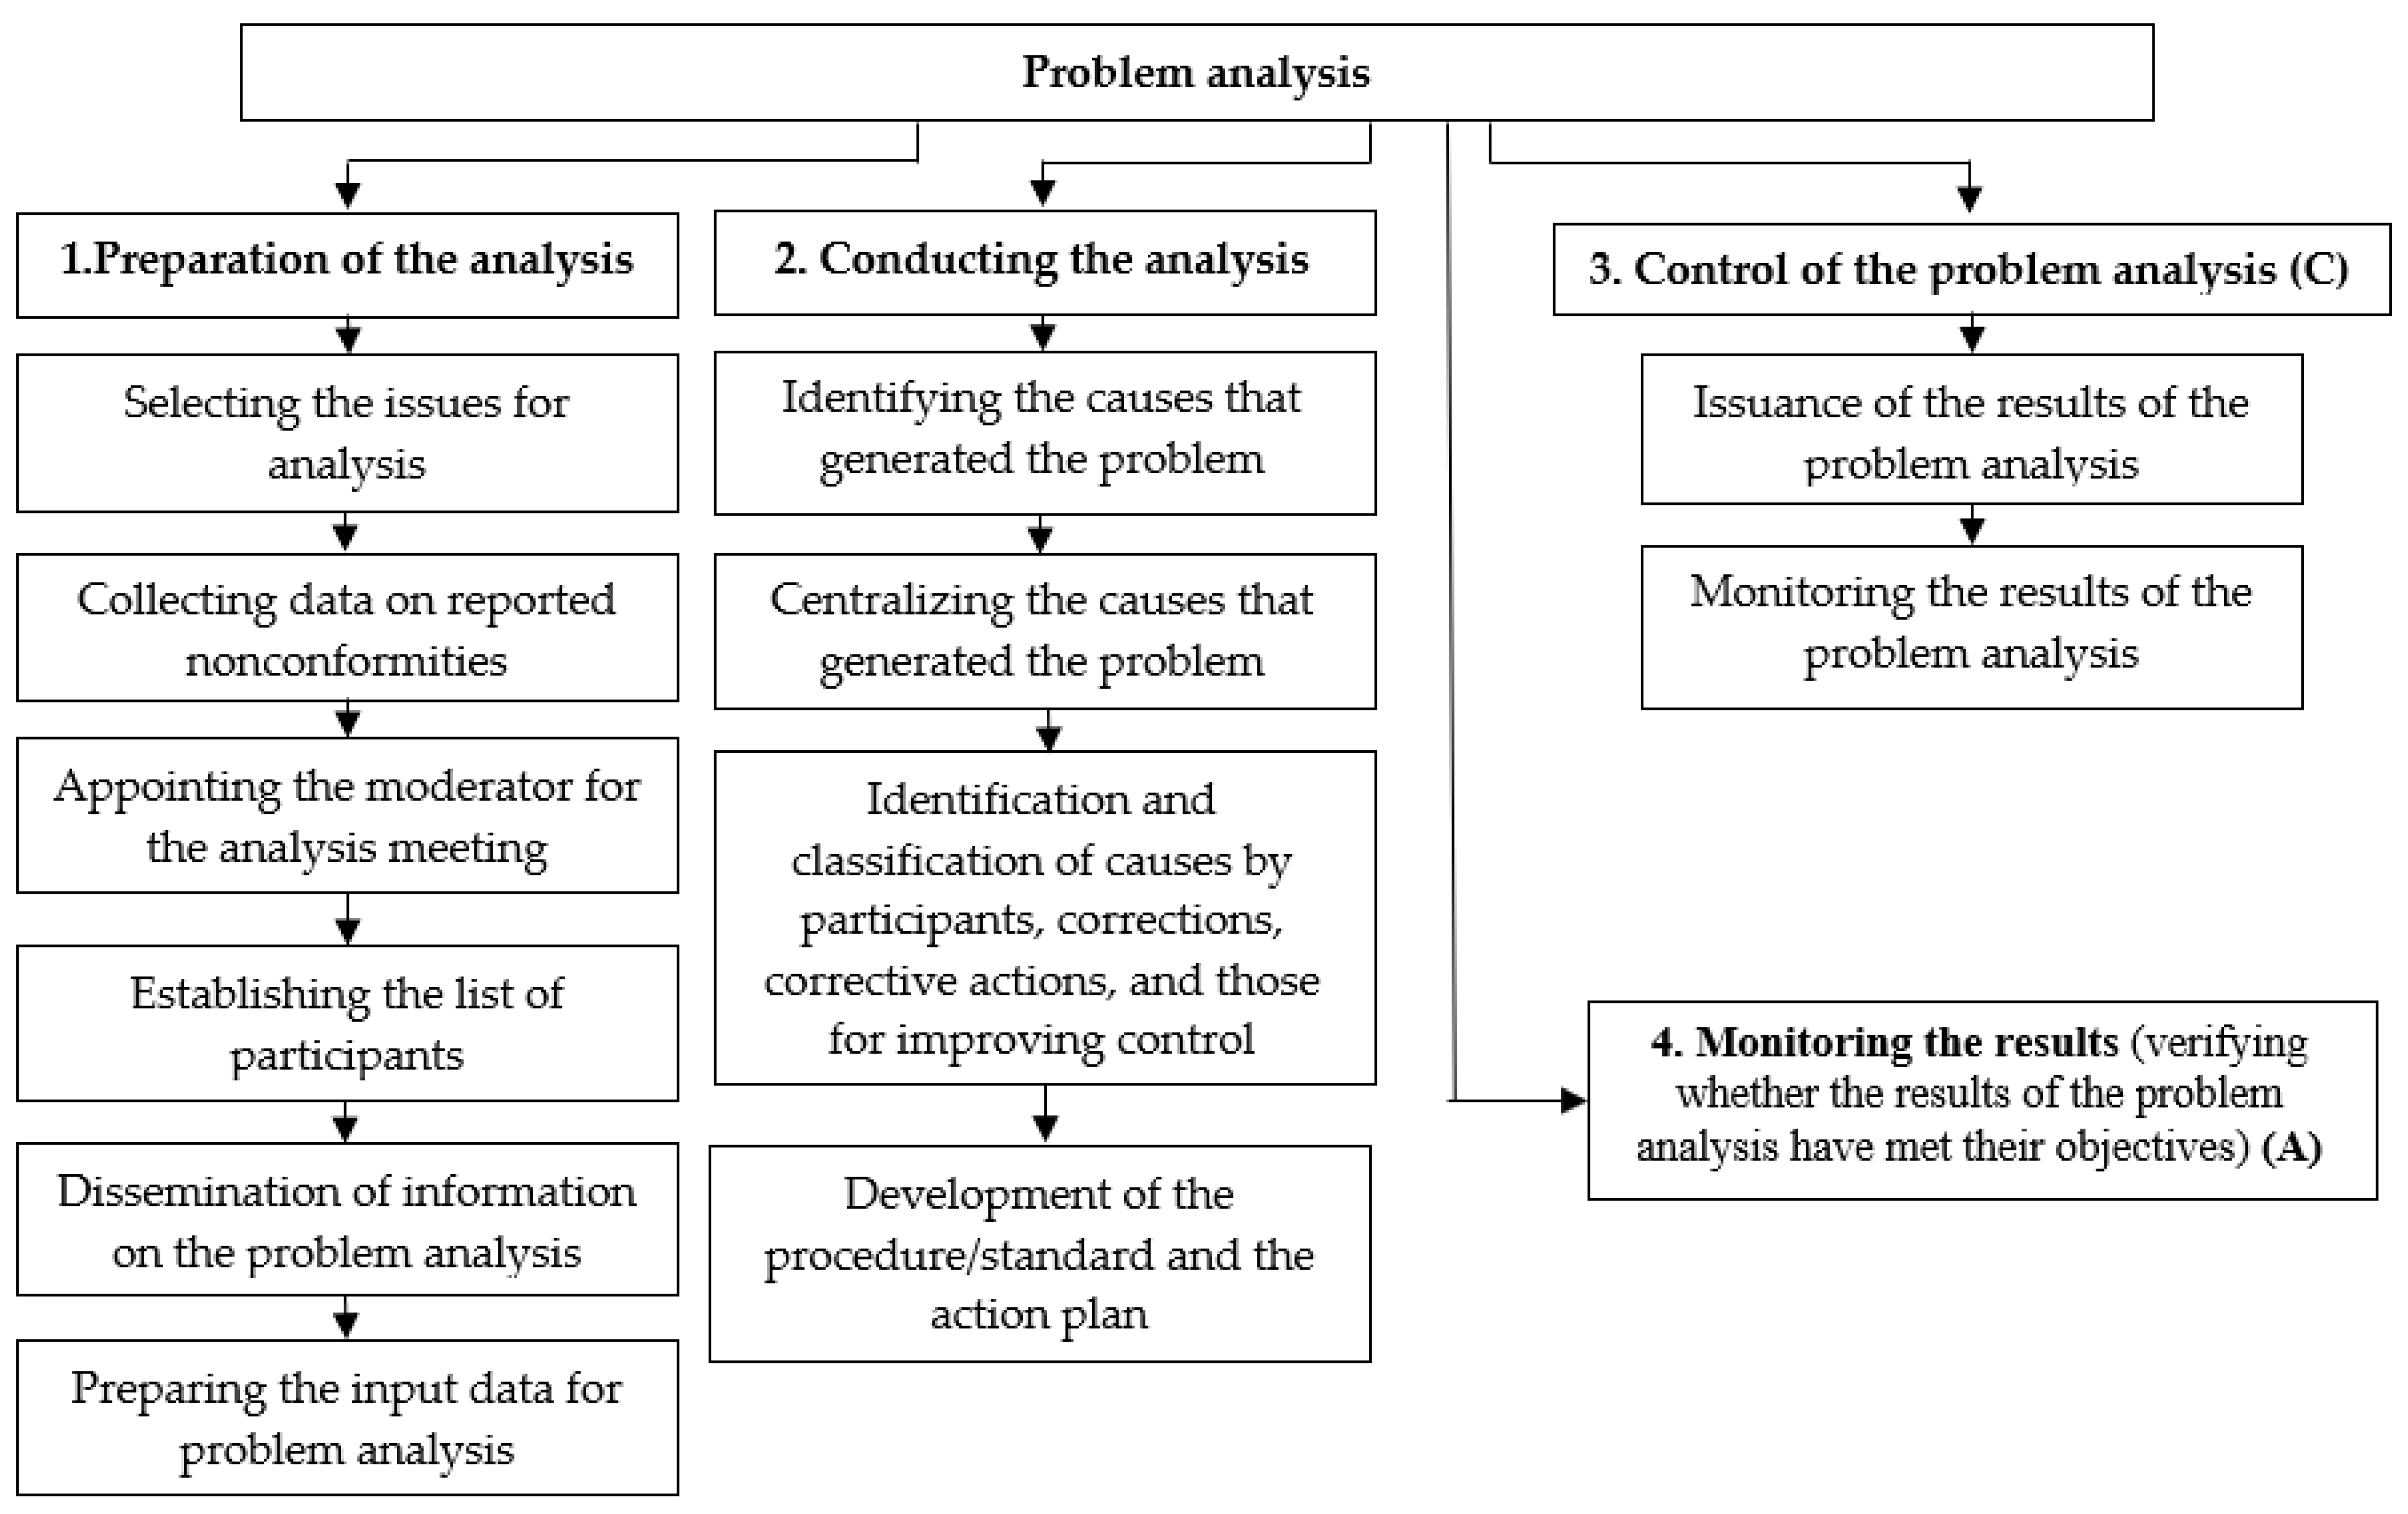
Figure 6 presents the problem analysis process, which involves a series of structured steps:
  • Preparing the analysis by identifying and describing the non-conformity, clearly defining the problem, and collecting and analyzing relevant data;
  • Conducting the analysis, which involves identifying the root causes using tools such as the Ishikawa diagram or the “5 Whys” technique, evaluating associated risks, and developing and implementing an action plan for resolution;
  • Verifying the effectiveness of implemented solutions, standardizing and documenting lessons learned, and establishing a continuous monitoring system to prevent the recurrence of similar problems.
For the preparation of the input data for the problem analysis, the moderator ensures all the necessary conditions for correctly and fully understanding the context in which the non-conformity occurred. The moderator may prepare the necessary data independently or call upon the manager of the area concerned. The moderator will identify all participants in the process on the analysis board. The moderator will prepare statistical data that provide a clearer picture of the non-conformity’s impact.
If the problem involves a non-conforming product, data related to its characteristics, recurrence, batch size, or relevant production info will be prepared.
The moderator will clearly state the identified problem, answering the questions outlined below. They will highlight key words in the problem description.
To make the problem as visible as possible to participants, color images of the identified problem will be prepared (if possible).
The moderator will outline the Ishikawa diagram framework, allocating space for corrections, corrective actions, ideas for improving control, standardization, and the necessary space for developing the PDCA cycle [26].
Step 6—Root Cause Analysis. The problem analysis is carried out by identifying the causes that generated the problem (non-conformity). To analyze the causes that generated the problem, the moderator, after presenting the reported non-conformity to the operators participating in the analysis and highlighting the key words in the statement, will ask the participants to identify the main causes that led to the occurrence of the non-conformity for 5 min.
When identifying the causes by the operators, the moderator will ensure that only concrete, realistic causes are accepted. To encourage the identification of other possible, real causes that have not been mentioned by the participants, the moderator will ask them open-ended questions.
The process continues with the centralization of the causes that generated the problem (non-conformity). The moderator will analyze the potential causes suggested by the participants and will centralize and group them according to the statement and the 5 M’s. They will classify them with the participants based on the points assigned the most probable causes or those with the greatest impact.
After identifying the top three real causes with the highest scores, the moderator, to ensure that these causes have been correctly identified in terms of impact, will discuss them again with the participants on-site based on the key words highlighted in the problem description. To prioritize root causes in a structured and actionable way, the analysis uses a cumulative scoring matrix—a recognized method in quality management. If it is found that there are other causes with greater impact that could have generated the described non-conformity, the moderator may disregard the results of the vote. The selection of only the top three causes is not arbitrary but rather a deliberate decision to ensure focus and prompt resolution, especially in daily operational contexts where quick intervention is essential. The moderator will mark the main causes that generated the non-conformity on the diagram, for which corrections and corrective actions will be sought.
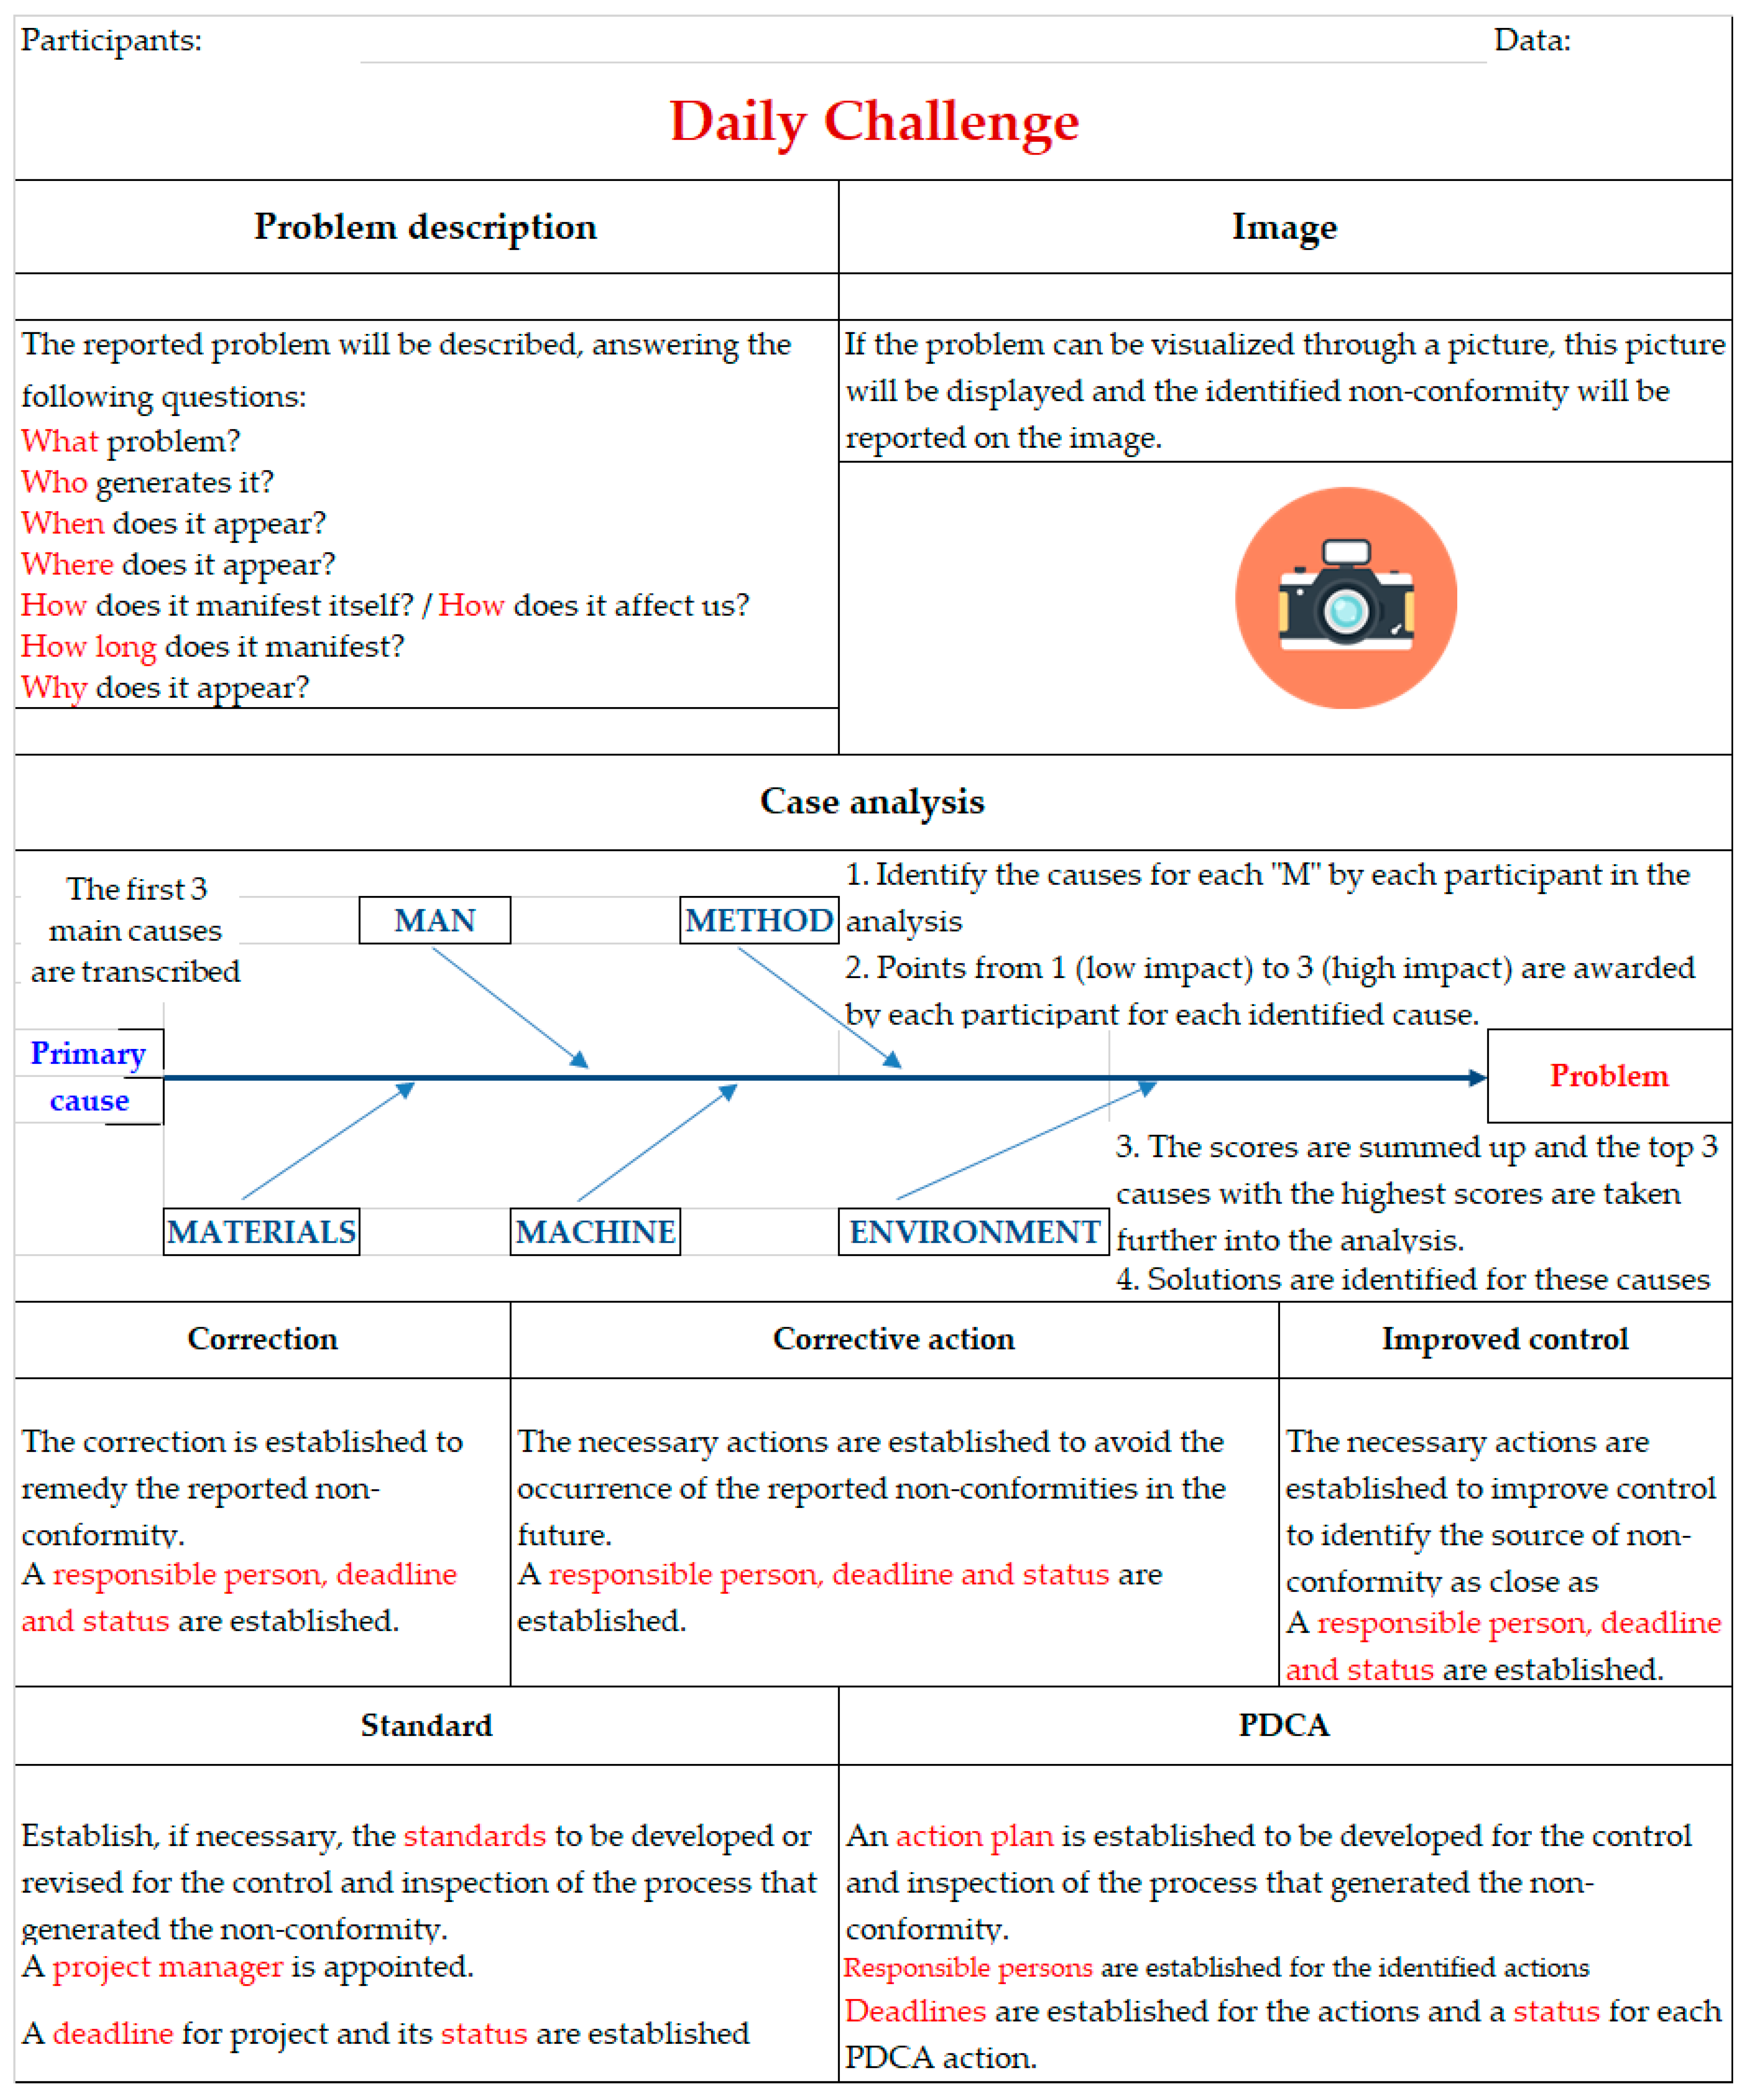
Subsequently, the causes, corrections, corrective actions, and control improvement actions will be established and classified by the participants. The participants will identify the main causes and classify them according to the form presented in Figure 7.
Although the “Daily Challenge” sheet is used uniformly across all types of non-conformities, the classification into material and informational flows provides an analytical foundation for understanding systemic issues and prioritizing improvement efforts at a strategic level.
  • Problem Description. The reported problem will be described in detail, with the aim of clarifying its context and implications through structured responses to a series of essential questions. The description will cover the problem, its cause, when and where it occurs, how it affects operations, how long it lasts, and why it happens.
  • Image. If possible, a relevant annotated image will be included to clarify the non-conformity and enhance understanding.
  • Cause Analysis. Causes will be identified in the “5M” categories, scored by impact, and the top three will be analyzed to find solutions [27]. Each identified cause is assigned a score from 1 (low impact) to 3 (high impact), and the scores are then totaled. The three causes with the highest scores are selected for further detailed analysis, during which specific solutions are identified to address these priority causes.
  • Correction. A corrective measure will be established to eliminate or mitigate the reported non-conformity [28]. In this regard, a directly responsible person is appointed to coordinate the implementation of the corrective measure, ensuring conformance with the established requirements. A clear deadline will be defined, and the progress of the action will be monitored to ensure timely and effective execution.
  • Corrective Action. To avoid recurrence of the non-conformity, precise corrective actions are defined, aimed at eliminating root causes and reducing associated risks. Each action will have an assigned person responsible for its implementation, set deadlines, and the continuous monitoring of its execution [29].
  • Control Improvement. Monitoring and detection measures will be optimized to catch non-conformities closer to their source [30]. These actions aim to reduce the time between the occurrence of the problem and its identification, thereby minimizing its impact on the entire system [31]. Each proposed measure is assigned a designated responsible person, with deadlines established and their effectiveness tracked regularly.
  • Standard. If necessary, internal procedures or standards will be revised or created to ensure stricter control over the process where the non-conformity originated [32]. A project manager will oversee the update or creation process, ensure alignment with requirements, and adhere to a defined timeline.
  • PDCA. An action plan structured around the PDCA (Plan–Do–Check–Act) cycle will be developed. Each action will be assigned to a responsible person, given a deadline, and monitored for status updates. Corrections and improvements will be incorporated into the resulting standard and action plan [33,34].
Simple departmental problems will be addressed internally. Issues requiring broader input will be documented in the central system. The moderator will upload the problem analysis results to a designated server folder and share them via email.
Step 7—Establishment of Corrective Actions and Corrections
For each prioritized cause, clear corrective actions are established, with assigned responsibilities and deadlines. These actions aim to eliminate the causes and prevent the recurrence of the non-conformity.
Step 8—Implementation and Monitoring through the PDCA Cycle
Actions are implemented and continuously monitored, with periodic reviews and necessary adjustments to ensure maximum effectiveness.
Involved departments will be informed of relevant findings. Each department will integrate its assigned actions into its PDCA cycle and track their completion. The moderator will review action progress weekly and visually mark updates for review. Department heads will check unresolved issues weekly, set new deadlines if needed, and report results to management.
Step 9—Reporting and Tracking of Results
Results will be monitored continuously to ensure lasting resolution. Department heads will report outcomes for internally resolved issues. Escalated problems will be followed by moderators or heads of the originating departments, who will present the outcomes to management.

3. Practical Implementation of the Daily Challenge Tool

3.1. Implementation and Validation of the Daily Challenge Tool in the Bottled Water Industry

The industrial process of bottling raw water (spring water and deep well water) was selected to exemplify the use of the Daily Challenge tool. For the water bottling industry, the quality of the water at its source is crucial, making its treatment essential. The type of pretreatment required depends on the water source and its chemical composition. Generally, the removal of microscopic and colloidal particles through coagulation, filtration, pH adjustment (alkalinity reduction), disinfection, and sterilization may all be necessary when the supplied water is of poor quality.
The study was conducted within a medium-sized facility for producing bottled spring water located in Alba County, Romania. The company operates with approximately 50 employees and specializes in the spring water intake, treatment, bottling, and distribution of natural spring water.
The objectives of the case studies are as follows:
  • To analyze a real-world non-conformity incident within a spring water bottling process, identifying its root causes and operational impact.
  • To apply and evaluate the effectiveness of the Daily Challenge tool in addressing and preventing such incidents.
  • To compare the outcomes of the Daily Challenge tool implementation with traditional quality management approaches, highlighting improvements in response time, conformance, and overall efficiency.
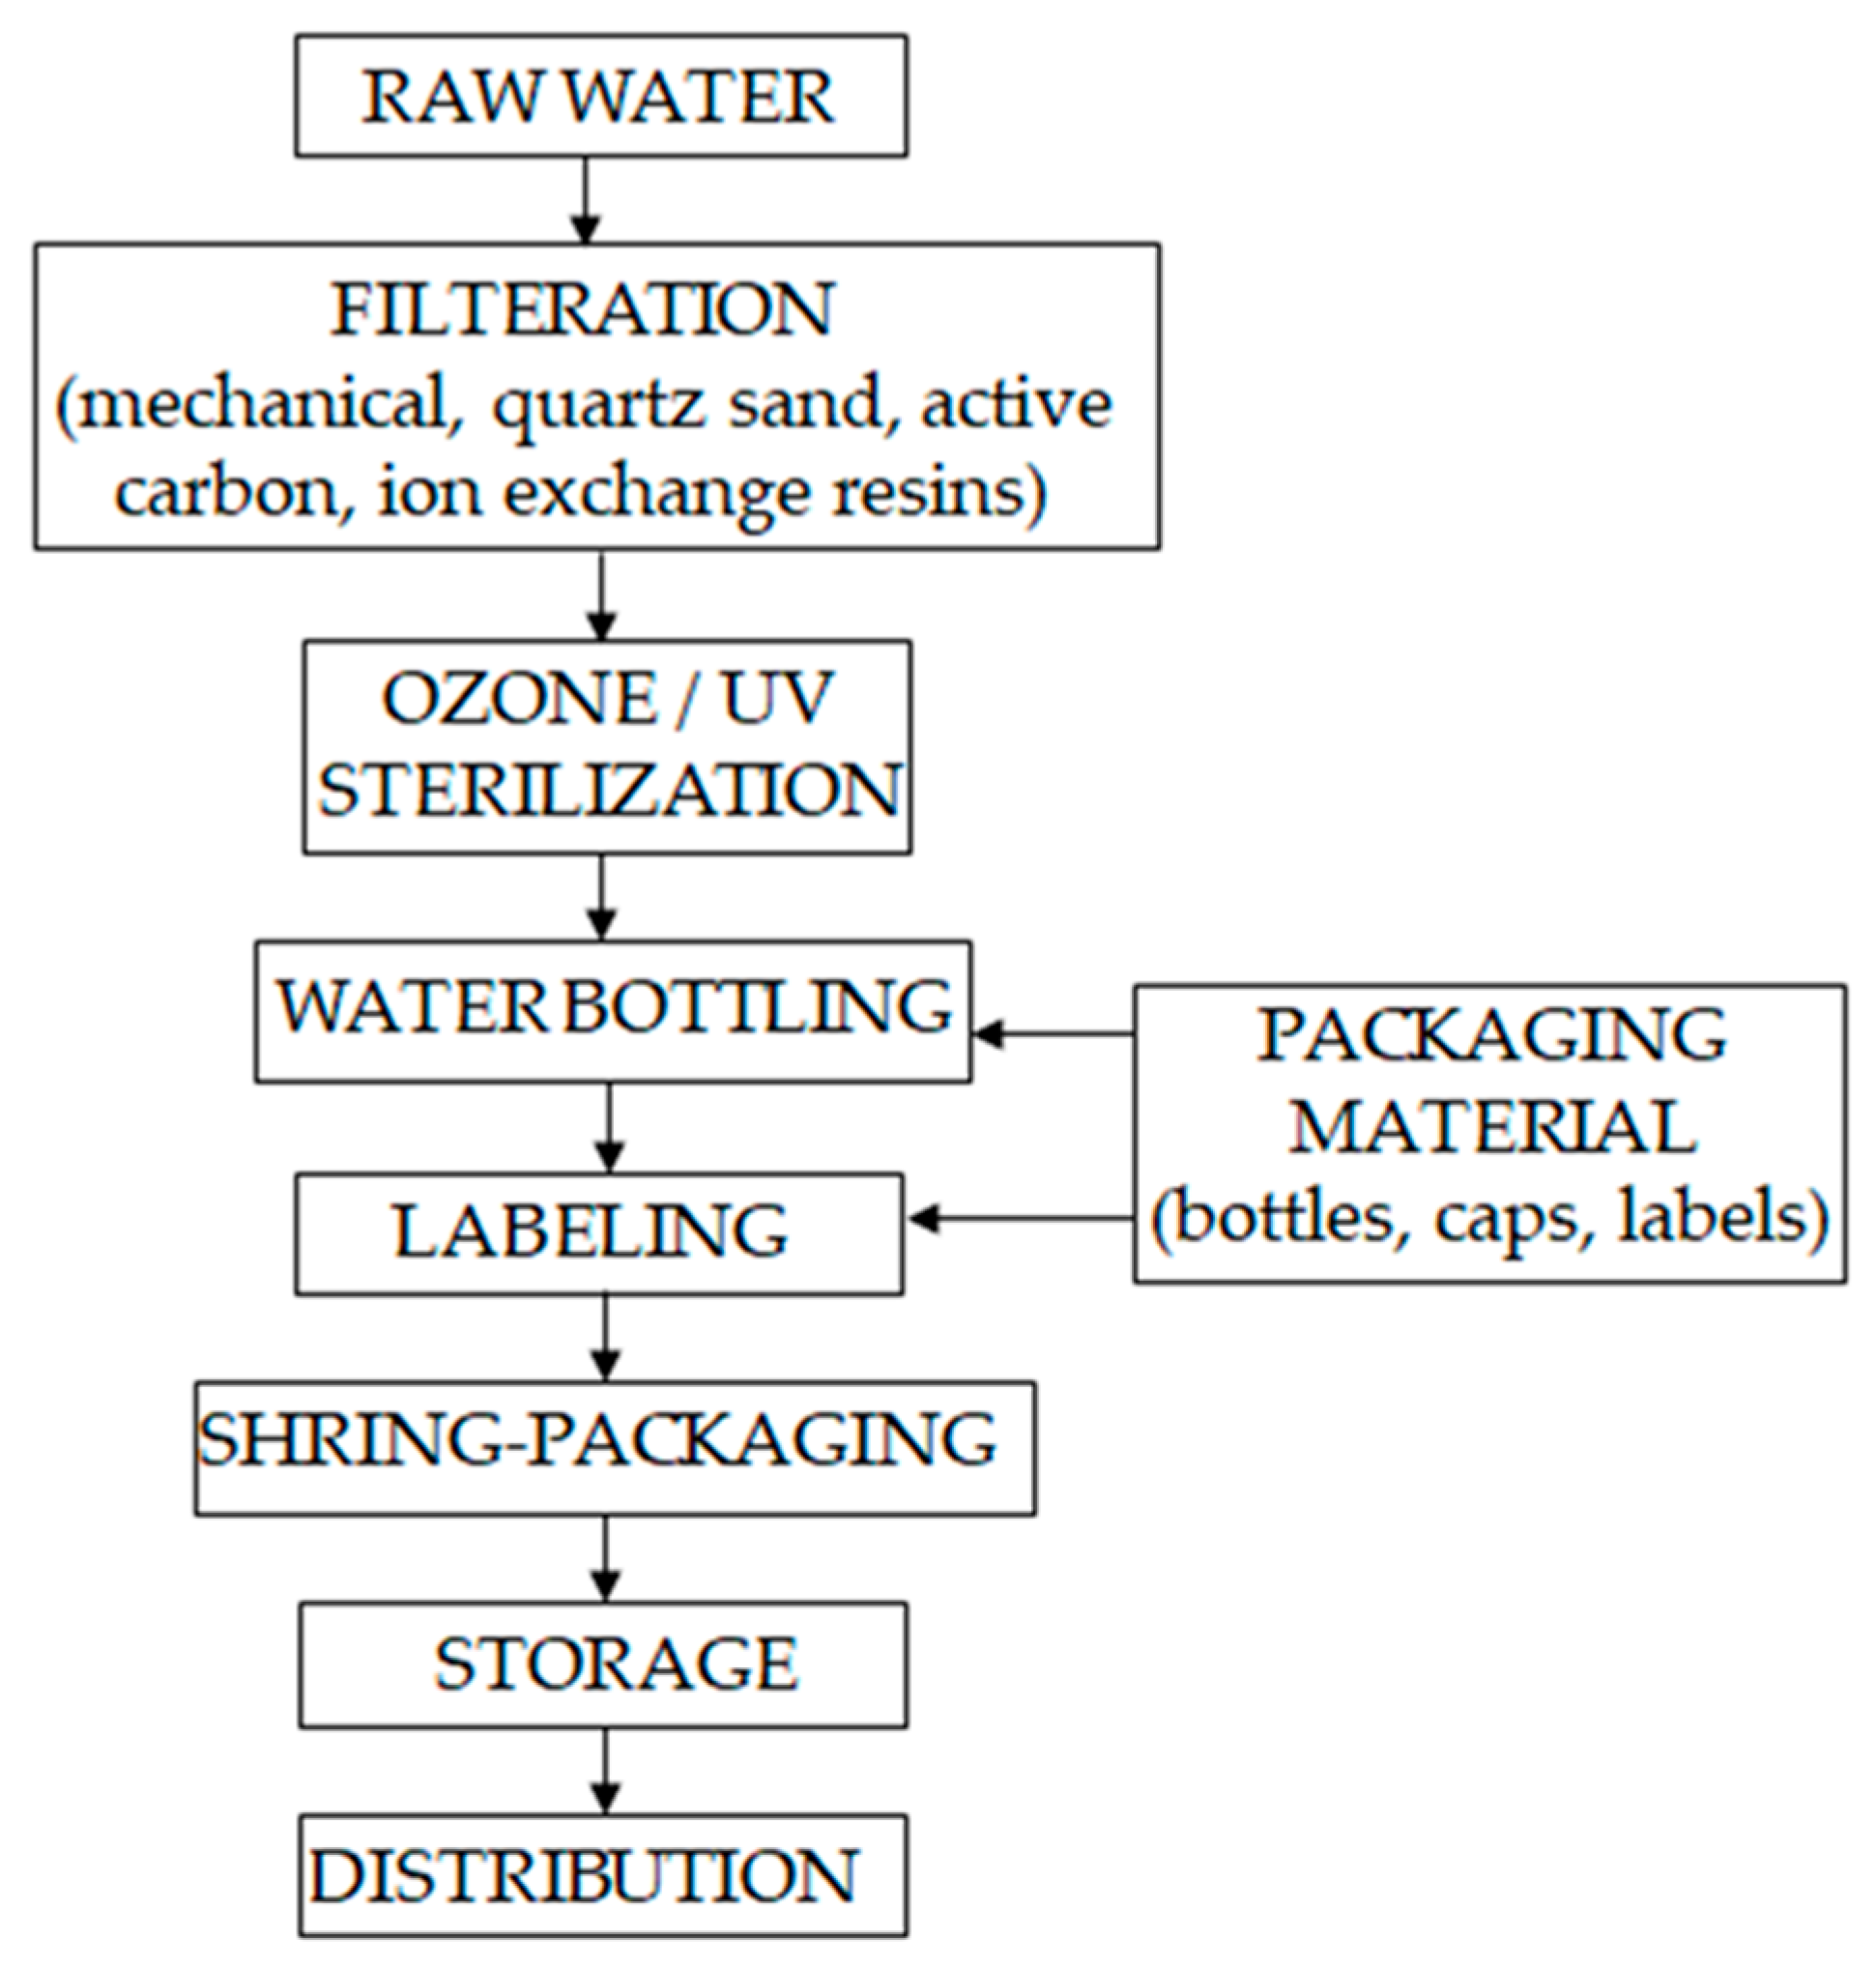
In Figure 8, the technological flowchart of the water bottling process is presented.
The case studies present two non-conformities identified in the technological process of bottled water production, along with the method used to resolve them through the application of the “Daily Challenge” sheet.

3.2. Case Study 1: Labeling Non-Conformity—Missing Net Quantity on Product Label

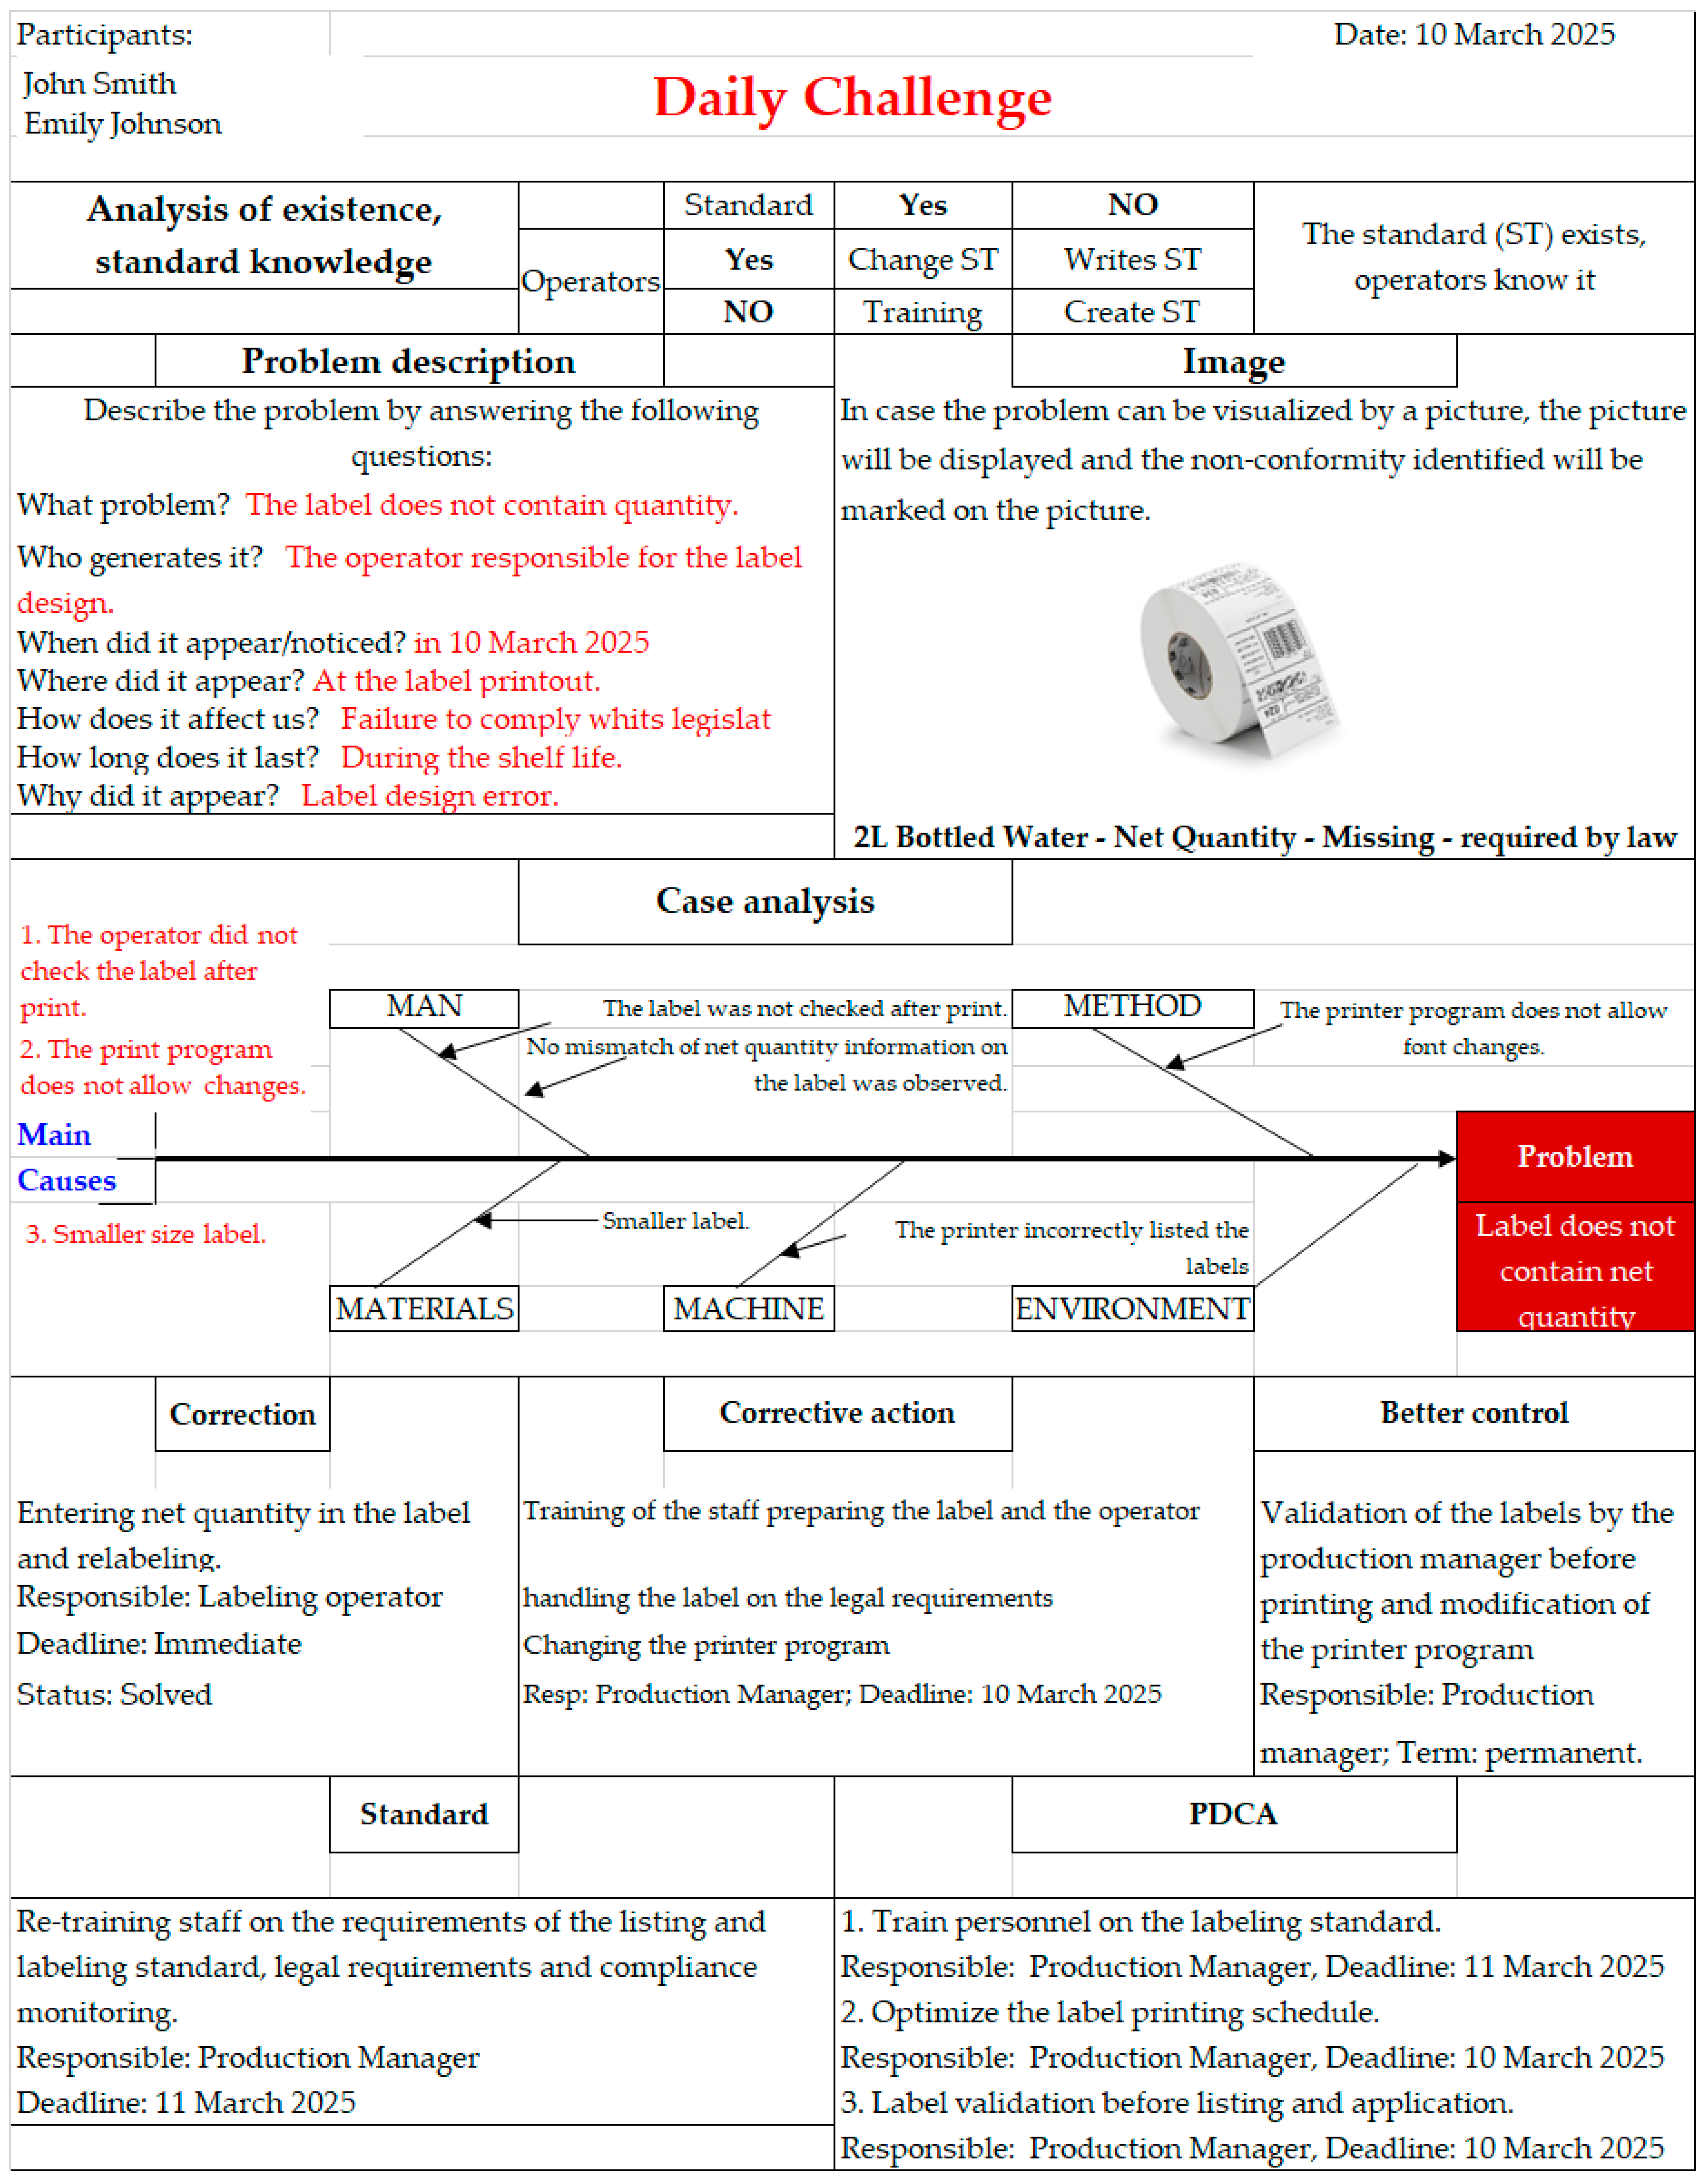
Figure 9 shows the labeling non-conformity from Case Study 1, where the net quantity information is missing on the 2 L bottled water label.
The “Daily Challenge” sheet documents an issue related to product labeling—specifically, the absence of quantity information on the label. Following the detailed analysis of the labeling non-conformity, a potential financial impact of up to EUR 5000 was estimated if corrective actions are not implemented. The identified issue constitutes a breach of internal company standard and EU Regulation 1169/2011 on consumer information, necessitating urgent updates to internal procedures. The Production Manager is responsible for overseeing the implementation of corrective measures and training programs, with an internal audit scheduled for 10 April 2025, and weekly progress reports for one month post-implementation. A key lesson learned is the need to implement a dual verification process for labels before application, as well as to organize regular training sessions for staff in accordance with legal requirements and internal standards.
The problem was caused by the operator responsible for applying the labels and was noticed during the labeling process. The document indicates that a standard for this operation exists and is known, but still, a correction was necessary. Proposed measures include changing or creating a new standard and training the personnel. Where possible, the issue is also illustrated with images.
The analyzed problem consists of the missing quantity indication on the product label, a deviation that was detected on 10 March 2025 during the label printing process. It was caused by the operator responsible for label design and affects the product’s compliance with current legislation.
At the materials level, no discrepancies were observed in the quantity information on the label, but the smaller size of the label indirectly contributed to the omission. From the Machine perspective, it was found that the printer does not allow font modifications and also incorrectly printed the labels, which contributed to the misrepresentation of information. Regarding Method, there is no clear procedural step for verifying the label after printing, which led to the undetected omission of the quantity. The Environment category did not directly influence the occurrence of this issue. In terms of Manpower, the direct responsibility falls on the operator who designed the label and failed to check the accuracy of the information before printing.
In conclusion, the main cause was a label design error combined with equipment limitations, the absence of a post-printing verification step, and incomplete training regarding the control procedures. Corrective actions are necessary to review the label creation and validation process, as well as to update the printing software where possible.

3.3. Case Study 2: Production Downtime Management—Equipment and Sensor Failure

To further validate the applicability and robustness of the proposed Daily Challenge tool, a second, more complex case study is presented. On 15 May 2025, Assembly Line 3 experienced a complete production halt for 5 h due to the simultaneous failure of a conveyor motor and a malfunctioning proximity sensor. The root cause was a mechanical overload in the conveyor motor that went undetected because of inaccurate readings from the sensor. This incident, which occurred in the final assembly zone, resulted in a delay of approximately 250 units and posed a significant risk of noncompliance with client delivery schedules.
1. Problem Description:
  • What is the problem? Production line 3 experienced a complete halt for 5 h.
  • What generated it? Preliminary observations suggested a failure in the conveyor motor; subsequent analysis identified that the motor overload went undetected due to incorrect sensor calibration and insufficient preventive maintenance.
  • When did it appear? 15 March 2025.
  • Where did it occur? Line 3, final assembly zone.
  • How does it affect us? There is a production delay, resulting in 250 units not being delivered on time, which poses a risk of penalties for late delivery.
  • How long did it last? 5 h.
  • Why did it appear? The root cause analysis indicated a mechanical overload, which went undetected due to inaccurate proximity sensor readings. Further investigation identified the incorrect operation of the proximity sensor due to inadequate staff verification.
2. Cause Analysis:
  • A root cause analysis identified several contributing factors:
  • Manpower: There was an omission of weekly maintenance checklist verification.
  • Method: The maintenance procedure does not contain detailed instructions on sensor calibration and check points. The maintenance procedure lacks an automated early warning system for abnormal sensor values.
  • Material: A sensor model with an inadequate protection class for the existing dust conditions was used; there was a lack of an additional protective filter.
  • Machine: Mechanical overload of the conveyor motor. The sensor was not correctly calibrated.
  • Environment: Dust accumulation affected sensor readings.
3. Corrective and Preventive Actions
  • Immediate corrective actions included the following:
-
Repair of the conveyor motor;
-
Recalibration of the proximity sensor;
-
Updating the maintenance procedure with detailed instructions and verification points;
-
Implementation of a targeted training program on sensor calibration and equipment diagnostics;
-
Integration of a real-time monitoring alert system in the PLC software to detect abnormal current and sensor drift.
-
Revision of the hygiene procedure regarding the frequency and mode of cleaning and worker training.
As part of the preventive strategy, a predictive maintenance protocol was introduced, employing vibration analysis and thermal monitoring to anticipate future failures.
From an economic perspective, the integration of the real-time monitoring alert system was justified by a cost–benefit analysis: the one-time software integration (EUR 1200) and staff training (EUR 800) were outweighed by the monthly reduction in downtime-related losses (~EUR 1500), making the solution cost-effective. Standardization and PDCA Implementation.
4. The standard operating procedure (SOP) was revised to include mandatory validation steps and weekly equipment condition reporting. The PDCA (Plan–Do–Check–Act) cycle was employed as follows:
Plan: Maintenance task scheduling dashboard and updated SOPs.
Do: Implementation of real-time alerts and staff training.
Check: Weekly review of maintenance logs and KPIs.
Act: Adjustment of schedules and escalation mechanisms based on performance data.
5. Quantitative Impact Indicators
Although a basic quality management approach was in place, it lacked structured data integration, standardized root cause analysis, and systematic corrective–preventive tracking. Table 2 illustrates the improvements achieved through the structured implementation of the Daily Challenge tool. The following indicators were used to evaluate the effectiveness of the Daily Challenge tool implementation, as presented in Table 2.
These results demonstrate significant improvements in operational efficiency, conformance, and cost reduction. The case also highlights the system’s flexibility in handling more complex, multi-causal non-conformities across technical and human dimensions.
The total estimated implementation cost of the Daily Challenge tool (including documentation standardization, staff training, and software updates) was approximately EUR 7200. This investment is recouped within 4 months through reduced maintenance costs and the elimination of delay penalties.
The impact of the production line stoppage was significant, causing delays in the delivery of approximately 250 units and exposing the company to considerable financial risks, including contractual penalties. Estimated losses due to downtime and delays exceed EUR 7500 per day of interruption, and in the long term, recurring incidents of this nature could negatively affect the company’s reputation and client relationships.
The corrective and preventive actions implemented comply with internal maintenance standards as well as ISO 9001 [34] quality management and preventive maintenance requirements. It is recommended to update internal procedures with detailed instructions for sensor calibration and to integrate real-time monitoring systems according to the latest technical standards.
The Production Manager is responsible for overseeing the implementation of these actions and will monitor progress through weekly reports and quarterly audits. This process ensures the effectiveness of the measures taken and allows prompt adjustments should new deviations arise.
Lessons learned from this incident highlight the necessity for an automated warning system and clear maintenance procedures to avoid unnoticed equipment failures. It is recommended to implement an integrated real-time monitoring system, conduct regular technical staff training, and continuously review maintenance procedures to prevent similar issues in the future.
The case study validates the Daily Challenge tool as a robust and adaptable methodology capable of handling complex, multi-causal equipment failures in a production environment. By integrating thorough root cause analysis, structured corrective actions, and continuous monitoring via PDCA, operational efficiency and compliance were significantly improved.

4. Discussion

4.1. Advantages and Outcomes of Implementing the Daily Challenge Tool

Compared to traditional non-conformance management systems, which are often reactive and departmentally isolated, the Daily Challenge tool brings a holistic and proactive approach. Its daily operational tool—the “Daily Challenge” sheet—encourages issue identification and collaborative decision-making. Unlike fragmented corrective models, the Daily Challenge tool fosters traceability, accountability, and continuous improvement across all departments. This integration ensures faster reactions, better root cause analysis, and stronger corrective actions.
The advantages of using an integrated system for analyzing, correcting, and preventing non-conformities in material and information flows are numerous, with significant impact on the efficiency, quality, and performance of the organization.
For example, following a three-month pilot implementation of the Daily Challenge tool in a bottled water production unit, the average response time to detected non-conformities decreased by approximately 35%, while the recurrence rate of issues was reduced by 20% compared to the previous corrective process based solely on quality reports.
In the context of the steps described and the use of the “Daily Challenge” sheet, the following advantages can be identified:
  • Rapid problem identification: Enabled by department meetings and structured reporting, issues are detected and addressed promptly.
  • Clarity and transparency: The “Daily Challenge” sheet ensures detailed issue descriptions, supporting shared understanding and interdepartmental collaboration.
  • Cause analysis and prioritization: Tools like the Fishbone diagram and a scoring system highlight root causes and help focus resources on critical issues.
  • Efficient correction: Clearly defined corrective actions, with deadlines and responsibilities, support swift resolution and prevent recurrence.
  • Prevention and continuous improvement: Corrective actions, improved controls, and the PDCA (Plan–Do–Check–Act) cycle create a framework for reducing repeated issues and fostering ongoing improvement.
  • Clear accountability: Responsibility is assigned for each action, and progress is tracked, enhancing ownership and project follow-through.
  • Improved process control: Root cause analysis informs new monitoring actions, improving efficiency and reducing operational risk.
  • Standardization and consistency: Revised or new procedures ensure uniformity in addressing issues and maintaining conformance.
On the other hand, implementing the Daily Challenge tool, as described, led to several outcomes that enhance organizational efficiency and quality. Below are the key outcomes:
  • Improved Problem Detection and Resolution
    -
    Faster Identification: Problems are quickly detected via tools like the “Daily Challenge” form and regular department meetings.
    -
    Structured Resolution: Root cause analysis and tailored corrective actions ensure effective solutions.
    -
    Continuous Monitoring: Ongoing tracking ensures lasting resolution and effectiveness.
  • Increased Efficiency in Process Management
    -
    Streamlined Workflow: The integration of material and informational flows ensures smooth coordination between departments, reducing delays and improving decision-making.
    -
    Resource Optimization: By identifying the most critical causes and addressing them first, resources are allocated where they are most needed, avoiding inefficiencies.
  • Enhanced Quality Control
    -
    Reduced Non-Conformities: Identifying root causes and preventing future occurrences, the number of non-conformities decreases.
    -
    Prevention-Based Approach: The system emphasizes corrective actions, addressing the underlying causes. This leads to more effective and lasting preventive measures.
  • Increased Accountability and Transparency
    -
    Clear Responsibility Assignments: Every action, from problem identification to corrective measures, is assigned to specific individuals or teams.
    -
    Status Tracking: Action statuses are visible, ensuring follow-through.
  • Enhanced Communication and Collaboration
    -
    Cross-Departmental Collaboration: Departments work together on problem solving.
    -
    Clear Communication Channels: Regular meetings and comprehensive documentation facilitate communication at all levels of the organization.
  • Continuous Improvement Culture
    -
    Feedback Loops: PDCA cycles ensure iterative refinement.
    -
    Standardization and Best Practices: The system encourages the creation and revision of standards based on lessons learned.
  • Better Risk Management
    -
    Proactive Issue Prevention: By preventing recurring non-conformities through analysis and corrective actions, the system helps mitigate potential risks to the business.
    -
    Timely Interventions: By ensuring that all issues are addressed before they escalate, the system reduces the likelihood of high-impact problems emerging.
  • Conformance and Regulatory Assurance
    -
    Consistent Monitoring and Documentation: Recording and tracking issues ensures that the organization maintains conformance with internal standards and external regulations.
    -
    Audit Readiness: Records of identified problems, corrective actions, and improvements ensure that the organization is prepared for audits or inspections.
  • Cost Reduction
    -
    Fewer Defects and Rework: The reduction in non-conformities and more efficient problem solving reduces costs related to defective products, rework, and returns.
    -
    Resource Efficiency: By focusing on critical issues and optimizing workflows, the system reduces waste in time, labor, and materials.
  • Customer Satisfaction and Loyalty
    -
    Improved Product and Service Quality: With fewer defects and issues, customer satisfaction is improved.
    -
    Proactive Customer Issue Handling: The better handling of customer complaints and feedback leads to a more responsive customer service process and increased customer loyalty.
  • Innovation and Knowledge Sharing
    -
    Root Cause Analysis and Solutions: Insights from problem solving build institutional knowledge.
    -
    Improved Decision-Making: Data-driven approaches improve strategy and innovation.
  • Stronger Organizational Culture
    -
    Empowerment of Employees: Employees at all levels are involved in identifying and solving problems, which boosts engagement and ownership.
    -
    Collaboration Across Hierarchies: Encouraging team involvement helps flatten organizational silos and fosters a culture of mutual support.
In summary, the Daily Challenge tool provides a structured, data-driven alternative to existing systems that rely on isolated quality control practices. While many organizations still use static corrective forms or irregular audits, the Daily Challenge tool integrates cross-functional input daily, supports timely detection, and links actions directly to measurable outcomes. Its use leads not only to improved process control and regulatory conformance but also to organizational learning and engagement.
The implementation of the Daily Challenge tool leads to significant improvements in efficiency, quality, risk management, and customer satisfaction.

4.2. Positioning Against Traditional Quality Management Approaches

To effectively manage and resolve non-conformities in production, companies rely on structured problem solving and quality management methodologies. Widely used approaches include the Six Sigma philosophy [35], particularly through the DMAIC framework (Define, Measure, Analyze, Improve, Control) [36], which enables the systematic identification and elimination of defects. Other methods, such as the Deming or PDCA cycle (Plan, Do, Check, Act) [37,38], emphasize iterative process improvement and corrective action. Additionally, techniques like the 8D method [39] provide a step-by-step structure specifically aimed at analyzing and eliminating non-conformities, including root cause analysis, corrective actions, and preventive measures. Process Flow Charting (PFC) [40] also contributes by visually mapping workflows, helping to identify deviations and inefficiencies.
The Daily Challenge tool builds upon and extends prior research efforts aimed at improving quality and non-conformance management in organizations. For instance, the classical approaches such as the Six Sigma and Lean methodologies have been widely applied to reduce defects and streamline processes [41,42,43]. While these methods emphasize statistical analysis and waste elimination, their implementation often requires significant training and long-term projects, which can delay immediate problem resolution in daily operations.
Other studies have proposed frameworks focusing on root cause analysis and corrective actions, such as the PDCA cycle and Fishbone diagrams [44,45], which have proven effective for systematic problem solving. However, these tools are frequently used in isolation, lacking integration into a unified system that supports continuous monitoring and cross-departmental collaboration.
In contrast, the Daily Challenge tool offers a balanced approach by combining proven quality management tools with a user-friendly, integrated platform that fits into existing organizational workflows without extensive resource demands. It prioritizes daily operational engagement through mechanisms such as the “Daily Challenge” sheet and regular interdisciplinary meetings, which enhance transparency and accountability across teams.
Moreover, unlike many existing models that emphasize either strategic-level quality planning or isolated corrective actions, the Daily Challenge tool uniquely integrates identification, analysis, correction, and prevention into a continuous, action-oriented cycle. By situating Daily Challenge tool within this landscape of methodologies, it becomes evident that the system not only leverages established best practices but also innovates by fostering a collaborative culture and emphasizing responsiveness, ultimately contributing to more effective non-conformance management and continuous improvement.
To better highlight the added value and originality of the Daily Challenge tool, a comparison with established quality management frameworks—such as Six Sigma, ISO 9001, and Total Quality Management (TQM)—is provided in Table 3. This comparison underscores the distinctive features and practical advantages of the INCMS approach in managing non-conformities.
The Daily Challenge tool approach integrates well-established tools such as the PDCA cycle and Ishikawa diagrams—commonly employed in Six Sigma and ISO 9001 frameworks—into a unified, daily operational system. While Six Sigma specialized training often focuses on statistically driven, expert-led projects, the Daily Challenge tool emphasizes ease of use and cross-departmental collaboration for immediate, prompt, and structured issue resolution across all levels of an organization.
Unlike ISO 9001, which provides a formalized, standards-based framework for managing non-conformities and corrective actions, the Daily Challenge tool offers a practical, hands-on toolset that complements existing quality management systems by enabling faster problem identification and resolution during routine operations. Therefore, the Daily Challenge tool is not positioned as a replacement but as a complementary, accessible, and agile methodology that fills a gap between complex continuous improvement methodologies and day-to-day operational challenges.
While this theoretical comparison highlights the tool’s unique features, the following section presents empirical validation through two real-world case studies, further demonstrating its impact and practicality.

4.3. Empirical Validation of the Tool’s Impact

To substantiate the practical value of the Daily Challenge tool, two real-life case studies were conducted in a manufacturing environment. These illustrate how the tool enables both rapid response to simple quality deviations and the effective handling of complex, multi-causal production issues. A summary of each case along with its key implications is presented below.
In Case Study 1, related to labeling non-conformity and legal compliance, the issue was identified by the operator during production and resolved within the same working day. The Daily Challenge sheet enabled a structured diagnosis using a simplified 5W1H approach combined with Ishikawa analysis, revealing key causes such as operator oversight, limitations of the printer software, and the absence of a post-printing verification step.
Key results included a resolution time of less than 24 h, 100% training coverage of labeling staff, elimination of compliance risk before product release, and minimal integration effort without the need for external resources.
In contrast to traditional approaches such as ISO 9001 (Corrective and Preventive Actions) or the 8D method—which typically involve formal documentation and longer response times—this tool facilitated immediate resolution as part of the daily operational workflow.
In Case Study 2—related to equipment failure and downtime prevention, the Daily Challenge tool was employed to systematically analyze and resolve the issue through cross-functional collaboration.
The structured approach enabled a comprehensive root cause analysis—addressing human, technical, and procedural factors—and led to the implementation of targeted corrective and preventive actions.
The key outcomes included a 59% reduction in equipment downtime, the elimination of delivery delays, and cost savings exceeding EUR 1500 per month, demonstrating both the operational and economic impact of the tool.
Unlike conventional maintenance response systems that often rely on reactive measures, the Daily Challenge tool integrated regular monitoring, predictive maintenance strategies, and continuous improvement cycles directly into the daily workflow.
Table 4 synthesizes the corrective and preventive actions implemented in both case studies, highlighting the tool’s versatility in addressing both procedural and technical non-conformities through structured, real-time responses.
These empirical examples demonstrate that the Daily Challenge tool effectively scales from minor compliance deviations to complex technical failures, outperforms traditional tools in terms of speed, accessibility, and integration, enhances both operational efficiency and team accountability, and complements existing quality management frameworks by bridging the gap between strategic tools (e.g., Six Sigma) and day-to-day problem solving needs.

4.4. Comparative Reflection with Classical Quality Management System Tools

While the two case studies illustrate real-world improvements, it is equally important to contextualize these results against classical quality tools. Table 5 contrasts the Daily Challenge tool with traditional methodologies, highlighting how the proposed system balances simplicity, adaptability, and measurable impact, particularly in operational environments with high reactivity demands.
To explicitly demonstrate the added value of the Daily Challenge tool, Table 5 provides a comparative overview between the two case studies and selected classical quality management tools commonly used in manufacturing environments: the 8D method, ISO 9001 non-conformity management, and FMEA.
As demonstrated, the Daily Challenge tool fills a void in existing quality systems by providing operators with swift, effortless, and significant decision-making processes. Unlike structured methods that often require external facilitation or extended resolution times, this tool integrates directly into production cycles, enabling decentralized quality ownership and faster return on investment.
Unlike traditional tools such as the 8D method, ISO 9001 non-conformity handling, or FMEA, which often require formal processes, expert facilitation, or lengthy resolution timelines, the Daily Challenge approach empowers frontline personnel with intuitive, visual, and workflow-integrated mechanisms. These characteristics translate into faster response times (under 24 h), reduced operational disruptions, and measurable cost savings.
Moreover, the comparative analysis (Table 5) clearly shows how the tool bridges the gap between reactive quality control and strategic quality initiatives like Six Sigma. It does so by minimizing documentation overhead, maximizing accessibility to all staff levels, and ensuring consistent integration with daily operations. This makes the Daily Challenge tool both scalable and practical—especially in fast-paced manufacturing environments with high responsiveness requirements.
These findings confirm the tool’s added value in complementing existing quality management systems, enhancing overall effectiveness while maintaining low implementation barriers.

4.5. Methodology Validation and Limitations

The Daily Challenge tool was tested in a real-world setting within the bottled spring water production process. Two case studies were conducted to evaluate its effectiveness in identifying, analyzing, correcting, and preventing non-conformities. The results demonstrated significant improvements in operational efficiency, including a 59% reduction in equipment downtime and a 31% decrease in maintenance costs. These outcomes validate the practical applicability of the Daily Challenge tool in dynamic production environments.
Despite its strengths, the Daily Challenge tool has certain limitations:
-
Resource Intensity: The implementation of real-time monitoring and the “Daily Challenge” sheet requires dedicated personnel and time, which may be challenging for organizations with limited resources.
-
Scalability: While effective in the case studies, further investigation is needed to assess the scalability of the Daily Challenge tool to larger production facilities with more complex operations.
-
Data Dependency: The success of the Daily Challenge tool heavily relies on the accuracy and timeliness of data input; any discrepancies can affect the system’s effectiveness.
Although the Daily Challenge technique integrates tools commonly used in Lean or Six Sigma (e.g., Ishikawa diagram, PDCA cycle), its added value lies in embedding these into a standardized, cross-functional daily routine. The “Daily Challenge” sheet serves not only as a reporting form but also as a structured decision-support mechanism that drives consistent root cause analysis, prioritization, and action planning across a wide range of operational and informational non-conformities.

4.6. Lessons Learned from Daily Challenge Tool Implementation

The implementation of the Daily Challenge tool provided valuable insights into its practical application and effectiveness. These experiences are instrumental for organizations aiming to enhance their non-conformity management processes.
One significant lesson is the importance of proactive detection and resolution. The Daily Challenge tool facilitated the early identification of non-conformities, enabling timely interventions that prevented escalation and minimized operational disruptions.
Another key insight is the enhancement of cross-functional collaboration. The system’s structured approach promoted cooperation among departments, fostering a unified effort in addressing non-conformities and implementing corrective actions. This methodology begins with identifying non-conformities through data collection and direct observation, followed by structured, focused reporting and active discussion during cross-functional meetings. Such an approach goes beyond traditional formal reporting by enabling timely, relevant communication that supports collaborative problem solving and rapid decision-making.
A central enabler of this structured collaboration was the “Daily Challenge” sheet, whose novelty lies not in its individual components—which include known tools such as the 5M analysis, cause-effect diagrams, or PDCA—but in its daily, systematic use across all categories of non-conformities within the Daily Challenge tool. This consistent operationalization transforms the sheet into a cross-functional resolution mechanism that captures causes, corrective actions, and institutional knowledge, thereby supporting continuous improvement and learning at the organizational level [46].
The integration of quantitative indicators, such as Mean Time to Repair (MTTR) and equipment downtime, underscored the value of data-driven decision-making. These metrics provided a factual basis for assessing performance and guiding improvements.
The Daily Challenge tool demonstrated scalability and adaptability by accommodating varying complexities of non-conformities, indicating its potential applicability across diverse industrial contexts. The emphasis on root cause analysis and corrective measures cultivated a culture of continuous improvement, aligning with quality management principles. By streamlining processes and reducing the recurrence of issues, the Daily Challenge tool contributed to a more efficient utilization of resources and cost savings. Effective implementation highlighted the necessity of training personnel and securing management support to ensure system adoption. Lastly, the system’s compatibility with standards like ISO 9001, ISO 14001, and ISO 45001 facilitated its integration into existing management frameworks, enhancing overall organizational coherence.
These lessons affirm the Daily Challenge tool as a robust tool for managing non-conformities, offering a structured pathway to operational excellence and continuous improvement.

4.7. A Prospective Outlook on the Daily Challenge Tool: Future Directions and Objectives

Future directions and objectives for the Daily Challenge tool could be focused on evolving the system to meet future challenges, enhancing its capabilities, and integrating emerging technologies and methodologies. Here are some key future directions and objectives for the Daily Challenge tool:
  • Integration with Advanced Technologies
    -
    Artificial Intelligence (AI) and Machine Learning (ML): Future versions of the Daily Challenge tool could incorporate AI and ML algorithms to predict potential non-conformities before they happen by analyzing historical data, trends, and operational patterns. This proactive approach would help identify risks and reduce the occurrence of non-conformities [47].
    -
    Automation: Automating repetitive tasks such as data collection, problem tracking, and reporting can significantly enhance the efficiency of the system. Automated alerts and notifications could improve responsiveness and streamline the decision-making process.
  • Enhanced Data Analytics and Reporting
    -
    Real-Time Data Monitoring: The system could evolve to provide real-time data analytics, allowing for immediate visibility into operations and non-conformity statuses. This would improve the speed at which issues are detected and resolved.
    -
    Predictive Analytics: With the use of advanced analytics, the system could predict trends and patterns of non-conformities, helping organizations take corrective actions before issues become widespread.
    -
    Visual Dashboards: The introduction of interactive dashboards for managers and decision-makers would provide easy-to-understand visualizations of key performance indicators (KPIs), non-conformity trends, and improvement progress.
  • Greater Integration with Supply Chain and External Partners
    -
    End-to-End Integration: The system could be integrated with external partners and suppliers to ensure that non-conformities within the supply chain are identified, tracked, and corrected. Such an approach would lead to improved product quality and more seamless collaboration between all stakeholders.
    -
    Collaboration with Customers: Future iterations of the system could allow for direct customer feedback and integration into the non-conformance management process, further enhancing customer satisfaction and aligning the system with customer expectations.
  • Enhanced User Experience and Accessibility
    -
    Mobile and Cloud-Based Access: To support a more flexible workforce, the system could evolve to be fully mobile and cloud-based. This would allow employees and managers to access the system remotely, improving accessibility and collaboration, especially for organizations with multiple locations or remote teams.
    -
    User-Friendly Interface: Future versions of the system could focus on simplifying the user interface, making it more intuitive for employees at all levels. This would increase the adoption and ease of use for everyone involved in the non-conformance management process.
  • Continuous Improvement and Adaptation
    -
    Self-Optimizing Systems: The future direction could see the system becoming more self-optimizing, learning from past data and continuously improving its ability to identify and mitigate non-conformities. This would involve advanced feedback loops and automatic adjustments to processes.
    -
    Feedback Loops for Innovation: The system could be designed to continuously collect feedback from users and stakeholders to fuel innovation and drive improvements in both the methodology and system capabilities [48].
  • Collaboration with Regulatory and Compliance Bodies
    -
    Automated Compliance Monitoring: As regulations and industry standards evolve, the Daily Challenge tool could be integrated with regulatory bodies to automatically track compliance and generate reports for audits or inspections. This would ensure the system remains aligned with industry requirements and supports ongoing compliance.
    -
    Real-Time Updates: With dynamic changes in regulations, the system could be updated automatically to reflect new standards, ensuring that compliance is always maintained without manual intervention.
  • Expansion into New Sectors and Industries
    -
    Industry-Specific Customization: The system could be tailored to meet the specific needs of different industries such as healthcare, aerospace, automotive, or pharmaceuticals. Each sector has unique challenges and regulatory requirements, and customizing the Daily Challenge tool for each would improve its applicability and effectiveness.
    -
    Integration with Existing Management Systems: The Daily Challenge tool can be seamlessly integrated with existing quality management systems such as ISO 9001, ISO 14001, and ISO 45001, enhancing current processes without necessitating a complete overhaul. This integration streamlines operations and ensures a unified approach to quality, environmental, and occupational health and safety management.
  • Scalability and Flexibility [49]
    -
    Scalability for Large Enterprises: Future directions could focus on making the system more scalable to accommodate large, complex organizations with multiple divisions and geographies. This strategy would involve modular designs and the ability to handle a growing volume of data and processes.
    -
    Customization for Small and Medium Enterprises (SMEs): On the other hand, the system could be simplified and customized for SMEs, making it more accessible to businesses of all sizes. A more flexible approach would cater to the needs of organizations at different stages of their growth.
  • Employee Training and Knowledge Sharing [50]
    -
    Training Programs and Certifications: Future directions could include comprehensive training programs within the Daily Challenge tool to ensure employees are continually strengthening their skills in identifying and solving non-conformities. This would lead to a more knowledgeable and empowered workforce [51].
    -
    Knowledge Management Integration: The system could evolve to include a knowledge-sharing platform where employees can share insights, solutions, and lessons learned, fostering a culture of continuous improvement across the organization [52,53].
The prospective outlook for the Daily Challenge tool revolves around increasing its efficiency, scalability, integration with advanced technologies, and focus on continuous improvement. The system’s future evolution will be driven by innovations in AI, data analytics, automation, and integration with external partners, allowing it to address new challenges while enhancing its value in ensuring product quality, operational efficiency, and customer satisfaction. By embracing these future directions, the Daily Challenge tool can continue to be a vital decision-making tool for organizations striving for excellence in non-conformance management.

5. Conclusions

The implementation of the Daily Challenge tool has demonstrated significant and measurable improvements in organizational performance. Unlike conventional systems, this practical tool supports deferred data collection through the “Daily Challenge” sheet, along with collaborative problem solving and corrective action planning directly integrated into the daily operations.
The pilot application led to a 35% reduction in the average response time to non-conformities and a 20% decrease in recurrence rates, highlighting the system’s capacity to address root causes more effectively. Moreover, the structured use of tools such as the “Daily Challenge” worksheet enhanced interdepartmental accountability and communication.
The case studies confirm the tool’s applicability across different levels of operational complexity, demonstrating both agility in addressing compliance-critical issues and robustness in preventing production failures. The structured yet accessible format facilitates widespread adoption and immediate value generation without the burden of heavy procedural frameworks.
This study contributes to the current literature by offering practical advice about the implementation and contextual adaptation of non-conformance management tools, addressing the persistent gap between formal quality management systems (e.g., ISO 9001, Six Sigma, TQM) and their consistent, effective use in everyday organizational practices. The comparative analysis confirms that the Daily Challenge tool offers a more dynamic, adaptable, and data-informed approach, aligned with contemporary quality demands. By promoting a culture of continuous improvement and integrating advanced technologies, the Daily Challenge tool supports organizations in anticipating and preventing problems.
Future research should focus on the scalability of the Daily Challenge tool across industrial sectors, as well as on the integration with digital platforms, AI-based analytics, and supply chain partners. Additionally, long-term studies are recommended to assess the sustained impact on compliance, risk management, and customer satisfaction. The Daily Challenge tool serves as a comprehensive and scalable solution for modern non-conformance management. It empowers organizations to shift from reactive quality control to proactive process optimization, delivering tangible improvements in overall performance.

Author Contributions

Conceptualization, M.G. and I.G.; methodology, P.M.-Ș.; software, M.G.; validation, M.P., P.M.-Ș., and M.G.; formal analysis, I.G.; investigation, I.G.; resources, M.P.; data curation, M.P.; writing—original draft preparation, I.G.; writing—review and editing, M.G.; visualization, P.M.-Ș.; supervision, M.P.; project administration, M.G.; funding acquisition, M.P. All authors have read and agreed to the published version of the manuscript.

Funding

This research received no external funding.

Institutional Review Board Statement

Not applicable.

Informed Consent Statement

Not applicable.

Data Availability Statement

Data are contained within the article.

Conflicts of Interest

The authors declare no conflicts of interest.

References

  1. Jancsics, D.; Espinosa, S.; Carlos, J. Organizational noncompliance: An interdisciplinary review of social and organizational factors. Manag. Rev. Q. 2023, 73, 1273–1301. [Google Scholar] [CrossRef]
  2. Lazar, J.; Goldstein, D.; Taylor, A. Chapter 9—Compliance monitoring policies and procurement. In Ensuring Digital Accessibility Through Process and Policy, 1st ed.; Lazar, J., Goldstein, D., Taylor, A., Eds.; Morgan Kaufmann: Burlington, MA, USA, 2015; pp. 161–182. [Google Scholar] [CrossRef]
  3. Ghooi, R.B.; Bhosale, N.; Wadhwani, R.; Divate, P.; Divate, U. Assessment and classification of protocol deviations. Perspect. Clin. Res. 2016, 7, 132–136. [Google Scholar] [CrossRef]
  4. Fantozzi, I.C.; Olhager, J.; Johnsson, C.; Schiraldi, M.M. Guiding organizations in the digital era: Tools and metrics for success. Int. J. Eng. Bus. Manag. 2025, 17, 18479790241312804. [Google Scholar] [CrossRef]
  5. Fantozzi, I.C.; Santolamazza, A.; Loy, G.; Schiraldi, M.M. Digital Twins: Strategic Guide to Utilize Digital Twins to Improve Operational Efficiency in Industry 4.0. Future Internet 2025, 17, 41. [Google Scholar] [CrossRef]
  6. Davim, J.P. Perceptions of Industry 5.0: Sustainability Perspective. BioResources 2025, 20, 15–16. [Google Scholar] [CrossRef]
  7. Park, J.; Jung, W. The operators’ non-compliance behavior to conduct emergency operating procedures—Comparing with the work experience and the complexity of procedural steps. Reliab. Eng. Syst. Saf. 2003, 82, 115–131. [Google Scholar] [CrossRef]
  8. Accidents and Incidents. Available online: https://oshwiki.osha.europa.eu/en/themes/accidents-and-incidents (accessed on 2 April 2025).
  9. Tregoe, B.B.; Kepner, C.H. The Rational Manager: A Systematic Approach to Problem Solving and Decision-Making; McGraw-Hill Book Company: New York, NY, USA, 1965. [Google Scholar]
  10. ISO 27001; Information Security Management Standard. ISO: Geneva, Switzerland, 2005.
  11. Vultur, T.; Marin, V. National Good Practice Guide for Food Safety (NGP GFS)—HACCP Food Safety System; Uranus Publishing House: Bucharest, Romania, 2007. (In Romanian) [Google Scholar]
  12. Popa, M.; Glevitzky, I.; Glevitzky, M.; Popa, D.V.; Popa, D.M.; Titu, A.M.; Oprean, C.; Achim, M.I. Modern Instrument for Nonconformities’ Management Within Quality Management Systems. In Romanian Management Theory and Practice. Contributions to Management Science; Nicolescu, O., Oprean, C., Titu, A.M., Vaduva, S., Eds.; Springer: Cham, Switzerland, 2025; pp. 99–120. [Google Scholar] [CrossRef]
  13. Titman, P. 8—Quality concepts. In Advanced Concrete Technology; Newman, J., Choo, B.S., Eds.; Butterworth-Heinemann: Oxford, UK, 2003; Volume 2, pp. 3–30. [Google Scholar] [CrossRef]
  14. Maheswari, J.U.; Charlesraj, V.P.C.; Kumar, G.S.; Padala, S.P.S. A Study on Assessment of Non-conformances Using Multiple Domain Matrix: A Case Study from Metro Projects. Procedia Eng. 2016, 145, 622–629. [Google Scholar] [CrossRef]
  15. Marucheck, A.; Greis, N.; Mena, C.; Cai, L. Product safety and security in the global supply chain: Issues, challenges and research opportunities. J. Oper. Manag. 2011, 29, 707–720. [Google Scholar] [CrossRef]
  16. Chen, S.Y.; Lien, K.W. Analysis of the implementation of the certification of second-tier quality control in Taiwan food businesses and common non-conformities. J. Consum. Prot. Food Saf. 2024, 19, 425–436. [Google Scholar] [CrossRef]
  17. Wu, W.; Zhang, A.; van Klinken, R.D.; Schrobback, P.; Muller, J.M. Consumer Trust in Food and the Food System: A Critical Review. Foods 2021, 10, 2490. [Google Scholar] [CrossRef]
  18. Gizaw, Z. Public health risks related to food safety issues in the food market: A systematic literature review. Environ. Health Prev. Med. 2019, 24, 68. [Google Scholar] [CrossRef] [PubMed]
  19. Micallef, S.A.; Buchanan, R.L. Regulatory Issues Associated with Preharvest Food Safety: United States Perspective. Microbiol. Spectr. 2017, 5, 11. [Google Scholar] [CrossRef]
  20. Sorbo, A.; Pucci, E.; Nobili, C.; Taglieri, I.; Passeri, D.; Zoani, C. Food Safety Assessment: Overview of Metrological Issues and Regulatory Aspects in the European Union. Separations 2022, 9, 53. [Google Scholar] [CrossRef]
  21. Majestic, E. Public health’s inconvenient truth: The need to create partnerships with the business sector. Prev. Chronic Dis. 2009, 6, A39. [Google Scholar]
  22. Glevitzky, M.; Perju, D.; Dumitrel, G.-A.; Popa, M.; Vica, M. Water activity—Indicator of food safety and the factors that influence the biochemical stability of soft drinks. Stud. UBB Chem. 2009, 54, 181–188. [Google Scholar]
  23. David, L.O.; Nwulu, N.; Aigbavboa, C.; Adepoju, O. Towards global water security: The role of cleaner production. Clean. Eng. Technol. 2023, 17, 100695. [Google Scholar] [CrossRef]
  24. Popa, M.; Glevitzky, M.; Popa, D.M.; Dumitrel, G.A. Study Regarding the Water Contamination and the Negative Effects on the Population from the Blaj Area, Romania. J. Environ. Prot. Ecol. 2014, 15, 1543–1554. [Google Scholar]
  25. Jung, M.S.; da Silva, J.A.G.; Fachinetto, J.M.; Carvalho, I.R.; Lucchese, O.A.; Basso, N.C.F.; Copetti, C.M.; da Silva, L.G. Water: A Fundamental Resource for Ensuring Sustainability. Rev. Gest. Soc. Ambient. 2023, 17, e03661. [Google Scholar] [CrossRef]
  26. Popa, M.; Glevitzky, I.; Popa, D.; Glevitzky, M. Water Quality Assessments Through the Application of Cause-and-Effect Diagrams in Conjunction with HACCP and Risk Assessment for “Roua Apusenilor” Spring Water Bottling Process. Sci. Pap. Ser. E Land Reclam. Earth Obs. Surv. Environ. Eng. 2021, 10, 158–165. [Google Scholar]
  27. Glevitzky, M.; Glevitzky, I.; Mucea-Ștef, P.; Popa, M.; Dumitrel, G.-A.; Vică, M.L. Integrated Risk Framework (IRF)—Interconnection of the Ishikawa Diagram with the Enhanced HACCP System in Risk Assessment for the Sustainable Food Industry. Sustainability 2025, 17, 536. [Google Scholar] [CrossRef]
  28. Glevitzky, M.; Bogdan, I.; Calisevici, M.; Brusturean, A.; Perju, D. Analysis of Critical Points with Major Risk in Reducing the Shelf Life of Soft Drinks Using the ASLD Method. Buletinul AGIR 2008, 1–2, 54–59. (In Romanian) [Google Scholar]
  29. Karkoszka, T. Operational Control Model Based on Integrated Failure Analysis and Risk Assessment in Sustainable Technological Processes. Sustainability 2023, 15, 16848. [Google Scholar] [CrossRef]
  30. Ziorklui, J.E.K.; Ampofo, F.O.; Nyonyoh, N.; Antwi, B.O. Effectiveness of internal controls mechanisms in preventing and detecting fraud. J. Foot Ankle Res. 2024, 6, 1259–1274. [Google Scholar]
  31. Bhat, S. The Effectiveness of Internal Controls in Preventing Fraud and Financial Misconduct. J. Law Sustain. Dev. 2023, 11, e1178. [Google Scholar] [CrossRef]
  32. Popa, M.; Glevitzky, M.; Dumitrel, G.-A.; Popa, D.; Virsta, A. Improving the System of Logistics Management and Signaling, Identification, Classification of Noncompliance in the Water Bottling Industry. Sci. Pap. Ser. E Land Reclam. Earth Obs. Surv. Environ. Eng. 2023, 12, 251–257. [Google Scholar]
  33. Rajić, M.N.; Stanković, Z.Z.; Mančić, M.V.; Milosavljević, P.M.; Maksimović, R. Business Process Reengineering with a Circular Economy PDCA Model from the Perspective of Manufacturing Industry. Processes 2024, 12, 877. [Google Scholar] [CrossRef]
  34. ISO 9001:2015; Quality Management Systems—Requirements. International Organization for Standardization: Geneva, Switzerland, 2015.
  35. Marques, P.A.; Guerreiro, F.F.; Saraiva, P.M. Lean Six Sigma methods and tools in ISO 9001:2015 management systems. J. Eng. Sci. Res. 2019, 3, 28–35. [Google Scholar] [CrossRef]
  36. Wang, C.-N.; Chiu, P.-C.; Cheng, I.-F.; Huang, Y.-F. Contamination Improvement of Touch Panel and Color Filter Production Processes of Lean Six Sigma. Appl. Sci. 2019, 9, 1893. [Google Scholar] [CrossRef]
  37. Dudin, M.N.; Frolova, E.E.; Gryzunova, N.V.; Borisovna, E.S. The Deming Cycle (PDCA) Concept as an Efficient Tool for Continuous Quality Improvement in the Agribusiness. Asian Soc. Sci. 2015, 11, 239–246. [Google Scholar] [CrossRef]
  38. Realyvásquez-Vargas, A.; Arredondo-Soto, K.C.; Carrillo-Gutiérrez, T.; Ravelo, G. Applying the Plan-Do-Check-Act (PDCA) Cycle to Reduce the Defects in the Manufacturing Industry. A Case Study. Appl. Sci. 2018, 8, 2181. [Google Scholar] [CrossRef]
  39. Cheng, H.-R.; Chen, B.-W. A case study in solving customer complaints based on the 8Ds method and Kano model. J. Chin. Inst. Ind. Eng. 2010, 27, 339–350. [Google Scholar] [CrossRef]
  40. Bunce, M.M.; Wang, L.; Bidanda, B. Leveraging Six Sigma with industrial engineering tools in crateless retort production. Int. J. Prod. Res. 2008, 46, 6701–6719. [Google Scholar] [CrossRef]
  41. Anderson, N.C.; Kovach, J.V. Reducing welding defects in turnaround projects: A lean six sigma case study. Qual. Eng. 2014, 26, 168–181. [Google Scholar] [CrossRef]
  42. Kumar, S.; Swarnakar, V.; Phanden, R.K.; Khanduja, D.; Chakraborty, A. Role of Lean Six Sigma in manufacturing setting: A systematic literature review and agenda for future research. TQM J. 2024, 36, 1996–2047. [Google Scholar] [CrossRef]
  43. Vinodh, S.; Ben Ruben, R. Lean Manufacturing: Recent Trends, Research & Development and Education Perspectives. In Research Advances in Industrial Engineering. Management and Industrial Engineering; Davim, J., Ed.; Springer: Aveiro, Portugal, 2015; pp. 1–16. [Google Scholar] [CrossRef]
  44. Nguyen, V.; Nguyen, N.; Schumacher, B.; Tran, T. Practical Application of Plan–Do–Check–Act Cycle for Quality Improvement of Sustainable Packaging: A Case Study. Appl. Sci. 2020, 10, 6332. [Google Scholar] [CrossRef]
  45. Holifahtus Sakdiyah, S.; Eltivia, N.; Afandi, A. Root Cause Analysis Using Fishbone Diagram: Company Management Decision Making. J. Appl. Bus. Tax. Econ. Res. 2022, 1, 566–576. [Google Scholar] [CrossRef]
  46. Sen, Y. Knowledge as a Valuable Asset of Organizations: Taxonomy, Management and Implications. In Management Science. Management and Industrial Engineering; Machado, C., Davim, J., Eds.; Springer: Cham, Switzerland, 2019; pp. 29–48. [Google Scholar] [CrossRef]
  47. Gilbert, C.; Gilbert, A.G. Artificial Intelligence (AI) and Machine Learning (ML) for Predictive Cyber Threat Intelligence (CTI). Int. J. Res. Publ. Rev. 2025, 6, 584–617. [Google Scholar]
  48. Wassan, A.N.; Memon, M.S.; Mari, S.I.; Kalwar, M.A. Impact of Total Quality Management (TQM) Practices on Sustainability and Organisational Performance. J. Adv. Res. Appl. Sci. Eng. Technol. 2022, 3, 93–102. [Google Scholar] [CrossRef]
  49. Coviello, N.; Autio, E.; Nambisan, S.; Patzelt, H.; Thomas, L.D.W. Organizational scaling, scalability, and scale-up: Definitional harmonization and a research agenda. J. Bus. Ventur. 2024, 39, 106419. [Google Scholar] [CrossRef]
  50. Mehner, L.; Rothenbusch, S.; Kauffeld, S. How to maximize the impact of workplace training: A mixed-method analysis of social support, training transfer and knowledge sharing. Eur. J. Work Org. Psychol. 2024, 34, 201–217. [Google Scholar] [CrossRef]
  51. Shiri, R.; El-Metwally, A.; Sallinen, M.; Pöyry, M.; Härmä, M.; Toppinen-Tanner, S. The Role of Continuing Professional Training or Development in Maintaining Current Employment: A Systematic Review. Healthcare 2023, 11, 2900. [Google Scholar] [CrossRef] [PubMed]
  52. Obeng, H.A.; Arhinful, R.; Mensah, L.; Owusu-Sarfo, J.S. Assessing the Influence of the Knowledge Management Cycle on Job Satisfaction and Organizational Culture Considering the Interplay of Employee Engagement. Sustainability 2024, 16, 8728. [Google Scholar] [CrossRef]
  53. Ferreira, A.P.V.G. Training and Development in Organizations: Start at the Beginning. In MBA. Management and Industrial Engineering; Machado, C., Davim, J., Eds.; Springer: Cham, Switzerland, 2016; pp. 105–121. [Google Scholar] [CrossRef]
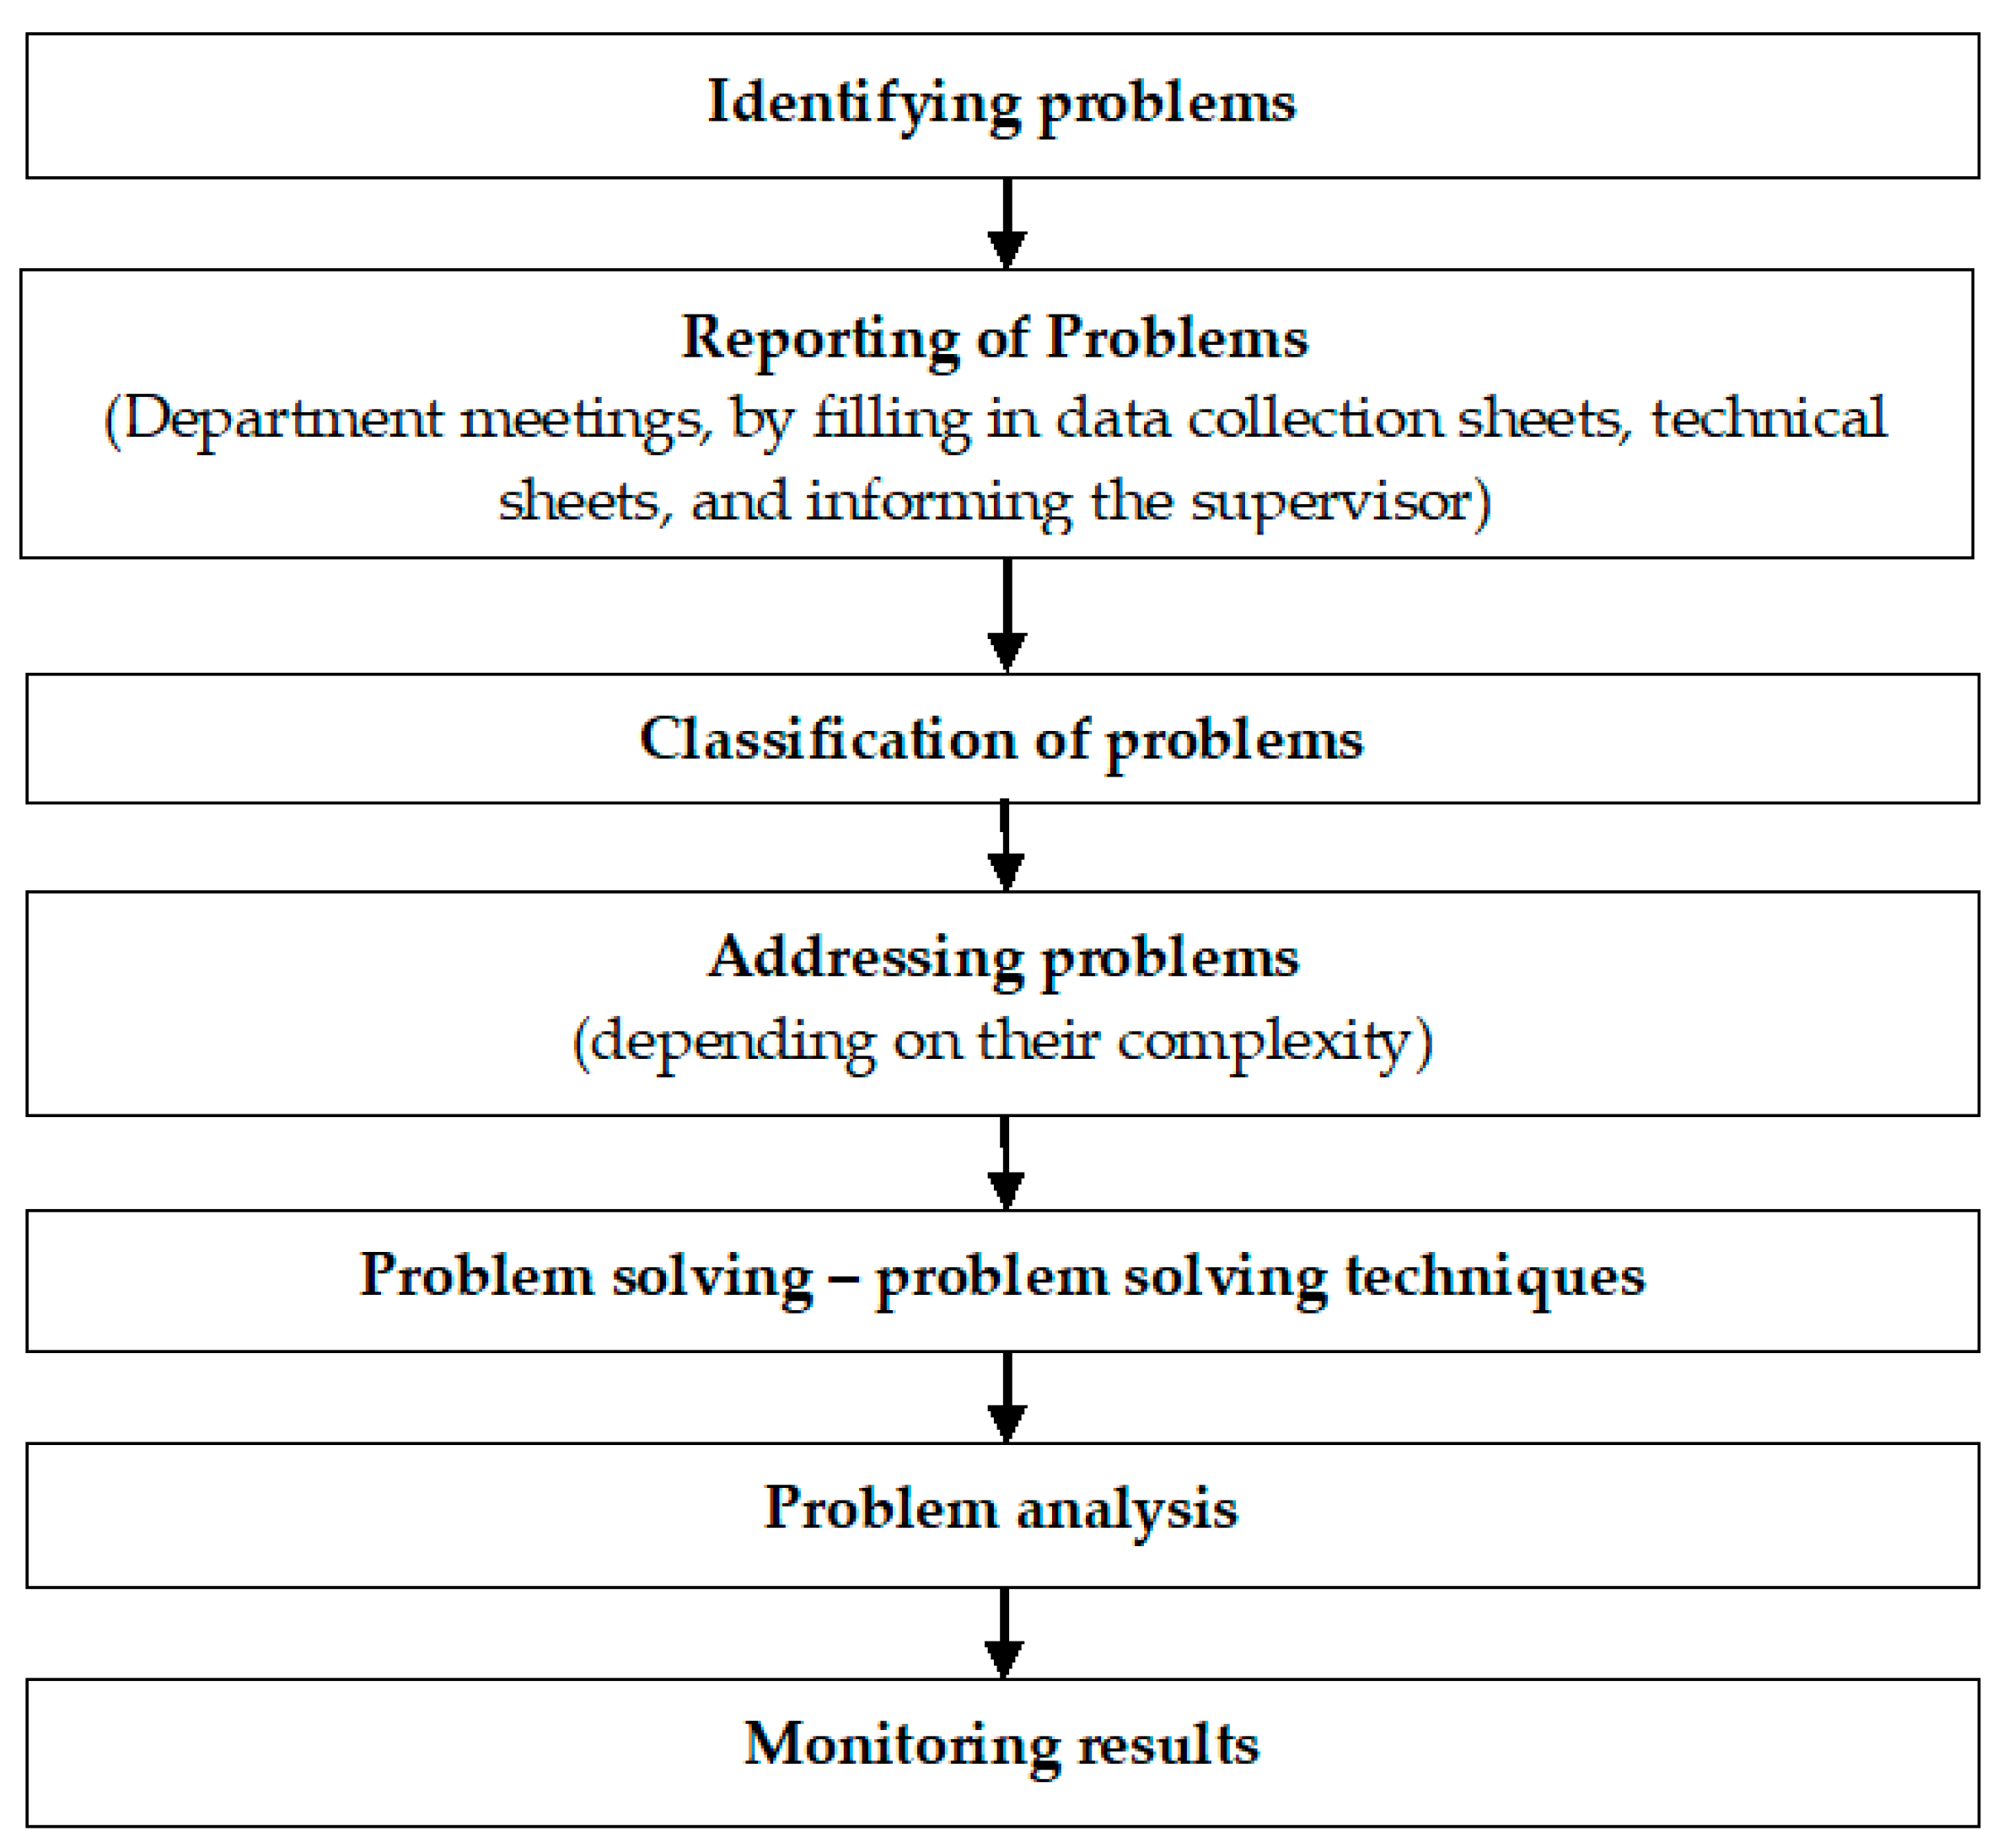
Figure 1. Non-conformity management stages.
Sustainability 17 05918 g001
Figure 2. Overview of the process for identifying non-conformities based on two sources.
Sustainability 17 05918 g002
Figure 3. Classification of problems based on severity and operational impact.
Sustainability 17 05918 g003
Figure 4. Method of addressing non-conformities.
Sustainability 17 05918 g004
Figure 5. Problem solving process diagram.
Sustainability 17 05918 g005
Figure 6. Logical diagram of the problem analysis process.
Sustainability 17 05918 g006
Figure 7. Non-conformity resolution form.
Sustainability 17 05918 g007
Figure 8. Technological flowchart of the water bottling process.
Sustainability 17 05918 g008
Figure 9. Daily Challenge sheet prepared for a labeling non-conformity.
Sustainability 17 05918 g009
Table 1. Categorized non-conformities in the material and informational flows.
No.CategoryMaterial Flow IssueInformational Flow Issue
1Quality issueLoss of productLack of basic information
2Documentation issueNoncompliant documentsLack of atypical/incomplete information
3Quality issueProduct with foreign taste and smellIncorrect, erroneous, false information
4Quality issueProduct with impuritiesUnclear, ambiguous, vague information
5Quality issueContaminated productDelayed, postponed information
6Technical issueNon-conforming product due to equipmentDelayed, overdue order/product in stock
7Technical issueInsufficiently carbonated/ozonated productDelayed order/finished product missing/raw material in stock
8Packaging issueNoncompliant packagingDelayed order/finished product missing/raw material missing
9Labeling issueNoncompliant labelsDelayed order for raw material/delayed order
10Quality issueProduct featuring a different colorMissing, lost, unavailable documents
11Documentation issueMissing quality documentsLack of customer notification
12Operational issueNon-conformity in boxing/palletizingDelayed customer notification
13Inventory issueInventory shortageExcess information
14Labeling issueMissing labels/double labelingIncorrect services
15Regulatory/QualityFailure to meet admissibility criteriaPoor quality services
16Technical issueTechnical non-conformityDelayed services
17OtherOther defectsMissing services
18--Operational errors
19--Other various
Table 2. Quantitative impact of daily challenge tool implementation on equipment-related non-conformity.
IndicatorBefore Daily Challenge ToolAfter Daily Challenge Tool
Mean Time to Repair (MTTR)5 h2 h
Equipment Downtime (monthly average)~22 h~9 h
Delivery Delays per Quarter3 cases0 cases
Maintenance Costs per Month~EUR 3800~EUR 2300
Recurrence of Non-Conformity on Same Equipment2 in 3 months0 in 6 months
Table 3. Comparison between the daily challenge tool and traditional quality management frameworks.
CriterionDaily Challenge ToolSix SigmaISO 9001/TQM
Main objectiveIntegrated, practical system to identify and correct non-conformities in material and information flows on deferred monitoring and daily operational use.Reduce variation and defects in processes using statistical analysis and expert-led improvement projects, targeting both short-term and long-term continuous improvement.Provide a comprehensive quality management framework ensuring consistent product/service quality and driving continuous improvement through documented policies and processes.
ApproachPractical, collaborative, data-informed, action-oriented, designed for easy integration into daily routines and cross-departmental cooperation.Data-driven, statistically based (DMAIC), requires specialized expertise and structured project management.Standard-driven, policy-based system with formal requirements for documentation, audits, and management reviews.
Tools used-“Daily Challenge” sheet integrating Fishbone diagrams and prioritization matrices, applied in a simplified and systematic way for daily issue resolution.SPC, control charts, root cause analysis, and other advanced statistical tools, typically led by trained Black/Green Belt practitioners.Quality audits, Kaizen, quality manuals, and other systemic quality management tools embedded in organizational processes.
OriginalityCombines known problem solving tools into a unified, easy-to-use framework embedded in daily workflow, emphasizing operational simplicity and continuous learning.Structured expert-driven problem solving with strong statistical rigor, addressing both operational and strategic improvements.Broad framework focused on compliance and systematic quality management rather than specific problem solving techniques.
Practical implementationEasily embedded into operational routines with minimal training, accessible to a wide range of staff without requiring specialized certification.Requires formal training and certification (Black/Green Belts), and involvement of experts for effective implementation.Requires formal implementation and documentation and external certification; integration into organizational governance structures.
Table 4. Comparison of corrective and preventive actions in two case studies.
CategoryCase Study 1Case Study 2
Immediate corrective actionsImmediate relabeling and design correctionRepair and recalibration of the affected equipment
System/procedural adjustmentsSoftware program adjustmentsUpdates to SOPs and maintenance plan
Staff trainingOn-the-spot retrainingStaff training and implementation of real-time alerts
Preventive measuresIntroduction of label validation before printingIntegration of predictive maintenance practices
Table 5. Comparative overview of QMS tool response to case studies.
AspectDaily Challenge Tool8D MethodISO 9001 NC HandlingFMEA
Response Time (Case 1)<1 day2–4 days2–4 daysNot applicable post-issue
Response Time (Case 2)<3 days5–7 days~1 weekOnly useful preemptively
Accessibility to OperatorsHigh—operator-led analysisModerate—quality engineer-drivenLow—formalized auditsLow—Process flow coordinator
Documentation OverheadLow (1-pager format)HighMediumHigh
Scalability Across DepartmentsHigh (simple language, visual tools)ModerateModerateLow
Training RequirementsMinimal (visual and structured sheet)HighModerateHigh
Integration with Daily RoutinesSeamlessLowLowLow
Supports Both Simple and Complex ProblemsYesPrimarily complexMostly compliance-relatedMostly preventive
Quantifiable Impact (Case 2)Reduced downtime, costs, delaysUsually measured preciselyOften qualitative onlyNot applicable post-event
Disclaimer/Publisher’s Note: The statements, opinions and data contained in all publications are solely those of the individual author(s) and contributor(s) and not of MDPI and/or the editor(s). MDPI and/or the editor(s) disclaim responsibility for any injury to people or property resulting from any ideas, methods, instructions or products referred to in the content.