Abstract
This article examines the energy efficiency and climate impact of various heating methods commonly employed across industrial sectors. Fossil fuel combustion heat sources, which are predominantly employed for industrial heating, contribute significantly to atmospheric pollution and associated asset losses. The electrification of industrial heating has the potential to substantially reduce the total energy consumed in industrial heating processes and significantly mitigate the rate of global warming. Advances in electrical heating technologies are driven by enhanced energy conversion, compactness, and precision control capabilities, ensuring attractive financial payback periods for clean, energy-efficient equipment. These advancements stem from the use of improved performance materials, process optimization, and waste heat utilization practices, particularly at high temperatures. The technical challenges associated with large-scale, heavy-duty electric process heating are addressed through the novel innovations discussed in this article. Electrification and the corresponding energy efficiency improvements reduce the water consumed for industrial steam requirements. The article reviews new technologies that replace conventional process gas heaters and pressure boilers with efficient electric process gas heaters and instant steam generators, operating in the high kilowatt and megawatt power ranges with very high-temperature capabilities. Financial payback calculations for energy-optimized processes are illustrated with examples encompassing a range of comparative energy costs across various temperatures. The economics and implications of waste heat utilization are also examined in this article. Additionally, the role of futuristic, radical technical innovations is evaluated as a sustainable pathway that can significantly lower energy consumption without compromising performance objectives. The potential for a new paradigm of self-organization in processes and final usage objectives is briefly explored for sustainable innovations in thermal engineering and materials development. The policy implications and early adoption of large-scale, energy-efficient thermal electrification are discussed in the context of temperature segmentation for industrial-scale processes and climate-driven asset losses. Policy shifts towards incentivizing energy efficiency at the manufacturing level of heater use are recommended as a pathway for deep decarbonization.
1. Introduction: Environmental Challenges of Fossil-Based Heating
The Earth’s ecosystems have a natural carbon cycle by which carbon is constantly recycled. This natural carbon cycle moves large amounts of CO2 and, in the past, could maintain a near-steady state of CO2 in the Earth’s atmosphere. This cycle permitted a certain annual predictability of weather and climate. However, emissions from human activities have increased. The totality of global CO2 production can no longer be fully recycled, leading to a net increase in atmospheric CO2 levels. Emissions and the rate of emissions have increased dramatically over the past 70 years [1,2,3,4,5,6,7,8,9,10,11]. For 2024, the projected global carbon budget indicates that human-made CO2 emissions will significantly exceed the amount that can be absorbed in the carbon cycle. The increase in the CO2 concentration in the troposphere has led to rapid global warming and its unwelcome consequences (e.g., rising sea levels, extreme weather events, species extinction). Accelerated warming increases the entropy generation rate in the troposphere, contributing to unpredictable, severe weather. CO2 emissions from fossil fuel combustion are estimated at 37.4 billion metric tons in 2024, resulting in a record high of ~422 ppm in the troposphere (the reported 2025 values from the Mauna Loa laboratories in late May 2025 reached ~430 ppm). The rate of CO2 accumulation is related to the Earth’s average temperature and the rate of entropy generation [4,12]. An increase in greenhouse gas (GHG) concentrations in the troposphere could have catastrophic consequences for humanity if the rate of GHG emissions remains unchecked.
This article examines the global improvement in energy conversion efficiency for industrial heating processes and its impact on emissions. The focus is primarily on the technical aspects of these processes, including radical innovations in key market sectors that consume significant energy to achieve industrial outcomes. The article is divided into six sections: (1) Introduction (this section): Environmental Challenges of Fossil-Based Heating. (2) Technical Trends and Energy Efficiencies in Electrical Heating and Waste Recovery Methods: Technological Innovations in Electric Heating. (3) Payback Calculation for Investments in Efficient Heating Systems. (4) Radical Innovation: The Impact on Sustainability. (5) Practical Implementation and Policy Implications: Incentives, Adoption Barriers, and Early Adopters. (6) Summary and Conclusions.
Combustion heating methods for power generation, industrial heating, and transportation account for over 75% of the pollutants and nearly 90% of all the carbon dioxide emissions that drive global warming [1,10]. Almost 25% of all emissions, or approximately 11 billion tons of CO2 per year, result from the combustion of fossil fuels in industrial operations, which involves the release of reactants and products into the atmosphere [1,13]. While the ocean and land plants may eventually absorb much of the carbon dioxide humans have introduced into the atmosphere, this process will take time. Despite the long-term potential for absorption, up to 20% or more of the excess carbon dioxide could linger in the atmosphere for thousands of years. There is thus an urgent need for immediate reductions in emissions. A decrease in concentration will be gradual, even with drastic cuts in CO2 emissions. Nevertheless, total levels can be stabilized through prompt actions that lower both the emissions rate and the rate of temperature rise. Eventually, the troposphere could return to a steady state, improving climate and weather predictability [12]. The annual rate of rise of tropospheric CO2 exceeds the average for the past decade [14], thus making it essential to examine all new technical methods of reducing such emissions. Industrial process heating is an area where CO2 emissions could be reduced substantially. This article examines such possibilities.
Process heat generation (thermal energy) is vital in industrial sectors, such as transportation, aerospace, mineral drying and processing, metallurgical operations, electronics, power generation, turbine operation, and chemical production. This process heat is primarily produced by the exothermic combustion of fossil fuels, resulting in significant GHG emissions. The primary fuel options include natural gas (CH4, methane) and propane (C3H8, propane). When one mole (~17 g) of natural gas (methane) is burned with oxygen gas (from the air) to release about 803.9 kJ of exothermic thermal energy, 64 g of oxygen is consumed from the atmosphere, and approximately 44 g of CO is emitted as a byproduct.
Transportation, power generation, and industrial heating are the three primary sectors responsible for nearly equal amounts of GHG emissions [1,2,3,5,15]. Among these three sectors, the electrification of industrial heating equipment is likely to offer the fastest route to reducing global emissions—a central hypothesis of this article. This is due to the significant advancements in efficiency and sustainable energy production that are now achievable [1,2,3,6,16,17,18,19,20,21,22]. Achieving the stabilization of tropospheric GHG concentrations can only be accomplished through a large-scale reduction in the industrial use of fossil fuel combustion heating, including natural gas, propane, diesel, and gasoline [12].
In 2018, a total of 7576 trillion kJ of fuel, steam, and electric energy were estimated to be consumed by U.S. manufacturers, comprising 51% of the total onsite energy used for manufacturing purposes [1]. This represents a significant amount of non-electrical energy consumed directly at an industrial product manufacturer’s site, primarily for heating. Since all this energy use produces CO2 (i.e., local to a manufacturer), it results in highly dispersed emission sources, making it challenging to sequester emissions. Additionally, there is growing evidence that direct carbon capture from air is an expensive and, more importantly, highly energy-intensive technology [23]. Worldwide emissions continue to rise. Although some countries, such as the United States, have reduced their GHG emissions since their peak in 2007, the total global GHG emissions in the atmosphere continue to show a net increase [14,19].
This increase is partly due to rising industrial GHG emissions in the U.S. and globally, which are hindering meaningful changes in the rate of tropospheric CO2 accumulation. Recent 2024 reports [24,25,26] show that energy efficiency, energy use timing for optimal energy rates, productivity, and efficiency are interrelated and influenced by process changes. Such reports underscore the need for energy-efficient electrification and process management at industrial sites. This article addresses these issues with a focus on technical advancements. The use of biofuels could be risky, as these fuels may only replace other carbon-containing fuels while contributing to deforestation; reforestation cycles are lengthy, and deforestation is a complex disruption to many critical ecosystems. Moreover, biomass combustion leads to considerable haze and adverse effects on human health [14,27,28,29], as well as significant CO2 emissions.
It seems clear that eliminating flames and combustion heating will expedite decarbonization and reduce harmful emissions; however, the magnitude of the economic benefits to industries has largely been unexplored in a framework of energy efficiency and related economic benefits. Nevertheless, fossil fuel heating remains the dominant fuel choice in the industrial heating sector, primarily due to its perceived lower cost. This article critically examines such beliefs.
Environmental policies have significantly boosted the innovation and adoption of cleaner technologies while discouraging the use of dirty technologies. However, this article focuses solely on technical trends and improvements for climate mitigation, without directly addressing policy issues. Policies and regulations have fostered sustainable energy-related innovations that are more accessible to industries, contributing to the larger movement toward net-zero carbon emissions [30]. Despite recent changes in the U.S., the global trend toward decarbonization appears to be progressing well. The motivation to tackle climate issues arises from both government and policy-making bodies, as well as organically from society, including citizen activists, climate engineers, and farming communities. While there is no doubt that green policies have improved climate and economic outcomes [1,4,13,26,30,31,32,33], some reports suggest that these policies may have led to unintended consequences [34]. A brief overview of the primary drivers for technical innovations is presented in Section 2.
Estimates of the world’s asset losses from each kilogram of CO2 and methane emitted are astonishingly high, ranging from USD 51 to over USD 3,000 per kilogram of CO2 equivalent emitted [1,6,35,36,37,38]. The social drivers for providing heat (thermal energy) with clean electric heaters are becoming increasingly compelling due to the continuous rise in heatwaves and climate extremes associated with GHG emissions (a product of fossil fuel combustion). The global decarbonization market is estimated at least USD 1.3 trillion and is projected to grow at a CAGR of 12.7% from 2021 to 2036. Some estimates suggest that the global market for decarbonized products and services will exceed USD 40 trillion by 2040. Reducing or limiting CO2 emissions offers a promising and economically viable business opportunity, in addition to its role in mitigating climate change. This article examines the techno-economic aspects of advanced engineering principles in industrial heating.
On 2 December 2023, the U.S. Environmental Protection Agency (EPA) released a final report [6,16], subsequently updated, that significantly increased estimates of the social cost of GHG, including carbon dioxide, methane, and nitrous oxide (collectively referred to as SC-GHG). The report defines SC-GHG as “the monetary value of the net harm to society from emitting one metric ton of that GHG into the atmosphere in a given year” [6,38]. These estimates serve as a resource for decision-makers, aiding in the cost–benefit analysis of actions that reduce or increase greenhouse gas (GHG) emissions. On 6 March 2024, the U.S. Securities and Exchange Commission introduced new climate disclosure rules, requiring companies to disclose climate-related risks that could materially impact their business or financial statements. New climate fines and taxes, based on the amount of GHG gases emitted into the atmosphere, will be allocated to climate superfunds [39]. Such fines are direct expenditures, factoring in the project costs discussed in Section 1 and Section 2 below. A process heater serves a vital industrial function and is a crucial investment. A gamut of electrical heaters for industrial (process) heating requirements across a wide temperature range is shown in Figure 1. One of the objectives of this article is to recognize the value of electrified thermal energy conversion machines and processes to manufacturers and society.
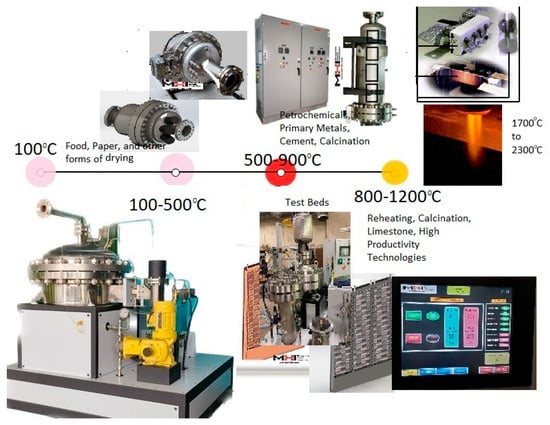
Figure 1.
The gamut of heating process temperatures from 100 °C to 1200 °C, with typical applications in the industrial sector (picture provided by MHI Inc., Cincinnati, OH, USA, reproduced with permission). From left to right, the pictures show electrical steam generation, electrical process gas heating, logic control displays, and the EION system discussed in Section 4.
2. Technical Trends and Energy Efficiencies in Electrical Heating and Waste Recovery Methods: Technological Innovations in Electric Heating
- (a)
- Electrification power requirements for industrial heating-process sectors.
While industry-specific needs may influence the types of improvements and new technologies relevant to different sectors, heating remains a universal requirement not confined to specific industry demands. On average, one million KJ of combustion energy from fossil fuel combustion results in approximately 60 kg of CO2 emissions (see Table 1 for various fuels). Thus, transitioning to electric heating (see Table 2) will benefit all industrial sectors by offering comparable energy efficiency enhancements and enabling the achievement of near-zero GHG emission goals. A United Nations report [10], among many others [1,18], explicitly emphasizes that converting fossil fuel-burning methods to electric heating is a crucial global objective. The energy efficiencies of high-power electric heaters are explored in detail in various sections of this article. High-temperature electric heat can be applied across numerous industrial applications, delivering significant advantages, such as reduced emissions, improved efficiency, and the outstanding durability of critical heater components. The role of waste heat recovery is also discussed in detail below for energy reuse, considering both the work-energy transfer and the recyclability of thermal energy (heat-energy transfer) from waste heat. This article does not consider heat pumps as their exit temperature output typically does not exceed comfort-heating temperatures (generally lower than ~27 °C (300 K)). Growing evidence also indicates that a heat pump’s impact on the electrical grid is more complex than the very high predicted efficiencies of a heat pump, which are unrealistic [40,41]. Its impact on the electrical grid is more complex than that of conventional heating systems. In contrast, electrical industrial heaters are typically used for temperatures between 100 °C (373 K) and 1800 °C (3272 K) with predictable efficiency and grid impact (Table 2). Most heavy-industrial heating processes consume considerable power and operate with heater exit temperatures of between 200 °C (food sector) and 1200 °C (e.g., industrial calcining and sintering sectors). This includes the steam and process gas heating requirements. This market is currently heavily dominated by fossil fuel heaters. Beyond 1200 °C, to about 2300 °C, the market is smaller, addressing melting, heat treating, and sintering metallurgical operations. This specialized heating sector, beyond 1200 °C, already uses electric heating. In contrast, the lower- and mid-temperature range sectors, where most of industrial thermal energy is used, typically use fossil fuel energy for heating.

Table 1.
CO2 emissions in kilograms per gigajoule of an exothermic reaction for specific fuels [38,42,43]. In comparison, electric heating typically has zero GHG emissions.
Table 2.
Typical heating element alloys and use temperatures.
Figure 1 illustrates the significant applications of industrial heaters across various sectors, where the substantial reduction of CO2 emissions that promote sustainable developments alongside novel and more energy-efficient enhanced industrial practices are feasible. These sectors include iron, steel, glass, cement, aluminum, polymers, stucco, and mineral processing, encompassing activities from drying to calcining. Additionally, key sectors where significant industrial heat is utilized encompass (a) power plants, where high-temperature heat is essential for steam turbine operations; (b) chemical production, including energy generation from wood chips, where high-temperature heat facilitates chemical reactions; (c) mineral processing, where high-temperature heat is crucial for drying, extracting valuable minerals, and refining raw materials; (d) food processing, which relies on high-temperature heat in bakeries, dairy operations, and other food sanitation industries; and (e) metalworking, where high-temperature heat is critical for melting, casting, and shaping metals.
Electrifying industrial heating processes involves the use of electric process gas heaters in higher-temperature industrial furnaces than those currently employed, including industrial steam boilers. The gamut of industrial processes is summarized in Figure 1. While advancements in battery technology, particularly those related to MW batteries, are vital for decarbonization, this article does not address the development of batteries. Life optimization, compactness, and the scalability of single-stage electric heaters to the 50 MW range and beyond, along with optimized auxiliary equipment [44,45,46], as well as the scalability of electric heaters to the 100 MW power range with enhanced auxiliary equipment such as fans, blowers, and pumps [44,45,46], are active areas of research. For context, 100 MW equals about 5000 to 10,000 average-sized electric vehicles. Large-scale MW installations may, therefore, have the most significant impact on decarbonization, whether for low-temperature, centrally produced heat for entire communities or large-scale, high-temperature industrial processes [42,47].
Several countries have set ambitious goals for reducing emissions [48]. This will necessitate a substantial increase in electrification capacity. These targets, while challenging, are achievable within the context. The U.S. has set climate goals to reduce GHG emissions below the 2005 levels by 2030, marking a move toward a sustainable future [49]. For example, assuming the U.S. accounts for approximately 13–15% of global industrial emissions, only a relatively small segment of U.S. industrial methods needs to be electrified to significantly mitigate the CO2 emissions issue [24,25,26]. A 50% reduction in emissions is widely recognized as a target [49], which will require optimizing the existing electrification capacity or adding new capacity (at least 200–500 GW). In 2023, capacity additions in the U.S. (35.8 GW) surpassed retirements (15.7 GW), with approximately 65% of the retired capacity coming from coal-fired facilities [50,51]. Although this is a positive development, the pace of change still falls short of the required conversion rate to achieve the 50% reduction in GHG. Several adjustments must be made to the electric distribution system to optimize or synchronize the available power capacity with the usage time. The development of electric and thermal batteries will undoubtedly become crucial. Regardless, the electrification of industrial heating methods, with the high energy efficiencies possible, could be a vastly financially attractive proposition, as shown in Section 3 of this article, and significantly assist in addressing the climate issue.
- (b)
- Energy Efficiency.
Thermodynamic efficiencies vary across different industrial process heaters and technologies. Measuring exergy loss and assigning a value to it for any process is one way to quantify its efficiency when a work objective (including for chemical reaction processes) is foremost, compared to a heating objective (6). However, it is often sufficient for ROI (return on investment) calculations to consider only the energy or enthalpy balances when the process objective is heating (i.e., a temperature increase objective as opposed to work creation objectives).
Energy conversion efficiency and energy productivity are closely interconnected to achieve specific objectives. When energy productivity surpasses industry growth, energy requirements decrease for various objectives, resulting in a reduction in total industrial energy-related GHG emissions [46,52,53,54,55]. High-temperature convection heating and high-temperature steam production above 900 °C, along with large kilowatt and megawatt electric heaters (see Figure 1), are essential for critical enabling technologies. This presents both technical challenges and commercial potential. Enhancing the efficiency and productivity of an industrial heater may also boost overall process efficiencies and downstream productivity, thus significantly improving GHG mitigation rates [44,56,57,58].
Energy conversion efficiency plays a crucial role in considering ROI scenarios. The energy efficiency (η) in this article is defined as [1 − (energy input − useful energy output)/energy input]. The efficiency of electrical heater systems is reflected in the socket power draw in relation to the output’s thermal objectives. For fossil-fuel heater systems, it represents the enthalpy supplied plus the combustion enthalpy released relative to the usable enthalpy after accounting for radiation and conduction losses and flue gas losses. In any industrial heater, even a simple exothermic reaction like burning natural gas requires 5–300% excess air to complete the chemical reaction and realize its full thermal potential, which makes energy inefficiency unavoidable with fossil fuel heaters [1,10,18,59,60,61,62,63]. The effects of CO2 emissions from combustion on climate change are substantial.
The overall efficiency of the process depends on the efficiencies of the individual sections. When analyzing a system with multiple components, the overall efficiency reflects the cumulative effect of each component’s efficiency; the combined effectiveness of each stage directly influences the total output of the system. Essentially, the efficiency of each stage acts as a multiplier for the output of the next stage, leading to a final overall efficiency that represents the entire system’s performance. Electrical systems generally offer high energy conversion efficiencies, whereas fossil fuel systems, even without accounting for flue gas losses, can be as low as 56% [64]. Heaters often require auxiliary control systems that can significantly affect the heater’s overall efficiency. For example, in a fossil fuel heater, the overall efficiency is ηoverall = ηburner’ηauillliary-equipment·ηthermal·ηdischarge.ηheat-exchanger. Such an overall efficiency assessment can significantly underestimate the actual efficiency, although it is common to report only the most favorable efficiency [64].
Materials development is also an active area for new semiconductor devices called SCRs (Silicon Controlled Rectifiers) and VFDs (Variable Frequency Drives), which regulate power and output in modern automated heaters. The main objective of these controls is to enhance lifespan and assist proportional controls. Regenerative and modular SCRs and VFDs offer improved efficiency and may also reduce panel wiring by sharing circuitry. Such equipment optimizes the performance of blowers and pumps. In fluid-based systems, the power demand is proportional to the cube of the motor’s speed. Even small reductions in speed result in significant energy savings. Examples of waste heat capture in the waste heat reutilization section below—Section 2 (d)—demonstrate the importance of operating at high temperatures to achieve high efficiencies. Artificial intelligence techniques could enhance grid optimization and be beneficial in new materials development, such as refractory formulations (chemistry). Insulation (refractory) materials are typically multi-elemental composites with various crystal structures and grain morphologies. The newer insulations avoid using short fibers. AI techniques may aid in discovering more effective formulations.
- (c)
- Trends in Heater Materials.
There are well-recognized limitations of high-temperature materials that can withstand higher temperatures in oxidative, reducing, and erosive atmospheres [54]. Acceptable heating materials (compositions) have upper-temperature limits of approximately 2000 K in oxidative atmospheres and about 2300 K in reducing environments (see Table 2). The key limitations of developing high-temperature heaters are like those required for jet engines and related blade and vane materials when oxidation and erosion resistance are essential [65]. The technical trends in developing materials for industrial processes [1] focus on improving materials for longer life and use at higher temperatures (>2000 K). Figure 1 illustrates typical industrial heating applications and scenarios by their use temperature in the industrial heating sector. Each sector’s needs for efficiency are met by different alloys (discussed in Table 2) as they relate to heater operations. Regardless, materials that can perform at high temperatures in air or oxidizing environments are the most suitable for enhancing efficiency, as discussed in detail in Section 4 of this article and referenced in [46,54,56,65,66,67]. The life of a heater at its use temperature decays exponentially with its closeness to its maximum use temperature, similar to an Arrhenius relationship. The stress experienced by the heater and cycling also impacts life. Several equations for such prediction are shown [68]. One of the unknowns in the applicability of such equations is estimating the activation energy; therefore, techniques like the Larsen Miller parameter [69] are employed for such determination. The new trends in materials also relate to environmentally friendly processing in specific gas environments, such as hydrogen, carbonaceous mixtures with steam, and other fluid combinations. New energy-efficient processing designs for fluid heaters, as shown in Figure 1, are utilized not only in green processes but also for existing processes, such as naphtha in petrochemical industries. Novel materials, such as enhanced silicon carbide, are now routinely employed to prevent coke formation and reduce gas emissions. High-temperature materials for hydrogen heating and their use in novel air propulsion systems or green steel production are active research areas worldwide. Novel rapid-response sensor materials and techniques are also an area of active research in materials science [70].
Almost always, the life of an industrial heater is limited by the life of its critical high-temperature components, e.g., the heating element. Consequently, life improvements that impact durability directly influence the payback periods discussed in Section 3. The higher the temperature, the faster the kinetics of a chemical or metallurgical process can occur. A heater’s effective productivity, measured as the parts made per unit time, is logarithmically related to its temperature capability [24,25,26,42,56,67]. Table 2 lists the commonly used heating materials. All the heating elements shown in this table enable the formation of highly impermeable oxide layers of Cr2O3, SiO2, or Al2O3, depending on the heater material. Therefore, nano-coatings for high heater material emissivity and erosive or oxidative life represent a key area of trending patents and research [71,72].
- (d)
- Trends in Sustainable Process Optimization and Water Savings.
Process optimization invariably involves electrification because electrical sensors and electrical control mechanisms (as opposed to fluidic control) most easily provide the ability to control electric power in response to real-time process changes. As discussed below, developing efficient ancillary equipment, flexible heater placement, and automation to enhance productivity is an area where optimization is possible, as an electrical system can be efficiently integrated to quickly manage total efficiency. An example of ancillary equipment is blowers for convective heaters. The energy used by blowers (process fluid movers) directly depends on the pressure required to maintain a steady-state gas flow (of gases such as air or hydrogen) while heating the gas, which changes its viscosity. The pressure drop can be significant in traditional electrical heaters or indirect heat exchanger systems, resulting in unnecessary energy expenditure. A high-pressure-drop requirement may necessitate the use of costly multistage blowers, which can consume significant energy for a given flow rate output. Newer electric heating processes utilize direct gas heating methods, requiring pressure drops of less than ~10 kPa for a gas flow of around 300 tons of air per hour, specifically for large 10 MW process gas heating devices.
Process optimization through integrated digital electronic controls and IoT technologies is currently a trending goal for remote monitoring and Environmental, Social, and Governance (ESG) reporting requirements. This approach enables companies to communicate their EG practices to stakeholders and emission monitoring agencies. Digitization has increased the energy consumption for information processing and frictionless process control, which is particularly feasible with electrical heating methods [, 7463, 64, 65. The impact of digitization on energy usage and its effects on climate remain unclear [73,74]. However, new process controls and EG reporting would not be feasible without digitization. This serves as a means for companies and users to demonstrate their commitment to sustainable business practices and environmental responsibility.
A direct consequence of electrification for steam generators replacing traditional fossil fuel-heated pressure boilers is that the heat-up and cool-down times are very rapid (minutes vs. hours). This feature, along with the higher steam temperatures available from steam generators, has allowed for new processes for antimicrobial steam with sterilization-level efficacy and high process steam productivity benefits [75,76]. Energy efficiency leads to water savings in steam generators, as discussed in Section 3.
- (e)
- Waste Heat Utilization.
Along with material and process improvement trends, many technical improvements are directed towards energy efficiency enhancements by recirculating heated waste gas to recover energy, e.g., flue gas waste energy, also known as retrofit technology for waste heat utilization. Waste heat is recovered as thermal energy or work. Recycling is difficult for the flue gas output from fossil fuel heater systems because the exhaust gases are no longer the original gas after the combustion process that generates the heat. Methane CH4 (natural gas) becomes CO2, H2O, and NOx, mixed with particulates (soot) after a combustion event, thus immediately losing the exergy (work potential) of the input gas and making it unsuitable for direct recirculation. However, it can still heat the incoming air. Section 3 provides numerical estimates of recycling-enhanced efficiencies. Such benefits are not significant for burners (generally about 5% improvement) but could be meaningful for the overall process (about 10–30%). The overall efficiencies of various standard heating systems are shown in Table 3. Economically feasible power augmentation from waste heat has been limited primarily to medium- to high-temperature waste heat sources (i.e., where the waste heat temperature is higher than 230 °C). Lower-temperature waste heat streams (below 100 °C) are generally not practical or economical to recover. Regardless, waste heat reclamation and recycling are practiced today wherever they can provide additional energy efficiency. Research on economies of scale and process improvement efficiency through retrofits and recycling-related energy efficiencies is widespread. This section captures some of the waste heat reclamation ideas.
Waste heat recovery involves capturing and utilizing at least the thermal energy that would otherwise be discarded during industrial operations. To achieve energy benefits, several methods and technologies are commonly considered, e.g., (a) combining heat sources and sinks within a facility to maximize heat utilization and minimize waste; (b) using heat exchangers where heat is transferred from one medium to another via a physical barrier, allowing the heat to be utilized elsewhere; (c) utilizing an organic fluid with a lower boiling point to turn waste heat into electrical power; (d) thermoelectric generation, i.e., directly converting heat into electricity using thermocouples or solid-state thermoelectric materials; (e) transforming low-quality waste heat into mechanical motion or electricity with shape-memory alloys; (f) capturing waste heat to drive steam turbines and generate electricity; (g) preheating boiler feed water using waste heat to increase boiler efficiency and reduce fuel consumption; and (h) hydronic heating, as discussed in Section 3 of this article.
Batteries, both thermal and electrical types, are helpful in recovery processes. Thermal batteries are used for thermal waste heat storage from recovered waste heat. Thermal batteries store energy at a high temperature. The discharge is at a lower temperature. The use, for example, could be in building heating or in medium-temperature polymer or aluminum processing. Figure 2b shows a diagram for heat-to-work recovery. Electric batteries (that store an electric charge or potential) store work in the form of chemical energy, discharging it again as work (electricity). A reimagining of the cycle shown in Figure 2a reveals the nature of thermal battery operation, even without a physical thermal battery, if the process is continuous. The diagram in Figure 2b shows a schematic for reheating low-temperature waste gas heat and recovering the waste energy in the form of work. Recovery of energy in the form of Work is a more versatile way of recovery but is difficult because of various technical and theoretical limitations. An example would be where the waste heat is captured for electric generation, powering lighting, or for room heating with a heat pump, or even for preheating use (Figure 2b). Here, for recovery as work, the reclaiming work from waste heat is subject to Carnot efficiency limits.
Table 3.
A compilation of electrical and fossil fuel heating efficiencies for typical industrial heaters.
Table 3.
A compilation of electrical and fossil fuel heating efficiencies for typical industrial heaters.
| Type of Industrial Heater | Energy Efficiency Range | GHG Emissions | Principles of Heating and Typical Use |
|---|---|---|---|
| Electrical systems (resistance) | Generally, 95–98%. A modern process gas heater is shown in Figure 3. | None | For heating fluids like air or water, a heater surface, which could be the heating element, transfers heat to the fluid. |
| Electrical systems (induction) | Generally, 50–90% when heating a magnetic surface that transfers heat to a fluid. Coupling efficiency is critical in induction heaters. | None | The heater surface is inductively coupled to the flow of secondary currents. This surface transfers heat to the fluid directly or via conduction to an adjacent crucible material. |
| Electrical systems (dielectric) | Generally, 50% (example: microwave). | None | A dielectric heater uses radio frequency (RF) alternating electric fields or radio waves to heat a dielectric material. |
| Direct-fired fossil fuel heaters. | The reported overall efficiencies are 30–90%. Burner efficiencies could be very low for high-temperature use. | A therm is a unit of measurement for natural gas’s thermal (heat) energy content. Burning natural gas releases approximately 5.5 Kg of CO2, NOx, SO2, particulate, and CO per therm (~29.3 kWh) energy. | A direct-fired fossil fuel heater is a heating system that generates heat by directly exposing air to an open flame created by burning a fossil fuel, such as natural gas or oil. |
| Indirect-fired fossil fuel heaters | The burner efficiency multiplied by the heat exchanger efficiency can be 30–80%. | Burning natural gas releases approximately 5.5 Kg of CO2, NOx, SO2, particulate, and CO per therm (~29.3 kWh) energy. | In an indirect-fired heater, the burner is fired into a heat exchanger. Air is heated by passing over the heat exchanger, allowing the combustion byproducts to remain within the heat exchanger, which is then exhausted through the flue. |

Figure 2.
Two possible waste-energy reuse scenarios, accompanied by flow diagrams for waste heat recovery. (a) Waste heat recovery is where work is not required from waste heat, and the thermal energy is recycled. (b) Waste heat is converted to work (and low-grade heat). The symbols in Figure 2b are defined in the text. In (b), the waste heat is available at Tw (K) and is first compressed to approximately 10 bar. Then, it is heated to a very high temperature, T2(K), which is close to a practical electric turbine inlet temperature. Work and heat can be extracted, and a low-temperature return (required for conversion to work) is at Tr, which could be the ambient temperature (Ta) or the temperature of the waste (Tw). The red box indicates the exergy utilization.


Figure 3.
A plot of the waste heat temperature (Tw) as a function of the minimum heating temperature required when the waste heat is preheated for extracting work (ideal mechanical or electrical efficiency is assumed). The 3D surface plot of the functions [(T2)2 − 600(T2) + 90000] (blue surface) and [(T2)2 − (T2).(Tw)] (red surface).The horizontal plane axes are the waste heat temperature, Tw (K) minimum preheat temperature, T2(K), required for recovering the added energy and convert to electrical or mechanical Work. The work device (heat engine/turbine) discharges to a temperature of To < Tw. For this figure, To is taken as 300 K.

Efficient reheating or waste recycling is a complicated undertaking for fossil fuel-based heating systems. Typically, gas heaters require a substantial amount of more-than-stoichiometric -air [1,10,18,59,60,61,62,63] to enable the complete combustion of the hydrocarbon fuel. The exothermic heat release heats this excess air and becomes a part of the flue gas loss. A gas heater’s overall efficiency (ηoverall) will comprise the efficiency of various stages of the burner device. Nevertheless, a few currently used systems capture some of the waste flue gas energy. Typically, reheating the incoming combustion air with exhaust (flue gas) can add only about ηburner ~5% to the efficiencies of fossil-fired heaters [18,60,61,77]. The overall efficiency gained by reheating incoming air with exhaust air is limited. For example, the overall efficiency, ηoverall = ηburner·ηthermal·ηdischarge.ηheat-exchanger, can be low: 0.7 × 0.7 × 0.85 × 0.6 = 0.25 (25%) [48,60,61,77]. Note that a 5% increase in burner efficiency with waste heat recycling would not significantly improve the overall efficiency. It would increase the overall efficiency to 26.25% from the original 25%, i.e., only an improvement of 1.05%.
Reheating can also be considered for existing electrical systems to reduce the overall energy use with a closed or near-closed loop system, similar to that shown in Figure 2a. Here, the gains are meaningful. Figure 2a shows a typical reheating process for a drying operation of powders. In such operations, the heater’s efficiency is maintained at about 95%, and waste gas recycling can be carried out if the composition remains unchanged. Thus, recycling can save additional energy by reclaiming the energy lost during furnace and material handling operations. This dramatically enhances the overall efficiency. The efficiency without reheating would have been ηoverall = ηheater.ηfurnace = 0.95 x~0.75 = 0.71 (71%). With the reclamation of waste heat by a reintroduced stream (green lines in Figure 2a), the furnace part of the efficiency may be enhanced to 0.95, resulting in an overall efficiency of ~0.90 (90%). This is an improvement of 19%.
The energy balance for Figure 2b yields a condition for relating a T2 (K) temperature required to a particular available Tw (K) temperature. However, note that several solutions to the relationship between T2 and Tw can exist depending on the energy amount under consideration. A complete energy reuse is possible if a To temperature less than the Tw (K) is available. The waste heat has an enthalpy of Hw (kJ/kg) and a temperature of Tw (see symbols definition below). Assume the mass transfer rate is dm/dt, and the specific heat is Cp. The energy entering the turbine in Figure 2b is (Hw + W1+ Q1) ~ m.Cp.(T2 − To), when calculated from a baseline To, but the excess energy added is only m.Cp.(T2 − Tw), with the rest coming from waste energy. Equation (1), plotted in Figure 3, shows the minimum heater T2 temperature where the extracted work exceeds the energy input, as discussed below (this is possible because waste heat contains energy at a temperature above the reservoir temperature). If a Carnot efficiency device is available, then in principle, the waste heat can be utilized fully. The Carnot efficiency case is analyzed below, and the several solutions to the heater exit temperature are shown in Figure 3 for any available waste heat temperature that must be efficiently converted to work. The energy out is W + (Hr + Huse) ~ m.Cp.(T2 − To). The Huse can be employed in a chemical or hydronic application for waste heat reclamation. The assumptions made to obtain the T2 temperature as a function of the waste heat temperature for plotting Figure 3, are discussed below. It should be noted that these assumptions have little influence on the solution when the waste heat recovery system operates at high powers, i.e., above 500 kW (i.e., 500 KJ/s of waste heat recovery, typically above about ~700 SCFM or ~110 Nm3/h. airflow recovery rates). The three main assumptions are (a) Q1 >> W1 (almost always the case for high kW and MW process heaters); (b) Tw approximates T1, and (c) Hr is the enthalpy at Tr approximated as Tw, i.e., after the Huse has been deployed. The theoretically achievable maximum work output is m.Cp.(T2 − To). (1 − To/T2), for an engine operating between T2 and To i.e., when the rest of the thermal energy (that part not allowed by the second law to be converted to work) is discharged to To (a reservoir). As To is lower than the Tw (or Tr); electric work in principle could be obtained that can offset thee electric work required to heat toT2. The ratio of the energy input into the process heater in Figure 2b, to the energy obtained (recovered) by work yields the condition of a minimum heating temperature for complete input heat recovery by work (electricity), as follows:
(T2 − Tw)/(q.(T2 − To)) = 1
The following symbols are used for energy and enthalpy balances to illustrate work-based waste heat utilization (Equation (1)):
Cp (kJ/kg.K) is the specific heat at constant pressure. (This is assumed to be temperature independent for the ideal solution shown in Figure 3).
Hw (kJ/kg) is the enthalpy of waste heat (above the To temperature). The waste heat is at a temperature of Tw (K).
Huse (kJ/kg) Is the enthalpy used in the hydronic plus chemical process used (see Figure 3, Figure 4 and Figure 5).
Hr (kJ/kg) is the waste heat released after the generator output is used hydronically (Figure 6). This heat is returned from the hydronic process at a temperature, Tr, and can be recycled at a lower temperature, Tw.
KE (kJ/kg) is kinetic energy, and P and V are the pressure and volume, respectively.
KE1 (kJ/kg blower/compressor-imparted kinetic energy.
m (kg) is the mass, and dm/dt (kg/s) is the mass flow rate.
Q1 (kJ/kg) is the energy added to raise the temperature from T1 (K) to T2 (K) at the heater outlet.
To or Ta (K) is the lowest ambient temperature available (assumed to be 300 K in the example below).
T1 (K) is the temperature of the air/gas that exits the compressor.
T2 (K) is the process heater’s exit temperature, which is also approximated as the turbine inlet temperature.
Tr and Tw are the return and waste heat temperatures.
W (kJ/kg) is the work output from the turbine.
W1 (kJ/kg) is the work needed to isothermally pressurize by providing energy to the compressor. This is equal to the kinetic energy and the PV energy (KE1+PV).
q = the Carnot efficiency of the turbine = (1 − To/T2).
m.Cp(tw-To) = the energy or enthalpy recovery from waste heat by direct enthalpy recovery.
The condition for recovery of waste heat energy easily follows from extending Equation (1) and requiring the work output to include the waste energy. However, it should be noted that the equation can be solved for any fixed energy amount. In Figure 3 a solution is provided with the vertical axis spanning several energy amounts. Energy (or enthalpy) is a function of Tw and T2. T2 is a function of Tw and (T2-Tw). The variation of Tw with T2 will depend on the energy value chosen. For the best work outcome, the Hr and the Huse are ideally zero for Carnot efficiencies between T2 and To as the turbine discharges to To. Equation (1) thus assumes none of the energy is used for down-process heating, i.e., l = 0, and all energy recovery is in the form of work. Should heat be required for downstream processes, it is straightforward to modify Equation (1) accordingly by adding a thermal term that modifies the numerator in Equation (1).
The main conclusion from the analysis of heat processes for recycling, as shown in Figure 2b and similar work processes, is that work recovery is possible by heating the gas from Tr to T2, as long as temperature To is lower than Tr or Tw and the reservoir is available for dumping heat.
Several devices, such as heat pumps, have been optimized for low-temperature use, where work is input into the system to move the fluid, rather than to heat it. Additionally, as implied in Figure 3, the severity of heating increases when the work-generating machines decrease in efficiency. Note that Tr and Tw are used interchangeably in these discussions. The condition in Equation (1) is the same condition that defines the inequality that the thermal energy dumped to To by the Work generating heat-engine device does not exceed the enthalpy difference for the waste heat between To and Tw temperatures for fixed mas that is circulated as shown in Figure 2b for the purposes of recovery of waste energy.
Of course, the main drawback of utilizing any waste heat in the form of an electrical or thermal energy-conserving method lies in the fact that there are no readily available Carnot-efficiency devices (i.e., the most efficient turbine theoretically) nor high temperature fans for the high-temperature gas recirculation, as these are always associated with thermal losses and high temperature seizures. Consequently, significant device and thermal inefficiencies are encountered in a practical situation. Advanced developments for better and safer refractory materials that do not contain harmful fibers (FiberFree®) (FiberFree® is a Trademark of MHI Health Devices Corporation, Cincinnati, OH, USA) are expected to become a technical research trend for materials as also low friction materials pairs at high temperatures [58].
Sustainable Electric Heating Methods for Performance Chemicals and Fuels Production (Hybrid Methods)
Considerable heating is required even to produce fossil fuels. When heating naphtha and other fuels for reaction or decomposition, the primary heating method is typically through heat exchangers [62], often utilizing a hot utility, such as steam. This raises the temperature of the fuel to the desired level for processing or combustion by utilizing its relatively low boiling point to efficiently transfer heat and ensure proper viscosity for handling and atomization in the next stage of the process. Such heating is particularly important in refineries where naphtha is a key component of gasoline production. Several electrically heated direct hot gas heating methods and new materials that prevent coking are under development. Eliminating indirect heating considerably improves energy efficiency. With indirect heating methods (heat exchangers), layers of coke may deposit on the surface walls, thus further reducing the efficiency of energy transfer. In contrast, precise temperature control is possible with electric heating, which avoids overheating or excessive vaporization that may otherwise occur. Even creating syngas (a mixture of H2 and CO, both reducing gases) or green hydrogen while eliminating CO2 is now efficient and possible with material or plasma catalysts when used with directly electrically heated gas (that runs through fluidized or particle beds in a heater gas state or ionized state).
Syngas (synthesis gas) is a mixture of hydrogen and carbon monoxide in various ratios, where electrically heated hydrogen or plasma-dissociated CO2 or steam is employed, depending on the type of reaction. Electrically heated hydrogen, or sometimes high-temperature carbon monoxide, is often used as a fuel for ore reduction [62,78,79]. Such gases may contain some carbon dioxide and methane. Alcohol and its derivatives are regularly produced through a two-step industrial process, which involves the catalytic hydrogenation of syngas into methanol (CO/CO2 + 3H2 → CH3OH + H2O). The subsequent catalytic dehydration of methanol over catalysts can produce DME (2CH3OH → CH3OCH3 + H2O), which is often considered an alternative to diesel fuel. Multi-functional catalysts can be used in scalable, electrically heated reactors. An illustration is shown in Figure 4. The hydrogen economy, which includes hydrogen production through the pyrolytic dissociation of methane (when combined with larger C-H containing molecules), is considerably aided by the availability of high temperatures at low overall system pressures.

Figure 4.
Direct heating of catalytic beds, fluidized beds, and distillation columns with electric-power-heated gas between 900 °C and 1200 °C.
Figure 4.
Direct heating of catalytic beds, fluidized beds, and distillation columns with electric-power-heated gas between 900 °C and 1200 °C.


Figure 5.
Images of the fossil fuel flame heating of (a) molds and (b) dies with gas burners. This is a typical, non-optimized, and unhealthy environment. CO2, NOx, SO2, carbon, sulfur, and ammonium particles impact both local human health and global warming [1,2,3,49]. In comparison, clean heating with electrically heated process gases, which eliminates direct flames, ensures a cleaner and more uniform die-heating process [57,66,67].


Figure 6.
Typical use scenarios for process-gas heating. Although the heating of air is shown in the chart, the same principles apply to other gases. Waste heat is utilized, as shown in Figure 2 for additional efficiency.
Figure 6.
Typical use scenarios for process-gas heating. Although the heating of air is shown in the chart, the same principles apply to other gases. Waste heat is utilized, as shown in Figure 2 for additional efficiency.

3. Payback Calculation for Investments in Efficient Heating Systems
The capital costs and payback periods of investments aimed at achieving higher energy efficiency outcomes are discussed in this section, more energy-efficient devices are typically more expensive compared to low-efficiency heaters, but they could offer a significantly better long-term return. The overall energy efficiency of fossil fuel heaters, depending on their deployment, ranges from 30% to 85% [48,59,60,61,64,66,80,81,82]. Such heaters invariably emit GHG, regardless of the burner’s efficiency. As mentioned, GHG is linked to significant global asset losses [6,36,38,83]. However, these costs are shouldered by societal groups [4,6,36,37,84], not solely by the industrial units that use them. For instance, some island nations suffer the consequences of rising sea levels, even though they are not responsible for greenhouse gas (GHG) emissions. Nevertheless, there are various reasons for selecting fossil fuels or electric methods that are unrelated to climate pollution or energy efficiency. In countries like the US, fossil fuels, such as natural gas, are typically inexpensive today, although this may change in the future. In countries like Finland, the fossil fuel supply may not be secure, and electric methods are preferred due to concerns about climate change and national security. Fossil fuel heaters (that use low-exergy fuels) generally cost less than high-exergy heaters (e.g., electric heaters) for the initial capital expenditure. However, considering only the initial cost may not be the best financial decision, as the poor efficiency of low-cost, low-efficiency heaters (see Table 3) could compromise the payback.
As discussed in other parts of this article, for any fossil fuel gas heater, there will always be a flue gas output and excess air that contributes to heating inefficiency. Figure 5a,b shows a fossil fuel-fired die-heating operation. This open-flame condition could be typical of fossil fuel heaters, adding safety concerns to the calculations presented below. Considerable energy (heat) is wasted in this process through radiation and with the emitted flue gas, which carries waste energy with it. Besides efficiency improvements, electric heaters eliminate emissions of CO2 and CO2-equivalent gases, such as CH4, SO2, NOx, and particulate matter. Should climate pollution by GHG be taxed by society, such a taxation disincentive would be another way to justify using electric heaters [4,6,37,84,85]. The energy efficiency of a process is a key measure in choosing an economical heater system. First, a few straightforward examples are presented to highlight the importance of efficiency gains in financial calculations for process gas heaters.
For aluminum smelting and refining, the furnaces used for primary aluminum production are most often direct fossil fuel heating types. The energy conversion efficiency is as low as ~13% in such high-dross furnaces. Such efficiencies can easily increase to over 95%, even with traditional electric heating. A 1 MW electric system will prevent 0.25–0.6 tons of CO2 per hour from being emitted if it replaces a fossil fuel heater. Replacing a 5 MW burner (a typical burner size employed for aluminum melting) with a 1.2 MW electric heater will save 76% of the energy [77,86]. Even if the electric energy price is 1.5 the fossil energy price (applying the multiplier to the fossil energy price), the price of equivalent fossil energy, there are approximately three times the savings just in energy costs per year with the conversion. Because of the efficiency and climate mitigation potential, efficient electric heaters have become a part of all new process development (such as using hot hydrogen to make green steel) technologies. Electric resistance heaters (Table 2 and Table 3) offer the best overall efficiencies, generally exceeding 95% for well-built and properly managed processes.
The overall efficiency of an electrical induction heating method [84] can be determined by multiplying the efficiency (η) of each stage that comprises the heating process (supply, thermal, and coil). The overall efficiency is ηoverall = ηsupply·ηthermal·ηcoil. Here, ηsupply accounts for losses in cables, power factor correction capacitors, and frequency conversion equipment; the thermal efficiency, ηthermal, represents thermal losses from the workpiece, which is critically dependent on the operating temperature, quality of thermal insulation, and method of operation of the heater; and ηcoil is the coil efficiency that depends on the AC frequency, induction coupling, magnetic susceptibility, and the ratio of the perimeter of the coil to the substrate. Even if all of these were 0.9 (90% efficient), the overall efficiency could not exceed 0.729 (72.9%).
Similarly, a gas heater’s overall efficiency (ηoverall) will comprise several terms. It can only be determined by multiplying the efficiency of various stages, namely, ηburner·ηthermal·ηdischarge.ηheat-exchanger. Here, the ηburner is the combustion burner efficiency that depends on excess air, burner construction, adequate containment, burner radiation losses, the burner’s quality of combustion, and the humidity of the oxidant gas. The ηthermal captures radiation and other heat losses from the furnace chamber, not including the flue gas losses; ηdischarge is a range of loss processes that could contain terms that include the enthalpy loss in the combusted air (including flue gas losses); ηheat-exchanger is the efficiency of the heat exchanger for indirect heating (a practice that is followed when the combustion gases cannot be allowed to encounter the chemicals being heated or dried directly or cannot be allowed to pollute the plant). Even if these were 0.9 (90% efficient) individually, the overall efficiency could not exceed 0.65 (65%). For example, heat-exchanger efficiencies are rarely that high. They could be more like 50%, placing the overall efficiency closer to a low 40% for gas (fossil fuel) heating systems.
Figure 5 shows a commonly experienced, unsafe open radiation condition and gas discharge, typical of fossil fuel heating. Such open flame heaters are not unusual to deploy when only the capital price is considered for a heater or when precise calculations have not been made regarding long-term financial paybacks, climate pollution, or safety concerns. Figure 6 illustrates a flow diagram for a more controlled, electrically heated process gas heater suitable for various applications, including hydronic systems, electric power generation, and chemical processes. A quick note to consider is that the overall efficiency and speed of heating will always depend on the Tout temperature (the effective heater exit temperature), whether for direct heating for thermal purposes, for a work output that is related to turbine efficiency, or when considering productivity from a chemical kinetics viewpoint [15,56,67,87]. Processes that provide higher uniformity at high temperatures with the highest conversion efficiency will offer the best overall value [9,10,11,24,25,26,30,70].
There are three ways to improve energy efficiency in industrial heaters: (i) by utilizing well-built and well-insulated machinery that converts and delivers thermal energy (heat) without much loss of heat, (ii) by improving the efficiency of the final objective, and (iii) by methods that directly utilize waste heat without degrading it or recycle waste heat into work (electric energy). To improve the overall energy efficiency, (i) change to an electric heating process, (ii) increase the Tout temperature capability, and (iii) recirculate any waste heat that is dissipated after the process objectives.
All new greenfield and green initiative innovative manufacturing processes, such as hydrogen reduction for clean steel production or clean molecular cracking methods, will likely be designed or modified to minimize thermal energy losses and optimize process control with digital methods. While this seems logical today, nearly all large-power heater processes from the past were not designed with energy efficiency in mind. The calculations below illustrate how energy conversion affects investment decisions in electric heating methods.
If electric heaters are to be deployed quickly as a substitute for fossil-fired heaters, they must offer attractive payback economics. Such payback can come from better heater efficiency (generally close to 95% or better with resistance electric heating, sometimes exceeding 100%). Electric heaters are often resistance-type heaters (see Table 2) and efficiently transform electric energy (work) into thermal energy (heat) that can be used directly without the need for intermediary heat exchangers. Only the methods shown in Table 2 and Figure 1 are suitable for large-scale industrial electric heating applications that require temperatures exceeding 100 °C.
Heaters can have a wide range of initial and operational costs depending on their construction, location of use, temperature, and other control features. The payback depends on energy efficiency and productivity, which include the heater’s performance, such as the achievable temperature, size, or manpower required to operate and maintain the equipment. Energy efficiency enhances the payback period, which is one method of calculating the benefits of investing in any energy-efficient process compared to a lower-cost, lower-efficiency process [61,77]. Equation (2) calculates the Net Present Value (NPV) of an energy-efficient investment. Here, the NPV is an additional investment (−I0) that exceeds an investment in a low-efficiency, low-cost fossil fuel heater.
NPV = −I0 + ∑t(Δ(CF) (1 + i))−t)
Δ(CF) reflects the cash flow benefits from improved efficiency and other savings. In Equation (2), the symbol i represents the discount rate, and t denotes the number of years the machine is expected to operate before a significant equipment overhaul becomes necessary.
In the U.S., the cost of the natural gas delivered varies by location and other factors. However, the average cost per therm is USD 0.95, or USD 9.52 per MMBTU (293 kWh). CAPEX (capital-related costs) and OPEX (operation-related costs) are shown in Table 3 and Table 4. Current commercial interest rates range from about 7% to 20% in the U.S. The discount rate is assumed to be 10% for the payback calculations shown in Table 4 and Table 5. These calculations are highly conservative because the discount rates considered are high and emissions costs are low. The U.S. EPA [85] has suggested using USD 190 for CO2, USD 1600 for CH4, and USD 54,000 for NOx per metric ton emitted in 2023 with a 2% discount rate. We have used a 10% discount rate and a climate cost of USD 283 per ton [6], which adds approximately USD 0.1/kWh to the cost of natural gas-based fossil fuel energy. A four-year investment period is under consideration. An online payback calculator is available in Reference [88]. This calculator was used to assess various scenarios with and without climate costs, varying energy costs, and varying discount rates.
Table 4.
Payback Scenario 1. A comparison of the costs associated with an electric and an alternate, lower-efficiency fossil fuel heater. A total use of 2600 h is considered. The energy price per kWh equivalent of fossil fuel (delivered) is assumed to be equal (USD 0.1/kWh) to the price of electrical energy. Climate costs add USD 0.1/kWh to fossil fuel energy. The electric unit is rated at 100 kW, and the fossil-fuel unit is rated at 180 kW, based on the energy efficiency differences.
Table 5.
Scenario 2. A comparison of the costs associated with an electric and an alternate fossil fuel heater. A total use of 2600 h is considered. The energy price per kWh of fossil fuel (delivered) is assumed to be half the price of electrical energy. The climate cost adds USD 0.1USD /kWh to fossil fuel energy. The electric unit is 1000 kW, and the fossil-fuel unit is 1800 kW, based on the energy efficiency differences.
Two scenarios (NPV and Payback Period Calculator [89]) for payback are examined and shown in Table 3 and Table 4. The more efficient electric equipment is approximately 40% more expensive [90,91] than the less efficient alternative (this estimate concurs with the fact that high-power, high-temperature equipment is not yet as common nor manufactured at the same rate as its fossil fuel counterpart). Electric equipment is typically 90% energy efficient compared to the alternative equipment (fossil fuel), for which the energy efficiency is typically 50%.
The assumptions for Table 4 and Table 5 are based on the energy efficiency differences discussed in the text and the References [48,59,60,61,64,66,80,81,82].
| Scenario 1 | KW Rating | KWH Cost |
| Efficient Unit | 100 | USD 0.10 |
| Alternate (B) * | 180 | USD 0.10 |
| Scenario 2 | ||
| Efficient Unit | 1000 | USD 0.10 |
| Alternate (B)* | 1800 | USD 0.05 |
| Emissions-related costs | USD 0.10 | |
| * Efficient heater efficiency 90%, alternate B efficiency 50%; equipment costs and alternate equipment costs are based on feedback and information received by the author [91]. | ||
In Scenario 1 (Table 4), the assumed energy costs for both energy sources are the same (USD 0.10/kWh, typical in the US Midwest regions). In this example, a 100 kW electric heater replaces a 180 kW fossil-fuel heater, resulting in an additional investment of $5000. The additional investment, as noted in Table 4, is recovered within the first year.
Scenario 2 (Table 5) compares a larger investment with significantly different fuel costs. The unit energy cost of the fossil fuel is half that of the electric heater. In this example, higher emissions-related costs are offset by the potential savings from choosing the electric option. The climate costs could be GHG penalties, taxes, or locally offered mitigation-related incentives. The payback period is again within the first year. Even without the added emissions costs, the payback period is under 6 years in Scenario 2.
Different scenarios with varying energy costs and discount rates demonstrate a robust return on investment (ROI). The savings from improved energy efficiency are compelling in most cases, as the returns appear attractive. It is generally accepted that high-efficiency electric heaters last longer than low-efficiency ones. For example, fossil-fuel heaters always have nozzles that deteriorate, while electric heaters do not require nozzles. Nevertheless, the calculations for the payback periods in the two scenarios assume similar lifespans for the heaters. The additional benefit from a higher life will add to the ROI. Although this article did not attempt a detailed sensitivity analysis, multiple scenarios were examined.
Energy efficiency can lead to a more productive life cycle by optimizing energy use throughout the product’s lifespan. A more productive life cycle always results from higher energy efficiency. The enhanced efficiencies from high-temperature heaters lead to significant productivity increases [56,67,87] and a longer life cycle. Similarly, LED lights exemplify the relationship between productivity and energy efficiency. While LED manufacturing requires more energy than traditional incandescent bulbs, LED lights use significantly less energy during their operational lifespan, resulting in net energy savings over their entire life cycle.
One of the most extensive uses of industrial heating is in the steam generator sector (traditionally known as the steam boiler industry). High-temperature steam is utilized for comfort heating, sanitation, the controlled drying of textiles, consumer packaging (shrink packaging), curing concrete, soy production, antimicrobial applications, food processing, food safety, meat tenderization, milk processing, laundry, skincare, the pyrolysis–gasification of municipal waste, and other applications. Industrial systems consume a significant amount of steam, not all of which can be recycled. Traditionally, steam was generated by fossil fuel-heated pressure boilers, which are usually inefficient and produce saturated steam laden with water droplets, resulting in considerable losses in energy and water management efficiencies. New superheated steam generators can create steam with no liquid water content in the steam gas [75,76]. Consequently, less water and energy are required for many steam operations. A comparison of a shrink tunnel packaging operation that can utilize either a conventional electric pressure vessel boiler or an electric steam generator for energy and water savings is provided in Table 6 from Reference [76]. Table 7 presents a historical perspective on the evolution of pressure boilers into more modern electric steam generators. Given the various features mentioned in Table 7, the electric steam generator offers an opportunity to accomplish the same objectives while using significantly less water and energy than conventional pressure vessel boilers. The degree of the beneficial impact of such water savings may depend on regional water availability.
Table 6.
Efficient one-atmosphere electric steam generator and electric conventional boiler OPEX comparison for shrink packaging [76].
Table 7.
Brief History of Steam Generation from Boilers to Steam Generators. Credit MHI Inc. Reproduced with permission.
- The savings estimated do not include the requirements of certifications, possible production benefits from higher steam temperatures, higher throughput, or quality.
- The recovery of the cost of an efficient electric steam generator typically takes under one year.
4. Radical Innovation: The Impact on Sustainability
Section 1, Section 2 and Section 3 above examined the impact of energy efficiency and CO2eq emission reduction in electrical heating processes, as well as the payback economics of climate-centric innovations. Following key ideas by Dismukes [52], radical innovation processes can lead to disruptive industrial changes [19,44,45,53,72]. A radical innovation is the creation of new products, services, or processes in an industry or market. It often challenges established practices and norms and can replace inefficient systems and processes. Radical industrial heater innovations encompass a series of inventions that save energy by improving downstream processes to achieve the same objectives as older, traditional processes but with significantly improved efficiencies [17,19,31,55,62,92,93,94,95,96,97,98,99,100,101].
Although not thoroughly examined as a fundamental scientific principle, various self-organization mechanisms driven by the maximization of entropy generation rates across multiple length scales may play a role in radical innovation processes, from processing to final use [17,44,53,100,102,103]. This new paradigm was briefly explored in an article [17] for the possibility of entropy generation rate maximization as a principle that governs self-similar or self-organized patterns that can lead to various forms of optimization [104,105,106,107,108], including that of flight formations for energy conservation [106] or friction-controlling asperities/phases that reduce pair friction and wear [17,58]. No clear methods have been recognized for payback scenarios when such innovations are considered for process imporovemts. However, the same principle of entropy rate maximization could be used to maximize the work output rate [17,106] per unit of energy expended; hence, exergy techniques [109] for financial benefit could be considered for financial payback calculations. When the problem becomes multiscale, computational methods beyond entropy rate maximization can be employed for modeling an optimized outcome [73,74].
This section briefly discusses one such process where Ro-Vib (Rotational–Vibrational) EION-activated plasma plumes can significantly reduce manufacturing energy, wear, or catalysis actions. Some previously unpublished results from the process are presented in Appendix A, along with supporting evidence from recently published articles by independent international research groups. The EION process is used for the surface modification of commonly used items, some of which are illustrated in Figure A1 (Appendix A) [17,31,55,92,93,94,95,96,97,98,99]. The EION process utilizes the unique thermal properties of Ro-Vib plasmas with activated species, requiring only air and an electrical input [95,110,111,112]. This process was initially developed to address energy and productivity challenges faced in surface nitriding applications, where material wear and energy loss due to high friction are of significant concerns. The importance of the EION nitriding process lies in its avoidance of energy-intensive ammonia gas decomposition, complete ionization, or cracking to release nascent nitrogen onto the steel surface. Instead, it employs extremely low power to produce Ro-Vib-activated species that seemingly can meet nitriding requirements.
The EION plume species shown in Figure A1 (Appendix A) can provide rapid surface nitriding, particularly on iron and iron alloys, by directly impinging it on a surface requiring hardening or other property improvements. The plume interaction times are in the order of seconds for obtaining hard and low-friction surfaces. The time taken for conventional nitride processing is several hours (a closed chamber is required in traditional nitriding processes, both gas and microwave plasma-assisted conventional nitriding processes). In conventional closed-chamber processes, the parts that require nitriding (typically gears, shafts, and valves) are arranged inside a large chamber that can only be emptied or filled very slowly. The EION is an open plume process where the parts are exposed to the plume only for a few seconds. Productivity and energy savings benefits are significant with the EION method, assuming a part is treated every 3 s in the EION plume. Significant energy savings are gleaned when a batch of ten tool bits can be treated in a 10 kW EION beam at a time (Figure 1A in Appendix A). Based on thermal and energy studies [18,58,89,96,113,114,115,116,117,118], the beam-power density of an open directable plume (Ro-Vib plasma plume) from a 10 KW electrical input yields plumes with a power density of ~106 to 109 W/m2. This power exceeds even the most powerful concentrated continuous laser beams. The beam size is large (compared to focused lasers), thus permitting a large impact area on the surface. No electrodes are bombarded or degraded, unlike in arc and microwave plasma nitriding systems. The EION plasma plume can utilize air or a benign gas, such as nitrogen, for plume production.
Typical 200 kW power-consuming, conventional nitriding machines require a minimum of 3 h of total operation. Such conventional nitriding machines can simultaneously treat about 100–200 parts (albeit over several hours). As the EION is an open beam, a part changeover can occur within 30 s in continuous mode, e.g., on a moving mesh belt. The total energy use decreases from 600 kWh (assuming 3 h of treatment with conventional techniques) to 0.13 kWh (10 kW EION machine and 5–20 s exposure time). This implies a ~36X productivity benefit in time. Assume both processes require one or two people at an aggregate rate of USD 80/h for the labor rate. The conventional nitriding process will, therefore, cost approximately USD 2–USD 6 per part, whereas EION offers a cost of approximately USD 0.08–USD 0.16 per part. This is a significant saving in addition to the almost 300% energy savings per manufactured part, which translates to climate emissions savings, as noted in the introduction sections of this article.
Appendix A presents several previously unpublished nitrided properties of surfaces exposed to the EION beam. The hardness of many steel alloys increases by over 50% after just 5 to 20 s of exposure to the plume (as shown in Table 1A, Appendix A). This increase is due to the formation of nanoscale nitrides and oxynitrides. The increase in hardness is at least comparable to that achieved through the conventional nitriding process. For high-strength steels containing molybdenum, hardness rises from a Nano Vickers Hardness of Hv = 800 to Hv = 1300 with only 15 s of exposure to a 10 kW beam, as illustrated in Table 1A of Appendix A. When the EION process was first patented and disclosed, there was considerable concern regarding the presence of nitrogen in a process that took only a few seconds to complete. This concern was later addressed by careful X-ray photoelectron spectroscopy, which confirmed the presence of nitrogen. Short exposures with the Ro-Vib EION-activated plasmas can create several Fe-N phases and carbon–nitrogen bonds, as shown in Figure A2a and Figure A2b, respectively.
The new processing approach offers additional downstream benefits, particularly in terms of the coefficient of friction. Reducing the coefficient of friction (COF) significantly enhances efficiency, especially in tool bit usage and automotive components. Approximately 23% of the world’s total energy consumption (exceeding 575 Exajoules per year) results from tribological contacts [55]. About 20% of this energy (around 114 Exajoules per year) is used to overcome friction, while roughly 3% (about 17 Exajoules per year) is designated for remanufacturing worn parts and spare equipment. Appendix A, Figure A4 illustrates that the COF benefits could reach up to 50%. Improved tribological technologies are anticipated to reduce harmful emissions by as much as 1460 MT globally for energy production [55]. The effect of low friction on the climate is explored in detail in several studies [30,31,55,58,78,97,98,99,101,119,120]. Traditional nitrogen ion nitriding parts exhibit a COF of approximately 0.38 whereas new technologies offer 0.1 to 0.15 as shown in Appendix A.
The COF for the treated surfaces is ~0.15 (Figure A3 in Appendix A), indicating a drop of approximately 60% compared to similar treatments using conventional processes with base steel, which is a low-cost steel compared to the current higher-price nitridable steels. The COF almost always increases in conventional nitriding processes compared to untreated surfaces, unless a secondary smoothing operation is performed. Based on limited studies, secondary operations can be avoided when EION technology is utilized.
All these features make the EION process one of the most efficient energy-converting and high-productivity plasma devices for enhancing metal surfaces, establishing it as a groundbreaking, radically innovative technology for heaters. Such innovations offer dramatic energy savings during a process and significant energy efficiencies in downstream processes. For example, tool bits conditioned by such technologies can halve the drilling time, improve the drilled hole characteristics, and dramatically increase productivity [97].
Such novel Ro-Vib plasma heater devices have an impact beyond surface treatment, e.g., they can be used in glass bending, casting irons, and aluminum melting [97] (see Figure 7). Any dross savings in the aluminum melting sector lead to substantial energy savings for both primary and secondary melting. Due to the creation of Ro-Vib activated species, the output activated air gas from the EION can be used instead of an expensive inert or nitrogen gas cover during aluminum melting processes, resulting in reduced dross formation. Although the energy-efficient aluminum melting of 0.2 kWhr/lb is routinely possible with electrically heated aluminum melting, the low dross and clean atmosphere are significant benefits of the EION source in aluminum processing [113]. The savings from dross reduction, regardless of climate costs, are significant. For example, if the price of 1 metric ton of aluminum is ~USD 1000, a 2% savings in dross leads to USD 20 in savings per metric ton of aluminum. Most small-scale aluminum plants process about 10 tons a day per furnace. Assume one year has 200 working days; this equals 2000 tons a year per furnace. The savings per year are USD 40,000 with 2% dross savings. It is common for a gas-fired furnace to make as much as 8–10% of dross. This means the corresponding savings in the lost dross would be about 8–10% by weight for a 10-ton-per-day aluminum furnace, approximately US$160,000 to US$200,000 per year. This is another example of radical innovation.
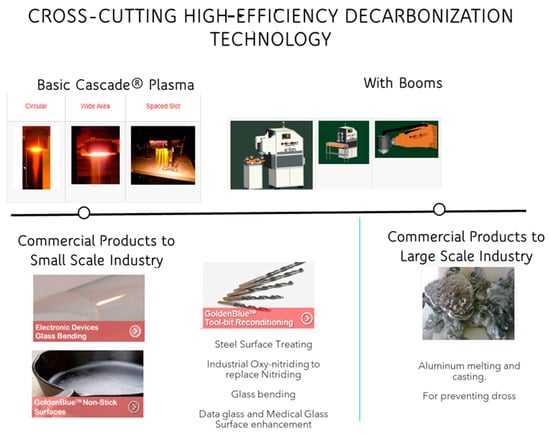
Figure 7.
Types of applications for the EION plasma. The picture collage is made from images provided by MHI Inc. for products that utilize Ro-Vib heating technology and is used with permission.
5. Practical Implementation and Policy Implications: Incentives, Adoption Barriers and Early Adopters
Energy-intensive industries include ore drying/calcination, general-purpose heat treating, cement, aluminum, steel, chemicals, fuels, and fertilizers, which rely on fossil fuels or flame-heating methods. There is significant interest in replacing CO2-emitting combustion fuels for thermal energy production with electrical heating methods [1,2]. Achieving 0% CO2 emissions from industrial processes and improving energy efficiency by at least 25% compared to fossil fuel heating methods for all electrical substitutions is now the fastest path to decarbonization. As presented in this article, there seems to be little doubt that enhancing industrial heating efficiency through electrification and process improvements is vital for addressing the climate crisis, as this will substantially boost energy efficiency and consequently reduce the large and growing energy demand for critical manufacturing needs. The CO2 equivalent [13] from all GHG emissions is tied to asset loss [6,36,121,122,123,124,125]. Taxes or cap-and-trade systems impose a financial cost on emissions, encouraging businesses to lower their carbon footprint [121,122,124,125]. Their financial implications could be significant for payback calculations, as illustrated in Table 4 and Table 5.
Favorable regulations and declining equipment costs in similar energy-intensive sectors have led to a significant increase in renewable energy capacity in recent years [34,126,127]. Incentives for electrification, such as tax credits or subsidies for electric vehicles and equipment, aim to accelerate the shift away from fossil fuels. Undoubtedly, such policies have been effective [20,128]. There is little doubt that these subsidies should also be encouraged for high-efficiency industrial heating, as similar policies appear to have spurred innovation in lighting and, to some extent, in domestic and commercial heating [127]. However, the unintended consequences of some climate policies could temporarily increase emissions [34,125,128]. Based on the results presented in this article, any tax incentive scheme would be more effectively applied to addressing CO2 emissions from industrial heaters and industrial processes than to electricity production, particularly because the projected demand for all types of electricity production is expected to grow [21,22].
Given the overall benefits to climate and manufacturing entities, it is unclear why the switch to electric heating has not been more rapid (Table 4, Table 5 and Table 6). The water savings described above could be significant to some dry regions [90,129]. Large high-power electrical industrial heaters are the most cost-effective solution for mitigating GHG emissions, as their costs typically range from USD 500 to USD 1000 per kW of heating power, compared to USD 2000 to USD 5000 per kW for electric vehicles [36,86,90]. There has been more focus on carbon sequestration and battery chargers than on the efficiency advantages offered by electric heating methods. Consequently, more investment has been made in the transport and electric generation sectors, leading to the increasing adoption of electric vehicle chargers and heat pumps, as new programs targeting electric vehicles and heat pumps for buildings have emerged [130].
The domestic heating sector has not always prioritized clear energy efficiency advantages, even as it transitions away from fossil fuel heaters to electric heaters [40,41]. However, this is a low-power market (~10 kW). Therefore, the scrutiny of energy efficiency has not always been thorough, as climate issues were often viewed solely as a benefit. The industrial heating sector, in comparison, has high power usage (100 kW to 100 MW) compared to domestic and commercial heaters. Electric energy pricing will influence industrial product pricing, as noted in Table 4 and Table 5. Energy efficiency has considerable advantages for the industrial sector.
There appears to be a lack of a broad understanding of the significant productivity benefits that can be achieved by employing high temperatures, as is well known in several industrial sectors [56,87,124,131]. Electrification and related controls typically offer the possibility of very high, controlled temperatures. The adoption of clean policies has also led to an increase in overall innovation [128,130,131,132]. Lower costs enhance industrial competitiveness, making the adoption of clean, energy-efficient technologies essential in countries with high labor costs. There appear to be no significant technical barriers to the electrification of process heaters. The span is illustrated in Figure 2 [124], particularly after extremely compact, low-voltage (LV) offerings, grid-connected at 400 V, 480 V, 600 V, and 690 V, have become available (as opposed to the potentially unsafe medium voltage (MV) offerings (e.g., 2300 V, 4600 V, and above). Additionally, there is the promise of radically new methods that save enormous energy use, some discussed in Section 4 above. Early adopters appear to be in the 650 °C to 1100 °C temperature range [75,90,91], particularly for process gas heaters.
6. Summary and Conclusions
Industrial heating is a crucial manufacturing sector where anthropogenic greenhouse gas (GHG) emissions have not yet been fully addressed. This article focuses on electrification as a practical solution to reduce emissions and significantly increase energy efficiency. Lowering the rate of GHG emissions will decrease the frequency of high-impact climate events [12].
A process heater plays a vital role in industry and represents a significant investment. Energy efficient electric process heaters are the quickest way to decarbonize on a scale that profoundly affects climate change while offering compelling returns on any new investment.
Author Contributions
Conceptualization, A.A.V. and J.A.S.; methodology, A.A.V. and J.A.S.; formal analysis, A.A.V. and J.A.S.; investigation, A.A.V. and J.A.S.; resources, A.A.V.; data curation, A.A.V. and J.A.S.; writing, A.A.V. and J.A.S. All authors have read and agreed to the published version of the manuscript.
Funding
This research received no external funding.
Institutional Review Board Statement
Not applicable.
Informed Consent Statement
Not applicable.
Data Availability Statement
Data is contained within the article.
Conflicts of Interest
The authors declare personal engagement with a thermal energy source provider, MHI Inc., and a relationship with the University of Cincinnati regarding several ongoing energy projects. The funders had no role in the design of the study; in the collection, analysis, or interpretation of the data; in the writing of the manuscript; or in the decision to publish the results.
Appendix A. Some of the Known EION Process Results
Typical EION plumes are shown in Figure A1a. These are not combustion flames, but rather activated or energized species (air) that discharge with no combustion or GHG products. The plume length is about 150 mm. The typical parts that can be made of nitride are shown in Figure A1b. A comparison of the surface hardness of untreated and treated steels is shown in Table A1. A compilation of their surface chemistry and performance data after EION processing in air is shown in Appendix A (Figure A1, Figure A2, Figure A3 and Figure A4). The bullets compare hardness, the coefficient of friction, and surface chemistry using XPS (X-ray photoelectron spectroscopy) and EDAX (energy-dispersive X-ray analysis). The evidence for nitrogen was gathered from multiple steel surfaces with XPS (X-ray photoelectron spectroscopy) and EDAX measurements. In the 15 s treated surfaces of several low-alloy steels, SAE52100, AISI304, AISI4140, and HSS (M2), the EDAX-measured nitrogen content was approximately ~2 wt% (~6 at%). The results in Figure A2 are from EION-treated HSS M2 steel-grade drill bits. The EION-treated surface forms nano-asperities [97], which is unusual when compared to conventionally nitrided surfaces. The overall microstructure differs from conventional nitriding microstructures, where nitrogen is mostly retained in the subsurface phase (called the alpha casing). It is believed that the hard asperities are the reason for the unusually low and stable coefficient of friction (COF), as shown in Figure A3. In the aqueous corrosion results reported by Deshpande et al. [92], a composite layer of iron oxides and complex nitrides generated during cascade EION treatment protects the steel by inhibiting the transport of reacting species. The superhydrophobic surface topography of the treated steel appears to contribute to the overall corrosion protection. The surface chemistry, as determined by XPS and EDAX data, is shown in Figure A2. The coefficient of friction as a function of distance (time) is shown in Figure A3, and the potentiodynamic polarization of untreated steel, plasma-nitrided steel, and cascade EION surface-treated steel [92] is shown in Figure A4. The corrosion rate for treated steels decreased from 2.44 mpy for the untreated steel to 1.87 mpy for the conventional plasma-nitrided samples and 0.09 mpy for the EION-treated sample, with their corrosion current densities being 16.61 µA/cm2, 2.99 µA/cm2, and 0.08 µA/cm2 for the untreated, plasma-nitrided, and EION-plume-treated surfaces, respectively [92].

Figure A1.
The EION plume and typical parts that require surface treatment. (a) On the left is the plume, and (b) on the right shows typical treated parts. Credit MHI Inc. Reproduced with permission.
Figure A1.
The EION plume and typical parts that require surface treatment. (a) On the left is the plume, and (b) on the right shows typical treated parts. Credit MHI Inc. Reproduced with permission.


Figure A2.
EDAX and XPS data for typical alloys, (a) for Ti-6Al-4V (Element Wt% N 13%, O 15.4%, Al 5.5%, Ti 59%, and V 2.6%—a biomedical use alloy. In iron alloys, the evidence for nitrogen was gathered from multiple steel surfaces with XPS (X-Ray Photoelectron Spectroscopy) and EDAX measurements. In 15s treated surfaces of several low alloy steels, SAE52100, AISI304, ASIS4140 and HSS (M2), the EDAX measured nitrogen content was approximately ~2wt% (~6 at%). (b) XPS signature after surface treating a diamond-studded nickel-based tool to show the development of C1N and C2N, and possibly sp3 bonds (inset shows the typical XPS signals for such bonds).


Figure A3.
A comparison of the coefficient of friction measured with a Pin and Disc, Coefficient of Friction (COF) machine. Credit: private communications with S. Deshpande, Cummins Corporation (Indiana, USA, and Pune, India Divisions). The original work is by S. Deshpande, Ph.D., thesis, with most data published in Reference [92].


Figure A4.
A comparison of the potentiodynamic polarization of untreated steel, plasma-nitrided steel, and cascade EION surface-treated steel [92]. Reproduced with the author’s permission.
Figure A4.
A comparison of the potentiodynamic polarization of untreated steel, plasma-nitrided steel, and cascade EION surface-treated steel [92]. Reproduced with the author’s permission.

Table A1.
A comparison of the hardness of untreated and treated steels. Measurements made by Vickers hardness machines. Credit: private communications with S. Deshpande, Cummins Corporation (Indiana, USA, and Pune, India Divisions). The original work is by S. Deshpande, unpublished Ph.D. thesis, SBU Pune University, 2024, published in reference [92].
| Hardness | Untreated, Hv. | EION-Exposed Hv (Exposure Time) |
|---|---|---|
| Pure Iron IF grade | 154 | 249 (40 s) |
| HSS (typical) | 800, 864 | 1287 (15 s), 1300 (15 s) |
References
- US DOE Industrial Decarbonization Roadmap. 2022. Available online: https://www.osti.gov/servlets/purl/1961393 (accessed on 10 June 2025).
- Energy Transitions Commission. Mission Possible: Achieving Net-Zero Carbon Emissions from Harder-to-Abate Sectors. November 2018. Available online: https://www.energy-transitions.org/publications/mission-possible (accessed on 10 June 2025).
- Saygin, D.; Gielen, D. Zero-Emission Pathway for the Global Chemical and Petrochemical Sector. Energies 2021, 14, 3772. Available online: https://www.mdpi.com/1996-1073/14/13/3772 (accessed on 10 June 2025). [CrossRef]
- Cho, R. Social Cost of Carbon: What Is It, and Why Do We Need to Calculate It? Available online: https://news.climate.columbia.edu/2021/04/01/social-cost-of-carbon/ (accessed on 10 June 2025).
- Cresko, J.; Rightor, E.; Carpenter, A.; Peretti, K.; Elliott, N.; Nimbalkar, S.; Iii, W.R.M.; Hasanbeigi, A.; Hedman, B.; Supekar, S.; et al. U.S. Department of Energy’s Industrial Decarbonization Roadmap; EERE: Washington, DC, USA, 2022. [Google Scholar] [CrossRef]
- Moore, F.C.; Drupp, M.A.; Rising, J.J.; Dietz, S.; Rudik, I.; Wagner, G. Synthesis of evidence yields high social cost of carbon due to structural model variation and uncertainties. Proc. Natl. Acad. Sci. USA 2024, 121, e2410733121. [Google Scholar] [CrossRef]
- Available online: https://nca2023.globalchange.gov/ (accessed on 20 December 2024).
- Dwivedi, Y.K.; Hughes, L.; Kar, A.K.; Baabdullah, A.M.; Grover, P.; Abbas, R.; Wade, M. Climate change and COP26: Are digital technologies and information management part of the problem or the solution? An editorial reflection and call to action. Int. J. Inf. Manag. 2022, 63, 102456. [Google Scholar] [CrossRef]
- Kuang, Y.; Fan, Y.; Bin, J.; Fan, M. Impact of the digital economy on carbon dioxide emissions in resource-based cities. Sci. Rep. 2024, 14, 16514. [Google Scholar] [CrossRef] [PubMed]
- Available online: https://www.un.org/en/climatechange/science/causes-effects-climate-change (accessed on 31 December 2024).
- Available online: https://www.epa.gov/climate-indicators/greenhouse-gases (accessed on 4 January 2025).
- Sekhar, J.A. An Entropy Generation Rate Model for Tropospheric Behavior That Includes Cloud Evolution. Entropy 2023, 25, 1625. [Google Scholar] [CrossRef]
- Available online: https://www.epa.gov/ghgemissions/global-greenhouse-gas-overview (accessed on 10 June 2025).
- Available online: https://sustainability.stanford.edu/news/global-carbon-emissions-fossil-fuels-reached-record-high-2023 (accessed on 4 January 2025).
- Decarbonizing Industrial Heat to Face Climate Change. Available online: https://www.adlittle.com/en/insights/report/decarbonizing-industrial-heat-face-climate-change (accessed on 10 June 2025).
- Kornhuber, K.; Bartusek, S.; Seager, R.; Schellnhuber, H.J.; Ting, M. Global emergence of regional heatwave hotspots outpaces climate model simulations. Proc. Natl. Acad. Sci. USA 2024, 121, e2411258121. [Google Scholar] [CrossRef]
- Sekhar, J.A. Self-Organization, Entropy Generation Rate, and Boundary Defects: A Control Volume Approach. Entropy 2021, 23, 1092. [Google Scholar] [CrossRef] [PubMed]
- Available online: https://www.energy.gov/sites/prod/files/2014/05/f16/check_burner_air2.pdf (accessed on 10 June 2025).
- Available online: https://www.epa.gov/ghgemissions/inventory-us-greenhouse-gas-emissions-and-sinks (accessed on 10 February 2025).
- Martins, E.C.S.; Lépine, J.; Corbett, J. Assessing the effectiveness of financial incentives on electric vehicle adoption in Europe: Multi-period difference-in-difference approach. Transp. Res. Part A Policy Pract. 2024, 189, 104217. [Google Scholar] [CrossRef]
- Moss, T.; Kincer, J. How Does Energy Impact Economic Growth? An Overview of the Evidence. Available online: https://energyforgrowth.org/article/how-does-energy-impact-economic-growth-an-overview-of-the-evidence (accessed on 4 January 2025).
- Available online: https://ember-energy.org/app/uploads/2024/05/Report-Global-Electricity-Review-2024.pdf (accessed on 16 May 2025).
- Available online: https://thebulletin.org/2022/09/plagued-by-failures-carbon-capture-is-no-climate-solution (accessed on 14 December 2024).
- Available online: https://www.carbonbrief.org/analysis-which-countries-are-historically-responsible-for-climate-change/ (accessed on 4 January 2025).
- Available online: https://edgar.jrc.ec.europa.eu/report_2024 (accessed on 4 January 2025).
- Available online: https://www.energy.gov/eere/iedo/articles/transformative-pathways-us-industry-unlocking-american-innovation (accessed on 4 January 2025).
- Wu, L.; Wang, P.; Zhang, Q.; Ren, H.; Shi, Z.; Hu, W.; Chen, J.; Xie, Q.; Li, L.; Yue, S.; et al. Dominant contribution of combustion-related ammonium during haze pollution in Beijing. Sci. Bull. 2024, 69, 978–987. [Google Scholar] [CrossRef]
- Clarisse, L.; Clerbaux, C.; Dentener, F.; Hurtmans, D.; Coheur, P.-F. Global ammonia distribution derived from infrared satellite observations. Nat. Geosci. 2009, 2, 479–483. [Google Scholar] [CrossRef]
- Pardo, M.; Li, C.; Zimmermann, R.; Rudich, Y. Health impacts of biomass burning aerosols: Relation to oxidative stress and inflammation. Aerosol Sci. Technol. 2024, 58, 1093–1113. [Google Scholar] [CrossRef]
- Balcilar, M.; Agan, B. On the Impact of Climate Change Policies on the Clean Technology Innovation: Evidence from Patent Data Analysis. Environ. Clim. Technol. 2023, 27, 850–863. [Google Scholar] [CrossRef]
- Scheuer, C.J.; Zanetti, F.I.; Cardoso, R.P.; Brunatto, S.F. Influence of process temperature on phase formation in plasma nitrided AISA 420 steel. In Proceedings of the 22° CBECiMat—Congresso Brasileiro de Engenharia e Ciência dos Materiais, Natal, RN, Brasil, 6–10 November 2016; pp. 10138–10150. [Google Scholar]
- Blattner, C.E.; Finger, R.; Ingold, K. Nature, Comments. 2025. Available online: https://www.nature.com/articles/d41586-025-00222-z (accessed on 4 January 2025).
- Stechemesser, A.; Koch, N.; Mark, E.; Dilger, E.; Klosel, P.; Menicacchi, L.; HAchtigall, D.; Pretis, F.; Ritter, N.; Schwarz, M.; et al. Climate policies that achieved major emission reductions: Global evidence from two decades. Science 2024, 385, 884–892. [Google Scholar] [CrossRef]
- Jensen, S.; Mohlin, K.; Pittel, K.; Sterner, T. An Introduction to the Green Paradox: The Unintended Consequences of Climate Policies. Rev. Environ. Econ. Policy 2015, 9, 246–265. [Google Scholar] [CrossRef]
- Available online: https://research.noaa.gov/no-sign-of-fossil-fuel-pollution-peak-as-the-world-falls-further-behind-climate-targets/ (accessed on 10 June 2025).
- Available online: https://en.wikipedia.org/wiki/Social_cost_of_carbon (accessed on 28 November 2024).
- Available online: https://www.epa.gov/sites/default/files/2014-12/documents/the_social_cost_of_carbon_made_simple.pdf (accessed on 10 June 2025).
- US Environmental Protection Agency (EPA). Report on the Social Cost of Greenhouse Gases Estimates Incorporating Recent Scientific Advances, Final 2023 Report. 2023. Available online: https://www.epa.gov/system/files/documents/2023-12/epa_scghg_2023_report_final.pdf (accessed on 10 June 2025).
- Available online: https://www.reuters.com/sustainability/new-york-fine-fossil-fuel-companies-75-billion-under-new-climate-law-2024-12-26/ (accessed on 10 June 2025).
- Winskel, M.; Heptonstall, P.; Gross, R. Reducing heat pump installed costs: Reviewing historic trends and assessing future prospects. Appl. Energy 2024, 375, 124014. [Google Scholar] [CrossRef]
- Meyer, D.; Schoetter, R.; van Reeuwijk, M. Energy and environmental impacts of air-to-air heat pumps in a mid-latitude city. Nat. Commun. 2024, 15, 5474. [Google Scholar] [CrossRef]
- Available online: https://mhi-inc.com/decarbonization-project-costing-analysis-energy-efficiency/ (accessed on 10 June 2025).
- Available online: https://www.forestresearch.gov.uk/tools-and-resources/fthr/biomass-energy-resources/reference-biomass/facts-figures/carbon-emissions-of-different-fuels (accessed on 14 December 2024).
- Zhang, H.; de Nora, V.; Sekhar, J.A. Materials used in the Hall-Heroult cell for aluminium production. In The Minerals; Metals and Materials Society TMS: Washington DC, USA, 2003. [Google Scholar]
- Tuganova, R.; Permyakova, A.; Kuznetsova, A.; Rakhmanova, K.; Monzul, N.; Uvarov, R.; Kovtun, E.; Budennyy, S. Relationships between patenting trends and research activity for green energy technologies. arXiv 2022, arXiv:2210.09611v1. [Google Scholar]
- Connelly, M.C.; Sekhar, J.A. U. S. energy production activity and innovation. Technol. Forecast. Soc. Change 2012, 79, 30–46. [Google Scholar] [CrossRef]
- Available online: https://interestingengineering.com/energy/world-largest-co2-seawater-heat-pump (accessed on 10 June 2025).
- Available online: https://www.epa.gov/energy/greenhouse-gas-equivalencies-calculator-calculations-and-references (accessed on 30 November 2024).
- Available online: https://www.noaa.gov/education/resource-collections/climate/climate-change-impacts (accessed on 10 June 2025).
- Available online: https://www.eia.gov/todayinenergy/detail.php?id=9671 (accessed on 13 December 2024).
- Available online: https://cleanpower.org/news/market-report-2023/ (accessed on 13 December 2024).
- Dismukes, J.P. Information Accelerated Radical Innovation from Principles to an Operational Methodology. Ind. Geogr. 2005, 3, 19–42. [Google Scholar]
- Betz, F. Managing Technological Innovation: Competitive Advantage from Change, 2nd ed.; John Wiley & Sons: Hoboken, NJ, USA, 2003. [Google Scholar]
- Asby, M.F.; Jones, D.R.H. Engineering Materials 1; Elsevier: New York, NY, USA, 2012; ISBN 978-0-08-096665-6. [Google Scholar]
- Holmberg, K.; Erdemir, A. Influence of tribology on global energy consumption, costs, and emissions. Friction 2017, 5, 263–284. [Google Scholar] [CrossRef]
- Sekhar, J.A.; Yeramalli, C.; Dismukes, J. Linking Productivity Analysis and Innovation for Materials and Energy—A Common Platform Approach. Global Roadmap for Ceramic and Glass Technology; Freiman, S.W., Singh, M., Fischman, G.S., Hellmann, J., Logan, K., Coyle, T., Hobbs, L., Smith, J.D., Sideridis, C., Green, M., et al., Eds.; Wiley: Hoboken, NJ, USA, 2007; p. 143. ISBN 978-0-470-10491-0. [Google Scholar]
- Connelly, M.C.; Dismukes, J.P.; Sekhar, J.A. New relationships between production and patent activity during the high-growth life cycle stage for materials. Technol. Forecast. Soc. Change 2011, 78, 303–318. [Google Scholar] [CrossRef]
- Sekhar, J.A. Tunable Coefficient of Friction with Surface Texturing in Materials Engineering and Biological Systems. Curr. Opin. Chem. Eng. 2018, 19, 94–106. [Google Scholar] [CrossRef]
- Fu, M.; Staples, K.; Sarvepalli, V. A High-Capacity Melt Furnace for Reduced Energy Consumption and Enhanced Performance. JOM 1998, 50, 42–44. [Google Scholar] [CrossRef]
- Jaluria, Y. Design and Optimization of Thermal Systems; International Edition; The McGraw-Hill Companies: New York, NY, USA, 1998. [Google Scholar]
- Mickey, S.R. Efficient Gas Heating of Industrial Furnaces. Thermal Processing, 20 January 2017; Web Version. Available online: https://thermalprocessing.com/efficient-gas-heating-of-industrial-furnaces/ (accessed on 10 June 2025).
- O’Connor, J.; Noble, B.; Lieuwen, T. (Eds.) Renewable Fuels: Sources, Conversion, and Utilization; Cambridge University Press: Cambridge, UK, 2022. [Google Scholar]
- Available online: https://www.engineeringtoolbox.com/fuels-combustion-efficiency-d_167.html (accessed on 16 May 2025).
- Available online: https://www.energy.gov/energysaver/furnaces-and-boilers (accessed on 16 May 2025).
- Schafrik, R.; Sprague, R. Superalloy Technology–A Perspective on Critical Innovations for Turbine Engines. Key Eng. Mater. 2008, 380, 113–134. [Google Scholar] [CrossRef]
- Basu, B.; Jana, S.; Reddy, G.S.; Sekhar, J.A. Simulating convective die heating for forgings and pressure casting. JOM 2002, 54, 39–43. [Google Scholar] [CrossRef]
- Singh, A.K.; Saptharishi, S.; Basu, B.; Sekhar, J.A. The influence of heating element temperature on productivity. JOM 2002, 54, 76–80. [Google Scholar] [CrossRef]
- Available online: https://encyclopedia.pub/entry/20557 (accessed on 3 May 2025).
- Available online: https://en.wikipedia.org/wiki/Larson%E2%80%93Miller_relation## (accessed on 3 May 2025).
- Balakrishnan, V.; Phan, H.-P.; Dinh, T.; Dao, D.V.; Nguyen, N.-T. Thermal Flow Sensors for Harsh Environments. Sensors 2017, 17, 2061. [Google Scholar] [CrossRef]
- Reddy, G.; Sekhar, J. Materials Having an Enhanced Emissivity and Methods of Making the Same. International Patent Publication Number WO 2007/114852, 7 November 2006. [Google Scholar]
- Kim, K.S.; Seo, S.; Kwon, J.; Lee, D.; Kim, C.; Ryu, J.-E.; Kim, J.; Suh, J.M.; Jung, H.-G.; Jo, Y.; et al. Growth-based monolithic 3D integration of single-crystal 2D semiconductors. Nature 2024, 636, 615–621. [Google Scholar] [CrossRef]
- Liu, B.; Lu, W. Surrogate models in machine learning for computational stochastic multi-scale modelling in composite materials design. Int. J. Hydromechatronics 2022, 5, 336–365. [Google Scholar] [CrossRef]
- Liu, B.; Lu, W.; Olofsson, T.; Zhuang, X.; Rabczuk, T. Stochastic interpretable machine learning based multiscale modeling in thermal conductivity of Polymeric graphene-enhanced composites. Compos. Struct. 2024, 327, 117601. [Google Scholar] [CrossRef]
- Available online: https://mhi-inc.com/steam-applications/ (accessed on 10 June 2025).
- Available online: https://bayzi.com/steam-cleaning-studies/ (accessed on 10 June 2025).
- Götze, U.; Northcott, D.; Schuster, P. Investment Appraisal—Methods and Models; Springer: Berlin/Heidelberg, Germany, 2010. [Google Scholar]
- Chaoji, P.; Martinsuo, M. Creation processes for radical manufacturing technology innovations. J. Manuf. Technol. Manag. 2019, 30, 1005–1033. [Google Scholar] [CrossRef]
- Fan, Z.; Friedmann, S.J. Low-carbon production of iron and steel: Technology options, economic assessment, and policy. Joule 2021, 5, 829–862. [Google Scholar] [CrossRef]
- Dismukes, J.P.; Sekhar, J.A. Innovation in Materials Science; Trans Tech Publications: Zurich, Switzerland, 2008; pp. 1–250. Available online: https://www.torrossa.com/en/resources/an/5370068 (accessed on 16 June 2025).
- Sekhar, J.A.; Penumella, S.; Fu, M. Novel Heaters for Thermal Processing; Ravindra, R., Singh, R.K., Eds.; TMS: Warrendale, PA, USA, 1966; pp. 171–175. [Google Scholar]
- Perry, T.D., IV; Miller, M.; Fleming, L.; Younge, K.; Newcomb, J. Clean Energy Innovation: Sources of Technical and Commercial Breakthroughs; BiblioGov: Columbus, OH, USA, 2011. [Google Scholar] [CrossRef][Green Version]
- Bledsoe, J.; Homrighausen, K.; Detrich, J. EPA Releases Updated, Elevated Estimates for the Social Cost of Greenhouse Gases, Posted in Air Quality and Climate Change. 25 January 2024. Available online: https://www.globalelr.com/2024/01/epa-releases-updated-elevated-estimates-for-the-social-cost-of-greenhouse-gases/#_edn1?DocketIDNo.EPA-HQ-OAR-2021-0317 (accessed on 10 June 2025).
- Available online: https://www.thermopedia.com/content/874/ (accessed on 29 November 2024).
- Sarinsky, M.; Weatherford, K. Greenhouse Gases an Overview. May 2024. Available online: https://policyintegrity.org/files/publications/SCCGHG_Overview_Policy_Brief_vF.pdf (accessed on 10 June 2025).
- Available online: https://mhi-inc.com/energy-savings-environmental-benefit-and-increased-productivity-with-the-dro-cascade-e-ion-source/ (accessed on 27 November 2024).
- Evans, G.; Hutchinson, J.W.; Hutchinson, R.G.; Sugimura, Y.; Lu, T.J. Technical Cost Framework for High-Temperature Manufacturing of Small Components and Devices. J. Am. Ceram. Soc. 1998, 81, 815–836. [Google Scholar] [CrossRef]
- Available online: https://www.calculator.net/payback-period-calculator.html (accessed on 10 June 2025).
- Kim, Y.M.; Kim, J.U.; Han, J.G. Investigation on the pulsed DC plasma nitriding with optical emission spectroscopy. Surf. Coat. Tech. 2002, 151, 227–232. [Google Scholar] [CrossRef]
- Sekhar, J.A. Rapid solidification and surface topography for additive manufacturing with beam surface heating. Curr. Opin. Chem. Eng. 2020, 28, 10–20. [Google Scholar] [CrossRef]
- Vissa, A.A. (Cincinnati, OH, USA). Private Communication, 2025.
- Deshpande, S.S.; Deshpande, P.P.; Rathod, M.J. Cascade e-Ion Plasma: A Novel Technique for Enhancing Corrosion Resistance of Medium Carbon Low Alloy Steel. JOM 2023, 32, 268–276. [Google Scholar]
- Sekhar, J.A.; Connelly, M. Thermal Plasma Treatment Method. U.S. Patent # 9643877, 9 May 2017. [Google Scholar]
- Kalchayanand, N.; Wang, R.; Brown, T.; Wheeler, T.L. Efficacy of Short Thermal Treatment Time Against Escherichia coli O157:H7 and Salmonella on the Surface of Fresh Beef. J. Food Prot. 2023, 86, 100040. [Google Scholar] [CrossRef]
- Available online: https://mhi-inc.com/aluminum-melting-furnace-enhancement-for-low-dross// (accessed on 10 June 2025).
- Rajamani, V.; Anand, R.; Reddy, G.S.; Sekhar, J.; Jog, M.A. Enhancement of Heat Transfer Due to Plasma Flow in Material Processing Applications. In Proceedings of the ASME 2005 International Mechanical Engineering Congress and Exposition, Heat Transfer, Part B, Orlando, FL, USA, 5–11 November 2005; pp. 889–893. [Google Scholar] [CrossRef]
- Available online: https://mhi-inc.com/cascade-e-ion-devices-the-most-efficient-plasma-process-for-a-variety-of-applications-in-metals-ceramics-glass-and-plastics/ (accessed on 4 January 2025).
- Dalcin, R.L.; Rocha, A.d.S.; de Castro, V.V.; Oliveira, L.F.; das Neves, J.C.K.; da Silva, C.H.; Malfatti, C.d.F. Influence of Plasma Nitriding with a Nitrogen Rich Gas Composition on the Reciprocating Sliding Wear of a DIN 18MnCrSiMo6-4 Steel. Mater. Res. 2021, 24, 20200592. [Google Scholar] [CrossRef]
- Dobrocky, D.; Pokorny, Z.; Studeny, Z.; Van Doan, T. Analyse of Tribological Properties of Layers Created by Plasma Nitriding + DLC. Manuf. Technol. 2018, 18, 379–386. [Google Scholar] [CrossRef]
- Budlayan, M.L.M.; Bermundo, J.P.S.; Solan, J.C.; Ilasin, M.D.; Guerrero, R.A.; Uraoka, Y. Droplet-Scale Conversion of Aluminum into Transparent Aluminum Oxide by Low-Voltage Anodization in an Electrowetting System. Langmuir 2025, 41, 184–192. [Google Scholar] [CrossRef]
- Available online: https://www.un.org/en/climatechange/science/climate-issues/water (accessed on 14 February 2025).
- Abernathy, W.J.; Wayne, K. Limits of the Learning Curve. Harvard Business Review, 1 September 1974; 109–119. Available online: https://hbr.org/1974/09/limits-of-the-learning-curve (accessed on 16 June 2025).
- Flemings, M.C. Solidification Processing; McGraw-Hill Book Company: New York, NY, USA, 1974; p. 423. [Google Scholar]
- Prigogine, I. Introduction to Thermodynamics of Irreversible Processes, 3rd ed.; Interscience Publishers: New York, NY, USA, 1967. [Google Scholar]
- Ziegler, H. An Introduction to Thermomechanics; North-Holland Publ. Co.: Amsterdam, The Netherlands, 1977. [Google Scholar]
- Sekhar, J.A. An Entropic Model for Assessing Avian Flight Formation. arXiv 2022, arXiv:2204.03102. [Google Scholar] [CrossRef]
- Vita, A. Beyond Linear Non-Equilibrium Thermodynamics. In Non-Equilibrium, Thermodynamics; Lecture Notes in Physics; Springer: Cham, Switzerland, 2022; Volume 1007. [Google Scholar] [CrossRef]
- Martyushev, L.M.; Nazarova, A.S.; Seleznev, V.D. On the problem of the minimum entropy production in the nonequilibrium stationary state. J. Phys. A 2007, 40, 371. [Google Scholar] [CrossRef]
- Wall, G. Exergy–A Useful Concept Within Resource Accounting; Report no. 77–42; Institute of Theoretical Physics, Chalmers University of Technology and University of Göteborg: Göteborg, Sweden, 1977. [Google Scholar]
- Laveroni, E.; Pfender, E. A unified approach to plasma-particle heat transfer under non-continuum and non-equilibrium conditions. Int. J. Heat Mass Transf. 1990, 33, 1497–1509. [Google Scholar] [CrossRef]
- Hader, M.A.; Jog, M. Continuum plasma flow past a sphere. Phys. Plasmas 1998, 5, 902–909. [Google Scholar] [CrossRef]
- Reddy, G.; Sekhar, J. Mid Temperature Plasma Device. U.S. Patent # 6816671 B1, 9 November 2004. [Google Scholar]
- Reddy, G.S.; Jog, M.; Sekhar, J.A. Innovation with Low-Ionization Plasma Sources for Enhanced Aluminum Processing. Key Eng. Mater. 2008, 380, 209–225. [Google Scholar] [CrossRef]
- Sekhar, J. Industrial Heating Apparatus and Method Employing Fermion and Boson Mutual Cascade Multiplier for Beneficial Material Processing Kinetics. U.S. Patent 10,677,493, 9 June 2020. [Google Scholar]
- van de Steeg, A.W.; Butterworth, T.; van den Bekerom, D.C.M.; Silva, A.F.; van de Sanden, M.C.M.; van Rooij, G.J. Plasma activation of N2, CH4 and CO2: An assessment of the vibrational non-equilibrium time window. Plasma Sources Sci. Tech. 2020, 29, 115001. [Google Scholar] [CrossRef]
- Sharma, M.K.; Saikia, B.K.; Phukan, A.; Ganguli, B. Plasma nitriding of austenitic stainless steel in N2 and N2–H2 dc pulsed discharge. Sur. Coat. Tech. 2006, 201, 2407–2413. [Google Scholar] [CrossRef]
- Schwede, J.W.; Sarmiento, T.; Narasimhan, V.; Rosenthal, S.; Riley, D.; Schmitt, F.; Bargatin, I.; Sahasrabuddhe, K.; Howe, R.; Harris, J.; et al. Photon-enhanced thermionic emission from heterostructures with low interface recombination. Nat. Commun. 2013, 4, 1576. [Google Scholar] [CrossRef]
- Fisher, T.S.; Walker, D.G. Thermal and Electrical Energy Transport and Conversion in Nanoscale Electron Field Emission Processes. J. Heat Transfer Trans. ASME 2002, 124, 954–962. [Google Scholar] [CrossRef][Green Version]
- Aydin, H.; Bayram, A.; Topçu, Ş. Friction Characteristics of Nitrided Layers on AISI 430 Ferritic Stainless Steel Obtained by Various Nitriding Processes. Mater. Sci. 2013, 19, 19–24. [Google Scholar] [CrossRef]
- Bhasker, S.V.; Kudal, H.N. Tribology of nitrided-coated steel-a review. Arch. Mech. Technol. Mater. 2017, 37, 50–57. [Google Scholar] [CrossRef]
- Available online: https://thema.u-cergy.fr/IMG/pdf/2025-02.pdf (accessed on 10 June 2025).
- de Mooij, R.A.; Keen, M.; Parry, I.W.H. Fiscal Policy to Mitigate Climate Change; International Monetary Fund: Washington, DC, USA, 2012; ISBN 9781616353933. [Google Scholar] [CrossRef]
- Available online: https://www.wri.org/insights/4-charts-explain-greenhouse-gas-emissions-countries-and-sectors, (accessed on 4 May 2025).
- Available online: https://mhi-inc.com/mhi-products-and-company-overview-for-deep-decarbonization/ (accessed on 13 June 2025).
- Rennert, K.; Errickson, F.; Prest, B.C.; Rennels, L.; Newell, R.G.; Pizer, W.; Kingdon, C.; Wingenroth, J.; Cooke, R.; Parthum, B.; et al. Comprehensive evidence implies a higher social cost of CO2. Nature 2022, 610, 687–692. [Google Scholar] [CrossRef] [PubMed]
- Available online: https://www.irena.org/News/pressreleases/2023/Aug/Renewables-Competitiveness-Accelerates-Despite-Cost-Inflation#2023 (accessed on 4 May 2025).
- Available online: https://www.mckinsey.com/~/media/mckinsey/dotcom/client_service/Sustainability/PDFs/US_energy_efficiency_full_report.pdf# (accessed on 3 May 2025).
- Gowrishankar, V.; Levin, A. America’s Clean Energy Frontier: The Pathway to a Safer Climate Future; Natural Resources Defense Council: New York, NY, USA, 2017; Available online: www.nrdc.org/resources/americas-clean-energy-frontier-pathway-safer-climate-future (accessed on 3 May 2025).
- Available online: https://www.sciencedirect.com/special-issue/10GL7C3KRSX (accessed on 14 June 2025).
- Nadel, S. Electrification in the Transportation, Buildings, and Industrial Sectors: A Review of Opportunities, Barriers, and Policies. Curr. Sustain. Renew. Energy Rep. 2019, 6, 158–168. [Google Scholar] [CrossRef]
- Campagnola, G.; Sergi, B.S.; Sironi, E. Attitudes Towards Climate Change and Energy Demand: Evidence from the European Social Survey. Sustainability 2025, 17, 4661. [Google Scholar] [CrossRef]
- Idil, G.; Bolatan, S.; Giadedi, A.; Daim, T. Innovation leadership through technology transfer: Case of Turkish industry. Technol. Soc. 2022, 68, 101909. [Google Scholar] [CrossRef]


Disclaimer/Publisher’s Note: The statements, opinions and data contained in all publications are solely those of the individual author(s) and contributor(s) and not of MDPI and/or the editor(s). MDPI and/or the editor(s) disclaim responsibility for any injury to people or property resulting from any ideas, methods, instructions or products referred to in the content. |
© 2025 by the authors. Licensee MDPI, Basel, Switzerland. This article is an open access article distributed under the terms and conditions of the Creative Commons Attribution (CC BY) license (https://creativecommons.org/licenses/by/4.0/).