Article

The Green Effect of Digital Intelligence in Chinese Cities: An Empirical Investigation Based on Big Data and Machine Learning Methods

1
School of Economics and Management, Changsha University of Science & Technology, Changsha 410076, China
2
School of Economics and Trade, Hunan University, Changsha 410079, China
*
Author to whom correspondence should be addressed.
Sustainability 2025, 17(15), 6728; https://doi.org/10.3390/su17156728
Submission received: 5 June 2025 / Revised: 16 July 2025 / Accepted: 18 July 2025 / Published: 24 July 2025

Abstract

In the digital economy era, digitalization and intelligent technologies have profoundly influenced regional green development. This study uses data from 277 prefecture-level and above cities in China spanning the years 2011 to 2022 and employs a two-way fixed effects model along with machine learning techniques to explore the effect of digital intelligence on regional green development. We find that digital intelligence primarily drives regional green development. Positive impacts show a steady upward trend from 2011 to 2022 and predominate in eastern regions, large cities, and non-resource-dependent cities, while adverse effects are more prevalent in small and resource-dependent cities. Effect magnitude scales with green development levels, exhibiting monotonic amplification. Mechanism tests indicate that digital intelligence improves regional green development by promoting green technological innovation, advancing the industrial structure, and strengthening environmental protection.

1. Introduction

With global green development agendas rising, the transformation of green productivity faces many challenges. These include the need to increase the efficiency of the implementation of environmental policies, the imbalanced regional green innovation capabilities, and the stark negative environmental externalities linked to traditional production modes. New approaches to tackling these issues are made possible by the development of digital intelligence technologies. Furthermore, the 2024 government work report of China proposed for the first time the implementation of the “Artificial Intelligence+” initiative, with an emphasis on raising the level of urban digital intelligence (https://www.gov.cn/yaowen/liebiao/202503/content_7013163.htm?s_channel=5&s_trans=7824452999_ accessed on 23 July 2025). The extensive application of digital technologies, including the Internet of Things and big data, facilitates accurate monitoring of energy consumption and emissions during the production process. Artificial intelligence algorithms optimize resource allocation, thereby enhancing the efficiency of green technology innovation. It will reconstruct environmental governance systems with transparent and traceable mechanisms by using blockchain and other trust technologies. The enabling mechanisms of digital intelligence technologies break through the spatiotemporal limitations of traditional environmental governance and promote innovative green development models via market-oriented allocation of data elements. Therefore, this article aims to investigate the effects and mechanisms through which digital intelligence contributes to green effects, offering insight for advancing urban digital intelligence transformation, achieving carbon peaking and neutrality goals, and fostering high-quality economic development.
Literature on digital intelligence and green development primarily addresses three aspects. Firstly, researchers explore digital intelligence and its economic effects. The definitions of digital intelligence emerge from the viewpoint of technological innovation (Vial, 2019) [1]. Digital intelligence encompasses the enhancement of intelligent, digital, and networked levels of economy and society through the profound integration of digitalization and intelligence. This process relies on cooperation, collaboration, and sharing of data elements and digital technologies, utilizing “5 G+Industrial Internet” and artificial intelligence technologies (Kraus et al., 2022) [2]. Few studies directly measure the level of digital intelligence. Scholars mainly adopt three distinct methods to measure digitalization or intelligence separately. The indicator method employs the ratio of enterprise investment in information technology or intangible assets to measure digital transformation and uses industrial robot density to measure intelligence level (Zou et al., 2024) [3]. The assignment method employs dummy variables to identify whether enterprises have experienced digital or intelligent transformation (Ferreira et al., 2020) [4]. The text analysis method integrates definitions and policy documents to summarize characteristic word data pools, employing web crawling technology to analyze enterprise annual reports (Mao, 2025) [5]. The economic effects of digital intelligence indicate that digital technologies facilitate knowledge management, thereby improving the identification, transformation, and application of tacit knowledge as well as organizational efficiency (Cheng et al., 2025) [6]. Digital intelligence enhances resource allocation and integration efficiency, facilitates the effective flow of data elements, and strengthens enterprises’ innovation capabilities, resilience to disruption, and green development capabilities (Su and Wu, 2024) [7]. The enhancement of corporate governance is notable, as it mitigates information asymmetry, irrational managerial decision-making, and audit costs (Xin et al., 2024) [8].
Secondly, researchers investigate green development and its driving factors. Green development denotes the process of economic development aimed at achieving intensive energy and resource utilization, minimizing pollutant emissions, and enhancing production efficiency (Georgeson et al., 2017) [9]. Recent studies on the measurement of green development include the indicator construction method, model-based approaches, and Data Envelopment Analysis (DEA). (1) The indicator construction method utilizes pollution emission levels (Marrucci et al., 2024) [10] or develops comprehensive indices based on economic, resource environment, and transformation support dimensions [11,12,13,14]. (2) Model-based approaches involve the use of mathematical models, such as system dynamics and input-output models, to simulate and predict trends in economic green development [15]. Wu and Chen (2024) utilized the Input-Output Analysis method to assess economic green development in the Yangtze River Delta region [16]. (3) Scholars employ DEA methods to assess the economic, environmental, and social green development performance across provinces in China by evaluating the relative efficiency of decision-making units [17,18,19]. Cheng et al. (2024) identify technological innovation as a key factor in enhancing green productivity [20]. Researchers indicate that manufacturing enterprise digitalization, industrial structure optimization and adjustment, tax system greening, enhanced embedding in the Global Value Chain (GVC), environmental technology standards, and financial development can significantly promote industrial green transformation [21,22,23,24]. However, existing financial regulatory policies may impede the transition to net-zero carbon emissions, which is detrimental for green transformation (Gasparini et al., 2024) [25].
Thirdly, researchers examine the effects of digital intelligence on green development. Digital transformation has achieved information sharing, knowledge accumulation, and resource orchestration (Xu et al., 2024) [26]. Ensuring the smooth development of innovation activities addresses the operational cost dilemmas and technological breakthrough challenges encountered by manufacturing or heavily polluting enterprises during green transformation (Dong et al., 2024) [27]. Digital transformation has the potential to decrease energy intensity and facilitate green transformation (El-Kassar and Singh, 2019) [28]. Artificial intelligence technologies provide technical support for enterprises’ automatic decision-making, production, feedback, and supervision. They not only replace human labor (Cioffi et al., 2020) [29] but also facilitate human–machine collaboration (Kromann et al., 2020) [30], thus advancing industrial green transformation. However, some scholars argue that the relationship between digital intelligence and green growth is not inherently linear. Studies focusing on China and countries along the Belt and Road Initiative (BRI) suggest that artificial intelligence can either facilitate green growth or demonstrate a U-shaped relationship (Yang et al., 2025; Feng et al., 2024; Zhao et al., 2022) [31,32,33]. In resource-dependent cities, the adverse effects of technological change on GTFP were more pronounced (Li and Ouyang, 2020) [34]. Currently, researchers lack consensus on the relationship between digital intelligence and regional green development.
Existing research has explored various aspects of digital intelligence measurement and its economic effects, the drivers of green development, and the impact of digital intelligence on industrial green development. Nonetheless, some gaps remain. On the one hand, current research primarily assesses the digitalization and intelligence development levels in micro-enterprises, with limited studies integrating both aspects. Furthermore, there is a scarcity of direct measurements of regional-level digital intelligence utilizing big data and machine learning methodologies. On the other hand, studies on green development drivers primarily focus on the influence of technological or environmental factors, with limited research addressing the role of digital intelligence.
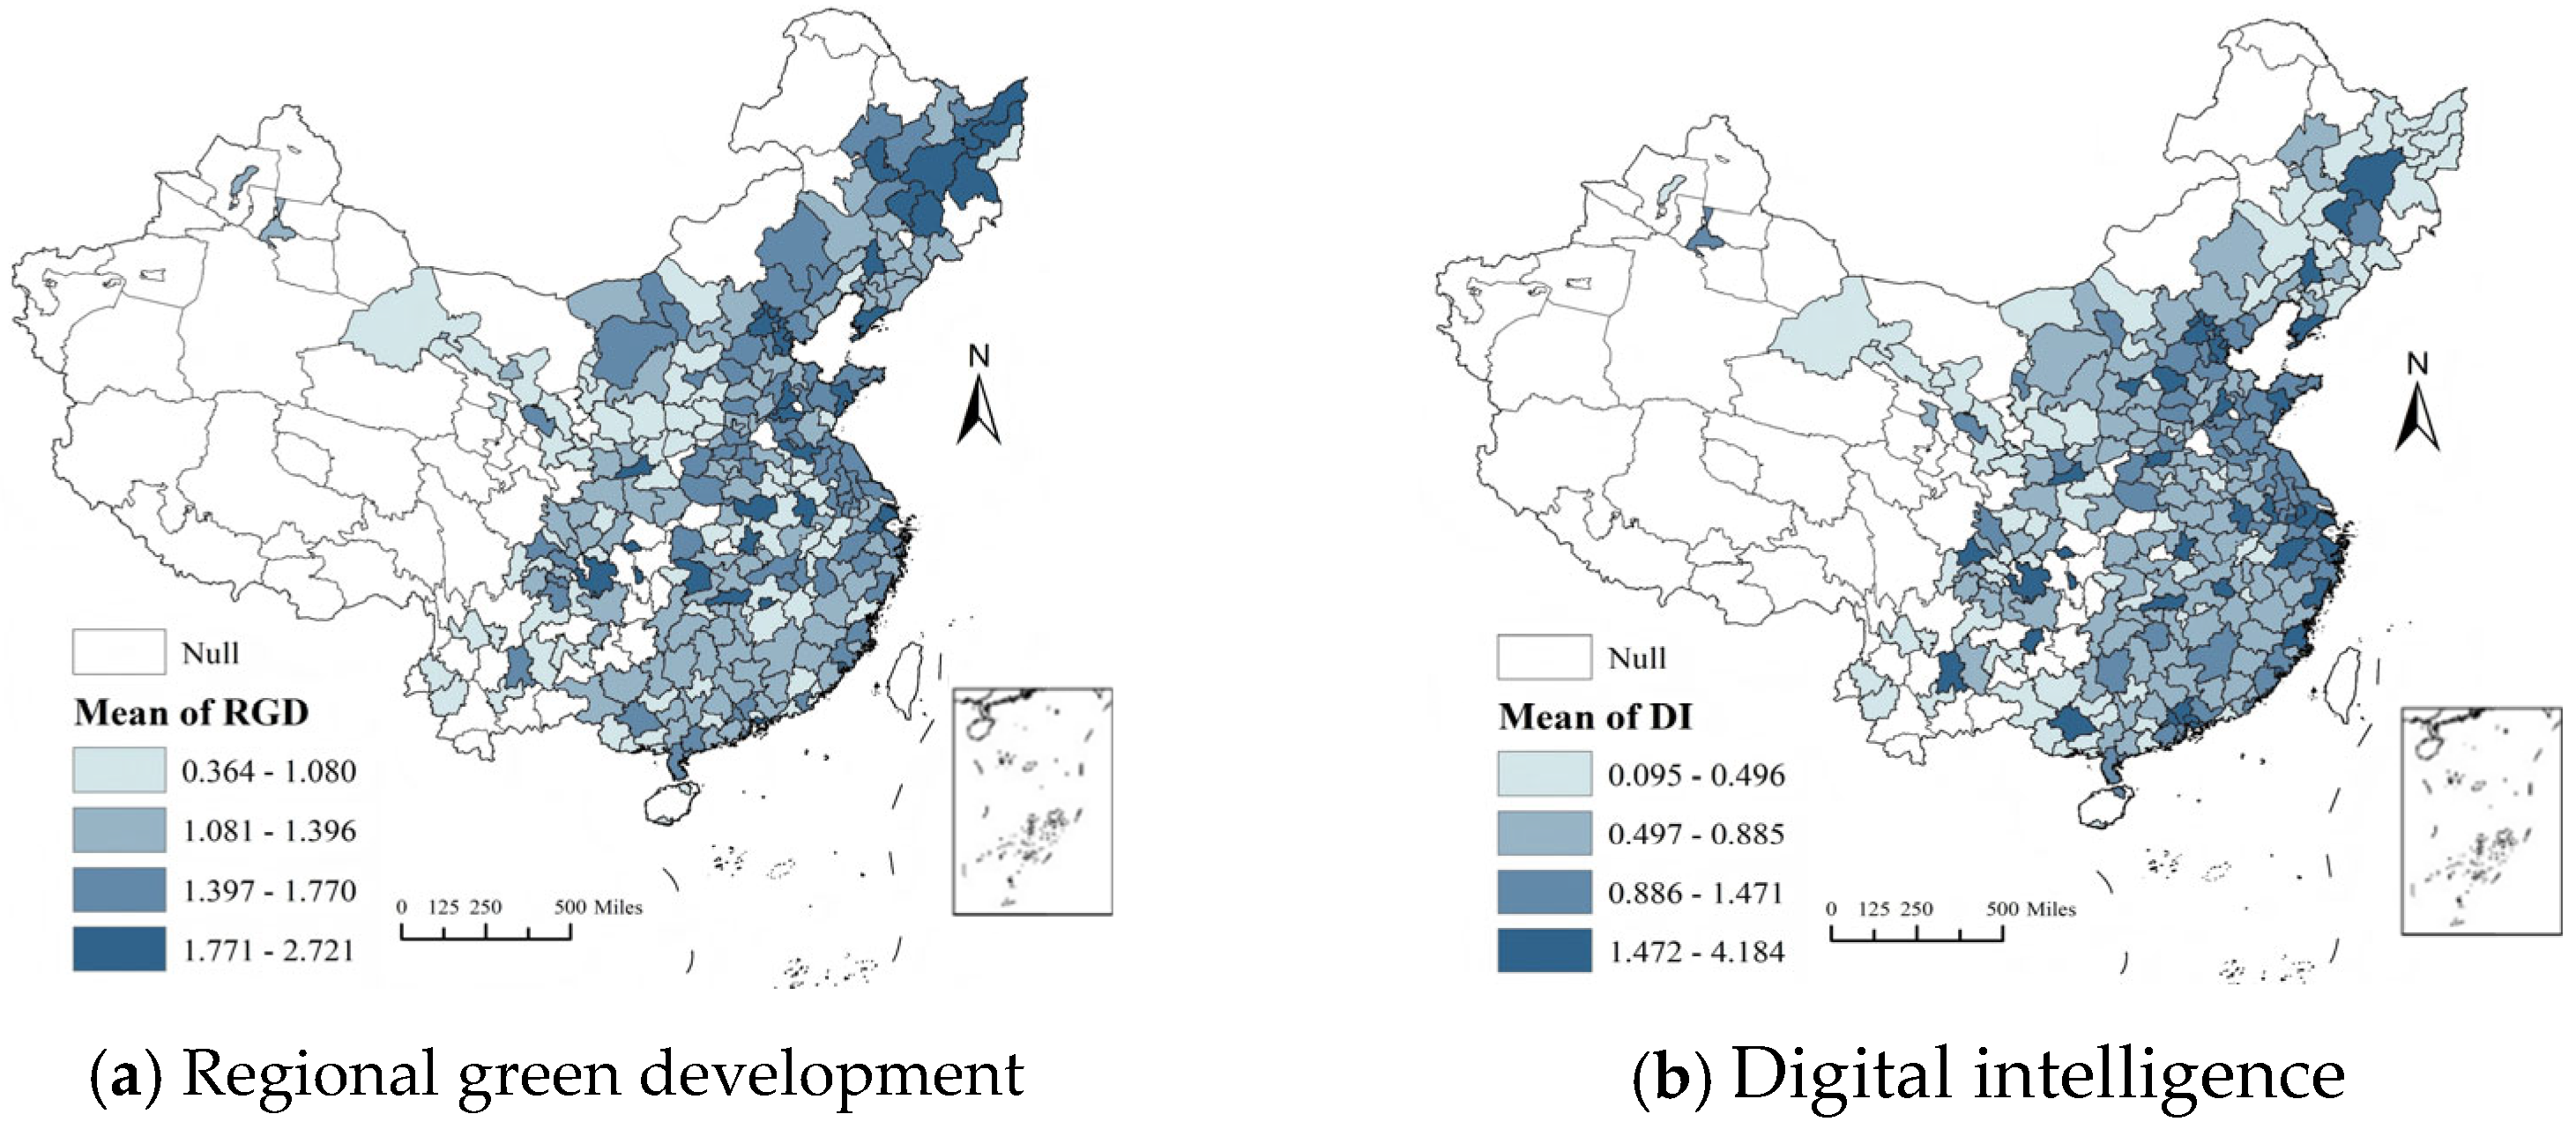
This manuscript makes four contributions to the literature. Firstly, we employ big data and machine learning methods to crawl the Baidu Index for the frequency of terms related to digitalization and artificial intelligence across prefecture-level and above cities during 2011–2022, thus constructing regional-level digital intelligence indicators. Secondly, this article utilizes panel data from 277 prefecture-level and above cities in China from 2011 to 2022, employing a two-way fixed effects model to examine the green effects of digital intelligence. Instrumental variable methods are effectively employed to mitigate potential endogeneity issues. Thirdly, this study develops a theoretical framework to analyze the impact of digital intelligence on regional green development, arguing that digital intelligence can enhance urban green productivity by advancing the industrial structure and strengthening environmental protection. This study empirically examines these mechanisms. Fourthly, this manuscript explores the heterogeneous effects of digital intelligence on urban green productivity from aspects of spatial dimensions, city scale, resource endowment, and urban green productivity levels.
The remainder of this article is organized as follows: The second section presents theoretical analysis and research hypotheses; the third section describes the model specification and data; the fourth section presents the baseline results and robustness tests; the fifth section provides the mechanism tests; the sixth section presents heterogeneity analysis; and the seventh section concludes with policy recommendations.

2. Theoretical Analysis and Research Hypotheses

Digital intelligence is increasingly essential for regional green development. Digital intelligence affects regional green development through the following three aspects.
Digital intelligence has established a novel ecosystem for green technological innovation. The extensive integration of digital technology has transformed conventional innovation models, with artificial intelligence algorithms markedly improving innovation efficiency through the optimization of the research and development (R&D) pathway selection (Li et al., 2024) [35]. Blockchain technology has established more transparent and secure protection mechanisms for innovative outcomes, effectively addressing intellectual property challenges in green technology R&D. More importantly, digital platforms have broken the spatiotemporal limitations of innovation element flows, facilitating the establishment of cross-regional and cross-domain collaborative innovation networks (Gu et al., 2023) [36]. This systematic transformation is reflected in the quantitative change of innovation efficiency and has also triggered qualitative changes in innovation models. Industrial Internet platforms facilitate accurate alignment of R&D resources, whereas digital twin technology offers virtual simulation environments for innovation processes. This innovative ecosystem reconstruction, driven by digital intelligence, provides continuous technological momentum and innovation sources for regional green development. Thus, this manuscript proposes the first hypothesis.
Hypothesis 1.
Digital intelligence can promote regional green development by fostering green technological innovation.
Digital intelligence is triggering deep-level transformations in industrial organizational forms. The widespread application of intelligent manufacturing technology has not only improved production efficiency but, more importantly, has reconstructed various links in the industrial value chain (Liu et al., 2024) [37]. The digital platform economy has given rise to flexible, networked new industrial organization models, achieving intelligent matching of production factors and dynamic optimization of value networks (Zander et al., 2025) [38]. This transformation is manifested at the micro level as the digital transformation of enterprise production functions and at the macro level as the formation of a more resilient modern industrial system. The industrial-level application of digital twin technology has achieved complete life-cycle value management, while the deep penetration of artificial intelligence has reshaped the basic logic of industrial competition. In particular, the industrial transformation driven by digital intelligence exhibits clear green characteristics, with the rapid development of new models such as clean production and the circular economy. This industrial evolution path not only enhances economic efficiency but, more importantly, lays a solid industrial foundation for green development. Thus, this study proposes a second hypothesis.
Hypothesis 2.
Digital intelligence can promote regional green development by advancing industrial structure.
Digital intelligence applications are driving the modernization transformation of environmental governance systems. The systematic implementation of Internet of Things technology has established a comprehensive, three-dimensional environmental monitoring network, facilitating precise regulation of pollution emissions (Li et al., 2024) [39]. The extensive application of big data analysis has improved the scientific basis of environmental decision-making and has established mechanisms for policy optimization grounded in historical data. This innovation in governance, driven by data, surpasses conventional command-and-control frameworks, establishing a holistic governance closed loop that encompasses monitoring and early warning, analysis and decision-making, as well as execution and feedback. The use of digital twin technology in environmental applications facilitates the virtual simulation of governance processes, and intelligent algorithms have markedly improved the accuracy of regulatory measures. Edge computing technology has facilitated the real-time processing of environmental data, and blockchain technology has offered technical support for the development of environmental credit systems (Durden, 2025) [40]. The modernization of governance systems has successfully achieved environmental governance and green protection, while also establishing institutional infrastructure that aligns with the needs of green development. Therefore, this article proposes a third hypothesis.
Hypothesis 3.
Digital intelligence can promote regional green development through environmental protection effects.

3. Methods and Materials

3.1. Model Specification

To examine the impact of digital intelligence on regional green development, this paper refers to the research of Ma et al. (2024) [41] and proposes the following specification:
R G D i t = β 0 + β 1 D I i t + α m X i t + μ i + λ t + ε i t
where i is the city and t is the year. RGDit represents the regional green development index, DIit denotes the level of digital intelligence, and Xit is a set of control variables, including the degree of openness, financial development level, government intervention degree, urbanization rate, industrialization degree, marketization level, and economic density. μi represents city-fixed effects. λt represents time-fixed effects. εitεit is an error term. To eliminate possible heteroscedasticity and autocorrelation, following the recommendation of Bertrand et al. (2004) [42], the standard errors are clustered at the city level.
The estimated coefficient β1 captures the effect of digital intelligence on regional green development. We expect its estimated coefficient to be significantly positive, suggesting that digital intelligence is conducive to improving regional green development levels. To ensure the effectiveness of the estimation strategy, this article conducts a series of robustness tests. These tests include alternative measurement of regional green development and digital intelligence, the application of the feasible generalized least squares (FGLS) estimation method, and the exclusion of other policy interferences.
This manuscript adopts the quantile regression method to examine the varying effects of digital intelligence on cities at distinct stages of development. Traditional mean regression solely captures the impact of explanatory variables on the conditional expectation of the outcome variable. In contrast, quantile regression provides a comprehensive characterization of conditional distribution characteristics, making it particularly effective for analyzing the heterogeneous effects of digital intelligence across cities with varying development levels. Additionally, this method exhibits greater robustness to outliers due to its optimization objective function, which minimizes the weighted sum of absolute residuals (Σ|ei|). This paper utilizes the frontier method to effectively address technical challenges associated with panel data characteristics, including the management of fixed effects and the correction of standard errors. The regression model is presented as follows:
R G D i t τ = β 1 τ D I i t τ + α m τ X i t τ + μ i + λ t
where τ is the quantile.
Additionally, this article examines the spatial variability of digital intelligence’s impact on regional green development through the application of the MGWR (multiscale geographically weighted regression) model provided by Fotheringham et al. (2017) [43]. The regression model is outlined as follows:
R G D i = β 0 ( θ i , δ i ) + β b w 1 ( θ i , δ i ) D I i + k β b w k ( θ i , δ i ) X i k + ε i
where ( θ i , δ i ) displays the i point’s latitude and longitude coordinates. bwk represents the bandwidth used for the k-th variable regression coefficient.

3.2. Variable Measurement

The outcome variable is regional green development (RGD). The DEA technique, notable for its lack of necessity for predetermined functional forms or weights, its capability to manage many inputs and outputs, its emphasis on efficiency assessment, its ability to pinpoint areas for enhancement, and its accommodation of unwanted outputs, has garnered growing academic acclaim. Consequently, its application in green development research has become widespread. The non-radial Slack-Based Measure (SBM) model, which accommodates non-proportional variations in inputs and outputs (i.e., slack-based enhancements), is generally regarded as a more effective approach than the Variable Returns to Scale (VRS) and Constant Returns to Scale (CRS) models (Tone, 2001) [44]. A common issue with traditional DEA models is that multiple decision-making units (DMUs) can be evaluated as efficient, all with an efficiency score of 1, making it impossible to rank them. The super-efficiency model addresses this by allowing for the differentiation of efficient DMUs. In this framework, the efficiency score of a DMU is calculated relative to a production frontier constructed from all other DMUs, resulting in distinct efficiency scores for efficient units, which are typically greater than 1. Based on these considerations, this study employs the SBM super-efficiency model to measure the level of regional green development.
Assuming that each city utilizes n inputs x = x 1 , , x N to produce M desirable outputs y = y 1 , , y M and K undesirable outputs b = b 1 , , b K . The production possibility set can be depicted as P ( x ) :
P ( x ) = y , b
If the input–output vector of city i ( i = 1 , , I ) in time t ( t = 1 , , T ), and λ i t is the weight of each cross section observation value. And the DEA model can be written as the following form.
P t ( x t ) = y t , b t : i = 1 I λ i t y i m t y i m t , m ; i = 1 I λ i t x i n t x i n t , n ; i = 1 I λ i t b i k t y i k t , k ; i = 1 I λ i t = 1 , λ i t 0 , i
If i = 1 I λ i t = 1 , the production frontier is expressed as VRS. And if i = 1 I λ i t = 0 , the production frontier is expressed as CRS. With reference to Xie et al. (2019) [45], the SBM super-efficiency model considering resource environment and expected output is defined as follows:
S v t x t , i , y t , i , b t , i , g x , g y , g b = max s x , s y , s b 1 N n = 1 N s n x g n x + 1 M + K m = 1 M s m y g m y + k = 1 K s k b g k b 2 s . t . i = 1 I λ i t x i n t + s n x = x i n t , n ; i = 1 I λ i t y i m t s m y = y i m t , m ; i = 1 I λ i t b i k t + s k b = b i k t , k ; i = 1 I λ i t = 1 , λ i t 0 , i ; s n x 0 , n ; s m y 0 , m ; s k b 0 , k .
In the above equation, S v t represents the directional distance function under VRS. If the constraint is removed, the function S c t represents the CRS case. The vectors x t , i , y t , i , b t , i denote the inputs, desirable outputs, and undesirable outputs for each city, respectively. The direction vectors g x , g y , g b represent the contraction of inputs, expansion of desirable outputs, and reduction of undesirable outputs. Furthermore, s n x , s m y , s k b are the slack variables for inputs, desirable outputs, and undesirable outputs, respectively, and represent the overuse of inputs, the shortfall in desirable outputs, and the excess emission of undesirable outputs. Drawing on the research of Liu et al. (2022) [17], this paper uses employed persons in urban districts, capital stock, and electricity consumption as input vector x = x 1 , , x N , N = 3 , deflated regional GDP (Gross Domestic Product) as the desirable output indicator y = y 1 , , y M , M = 1 , and industrial sulfur dioxide emissions, industrial wastewater discharge, and industrial smoke and dust emissions as undesirable output vector b = b 1 , , b K , K = 3 . Using the MaxDEA 7.0 software, we calculate the regional green development level in China. To verify the validity of the empirical results, this paper also follows Ma et al. (2024) [41] in constructing a new regional economic green development indicator using the entropy method across five dimensions: innovation, green, coordination, openness, and sharing, and then conducts regression analysis again.
The core explanatory variable in this article is the digital intelligence (DI) index. With the development of big data technology, data-driven methodologies are increasingly employed in the assessment of digital intelligence. Peng et al. (2024) measured digital intelligence using machine learning and text analysis methods [46], while Yang and Zhu (2024) analyzed the spatial distribution characteristics of digital attention in various provinces in China based on the Baidu Index [47]. This paper primarily follows Yang and Zhu’s (2024) method [47], utilizing big data and machine learning methods to extract the Baidu Index data on the frequency of terms related to digitalization and artificial intelligence across prefecture-level and above cities from 2011 to 2022. The Baidu Index is a data-sharing platform and trend analysis tool based on the massive volume of user behavior data from the Baidu search engine. It reflects the user attention and media attention of specific keywords over a given period by analyzing and calculating their search volume. Based on the Baidu Index, we collect artificial intelligence search indices and digitalization search indices and construct digital intelligence indicators using the weighted average method. In the robustness test, we construct new digital intelligence indicators using the entropy method and conduct regression analysis again.
This article selects green technological innovation, industrial structure advancement, and environmental pollution levels as mechanism variables for digital intelligence affecting regional economic green development. Among them, the green technological innovation level is represented by the total number of green patent applications (GPA) and the total number of green patent grants (GPL) (Wang et al., 2022) [48]. The advancement of industrial structure (AIS) is measured by the ratio of tertiary industry to secondary industry output value (Gan et al., 2011) [49]. Environmental pollution level is measured by wastewater emissions (WE), SO2 emissions (SODE), and smoke and dust emissions (SDE).
Drawing on the research of Tao et al. (2024) [50], this study controls a series of variables, specifically including the level of financial development (DFD), measured by the ratio of financial institution deposits and loan balance to regional GDP at the end of the year. The proportion of secondary industry represents the added value of the industrial structure (IS) in regional GDP. Regional economic density (RED) is characterized by the ratio of regional GDP to administrative land area. The logarithm of the year-end permanent resident population represents population density (PD). The degree of openness (DO) is operationalized as the ratio between total trade volume (imports plus exports) and regional GDP, reflecting the relative intensity of a region’s international economic integration. The construction methods of the above variables are consistent with existing research (Zhang and Zhang, 2024) [51], ensuring the comparability and robustness of the results.

3.3. Data Description

Considering data availability, this study comprises 277 prefecture-level and above cities in China from 2011 to 2022 (China’s local governance follows a hierarchical structure: provinces, prefecture-level cities, and counties. Prefecture-level cities are key administrative units governing urban districts and surrounding rural counties. Our panel analysis covers 277 of China’s 293 prefecture-level cities, constituting the full universe of available data after excluding autonomous prefectures and leagues, and cities with persistent data gaps (e.g., Tibet prefectures).). Data sources include the China City Statistical Yearbook (China City Statistical Yearbook is an annual statistical publication, which comprehensively reflects the economic and social development of Cities in China. It contains the statistical data of cities at prefecture level and above, on population, resource and environment, economic development, scientific and technological innovation, public service, infrastructure, etc. For relevant statistics, visit: https://data.cnki.net/yearBook/single?id=N2025020156&pinyinCode=YZGCA accessed on 23 July 2025), China High-tech Industry Statistical Yearbook, China Statistical Yearbook, China Science and Technology Statistical Yearbook, China Energy Yearbook, China Environment Yearbook, and various provincial and municipal statistical yearbooks. All monetary value data are calculated at constant 2000 prices. Moreover, we apply tail reduction to the samples at the 1% and 99% quantiles to lessen the influence of outliers on the estimation in this study. The descriptive statistics of variables are presented in Table 1. We also plot the spatial distribution of regional green development and digital intelligence in Figure 1.
Table 1 shows that regional green development has a mean of 1.321, a standard deviation of 0.490, and a skewness of 1.509. The digital intelligence index’s mean, standard deviation, and skewness are 0.860, 0.808, and 2.356, respectively. Figure 1 indicates that both digital intelligence and regional green development exhibit clear spatial agglomeration characteristics. Cities with high levels of digital intelligence or regional green development are located close to one another and produce close-knit connectivity systems.

4. Results

4.1. Baseline Regression Results

Due to the existence of unobservable fixed effects at both city and time dimensions, this paper employs a two-way fixed effects model to estimate Equation (1). To further demonstrate the robustness of the estimation results, this paper adopts a stepwise regression method, successively adding variables such as financial development level, industrial structure, regional economic density, population density, and degree of openness. The estimation results are shown in Table 2.
The results show that the estimated coefficient of digital intelligence is significantly positive at a 1% significance level, indicating that digital intelligence enhancement is conducive to improving the regional green development index. The empirical results indicate that a one-unit increase in digital intelligence is associated with a 0.163-unit enhancement in regional green development level, suggesting a statistically significant positive relationship. With the advancement of digital intelligence, the in-depth development of digital technology and intelligent applications helps promote technological innovation and industrial upgrading, optimize the effectiveness of government environmental governance, and enhance regional green development.
For control variables, the estimated result for the financial development level is significantly positive, indicating that regional financial development has a substantial impact on enhancing regional green development levels. The estimated result for industrial structure is significantly positive, indicating that industrial structure adjustment helps achieve regional green development. The impact of regional economic density on regional green development is not significant. The estimated result for population density is significantly negative, indicating that increased population density is not conducive to enhancing regional green development. The impact of the degree of openness on regional green development is not significant.

4.2. Robustness Tests

To verify the robustness of the baseline regression results, this article conducts a series of robustness tests.
Alternative measurement of the regional green development. In existing literature, some scholars construct regional green development indicators using the comprehensive indicator method. Following the method of Ma et al. (2024) [41], this study constructs a new proxy variable for regional green development level (newRGD) using the entropy method from five dimensions: innovation, green, coordination, openness, and sharing. The regression results are shown in column 1 of Table 3. The results indicate that the impact of digital intelligence on regional green development remains significantly positive, suggesting that our baseline results are robust.
Alternative measurement of digital intelligence. To mitigate the impact of the core explanatory variable synthesis method on the regression results, this study constructs a new digital intelligence indicator (newDI) using the entropy method and conducts regression analysis. The regression results are shown in column 2 of Table 3. From the regression results in column 2 of Table 3, the estimated coefficient of digital intelligence has a significant positive impact, and the statistical significance level remains unchanged, effectively ruling out potential measurement error problems that might be introduced by the indicator synthesis method.
Replacing the digital intelligence indicator. With the rapid development of digital intelligence technologies, to accelerate the development of the big data industry, the Chinese government approved the establishment of two batches of national big data comprehensive experimental zones in 2015 and 2016. To further rule out the potential endogeneity of the digital intelligence indicator on the regression results, this article constructs a policy dummy variable (DIpolicy) using the national big data comprehensive experimental zone as a quasi-natural experiment and conducts another regression analysis. The regression results are shown in column 3 of Table 3. The estimated coefficient of DIpolicy is significantly positive at the 5% significance level, indicating our estimates are robust.
FGLS estimation. To address potential heteroscedasticity and autocorrelation that might compromise the efficiency of our estimates, we employed the generalized least squares method. The results, reported in column 4 of Table 3, remain robust and consistent with our baseline findings. From the regression results in column 4, the estimated result of digital intelligence on regional green development remains significantly positive, indicating that the model specification has not affected the reliability of the baseline regression results.
Exclusion of other policy interferences. To rule out the interference of other concurrent policies on the regression results, this article respectively eliminates cities that were included in the Carbon Emission Trading Pilot Cities and New Energy Demonstration Pilot Cities between 2011 and 2022, retaining only samples unaffected by policies, and conducts regression analysis again. The regression results are presented in columns 5 and 6 of Table 3. The regression results show that after excluding other concurrent policies, digital intelligence still exhibits a significant promoting effect on regional green development, further strengthening the credibility of the baseline regression results.

4.3. Endogeneity Issues

This study’s potential endogeneity issues primarily manifested in two aspects. Firstly, a bidirectional causal relationship between digital intelligence and regional green development. Secondly, some unobservable factors may cause a correlation between explanatory variables and error terms. Both scenarios would result in bias and inconsistency in ordinary least squares estimators. This manuscript employs the instrumental variable (IV) method to address the issue effectively. Based on the selection criteria, this study selects three appropriate instrumental variables: one-period lagged digital intelligence, minimum distance to backbone cable cities, and fixed telephone numbers per hundred people in 1984. The following advantages are associated with these variables. Firstly, one-period lagged digital intelligence, geographical location characteristics (distance to backbone cable cities), and historical communication infrastructure development level (fixed telephone numbers per hundred people in 1984) exhibit a strong relationship with current-period digital intelligence. Second, these historical and geographical variables do not directly affect the current-period regional green development. Table 4 presents the regression results.
This study performs tests to assess the effectiveness of the instrumental variables. The results of the first-stage regression indicate that the joint significance statistic significantly surpasses the critical value of 10, suggesting the absence of a weak instrumental variable issue. The over-identification test further corroborates the exogenous assumption of the instrumental variables. Therefore, the instrumental variables chosen in this article are effective. The second-stage regression results of the instrumental variable estimation indicate that the use of one-period lagged digital intelligence, geographical location characteristics, and historical communication infrastructure development level, or the combination of these as instrumental variables, yields significant findings. All estimated coefficients of digital intelligence are positive and statistically significant at the 1% level. It further confirms that the baseline results remain robust and reliable after considering endogeneity issues.

5. Mechanism Analysis

The theoretical framework of this paper demonstrates that digital intelligence primarily influences regional green development through promoting green technological innovation, advancing industrial structure, and enhancing environmental protection. Thus, this article identifies green technological innovation, industrial structure advancement, and environmental pollution levels as mechanism variables through which digital intelligence influences regional green development. Green technological innovation is indicated by the total number of green patent applications (GPA) and the total number of green patent grants (GPL) (Wang et al., 2022) [48]. Industrial structure advancement (AIS) is measured by the ratio of tertiary to secondary industry output value (Gan et al., 2011) [49]. Environmental pollution levels are measured by wastewater emissions (WE), SO2 emissions (SODE), and smoke and dust emissions (SDE).
Green technological innovation, industrial structure advancement, and environmental pollution levels have direct effects on regional green development. Green technological innovation and industrial structure advancements facilitate regional green development, whereas environmental pollution obstructs this process. This study employs the method of Shang et al. (2024) [52] to substitute the outcome variable and examine the impact mechanism of digital intelligence on regional green development. Specifically, we substitute the outcome variable in the baseline regression model with green technological innovation, industrial structure advancement, and environmental pollution levels, respectively. Table 5 presents the results of the mechanism tests.
Columns 1–2 of Table 5 indicate that the estimated results of digital intelligence are significantly positive at the 1% level, suggesting that digital intelligence contributes to an increase in both the total number of green patent applications and green patent grants. Green technological innovation typically facilitates regional green development. Digital intelligence can promote regional green development through the enhancement of green technological innovation. Consequently, Hypothesis 1 is validated, aligning with the findings of Guo and Xu (2024) [53]. Column 3 of Table 5 indicates that the estimated result of digital intelligence is significantly positive at the 5% significance level, suggesting that the enhancement of digital intelligence facilitates the advancement of industrial structure. Industrial advancement contributes positively to enhancing regional green development levels. The findings corroborate Hypothesis 2. Columns 4–6 of Table 5 indicate that the estimated results of digital intelligence are all significantly negative at the 1% level, suggesting that the enhancement of digital intelligence effectively contributes to the reduction of wastewater emissions, SO2 emissions, and smoke and dust emissions. Reduced environmental pollution levels facilitate the advancement of regional green development. Consequently, the results support Hypothesis 3, which aligns with the findings of Ren et al. (2023) [54] and Yue and Han (2025) [55].
The three mechanisms collectively establish a collaborative action chain comprising green technological innovation, industrial upgrading, and environmental improvement. Green technological innovation serves as the foundational driving force, industrial advancement acts as structural support, and pollution reduction functions as the environmental guarantee. These findings provide precise mechanisms for regional digital intelligence development policies.

6. Heterogeneity Analysis

6.1. Spatial Heterogeneity

The impact of digital intelligence on regional green development is dynamic and not uniform across cities. It is influenced by differences in economic foundations, policy environments, technological capabilities, and resource availability across regions. Traditional global regression models, such as ordinary least squares (OLS), provide only a single average coefficient for the entire study area, which can overlook important local differences. However, the multiscale geographically weighted regression (MGWR) model allows for a more detailed and accurate analysis by identifying both spatial variations and scale-dependent effects. This approach enables policymakers to move beyond generic strategies and develop targeted, place-based policies that are customized to the specific impact intensity and operational scale of various influencing factors in different regions.
This article utilized R 4.4.2 software to estimate the regression coefficients of the MGWR model, aiming to illustrate the spatiotemporal variation of digital intelligence’s impact on regional green development. A spatial distribution map of these regression coefficients was created using ArcGIS 10.8 to visualize how digital intelligence influences regional green development over time. The spatial distribution of the regression coefficients of digital intelligence is shown in Figure 2. From a temporal perspective, the positive impact of digital intelligence on regional green development showed a steady upward trend from 2011 to 2022. In terms of spatial distribution, this effect was more pronounced in the economically developed eastern regions, while the central and western regions exhibited a less significant promotional effect. This spatial pattern has progressively improved over time. Notably, compared to 2011, the contribution of digital intelligence to green growth in the central and western regions significantly strengthened by 2022. The coefficients for some central cities even surpassed those observed in the eastern regions.

6.2. Regional Differences

China’s regional development is characterized by significant imbalances, leading to pronounced variations in industrial foundations, innovation environments, and factor endowments. (The eastern region benefits from higher capital investment, skilled labor concentration, and advanced infrastructure and is dominated by high-tech manufacturing and modern services. The central region has strong heavy industry and agricultural processing, often receiving industrial transfer from the east. The western region relies more on resource extraction, energy production, and primary activities, with lower factor inputs overall). This disparity may result in considerable regional heterogeneity regarding the impact of digital intelligence on regional green development. Based on the National Bureau of Statistics’ regional division norms, this study estimates three urban samples in different regions (eastern, central, and western). The estimation results are presented in Table 6’s columns 1–3.
The estimation results presented in Table 6 indicate that the impact of digital intelligence on regional green development exhibits significant regional differences. In the eastern region (column 1), the regression coefficient for digital intelligence is 0.198, significant at the 1% level, indicating that for each unit increase in digital intelligence, the green development level in the eastern region increases by an average of 0.198 units. This result may arise from the eastern region’s superior digital infrastructure, higher level of human capital accumulation, and a more active innovation ecosystem. Higher levels of digital intelligence enhance the capacity of digital technologies to convert into productivity, thereby promoting regional green development. The regression results for the central region (column 2) and western region (column 3) show that although the coefficients of digital intelligence are positive, neither passes the significance test. It indicates that digital intelligence has no significant impact on regional green development in central and western regions. Potential explanations encompass structural constraints encountered throughout the digital intelligence process. On the one hand, relatively underdeveloped digital infrastructure and inadequate talent reserves restrict the comprehensive application of digital intelligence technologies. On the other hand, the higher proportion of traditional industries and insufficient enterprise digital transformation capabilities hinder the realization of the economic benefits associated with the development of digital intelligence. These regional differences align with China’s current digital economy development pattern, serving as a crucial foundation for the implementation of differentiated regional digital economy development policies.

6.3. City-Scale Differences

China’s urban development exhibits distinct scale gradient characteristics, with systematic disparities in digital infrastructure, technological innovation capabilities, and industrial agglomeration levels across cities of different sizes. Consequently, the impact of digital intelligence on regional green development is likely to exhibit notable heterogeneity based on city scale. This study categorizes the 277 sample cities into three groups based on the Notice on Adjusting City Size Standards issued by the State Council in 2014, which considers the permanent resident population size of urban districts: large cities (over 1 million), medium-sized cities (500,000–1 million), and small cities (below 500,000). Table 6 (columns 4–6) presents the results.
The regression results indicate that in the large-scale cities sample (column 4), the regression coefficient of digital intelligence is significantly positive at the 1% level. Digital intelligence in large cities promotes green development. Advantages create a virtuous cycle of technological innovation, industrial upgrading, and factor coordination, serving as the primary driving force for advancing green development. In the medium-scale cities sample (column 5), the estimated coefficient is negative but not significant, indicating that digital intelligence has not yet had a significant impact on regional green development levels. In the small-scale cities sample (column 6), the estimated coefficient is significantly negative, indicating that digital intelligence results in the reduction of regional green development levels. This result reveals the complex mechanisms through which digital intelligence influences green development in small and medium-sized cities. Inadequate infrastructure and talent shortages restrict the effectiveness of technological applications, while the substantial expense associated with traditional industry transformation further impedes the realization of digital dividends. The adverse effect observed in small cities underscores the potential risk of the digital divide; enhancing digital intelligence without adequate supporting conditions may lead to resource misallocation and industrial disruption.

6.4. Resource Endowment Heterogeneity

Resource-dependent cities and non-resource-dependent cities demonstrate distinct differences in industrial structure, development paths, and factor endowments. Resource-dependent cities often display characteristics associated with resource dependence, marked by singular industrial structures that are dominated by traditional heavy industries and relatively weak innovative ecosystems. Cities that are not reliant on resources exhibit greater industrial diversity, higher degrees of marketization, and enhanced innovation capacity. Structural differences may lead to varying effects of digital intelligence on regional green development. We categorize the sample cities into resource-dependent and non-resource-dependent cities according to the National Resource-Dependent City Green Development Planning (2013–2020) and conduct separate regressions. The estimation results are presented in columns 7 and 8 of Table 6.
The estimated coefficient for resource-dependent cities (column 7) is −0.236, while the estimated coefficient for non-resource-dependent cities (column 8) is 0.213, which is significant at the 1% level. This contrast suggests that digital intelligence has a significant promoting effect in non-resource-dependent cities, while it has an inhibiting effect in resource-dependent cities. This divergence may arise from the unique industrial structure and development path of resource-dependent cities. On the one hand, the industrial inertia stemming from prolonged reliance on resource development increases the costs associated with the digital transformation of traditional industries. On the other hand, the path dependence inherent in resource-dependent economies may limit the effective integration of digital technology with the real economy. It provides a foundational approach for executing classified guidance policies: non-resource-dependent cities may advance digital intelligence development, whereas resource-dependent cities must focus on fostering industrial diversification to enhance conditions for digital intelligence.

6.5. Quantile Regression

The estimation results in Table 7 indicate that the regression coefficients of digital intelligence across five quantiles, from 0.1 to 0.9, demonstrate a monotonic increasing pattern, all of which meet the 1% significance test. This observed gradient change pattern reveals that the marginal effect of digital intelligence intensifies with the city’s level of green development. It illustrates the comprehensive advantages of high-development-level cities in digital infrastructure, talent reserves, and institutional environment, enabling them to capitalize on digital intelligence dividends fully.

7. Conclusions and Policy Implications

In the digital era, the advancement of digital intelligence is essential for attaining a competitive advantage. It acts as a fundamental catalyst for optimizing regional economic structures and fostering green development. Using data from 277 prefecture-level and above cities in China from 2011 to 2022, this article examines the effects and mechanisms of digital intelligence on regional green development.
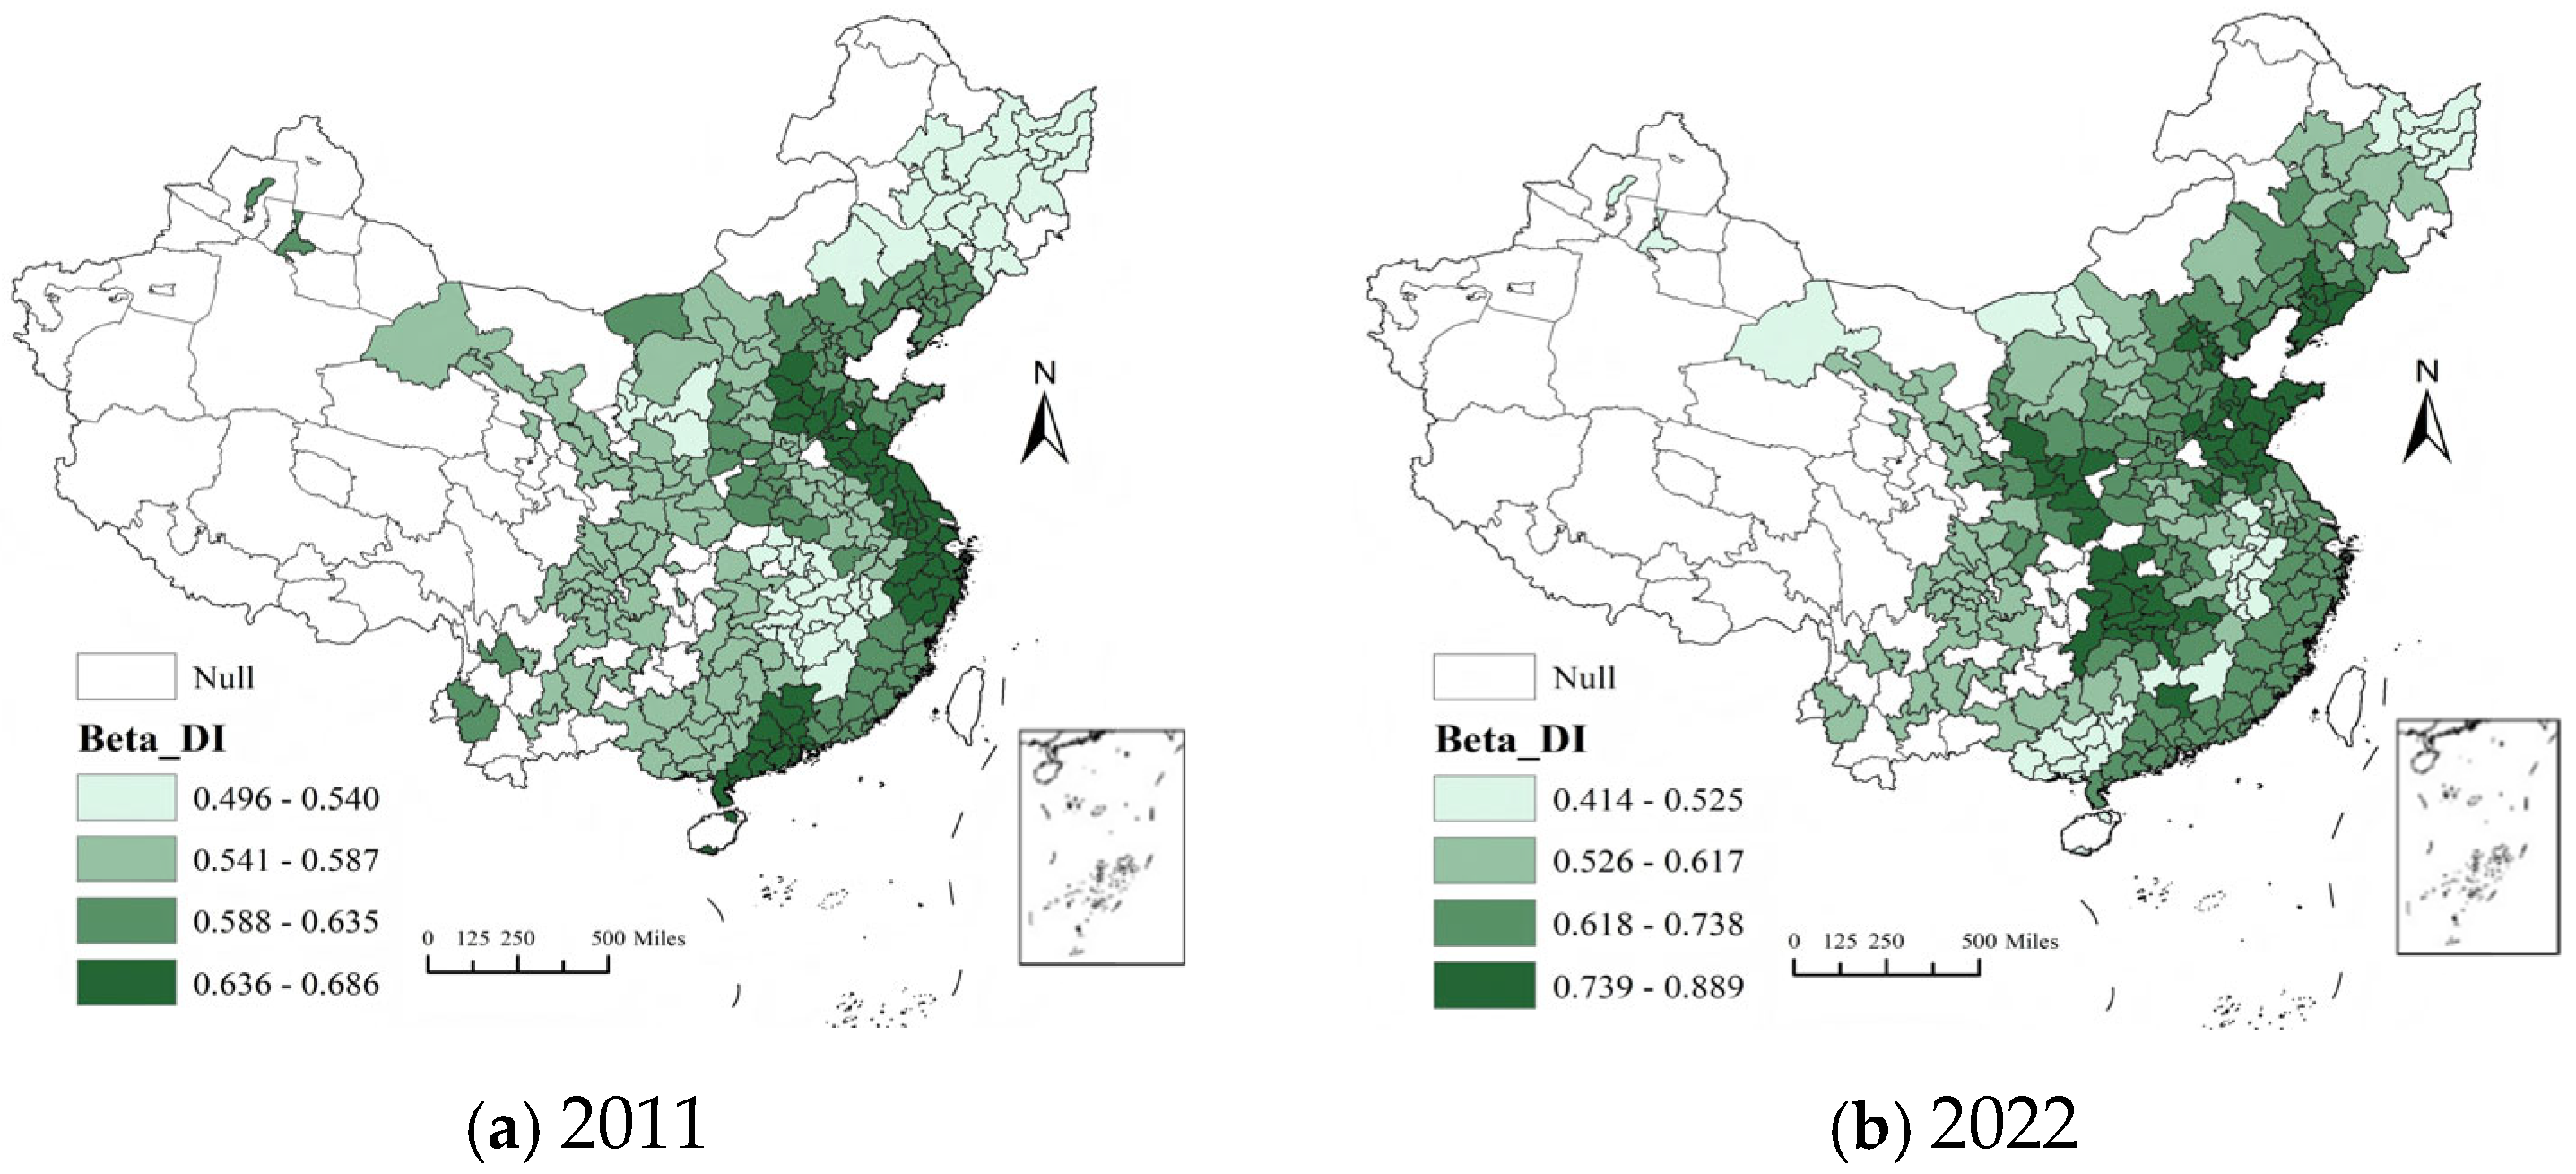
The digital intelligence is conducive to promoting regional green development, supported by a series of robust tests. This positive impact of digital intelligence on regional green development showed a steady upward trend from 2011 to 2022 and varies considerably across spatial dimensions, urban sizes, and resource endowments. In eastern regions, large cities, and non-resource-dependent cities, digital intelligence facilitates the advancement of regional green development. For central and western regions, as well as medium-sized cities, digital intelligence has no significant impact on regional green development. Conversely, in small cities and resource-dependent cities, the enhancement of digital intelligence reduces regional green development levels. With the increase in green development levels, the impact of digital intelligence on regional green development demonstrates obvious monotonic increasing characteristics. The mechanism test results demonstrate that digital intelligence improves regional green development levels by facilitating green technological innovation, advancing industrial structure, and enhancing environmental protection effects. Therefore, Hypotheses 1–3 proposed in the second section have been empirically validated, and the findings align with the conclusions of relevant literature (Guo and Xu, 2024; Ren et al., 2023; Yue and Han, 2025) [53,54,55].
Based on the empirical analysis conclusions above, this study provides the following policy implications:
Firstly, governments should implement differentiated digital intelligence promotion strategies. These strategies must align with regional development characteristics. Developed eastern regions and large cities should leverage existing digital infrastructure and agglomerate innovation resources. They should prioritize establishing R&D platforms for advanced technologies, including 5G, artificial intelligence, and blockchain. For central and western regions and medium-sized cities, the policy focus should be on enhancing digital infrastructure. It should also advance industrial digital transformation. For small, resource-dependent cities, governments should implement a comprehensive risk prevention mechanism. A negative list management system is also crucial. The promotion of digital intelligence projects that could lead to industrial disruption requires careful regulation. The government should support a ‘lightweight digital intelligence’ transformation tailored to local characteristics.
Secondly, governments should strengthen incentive mechanisms for green technological innovation. This will leverage the positive environmental externalities of digital intelligence. Establishing collaborative innovation special projects on “Digital Intelligence + Green Technology” is recommended. These projects should support integrated innovations. Examples include pollution reduction technologies utilizing the industrial internet and pollution footprint monitoring technologies leveraging big data. To foster innovation, collaborative innovation consortia should be established. These consortia should involve government, industry, academia, research, and finance. Improve the green technology transaction market system. Utilize blockchain technology to establish trusted platforms for emission rights and green patent trading. This will enhance technology transformation efficiency. Simultaneously, enhance the green technology standard system. Develop quantitative evaluation methods for the green environmental protection effects of digital intelligence technologies.
Thirdly, governments should construct a collaborative governance system for digital intelligence development. This system must ensure a balance between economic and ecological benefits. An evaluation system is essential. It should encompass dimensions such as digital economy vitality, industrial structure optimization, and ecological environment improvements. Enhance the complete life-cycle management of digital intelligence projects. Incorporate sustainability indicators into project evaluation standards. These include industrial structure advancements and environmental protection effects. In terms of policy coordination, strengthen policy measures in fields such as the digital economy, industrial policy, and ecological environmental protection. Establish dynamic evaluation and adjustment mechanisms for policy effects. Regularly conduct environmental impact assessments and socio-economic benefit assessments of digital intelligence development. Ensure coordination between digital intelligence development and regional green development.

Author Contributions

C.G. contributed to conceptualization, formal analysis, writing—original draft, writing—review; J.F. contributed to methodology, data curation, formal analysis, writing—review and editing. All authors have read and agreed to the published version of the manuscript.

Funding

This work was supported by the General Program of Hunan Provincial Social Science Achievement Review Committee (No. XSP24YBC440).

Institutional Review Board Statement

Not applicable.

Informed Consent Statement

Not applicable.

Data Availability Statement

The data presented in this study are available on request from the corresponding author.

Conflicts of Interest

The authors declare no conflicts of interest.

References

  1. Vial, G. Understanding digital transformation: A review and a research agenda. In Managing Digital Transformation; Taylor & Francis Group: London, UK, 2021; pp. 13–66. [Google Scholar]
  2. Kraus, S.; Durst, S.; Ferreira, J.J.; Veiga, P.; Kailer, N.; Weinmann, A. Digital transformation in business and management research: An overview of the current status quo. Int. J. Inf. Manag. 2022, 63, 102466. [Google Scholar] [CrossRef]
  3. Zou, L.; Li, W.; Wu, H.; Liu, J.; Gao, P. Measuring corporate digital transformation: Methodology, indicators and applications. Sustainability 2024, 16, 4087. [Google Scholar] [CrossRef]
  4. Ferreira, J.; Coelho, A.; Moutinho, L. Dynamic capabilities, creativity and innovation capability and their impact on competitive advantage and firm performance: The moderating role of entrepreneurial orientation. Technovation 2020, 92, 102061. [Google Scholar] [CrossRef]
  5. Mao, Y. Digital transformation of SMEs, action-oriented information disclosure, and enterprise value enhancement. Appl. Econ. 2025, 1–14. [Google Scholar] [CrossRef]
  6. Cheng, Q.; Peng, C.; Wan, H.; Dai, Y.; Zhang, S. How to realize digital knowledge innovation through digital technology? A perspective based on knowledge digitization and inter-organizational knowledge sharing. Technol. Soc. 2025, 82, 102905. [Google Scholar] [CrossRef]
  7. Su, Y.; Wu, J. Digital transformation and enterprise sustainable development. Finance Res. Lett. 2024, 60, 104902. [Google Scholar] [CrossRef]
  8. Xin, J.; Du, K.; Xia, Y. The impact of enterprise digital transformation on audit fees—An intermediary role based on information asymmetry. Sustainability 2024, 16, 9970. [Google Scholar] [CrossRef]
  9. Georgeson, L.; Maslin, M.; Poessinouw, M. The global green economy: A review of concepts, definitions, measurement methodologies and their interactions. Geo Geogr. Environ. 2017, 4, e00036. [Google Scholar] [CrossRef]
  10. Marrucci, L.; Daddi, T.; Iraldo, F. Creating environmental performance indicators to assess corporate sustainability and reward employees. Ecol. Indic. 2024, 158, 111489. [Google Scholar] [CrossRef]
  11. Zhao, D.Y.; Ma, Y.Y.; Lin, H.L. Using the entropy and TOPSIS models to evaluate sustainable development of islands: A case in China. Sustainability 2022, 14, 3707. [Google Scholar] [CrossRef]
  12. Lamichhane, S.; Eğilmez, G.; Gedik, R.; Bhutta, M.K.S.; Erenay, B. Benchmarking OECD countries’ sustainable development performance: A goal-specific principal component analysis approach. J. Clean. Prod. 2021, 287, 125040. [Google Scholar] [CrossRef]
  13. Lin, B.; Zhou, Y. Measuring the green economic growth in China: Influencing factors and policy perspectives. Energy 2022, 241, 122518. [Google Scholar] [CrossRef]
  14. Pu, S.; Xia, C. Hybrid model for evaluating the transformation of China’s resource-based cities. Socio-Econ. Plan. Sci. 2024, 95, 101947. [Google Scholar] [CrossRef]
  15. Huang, S.L.; Chen, C.W. A system dynamics approach to the simulation of urban sustainability. WIT Trans. Ecol. Environ. 2024, 34, 15–24. [Google Scholar]
  16. Wu, Y.; Chen, X. A spatiotemporal evolution and pathway analysis of rural development efficiency: A case study of the Yangtze River Delta. Sustainability 2024, 16, 6543. [Google Scholar] [CrossRef]
  17. Liu, X.; Liu, Y.; Wang, B. Evaluating the sustainability of Chinese cities: Indicators based on a new data envelopment analysis model. Ecol. Indic. 2022, 137, 108779. [Google Scholar] [CrossRef]
  18. Du, K.; Cheng, Y.; Yao, X. Environmental regulation, green technology innovation, and industrial structure upgrading: The road to the green transformation of Chinese cities. Energy Econ. 2021, 98, 105247. [Google Scholar] [CrossRef]
  19. Shao, S.; Luan, R.; Yang, Z.; Li, C. Does directed technological change get greener: Empirical evidence from Shanghai’s industrial green development transformation. Ecol. Indic. 2016, 69, 758–770. [Google Scholar] [CrossRef]
  20. Cheng, M.; Wang, J.; Yang, S.; Li, Q. The driving effect of technological innovation on green development: From the perspective of efficiency. Energy Policy 2024, 188, 114089. [Google Scholar] [CrossRef]
  21. Wang, H.; Kang, C. Digital economy and the green transformation of manufacturing industry: Evidence from Chinese cities. Front. Environ. Sci. 2024, 12, 1324117. [Google Scholar] [CrossRef]
  22. Jabeen, G.; Wang, D.; Pinzón, S.; Işık, C.; Ahmad, M.; Rehman, A.; Anser, M.K. Promoting green taxation and sustainable energy transition for low-carbon development. Geosci. Front. 2025, 16, 101928. [Google Scholar] [CrossRef]
  23. Siewers, S.; Martínez-Zarzoso, I.; Baghdadi, L. Global value chains and firms’ environmental performance. World Dev. 2024, 173, 106395. [Google Scholar] [CrossRef]
  24. Xiong, W.; Guo, X.; Sun, Y.; Ou, J.J. Green standard and green development: Theory and empirical evidence. J. Clean. Prod. 2023, 414, 137768. [Google Scholar] [CrossRef]
  25. Gasparini, M.; Ives, M.C.; Carr, B.; Fry, S.; Beinhocker, E. Model-based financial regulations impair the transition to net-zero carbon emissions. Nat. Clim. Change 2024, 14, 476–481. [Google Scholar] [CrossRef]
  26. Xu, C.; Sun, G.; Kong, T. The impact of digital transformation on enterprise green innovation. Int. Rev. Econ. Finance 2024, 90, 1–12. [Google Scholar] [CrossRef]
  27. Dong, C.; Shen, Y.; Geng, G. Green innovation driven by digital transformation: An innovation chain perspective. Systems 2024, 12, 349. [Google Scholar] [CrossRef]
  28. El-Kassar, A.N.; Singh, S.K. Green innovation and organizational performance: The influence of big data and the moderating role of management commitment and HR practices. Technol. Forecast. Soc. Change 2019, 144, 483–498. [Google Scholar] [CrossRef]
  29. Cioffi, R.; Travaglioni, M.; Piscitelli, G.; Petrillo, A.; De Felice, F. Artificial intelligence and machine learning applications in smart production: Progress, trends, and directions. Sustainability 2020, 12, 492. [Google Scholar] [CrossRef]
  30. Kromann, L.; Malchow-Møller, N.; Skaksen, J.R.; Sørensen, A. Automation and productivity—A cross-country, cross-industry comparison. Ind. Corp. Change 2020, 29, 265–287. [Google Scholar] [CrossRef]
  31. Yang, X.; Chen, H.; Li, B.; Jia, D.; Ahmad, M. The relationship between artificial intelligence, geopolitical risk, and green growth: Exploring the moderating role of green finance and energy technology. Technol. Forecast. Soc. Change 2025, 217, 124135. [Google Scholar] [CrossRef]
  32. Feng, C.; Ye, X.; Li, J.; Yang, J. How does artificial intelligence affect the transformation of China’s green economic growth? An analysis from internal-structure perspective. J. Environ. Manag. 2024, 351, 119923. [Google Scholar] [CrossRef] [PubMed]
  33. Zhao, P.; Gao, Y.; Sun, X. How does artificial intelligence affect green economic growth?—Evidence from China. Sci. Total Environ. 2022, 834, 155306. [Google Scholar] [CrossRef] [PubMed]
  34. Li, P.; Ouyang, Y. Technical change and green productivity. Environ. Resour. Econ. 2020, 76, 271–298. [Google Scholar] [CrossRef]
  35. Li, D.; Wang, H.; Wang, J. Artificial intelligence and technological innovation: Evidence from China’s strategic emerging industries. Sustainability 2024, 16, 7226. [Google Scholar] [CrossRef]
  36. Gu, R.; Li, C.; Yang, Y.; Zhang, J. The impact of industrial digital transformation on green development efficiency considering the threshold effect of regional collaborative innovation: Evidence from the Beijing-Tianjin-Hebei urban agglomeration in China. J. Clean. Prod. 2023, 420, 138345. [Google Scholar] [CrossRef]
  37. Liu, Y.; Tang, T.; Ah, R.; Luo, L. Has digital technology promoted the restructuring of global value chains? Evidence from China. Econ. Anal. Policy 2024, 81, 269–280. [Google Scholar] [CrossRef]
  38. Zander, U.; Lu, L.; Chimenti, G. The platform economy and futures of market societies: Salient tensions in ecosystem evolution. J. Bus. Res. 2025, 189, 115037. [Google Scholar] [CrossRef]
  39. Li, J.; Shirowzhan, S.; Pignatta, G.; Sepasgozar, S.M. Data-driven net-zero carbon monitoring: Applications of geographic information systems, building information modelling, remote sensing, and artificial intelligence for sustainable and resilient cities. Sustainability 2024, 16, 6285. [Google Scholar] [CrossRef]
  40. Durden, J.M. Environmental management using a digital twin. Environ. Sci. Policy 2025, 164, 104018. [Google Scholar] [CrossRef]
  41. Ma, X.; Feng, X.; Fu, D.; Tong, J.; Ji, M. How does the digital economy impact sustainable development?—An empirical study from China. J. Clean. Prod. 2024, 434, 140079. [Google Scholar] [CrossRef]
  42. Bertrand, M.; Duflo, E.; Mullainathan, S. How much should we trust differences-in-differences estimates? Q. J. Econ. 2004, 119, 249–275. [Google Scholar] [CrossRef]
  43. Fotheringham, A.S.; Yang, W.; Kang, W. Multiscale geographically weighted regression (MGWR). Ann. Am. Assoc. Geogr. 2017, 107, 1247–1265. [Google Scholar] [CrossRef]
  44. Tone, K. A slacks-based measure of efficiency in data envelopment analysis. Eur. J. Oper. Res. 2001, 130, 498–509. [Google Scholar] [CrossRef]
  45. Xie, R.; Yao, S.; Han, F.; Fang, J. Land finance, producer services agglomeration, and green total factor productivity. Int. Reg. Sci. Rev. 2019, 42, 550–579. [Google Scholar] [CrossRef]
  46. Peng, Z.; Huang, Y.; Liu, L.; Xu, W.; Qian, X. How government digital attention alleviates enterprise financing constraints: An enterprise digitalization perspective. Finance Res. Lett. 2024, 67, 105883. [Google Scholar] [CrossRef]
  47. Yang, M.J.; Zhu, N. Online public opinion attention, digital transformation, and green investment: A deep learning model based on artificial intelligence. J. Environ. Manag. 2024, 371, 123294. [Google Scholar] [CrossRef]
  48. Wang, L.; Long, Y.; Li, C. Research on the impact mechanism of heterogeneous environmental regulation on enterprise green technology innovation. J. Environ. Manag. 2022, 322, 116127. [Google Scholar] [CrossRef] [PubMed]
  49. Gan, C.; Zheng, R.; Yu, D. An empirical study on the effects of industrial structure on economic growth and fluctuations in China. Econ. Res. J. 2011, 46, 4–16+31. (In Chinese) [Google Scholar]
  50. Tao, W.; Weng, S.; Chen, X.; ALHussan, F.B.; Song, M. Artificial intelligence-driven transformations in low-carbon energy structure: Evidence from China. Energy Econ. 2024, 136, 107719. [Google Scholar] [CrossRef]
  51. Zhang, Y.; Zhang, J. Environmental governance and regional green development: Evidence from China. J. Clean. Prod. 2024, 447, 141643. [Google Scholar] [CrossRef]
  52. Shang, Y.; Sang, S.; Tiwari, A.K.; Khan, S.; Zhao, X. Impacts of renewable energy on climate risk: A global perspective for energy transition in a climate adaptation framework. Appl. Energy 2024, 362, 122994. [Google Scholar] [CrossRef]
  53. Guo, X.; Xu, J. Can urban digital intelligence transformation promote corporate green innovation? Evidence from China. J. Environ. Manag. 2024, 371, 123245. [Google Scholar] [CrossRef]
  54. Ren, S.; Hao, Y.; Wu, H. Digitalization and environment governance: Does internet development reduce environmental pollution? J. Environ. Plan. Manag. 2023, 66, 1533–1562. [Google Scholar] [CrossRef]
  55. Yue, L.; Han, L. The Digital Empowerment Promotes Synergistic Efficiency in Regional Pollution Reduction and Carbon Emission Reduction—Analysis of the Moderating Effects of Market Structure and Government Behavior. J. Clean. Prod. 2025, 493, 144867. [Google Scholar] [CrossRef]
Figure 1. The spatial distribution of each city’s average regional green development and digital intelligence throughout time.
Sustainability 17 06728 g001
Figure 2. The spatial distribution of regression coefficients of digital intelligence.
Sustainability 17 06728 g002
Table 1. Descriptive statistics of sample variables.
VariablesDescriptionObs.MeanS.D.Min.Max.Skew.
RGDRegional green development33241.321 0.490 0.353 3.477 1.509
DIDigital intelligence index33240.860 0.808 0.032 4.687 2.356
GPAGreen patent applications33240.064 0.149 0.000 1.017 4.353
GPLGreen patent grants33240.422 0.978 0.002 6.643 4.353
AISAdvancement of industrial structure33241.071 0.557 0.318 3.704 2.055
WEWastewater emissions33240.571 0.625 0.018 3.485 2.370
SODESO2 emissions33240.350 0.428 0.006 2.474 2.514
SDESmoke and dust emissions33242.544 3.147 0.060 20.400 3.127
DFDLevel of financial development33242.576 1.159 1.042 6.789 1.428
ISIndustrial structure33240.451 0.107 0.173 0.714 −0.142
REDRegional economic density33240.329 0.529 0.009 3.365 3.633
PDPopulation density33245.765 0.928 3.255 8.126 −0.245
DODegree of openness33240.185 0.290 0.002 1.727 3.230
Table 2. Results of baseline regression.
(1)(2)(3)(4)(5)(6)
DI0.188 ***0.188 ***0.179 ***0.158 ***0.165 ***0.163 ***
(0.044)(0.044)(0.043)(0.054)(0.053)(0.052)
DFD 0.0260.045 **0.049 **0.049 **0.049 **
(0.020)(0.022)(0.022)(0.022)(0.022)
IS 0.608 **0.579 **0.597 **0.594 **
(0.269)(0.264)(0.264)(0.262)
RED 0.0940.1660.144
(0.163)(0.176)(0.171)
PD –0.346 **−0.340 **
(0.174)(0.173)
DO −0.126
(0.085)
Constant1.160 ***1.093 ***0.776 ***0.767 ***2.725 ***2.725 ***
(0.038)(0.058)(0.156)(0.160)(0.929)(0.927)
City FEYESYESYESYESYESYES
Year FEYESYESYESYESYESYES
Observations332433243324332433243324
Adjust R20.7530.7530.7550.7550.7570.758
Note: ***, ** indicate significance at the 1%, 5% levels, respectively; standard errors are in parentheses and clustered at the city level.
Table 3. Results of robustness test.
(1)(2)(3)(4)(5)(6)
newRGDRGDRGDRGDRGDRGD
DI0.049 *** 0.108 *0.149 ***
(0.009) (0.064)(0.056)
newDI 0.141 *** 0.191 **
(0.044) (0.096)
DIpolicy 0.091 **
(0.046)
DFD−0.0120.040 *0.047 **0.0140.054 **0.055 **
(0.009)(0.022)(0.023)(0.034)(0.021)(0.025)
IS0.0760.572 **0.612 **0.9430.834 ***0.495
(0.083)(0.265)(0.261)(0.701)(0.256)(0.308)
RED−0.0080.0840.322 **−0.0730.304 **0.084
(0.024)(0.180)(0.149)(0.225)(0.145)(0.175)
PD−0.040−0.403 **−0.307 *−0.421−0.351 **−0.247
(0.037)(0.173)(0.179)(0.404)(0.166)(0.176)
DO0.009−0.147 *−0.1170.009−0.071−0.089
(0.025)(0.085)(0.094)(0.375)(0.086)(0.088)
Constant0.515 **3.214 ***2.597 ***0.0002.633 ***2.209 **
(0.221)(0.933)(0.957)(0.000)(0.904)(0.924)
City FEYESYESYESYESYESYES
Year FEYESYESYESYESYESYES
Observations332433243324332429542766
Adjust R20.6810.7590.754 0.7580.748
Note: ***, **, * indicate significance at the 1%, 5%, and 10% levels, respectively; standard errors are in parentheses and clustered at the city level.
Table 4. Results of instrumental variable regression.
(1)(2)(3)(4)
One-period lagged digital intelligenceGeographical location characteristicsHistorical communication infrastructure development levelCombined instrumental variables
DI0.188 ***0.348 ***1.293 ***0.175 ***
(0.035)(0.071)(0.339)(0.036)
DFD0.054 ***0.037 ***−0.0110.066 ***
(0.013)(0.014)(0.028)(0.014)
IS0.733 ***0.569 ***0.718 ***1.064 ***
(0.164)(0.169)(0.278)(0.198)
RED0.162 *−0.064−1.058 ***0.188 **
(0.093)(0.116)(0.375)(0.086)
PD−0.376 ***−0.389 ***−0.771 ***−0.483 ***
(0.104)(0.103)(0.220)(0.117)
DO−0.085−0.108 *−0.116−0.139 **
(0.056)(0.060)(0.126)(0.065)
City FEYESYESYESYES
Year FEYESYESYESYES
Observations3047332426522431
Under identification160.42 ***196.63 ***20.37 ***172.52 ***
Weak identification1612.17 ***194.13 ***17.85 ***585.93 ***
Note: ***, **, * indicate significance at the 1%, 5%, and 10% levels, respectively; standard errors are in parentheses and clustered at the city level.
Table 5. Results of impact mechanism test.
(1)(2)(3)(4)(5)(6)
GPAGPLAISWESODESDE
DI0.147 ***0.858 ***0.048 **−0.162 ***−0.219 ***−0.869 ***
(0.014)(0.106)(0.022)(0.041)(0.056)(0.324)
ControlsYESYESYESYESYESYES
City FEYESYESYESYESYESYES
Year FEYESYESYESYESYESYES
Observations332433243319332433243324
Adjust R20.9420.9250.9440.9120.6440.683
Note: ***, ** indicate significance at the 1%, 5% levels, respectively; standard errors are in parentheses and clustered at the city level.
Table 6. Results of regional, city-scale, and resource endowment differences.
(1)(2)(3)(4)(5)(6)(7)(8)
EasternCentralWesternLargeMedium-sizedSmallResource-dependentNon-resource-dependent
DI0.198 ***0.0210.0900.197 ***−0.254−0.256 **−0.236 *0.213 ***
(0.068)(0.106)(0.076)(0.069)(0.173)(0.123)(0.123)(0.057)
ControlsYESYESYESYESYESYESYESYES
City FEYESYESYESYESYESYESYESYES
Year FEYESYESYESYESYESYESYESYES
Observations1200116496010081116120013082016
Adjust R20.6680.7920.8110.7540.6010.7260.7410.763
Note: ***, **, * indicate significance at the 1%, 5%, and 10% levels, respectively; standard errors are in parentheses and clustered at the city level.
Table 7. Results of quantile regression.
(1)(2)(3)(4)(5)
quantile0.1 0.25 0.5 0.75 0.9
DI0.263 ***0.281 ***0.325 ***0.390 ***0.451 ***
(0.027)(0.017)(0.022)(0.028)(0.037)
ControlsYESYESYESYESYES
City FEYESYESYESYESYES
Year FEYESYESYESYESYES
Observations33243324332433243324
Note: *** indicates significance at the 1% level, respectively; standard errors are in parentheses and clustered at the city level.
Disclaimer/Publisher’s Note: The statements, opinions and data contained in all publications are solely those of the individual author(s) and contributor(s) and not of MDPI and/or the editor(s). MDPI and/or the editor(s) disclaim responsibility for any injury to people or property resulting from any ideas, methods, instructions or products referred to in the content.

