
Exploring the Coupling Relationship Between Urbanization and Ecological Quality Based on Remote Sensing Data in Shenzhen, China


 ,
,  ,
,
Abstract
1. Introduction
2. Materials and Methods
2.1. Study Area
2.2. Data Sources and Preprocessing
2.3. Methods
2.3.1. Remote Sensing Ecological Index (RSEI) Model
2.3.2. Impervious Surface Extraction
2.3.3. Impervious Surface Proportion and Expansion Indicators
2.3.4. Coupling Coordination Model
2.3.5. Spatial Autocorrelation Analysis
3. Results
3.1. Spatiotemporal Evolution of Impervious Surfaces in Shenzhen
3.2. Ecological Quality Analysis
3.3. Coupling Coordination Analysis
3.4. Change Analysis of the Coupling Coordination Degree
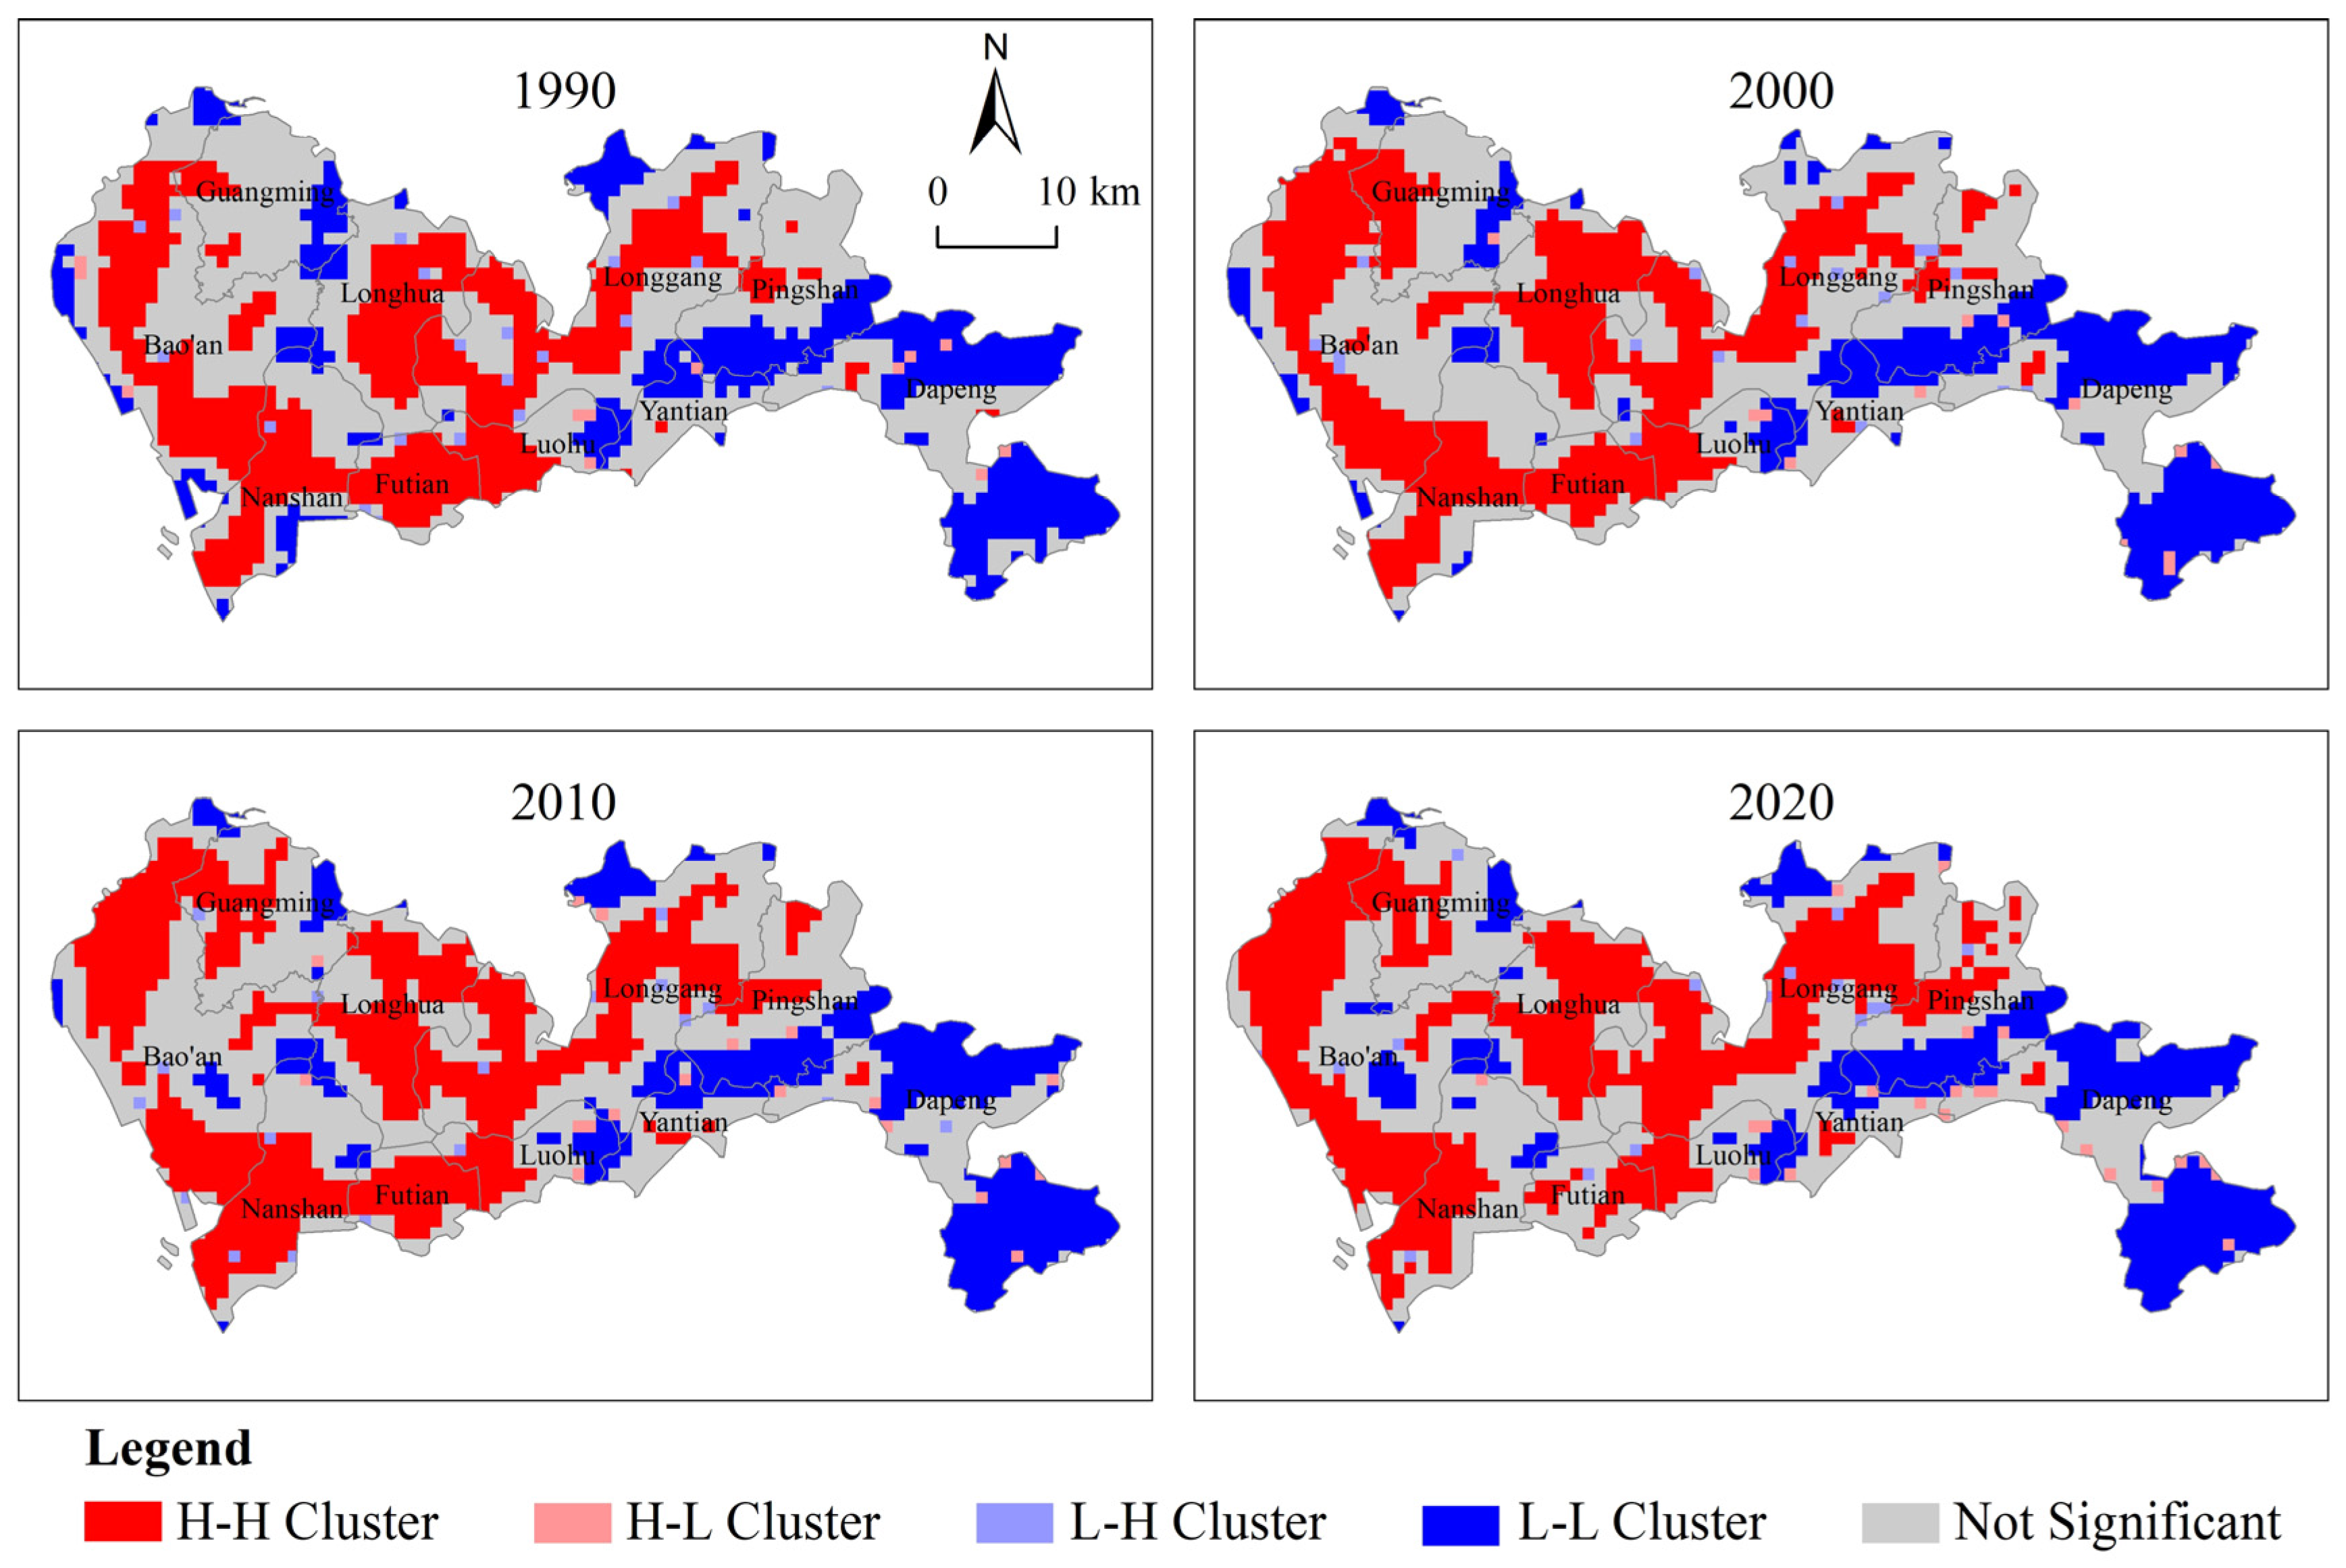
3.5. Spatial Autocorrelation Analysis of the Coupling Coordination Degree
4. Discussion
4.1. The Stage-Specific Response Mechanism of Ecological Quality to the Urbanization Process
4.2. Regional Heterogeneity in the Coordinated Development of Urbanization and Ecological Conditions
4.3. Limitations and Future Work
5. Conclusions
- (1)
- The expansion of impervious surfaces in Shenzhen exhibited distinct phased characteristics with marked spatial heterogeneity. From 1990 to 2020, the impervious surface area increased from 458.15 km2 to 709.23 km2, with an average annual growth rate of 1.47%. Spatially, rapid expansion dominated in western regions, infill development occurred in central areas, while the urban core showed slight contraction in later stages. This spatial–temporal pattern was closely associated with regional functional zoning and policy interventions in Shenzhen’s urban development.
- (2)
- Ecological quality demonstrated a “decline-recovery” trajectory. The mean RSEI decreased from 0.477 (1990) to 0.429 (2000), then recovered to 0.491 (2020). Spatially, eastern ecological conservation areas like Dapeng District maintained optimal quality, whereas central–western built-up areas initially suffered from intensive development but later improved significantly through green space restoration. This transition highlights the critical role of policy regulation in ecological recovery.
- (3)
- The coupling coordination degree (CCD) between urbanization and ecological environment improved substantially, rising from “marginal coordination” (0.548) to “primary coordination” (0.636). A clear “west-high, east-low” spatial pattern emerged: western and central regions achieved higher CCD through balanced urbanization and ecological management, while eastern areas showed limited CCD improvement due to strict conservation policies constraining urban development. This spatial differentiation underscores how regional functional positioning fundamentally influences coordinated development.
Author Contributions
Funding
Institutional Review Board Statement
Informed Consent Statement
Data Availability Statement
Conflicts of Interest
References
- Sun, L.; Chen, J.; Li, Q.; Huang, D. Dramatic uneven urbanization of large cities throughout the world in recent decades. Nat. Commun. 2020, 11, 5366. [Google Scholar] [CrossRef] [PubMed]
- United Nations. World Urbanization Prospects: The 2018 Revision; United Nations: New York, NY, USA, 2019.
- Zhu, H.; Yue, J.; Wang, H. Will China’s urbanization support its carbon peak goal?—A forecast analysis based on the improved GCAM. Ecol. Indic. 2024, 163, 112072. [Google Scholar] [CrossRef]
- Liu, H.; Chen, W.; Sun, S.; Yu, J.; Zhang, Y.; Ye, C. Revisiting China’s urban transition from the perspective of urbanisation: A critical review and analysis. Sustainability 2024, 16, 4122. [Google Scholar] [CrossRef]
- Fu, W.; Luo, C.; He, S. Does urban agglomeration promote the development of cities? An empirical analysis based on spatial econometrics. Sustainability 2022, 14, 14512. [Google Scholar] [CrossRef]
- Liu, Y.; Yang, M.; Cui, J. Urbanization, economic agglomeration and economic growth. Heliyon 2024, 10, e23772. [Google Scholar] [CrossRef]
- Mao, D.; Wang, Z.; Wu, J.; Wu, B.; Zeng, Y.; Song, K.; Yi, K.; Luo, L. China’s wetlands loss to urban expansion. Land Degrad. Dev. 2018, 29, 2644–2657. [Google Scholar] [CrossRef]
- Su, L.; Wu, S.; Fu, G.; Zhu, W.; Zhang, X.; Liang, B. Creep characterisation and microstructural analysis of municipal solid waste incineration fly ash geopolymer backfill. Sci. Rep. 2024, 14, 29828. [Google Scholar] [CrossRef] [PubMed]
- Yu, P.; Wei, Y.; Ma, L.; Wang, B.; Yung, E.H.K.; Chen, Y. Urbanization and the urban critical zone. Earth Crit. Zone 2024, 1, 100011. [Google Scholar] [CrossRef]
- Hu, J.; Zhang, F.; Qiu, B.; Zhang, X.; Yu, Z.; Mao, Y.; Wang, C.; Zhang, J. Green-gray imbalance: Rapid urbanization reduces the probability of green space exposure in early 21st century China. Sci. Total Environ. 2024, 933, 173168. [Google Scholar] [CrossRef]
- Li, G.; Fang, C.; Li, Y.; Wang, Z.; Sun, S.; He, S.; Qi, W.; Bao, C.; Ma, H.; Fan, Y.; et al. Global impacts of future urban expansion on terrestrial vertebrate diversity. Nat. Commun. 2022, 13, 1628. [Google Scholar] [CrossRef]
- Ren, Q.; He, C.; Huang, Q.; Zhang, D.; Shi, P.; Lu, W. Impacts of global urban expansion on natural habitats undermine the 2050 vision for biodiversity. Resour. Conserv. Recycl. 2023, 190, 106834. [Google Scholar] [CrossRef]
- Seto, K.C.; Güneralp, B.; Hutyra, L.R. Global forecasts of urban expansion to 2030 and direct impacts on biodiversity and carbon pools. Proc. Natl. Acad. Sci. USA 2012, 109, 16083–16088. [Google Scholar] [CrossRef] [PubMed]
- Li, F.; Wu, S.; Liu, H.; Yan, D. Biodiversity loss through cropland displacement for urban expansion in China. Sci. Total Environ. 2024, 907, 167988. [Google Scholar] [CrossRef]
- Zevenbergen, C.; Fu, D.; Pathirana, A. Transitioning to sponge cities: Challenges and opportunities to address urban water problems in China. Water 2018, 10, 1230. [Google Scholar] [CrossRef]
- Guo, A.; Yang, J.; Xiao, X.; Xia Cecilia, J.; Jin, C.; Li, X. Influences of urban spatial form on urban heat island effects at the community level in China. Sustain. Cities Soc. 2020, 53, 101972. [Google Scholar] [CrossRef]
- Fan, H.; Zhao, C.; Yang, Y. A comprehensive analysis of the spatio-temporal variation of urban air pollution in China during 2014–2018. Atmos. Environ. 2020, 220, 117066. [Google Scholar] [CrossRef]
- Cheng, Y.; Kang, Q.; Liu, K.; Cui, P.; Zhao, K.; Li, J.; Ma, X.; Ni, Q. Impact of urbanization on ecosystem service value from the perspective of spatio-temporal heterogeneity: A case study from the yellow river basin. Land 2023, 12, 1301. [Google Scholar] [CrossRef]
- Yi, Y.; Geng, Y.; Wu, J.; Liu, Y. Impact of air pollution on urbanization: Evidence at China’s city level. Chin. J. Popul. Resour. Environ. 2024, 22, 268–274. [Google Scholar] [CrossRef]
- McDonnell, M.J.; MacGregor-Fors, I. The ecological future of cities. Science 2016, 352, 936–938. [Google Scholar] [CrossRef]
- Xu, D.; Yang, F.; Yu, L.; Zhou, Y.; Li, H.; Ma, J.; Huang, J.; Wei, J.; Xu, Y.; Zhang, C.; et al. Quantization of the coupling mechanism between eco-environmental quality and urbanization from multisource remote sensing data. J. Clean. Prod. 2021, 321, 128948. [Google Scholar] [CrossRef]
- Dong, S.; Wang, X.; Dong, X.; Kong, F. Unsustainable imbalances in urbanization and ecological quality in the old industrial base province of China. Ecol. Indic. 2024, 158, 111441. [Google Scholar] [CrossRef]
- Kang, S.; Jia, X.; Zhao, Y.; Luo, M.; Wang, H.; Zhao, M. The Coupling coordination relationship between urbanization and the eco-environment in resource-based cities, Loess Plateau, China. ISPRS Int. J. Geo-Inf. 2024, 13, 437. [Google Scholar] [CrossRef]
- Lei, X.; Liu, H.; Li, S.; Luo, Q.; Cheng, S.; Hu, G.; Wang, X.; Bai, W. Coupling coordination analysis of urbanization and ecological environment in Chengdu-Chongqing urban agglomeration. Ecol. Indic. 2024, 161, 111969. [Google Scholar] [CrossRef]
- Li, C.; Chen, T.; Jia, K.; Plaza, A. Coupling analysis between ecological environment change and urbanization process in the middle reaches of Yangtze River urban agglomeration, China. IEEE J. Sel. Top. Appl. Earth Obs. Remote Sens. 2024, 17, 880–892. [Google Scholar] [CrossRef]
- Wu, W.; Huang, Y.; Zhang, Y.; Zhou, B. Research on the synergistic effects of urbanization and ecological environment in the Chengdu-Chongqing urban agglomeration based on the Haken model. Sci. Rep. 2024, 14, 117. [Google Scholar] [CrossRef]
- Chen, R.; Chen, Y.; Lyulyov, O.; Pimonenko, T. Interplay of urbanization and ecological environment: Coordinated development and drivers. Land 2023, 12, 1459. [Google Scholar] [CrossRef]
- He, L.; Zhang, X.; Zhang, X. Urbanization with the pursuit of efficiency and ecology: Theory and evidence from China. Environ. Impact Assess. 2023, 103, 107274. [Google Scholar] [CrossRef]
- Li, Y.; Li, X.; Lu, T. Coupled coordination analysis between urbanization and eco-environment in ecologically fragile areas: A case study of Northwestern Sichuan, Southwest China. Remote Sens. 2023, 15, 1661. [Google Scholar] [CrossRef]
- Li, J.; Lei, J.; Li, S.; Yang, Z.; Tong, Y.; Zhang, S.; Duan, Z. Spatiotemporal analysis of the relationship between urbanization and the eco-environment in the Kashgar metropolitan area, China. Ecol. Indic. 2022, 135, 108524. [Google Scholar] [CrossRef]
- He, J.; Wang, S.; Liu, Y.; Ma, H.; Liu, Q. Examining the relationship between urbanization and the eco-environment using a coupling analysis: Case study of Shanghai, China. Ecol. Indic. 2017, 77, 185–193. [Google Scholar] [CrossRef]
- Fang, C.; Zhou, C.; Gu, C.; Chen, L.; Li, S. A proposal for the theoretical analysis of the interactive coupled effects between urbanization and the eco-environment in mega-urban agglomerations. J. Geogr. Sci. 2017, 27, 1431–1449. [Google Scholar] [CrossRef]
- Fang, C.; Liu, H.; Wang, S. The coupling curve between urbanization and the eco-environment: China’s urban agglomeration as a case study. Ecol. Indic. 2021, 130, 108107. [Google Scholar] [CrossRef]
- Liu, N.; Liu, C.; Xia, Y.; Da, B. Examining the coordination between urbanization and eco-environment using coupling and spatial analyses: A case study in China. Ecol. Indic. 2018, 93, 1163–1175. [Google Scholar] [CrossRef]
- Cui, D.; Chen, X.; Xue, Y.; Li, R.; Zeng, W. An integrated approach to investigate the relationship of coupling coordination between social economy and water environment on urban scale—A case study of Kunming. J. Environ. Manag. 2019, 234, 189–199. [Google Scholar] [CrossRef] [PubMed]
- Dong, L.; Longwu, L.; Zhenbo, W.; Liangkan, C.; Faming, Z. Exploration of coupling effects in the Economy–Society–Environment system in urban areas: Case study of the Yangtze River Delta Urban Agglomeration. Ecol. Indic. 2021, 128, 107858. [Google Scholar] [CrossRef]
- Li, W.; Wang, Y.; Xie, S.; Cheng, X. Coupling coordination analysis and spatiotemporal heterogeneity between urbanization and ecosystem health in Chongqing municipality, China. Sci. Total Environ. 2021, 791, 148311. [Google Scholar] [CrossRef]
- Fang, C.; Cui, X.; Li, G.; Bao, C.; Wang, Z.; Ma, H.; Sun, S.; Liu, H.; Luo, K.; Ren, Y. Modeling regional sustainable development scenarios using the Urbanization and Eco-environment Coupler: Case study of Beijing-Tianjin-Hebei urban agglomeration, China. Sci. Total Environ. 2019, 689, 820–830. [Google Scholar] [CrossRef]
- Fu, S.; Zhuo, H.; Song, H.; Wang, J.; Ren, L. Examination of a coupling coordination relationship between urbanization and the eco-environment: A case study in Qingdao, China. Environ. Sci. Pollut. Res. 2020, 27, 23981–23993. [Google Scholar] [CrossRef]
- Liu, H.; Fang, C.; Li, Y. The coupled human and natural cube: A conceptual framework for analyzing urbanization and eco-environment interactions. Acta Geogr. Sin. 2019, 74, 1489–1507. [Google Scholar]
- Hu, X.; Xu, H. A new remote sensing index for assessing the spatial heterogeneity in urban ecological quality: A case from Fuzhou City, China. Ecol. Indic. 2018, 89, 11–21. [Google Scholar] [CrossRef]
- Xu, H.; Wang, M.; Shi, T.; Guan, H.; Fang, C.; Lin, Z. Prediction of ecological effects of potential population and impervious surface increases using a remote sensing based ecological index (RSEI). Ecol. Indic. 2018, 93, 730–740. [Google Scholar] [CrossRef]
- Wang, C.; Sheng, Q.; Zunling, Z. Exploring Ecological Quality and Its Driving Factors in Diqing Prefecture, China, Based on Annual Remote Sensing Ecological Index and Multi-Source Data. Land 2024, 13, 1499. [Google Scholar] [CrossRef]
- Zhang, L.; Hou, Q.; Duan, Y.; Ma, S. Spatial and Temporal Heterogeneity of Eco-Environmental Quality in Yanhe Watershed (China) Using the Remote-Sensing-Based Ecological Index (RSEI). Land 2024, 13, 780. [Google Scholar] [CrossRef]
- Wang, Z.; Hou, L.; Yang, H.; Zhao, Y.; Chen, F.; Li, Q.; Duan, Z. Spatial–Temporal Assessment of Eco-Environment Quality with a New Comprehensive Remote Sensing Ecological Index (CRSEI) Based on Quaternion Copula Function. Remote Sens. 2024, 16, 3580. [Google Scholar] [CrossRef]
- Aizizi, Y.; Kasimu, A.; Liang, H.; Zhang, X.; Zhao, Y.; Wei, B. Evaluation of ecological space and ecological quality changes in urban agglomeration on the northern slope of the Tianshan Mountains. Ecol. Indic. 2023, 146, 109896. [Google Scholar] [CrossRef]
- Shao, Z.; Ding, L.; Li, D.; Altan, O.; Huq, M.E.; Li, C. Exploring the Relationship between Urbanization and Ecological Environment Using Remote Sensing Images and Statistical Data: A Case Study in the Yangtze River Delta, China. Sustainability 2020, 12, 5620. [Google Scholar] [CrossRef]
- Li, C.; Yang, J.; Zhang, Y. Evaluation and Analysis of the Impact of Coastal Urban Impervious Surfaces on Ecological Environments. IEEE J. Sel. Top. Appl. Earth Obs. Remote Sens. 2023, 16, 8721–8733. [Google Scholar] [CrossRef]
- Wong, K.; Zhang, Y.; Cheng, Q.; Chao, M.C.; Tsou, J.Y. Comparison of Impervious Surface Dynamics through Vegetation/High-Albedo/Low-Albedo/Soil Model and Socio-Economic Factors. Land 2022, 11, 430. [Google Scholar] [CrossRef]
- Zeng, Q.; Xie, Y.; Liu, K. Assessment of the patterns of urban land covers and impervious surface areas: A case study of Shenzhen, China. Phys. Chem. Earth Parts A/B/C 2019, 110, 1–7. [Google Scholar] [CrossRef]
- Yushanjiang, A.; Zhou, W.; Wang, J.; Wang, J. Impact of urbanization on regional ecosystem services—a case study in Guangdong-Hong Kong-Macao Greater Bay Area. Ecol. Indic. 2024, 159, 111633. [Google Scholar] [CrossRef]
- Yang, C.; Zhang, C.; Li, Q.; Liu, H.; Gao, W.; Shi, T.; Liu, X.; Wu, G. Rapid urbanization and policy variation greatly drive ecological quality evolution in Guangdong-Hong Kong-Macau Greater Bay Area of China: A remote sensing perspective. Ecol. Indic. 2020, 115, 106373. [Google Scholar] [CrossRef]
- Zheng, H. Ecological Environment Changing Research Based on Multi-Temporal Remote Sensing Ecological Index of Guangdong-Hong Kong-Macao Greater Bay Area. Geogr. Sci. Res. 2019, 8, 243–250. [Google Scholar]
- Wu, B.; Qian, J.; Zeng, Y.; Zhang, L.; Yan, C.; Wang, Z.; Li, A.; Ma, R.; Yu, X.; Huang, J. Land cover atlas of the people’s republic of China (1: 1,000,000). Sci. Bull. 2017, 65, 1125–1136. [Google Scholar]
- Xu, H.; Lin, D.; Tang, F. The impact of impervious surface development on land surface temperature in a subtropical city: Xiamen, China. Int. J. Climatol. 2013, 33, 1873–1883. [Google Scholar] [CrossRef]
- Hanh Nguyen, H.; Venohr, M.; Gericke, A.; Sundermann, A.; Welti, E.A.R.; Haase, P. Dynamics in impervious urban and non-urban areas and their effects on run-off, nutrient emissions, and macroinvertebrate communities. Landsc. Urban. Plan. 2023, 231, 104639. [Google Scholar] [CrossRef]
- Mushore, T.D.; Odindi, J.; Dube, T.; Matongera, T.N.; Mutanga, O. Remote sensing applications in monitoring urban growth impacts on in-and-out door thermal conditions: A review. Remote Sens. Appl. Soc. Environ. 2017, 8, 83–93. [Google Scholar] [CrossRef]
- Hua, L.; Zhang, X.; Nie, Q.; Sun, F.; Tang, L. The Impacts of the Expansion of Urban Impervious Surfaces on Urban Heat Islands in a Coastal City in China. Sustainability 2020, 12, 475. [Google Scholar] [CrossRef]
- Meng, Q.; Zhang, L.; Sun, Z.; Meng, F.; Wang, L.; Sun, Y. Characterizing spatial and temporal trends of surface urban heat island effect in an urban main built-up area: A 12-year case study in Beijing, China. Remote Sens. Environ. 2018, 204, 826–837. [Google Scholar] [CrossRef]
- Deng, C.; Wu, C. BCI: A biophysical composition index for remote sensing of urban environments. Remote Sens. Environ. 2012, 127, 247–259. [Google Scholar] [CrossRef]
- Xu, H. Analysis of impervious surface and its impact on urban heat environment using the normalized difference impervious surface index (NDISI). Photogramm. Eng. Remote Sens. 2010, 76, 557–565. [Google Scholar] [CrossRef]
- Liu, C.; Shao, Z.; Chen, M.; Luo, H. MNDISI: A multi-source composition index for impervious surface area estimation at the individual city scale. Remote Sens. Lett. 2013, 4, 803–812. [Google Scholar] [CrossRef]
- Sun, G.; Chen, X.; Jia, X.; Yao, Y.; Wang, Z. Combinational build-up index (CBI) for effective impervious surface mapping in urban areas. IEEE J. Sel. Top. Appl. Earth Obs. Remote Sens. 2015, 9, 2081–2092. [Google Scholar] [CrossRef]
- Li, R.; Wang, G.; Zhao, Z.; Zhang, J. Spatiotemporal analysis of ecological and economic coupling coordination degree in Henan Province. Acta Ecol. Sin. 2025, 3, 1172–1183. [Google Scholar]
- He, Z.; Yang, Z.; Ding, Z.; Wang, S.; Li, H. Spatial differentiation and influencing factors of the coupling coordination degree of urbanization and eco-environment in China at city-level from 2010 to 2020. Acta Ecol. Sin. 2024, 12, 5040–5058. [Google Scholar]
- An, Q.; Yuan, X.; Chen, J.; Zhao, Y. Study on the Spatiotemporal Interaction Between Urbanization and Eco-environmental Quality in Shaanxi Province. Res. Soil Water Conserv. 2024, 2, 275–286. [Google Scholar]
- Zhu, Z.; Cao, H.; Yang, J.; Shang, H.; Ma, J. Ecological environment quality assessment and spatial autocorrelation of northern Shaanxi mining area in China based-on improved remote sensing ecological index. Front. Environ. Sci. 2024, 12, 1325516. [Google Scholar] [CrossRef]
- Xia, Q.; Chen, Y.; Zhang, X.; Ding, J. Spatiotemporal changes in ecological quality and its associated driving factors in Central Asia. Remote Sens. 2022, 14, 3500. [Google Scholar] [CrossRef]
- Costanza, R.; D’Arge, R.; de Groot, R.; Farber, S.; Grasso, M.; Hannon, B.; Limburg, K.; Naeem, S.; O’Neill, R.V.; Paruelo, J.; et al. The value of the world’s ecosystem services and natural capital. Nature 1997, 387, 253–260. [Google Scholar] [CrossRef]
- Li, G.; Wang, H.; Cao, Y.; Zhang, X.; Ning, X. Spatio-temporal evolution and influencing factors of ecological environment quality in the Changsha-Zhuzhou-Xiangtan urban agglomeration. Remote Sens. Nat. Resour. 2023, 4, 244–254. [Google Scholar]
- Zhu, D.E.; Du, H.; Zhou, G.; Hu, M.; Huang, Z. The Spatiotemporal Dynamics and Evolutionary Relationship Between Urbanization and Eco-Environmental Quality: A Case Study in Hangzhou City, China. Remote Sens. 2025, 17, 1567. [Google Scholar] [CrossRef]
- Liu, Y.; Chen, H.; Sun, F.; Dong, X. Evaluation of Effectiveness of Ecological Conservation Redline in Urbanized Areas: A Case Study of Shenzhen. Res. Environ. Sci. 2023, 7, 1329–1339. [Google Scholar]
- Zhang, Z.; Wang, J.; Xiong, N.; Liang, B.; Wang, Z. Air Pollution Exposure Based on Nighttime Light Remote Sensing and Multi-source Geographic Data in Beijing. Chin. Geogr. Sci. 2023, 33, 320–332. [Google Scholar] [CrossRef]
- Do, T.; Nguyen, D.T.; Ghimire, J.; Vu, K.; Do Dang, L.; Pham, S.; Pham, V. Assessing surface water pollution in Hanoi, Vietnam, using remote sensing and machine learning algorithms. Environ. Sci. Pollut. Res. 2023, 30, 82230–82247. [Google Scholar] [CrossRef] [PubMed]
- Shin, J.; Yu, J.; Wang, L.; Seo, J.; Hoa Huynh, H.; Jeong, G. Spectral Indices to Assess Pollution Level in Soils: Case-Adaptive and Universal Detection Models for Multiple Heavy Metal Pollution Under Laboratory Conditions. IEEE Trans. Geosci. Remote Sens. 2023, 61, 1–16. [Google Scholar] [CrossRef]


| Major Categories | Subcategories | Range |
|---|---|---|
| Uncoordinated Development | Extreme imbalance | 0 ≤ D ≤ 0.1 |
| Severe imbalance | 0.1 < D ≤ 0.2 | |
| Moderate imbalance | 0.2 < D ≤ 0.3 | |
| Mild imbalance | 0.3 < D ≤ 0.4 | |
| Transformational Development | Near imbalance | 0.4 < D ≤ 0.5 |
| Marginal coordination | 0.5 < D ≤ 0.6 | |
| Coordinated Development | Primary coordination | 0.6 < D ≤ 0.7 |
| Intermediate coordination | 0.7 < D ≤ 0.8 | |
| Good coordination | 0.8 < D ≤ 0.9 | |
| High-quality coordination | 0.9 < D ≤ 1 |
| District | 1990 | 2000 | 2010 | 2020 | ||||
|---|---|---|---|---|---|---|---|---|
| Area/km2 | Percent/% | Area/km2 | Percent/% | Area/km2 | Percent/% | Area/km2 | Percent/% | |
| Luohu | 27.99 | 35.14 | 29.26 | 36.74 | 25.84 | 32.45 | 23.96 | 30.08 |
| Futian | 45.00 | 61.45 | 48.22 | 65.86 | 38.89 | 53.12 | 26.98 | 36.85 |
| Nanshan | 55.49 | 32.17 | 72.60 | 42.09 | 78.03 | 45.23 | 59.77 | 34.65 |
| Bao’an | 103.50 | 27.67 | 166.69 | 44.56 | 202.36 | 54.10 | 193.96 | 51.85 |
| Yantian | 7.32 | 10.46 | 14.16 | 20.25 | 16.58 | 23.70 | 13.99 | 20.01 |
| Longhua | 53.94 | 30.67 | 87.99 | 50.03 | 98.40 | 55.95 | 89.16 | 50.70 |
| Pingshan | 20.82 | 12.42 | 42.13 | 25.13 | 49.56 | 29.56 | 49.15 | 29.32 |
| Guangming | 21.73 | 13.94 | 46.84 | 30.05 | 60.29 | 38.68 | 58.46 | 37.50 |
| Longgang | 109.43 | 28.22 | 168.42 | 43.43 | 193.37 | 49.86 | 173.27 | 44.68 |
| Dapeng | 12.93 | 4.47 | 23.93 | 8.27 | 22.20 | 7.67 | 20.53 | 7.09 |
| Shenzhen | 458.15 | 23.54 | 700.26 | 35.98 | 785.53 | 40.36 | 709.23 | 36.44 |
| District | 1990–2000 | 2000–2010 | 2010–2020 | |||
|---|---|---|---|---|---|---|
| Expansion Speed/km2·a−1 | Expansion Intensity/% | Expansion Speed/km2·a−1 | Expansion Intensity/% | Expansion Speed/km2·a−1 | Expansion Intensity/% | |
| Luohu | 0.13 | 0.45 | −0.34 | −1.17 | −0.19 | −0.73 |
| Futian | 0.32 | 0.72 | −0.93 | −1.93 | −1.19 | −3.06 |
| Nanshan | 1.71 | 3.08 | 0.54 | 0.75 | −1.83 | −2.34 |
| Bao’an | 6.32 | 6.11 | 3.57 | 2.14 | −0.84 | −0.42 |
| Yantian | 0.68 | 9.34 | 0.24 | 1.71 | −0.26 | −1.56 |
| Longhua | 3.41 | 6.31 | 1.04 | 1.18 | −0.92 | −0.94 |
| Pingshan | 2.13 | 10.24 | 0.74 | 1.76 | −0.04 | −0.08 |
| Guangming | 2.51 | 11.56 | 1.35 | 2.87 | −0.18 | −0.30 |
| Longgang | 5.90 | 5.39 | 2.50 | 1.48 | −2.01 | −1.04 |
| Dapeng | 1.10 | 8.51 | −0.17 | −0.72 | −0.16 | −0.75 |
| Shenzhen | 24.21 | 5.28 | 8.53 | 1.22 | −7.63 | −0.97 |
| Year | PC1 | The Eigenvector Corresponding to Each Indicator | ||||
|---|---|---|---|---|---|---|
| Eigenvalue | Eigen Percent | NDVI | WET | NDBSI | LST | |
| 1990 | 0.1338 | 75.33% | 0.2766 | 0.5919 | 0.5926 | 0.4712 |
| 2000 | 0.1413 | 75.80% | 0.3417 | 0.5692 | 0.5313 | 0.5263 |
| 2010 | 0.1859 | 80.96% | 0.3470 | 0.5096 | 0.5298 | 0.5831 |
| 2020 | 0.1942 | 85.25% | 0.3956 | 0.5341 | 0.5491 | 0.5067 |
| Unified | 0.1463 | 81.59% | 0.3620 | 0.5235 | 0.5288 | 0.5615 |
| RSEI Grades | 1990 | 2000 | 2010 | 2020 | ||||
|---|---|---|---|---|---|---|---|---|
| Area (km2) | Percentage | Area (km2) | Percentage | Area (km2) | Percentage | Area (km2) | Percentage | |
| [0, 0.2) | 398.43 | 20.9% | 509.69 | 26.8% | 614.72 | 32.3% | 437.96 | 23.0% |
| [0.2, 0.4) | 417.68 | 21.9% | 482.12 | 25.3% | 364.88 | 19.2% | 418.28 | 22.0% |
| [0.4, 0.6) | 422.30 | 22.2% | 361.82 | 19.0% | 310.01 | 16.3% | 281.81 | 14.8% |
| [0.6, 0.8) | 382.56 | 20.1% | 302.41 | 15.9% | 309.43 | 16.3% | 356.37 | 18.7% |
| [0.8, 1) | 282.71 | 14.9% | 248.61 | 13.1% | 301.99 | 15.9% | 410.64 | 21.6% |
| District | RSEI | |||||||
|---|---|---|---|---|---|---|---|---|
| 1990 | Ranking | 2000 | Ranking | 2010 | Ranking | 2020 | Ranking | |
| Luohu | 0.51 | 4 | 0.49 | 3 | 0.54 | 3 | 0.59 | 3 |
| Futian | 0.29 | 10 | 0.29 | 10 | 0.40 | 6 | 0.46 | 6 |
| Nanshan | 0.43 | 6 | 0.38 | 6 | 0.41 | 5 | 0.49 | 5 |
| Bao’an | 0.42 | 7 | 0.37 | 7 | 0.31 | 9 | 0.37 | 9 |
| Yantian | 0.69 | 2 | 0.65 | 2 | 0.67 | 2 | 0.72 | 2 |
| Longhua | 0.34 | 9 | 0.30 | 9 | 0.28 | 10 | 0.36 | 10 |
| Pingshan | 0.52 | 3 | 0.46 | 4 | 0.46 | 4 | 0.52 | 4 |
| Guangming | 0.44 | 5 | 0.39 | 5 | 0.34 | 7 | 0.39 | 8 |
| Longgang | 0.39 | 8 | 0.33 | 8 | 0.32 | 8 | 0.41 | 7 |
| Dapeng | 0.76 | 1 | 0.72 | 1 | 0.79 | 1 | 0.80 | 1 |
| Shenzhen | 0.477 | - | 0.429 | - | 0.431 | - | 0.491 | - |
| District | CCD | Grade | CCD | Grade | CCD | Grade | CCD | Grade |
|---|---|---|---|---|---|---|---|---|
| 1990 | 2000 | 2010 | 2020 | |||||
| Luohu | 0.634 | Primary coordination | 0.638 | Primary coordination | 0.622 | Primary coordination | 0.616 | Primary coordination |
| Futian | 0.682 | Primary coordination | 0.701 | Intermediate coordination | 0.695 | Primary coordination | 0.631 | Primary coordination |
| Nanshan | 0.597 | Marginal coordination | 0.636 | Primary coordination | 0.662 | Primary coordination | 0.625 | Primary coordination |
| Bao’an | 0.564 | Marginal coordination | 0.644 | Primary coordination | 0.665 | Primary coordination | 0.679 | Primary coordination |
| Yantian | 0.457 | Near imbalance | 0.553 | Marginal coordination | 0.585 | Marginal coordination | 0.562 | Marginal coordination |
| Longhua | 0.564 | Marginal coordination | 0.643 | Primary coordination | 0.660 | Primary coordination | 0.674 | Primary coordination |
| Pingshan | 0.456 | Near imbalance | 0.556 | Marginal coordination | 0.586 | Marginal coordination | 0.601 | Primary coordination |
| Guangming | 0.457 | Near imbalance | 0.573 | Marginal coordination | 0.607 | Primary coordination | 0.617 | Primary coordination |
| Longgang | 0.563 | Marginal coordination | 0.628 | Primary coordination | 0.654 | Primary coordination | 0.658 | Primary coordination |
| Dapeng | 0.367 | Mild imbalance | 0.431 | Near imbalance | 0.430 | Near imbalance | 0.422 | Near imbalance |
| Shenzhen | 0.548 | Marginal coordination | 0.618 | Primary coordination | 0.642 | Primary coordination | 0.636 | Primary coordination |
| CCD Grades | 1990 | 2000 | 2010 | 2020 | ||||
|---|---|---|---|---|---|---|---|---|
| Area (km2) | Percentage | Area (km2) | Percentage | Area (km2) | Percentage | Area (km2) | Percentage | |
| [0, 0.1) | 244.10 | 12.5% | 184.94 | 9.5% | 219.12 | 11.2% | 238.56 | 12.2% |
| [0.1, 0.2) | 135.50 | 7% | 87.74 | 4.5% | 86.67 | 4.4% | 84.01 | 4.3% |
| [0.2, 0.3) | 227.84 | 11.7% | 142.11 | 7.3% | 145.86 | 7.5% | 127.43 | 6.5% |
| [0.3, 0.4) | 272.10 | 14.0% | 177.78 | 9.1% | 143.47 | 7.4% | 142.33 | 7.3% |
| [0.4, 0.5) | 288.10 | 14.8% | 220.87 | 11.3% | 178.46 | 9.2% | 171.43 | 8.8% |
| [0.5, 0.6) | 319.20 | 16.4% | 349.63 | 18.0% | 296.36 | 15.2% | 248.57 | 12.8% |
| [0.6, 0.7) | 371.92 | 19.1% | 563.66 | 29.0% | 628.40 | 32.3% | 610.77 | 31.4% |
| [0.7, 0.8) | 84.18 | 4.3% | 210.79 | 10.8% | 225.76 | 11.6% | 305.14 | 15.7% |
| [0.8, 0.9) | 3.89 | 0.2% | 9.30 | 0.5% | 22.71 | 1.2% | 18.57 | 1% |
| Year | Moran’s I | z | p |
|---|---|---|---|
| 1990 | 0.641 | 56.248 | 0.001 |
| 2000 | 0.636 | 56.058 | 0.001 |
| 2010 | 0.620 | 54.393 | 0.001 |
| 2020 | 0.631 | 54.435 | 0.001 |
Disclaimer/Publisher’s Note: The statements, opinions and data contained in all publications are solely those of the individual author(s) and contributor(s) and not of MDPI and/or the editor(s). MDPI and/or the editor(s) disclaim responsibility for any injury to people or property resulting from any ideas, methods, instructions or products referred to in the content. |
© 2025 by the authors. Licensee MDPI, Basel, Switzerland. This article is an open access article distributed under the terms and conditions of the Creative Commons Attribution (CC BY) license (https://creativecommons.org/licenses/by/4.0/).
Share and Cite
Sun, F.; Dong, C.; Zhao, L.; Chen, J.; Wang, L.; Jiang, R.; Li, H. Exploring the Coupling Relationship Between Urbanization and Ecological Quality Based on Remote Sensing Data in Shenzhen, China. Sustainability 2025, 17, 5887. https://doi.org/10.3390/su17135887
Sun F, Dong C, Zhao L, Chen J, Wang L, Jiang R, Li H. Exploring the Coupling Relationship Between Urbanization and Ecological Quality Based on Remote Sensing Data in Shenzhen, China. Sustainability. 2025; 17(13):5887. https://doi.org/10.3390/su17135887
Chicago/Turabian StyleSun, Fangfang, Chengcheng Dong, Longlong Zhao, Jinsong Chen, Li Wang, Ruixia Jiang, and Hongzhong Li. 2025. "Exploring the Coupling Relationship Between Urbanization and Ecological Quality Based on Remote Sensing Data in Shenzhen, China" Sustainability 17, no. 13: 5887. https://doi.org/10.3390/su17135887
APA StyleSun, F., Dong, C., Zhao, L., Chen, J., Wang, L., Jiang, R., & Li, H. (2025). Exploring the Coupling Relationship Between Urbanization and Ecological Quality Based on Remote Sensing Data in Shenzhen, China. Sustainability, 17(13), 5887. https://doi.org/10.3390/su17135887