3. Materials and Methods
The conducted research analyzed the advancement of digital transformation of enterprises, as well as employment in high- and medium–high-tech manufacturing and knowledge-intensive services, which allowed carrying out the research purpose and verifying the hypotheses regarding the diversity of the EU countries in the area of digital business transformation (H1), the occurrence of different types of employment structures in high-tech and knowledge-intensive sectors (H2), the relationship between the level of digitalization and employment structure (H3) and the impact of digital business transformation on employment in individual sectors (H4).
The basis of empirical analyses aimed at diagnosing the level of digital transformation was the data on the following set of 10 indicators adopted by the European Union to monitor the advancement of digital transformation in enterprises (10 or more employees and self-employed persons):
X1—enterprises with at least a basic level of digital intensity (% of enterprises);
X2—enterprises using an ERP (enterprise resource planning) software package to share information between different functional areas (e.g., accounting, planning, production, marketing) (% of enterprises);
X3—enterprises using two or more of the following social media: social networks, enterprise blogs or microblogs, multimedia content sharing websites, wiki-based knowledge sharing tools (% of enterprises);
X4—enterprises performing data analytics (internally or externally) (% of enterprises);
X5—enterprises purchasing at least one of the following cloud computing services: hosting of the enterprise database, accounting software applications, CRM software, computing power (% of enterprises);
X6—enterprises using at least one AI technology (% of enterprises);
X7—enterprises sending e-invoices, suitable for automated processing (% of enterprises);
X8—cumulative number of unicorns;
X9—enterprises’ total turnover from e-commerce sales (% of turnover);
X10—enterprises selling at least 1% of their turnover online (% of enterprises).
The analysis of employment in high- and medium–high-technology manufacturing and knowledge-intensive services was conducted based on statistical information regarding the following elements of the sectoral structure of employment identified based on the technological intensity level:
HTM—employment in high-tech manufacturing (%);
MHTM—employment in medium–high-tech manufacturing (%);
TKIS—employment in total knowledge-intensive services (%).
The spatial scope of the study included the 27 Member States of the European Union. The temporal scope of the research covered 2023, which was determined by the availability of statistical data on the broadest and most up-to-date range of variables, ensuring a comprehensive diagnosis of the digital transformation level and the timeliness of the presented research results. Statistical information on the values of all indicators of digital transformation and elements of the sectoral employment structure was retrieved from the Eurostat database [
64].
The selection of a sample covering all 27 EU Member States in 2023 is fully adequate to carry out the research purpose and verify the formulated research hypotheses. The spatial scope of the study corresponds to the content scope of the hypotheses, which refer to the differences and dependencies occurring in the EU countries. The sample is internally diversified, since the European Union is an internally differentiated political and economic environment. It creates the necessary conditions for analyzing the statements included in hypotheses H1–H4 regarding the level of digital transformation and employment structures in high-tech and knowledge-intensive sectors.
When selecting the indicators for the digital transformation of enterprises and the period of the study, the most current and comprehensive approach to measuring digital transformation was taken into account. Thus, the completeness, comparability and timeliness of statistical data were considered. The new available set of indicators monitoring the level of digital transformation adopted by the EU in 2023 was used. This assumption also determined the temporal scope of the study. It was impossible to maintain the availability and comparability of data over a longer period. The availability of information in terms of the time range in the cross-section of indicators was very limited and diverse. For example, in the case of the share of companies performing data analytics (internally or externally) (X4), it was limited to 2023 only. The research findings reflect the current status of digitalization, which is a definite advantage of this approach as it increases their usefulness for economic and social policy.
In addition, the necessary statistical data were almost fully available. The exceptions were missing information on the X9 indicator for Italy and the shares of those working in the HTM and MHTM sectors in Luxembourg. In such cases, the indicator values from the year prior to the year under study were adopted. In addition, the information originates from a single source, the Eurostat database, which ensures its consistency, completeness and comparability across the EU countries. As a result, the adopted research sample allows for a reliable and credible verification of the research hypotheses.
The applied research procedure was designed to effectively achieve the research goal, i.e., to assess the degree of differentiation and classify the European Union countries by the advancement of digital transformation of small and medium-sized enterprises and the structure of employment in the HTM, MHTM and TKIS sectors and identify their mutual relationships.
The research was carried out according to the following research procedure consisting of five stages:
Stage 1. Description of the research sample.
This stage is the assessment of the diversity of the EU countries based on indicators monitoring the advancement of digital transformation of enterprises and on the structure of employment in high-tech manufacturing, medium–high-tech manufacturing and knowledge-intensive services using statistical descriptive parameters.
Stage 2. Linear ordering and division of the EU countries into relatively homogeneous classes according to the level of digital transformation intensity.
Stages 1 and 2 lead to the empirical verification of hypothesis H1: EU countries differ significantly in terms of the level of digital transformation of enterprises, which allows for the identification of distinct groups characterized by high, medium and low levels of advancement.
More information on linear ordering methods, with particular emphasis on the ways to normalize variables and aggregation formulas that can be used, is described, i.a., in the studies [
64,
65,
66,
67,
68,
69,
70,
71,
72,
73,
74,
75,
76].
—values of indicators X1–X10 monitoring the advancement of digital transformation in enterprises;
—normalized values of indicators X1–X10.
The zero unitarization formula was used to normalize digital transformation intensity indicators, expressed by Formula (1)—all indicators play the role of stimulants:
where
normalized value of the
j-th indicator for the
i-th object;
—value of the
j-th indicator for the
i-th object;
range of
j-th indicator values;
i = 1, …, n (n = 27);
j = 1, …, m (m = 10).
The construction and properties of the null normalization formula were characterized by K. Kukuła in his work [
72].
where
—synthetic measure of the level of digital transformation intensity of enterprises for the
i-th object country;
j = 1,…, m—the number of digital transformation indicators;
i = 1, 2,…, n—object-country number.
In the study, the individual indicators of digital transformation intensity were assigned a system of equal weights. Currently, there is no consensus in the source literature on objectively differentiating their value. The equal weights system recognizes the complementarity of components of digital business transformation and reduces the subjectivity of the applied approach. Equal weights were treated as a neutral approach to individual areas of business transformation, which turns out to be particularly important when applying the newly adopted set of digitalization indicators. More on the weighting of variables is included in the studies [
67,
70,
75].
The reduction in dimensions referring to the digital transformation of enterprises was abandoned in the analysis, as the study aimed not only at using an aggregate measure to assess the level of development of a complex phenomenon such as digital transformation, but also at maintaining transparency and comprehensibility for the final recipients (e.g., policymakers or government representatives). Equal weighting and consideration of all indicators allows for an intuitive understanding of the contribution of various components of digital transformation. In addition, the set of monitoring indicators for 2023 was modified by the EU due to the indicators’ informative value and relevance for measuring the current state of digital transformation. Abandoning the reduction in dimensions enabled them to be fully incorporated into the construction of a synthetic measure and thus enabled the level of digitalization of enterprises to be assessed.
The indicators monitoring the digital transformation intensity of enterprises, normalized using the zero unitarization method, take values in the [0, 1] interval; therefore, synthetic measures of digital transformation intensity are characterized by the following value:
Sensitivity analysis was conducted to assess the robustness of the synthetic measure to changes in the set of sub-indicators. For this purpose, a procedure was used that involved sequentially eliminating each of the ten indicators of digital transformation and recalculating the value of the synthetic measure for all countries. The resulting rankings were then compared with the baseline ranking (based on the full set of digitalization indicators) using Spearman’s rank correlation coefficient. The values of this coefficient for each of the analyzed versions of the synthetic measure allow verifying its stability and the absence of dominance of individual indicators in the structure of the synthetic measure.
Class 1—countries characterized by the lowest level of digital transformation intensity:
Class 2—countries presenting a higher level of digital transformation intensity than the ones grouped in Class 1:
Analogically, the subsequent classes and the last identified
k-th class include countries with the highest level of digital transformation intensity:
where R—range of synthetic measure value of the complex digital transformation intensity;
k—the number of classes adopted a priori.
The research adopted an arbitrary division into 3 classes of countries characterized by low, medium and high levels of digital transformation of enterprises, referring to research hypothesis H1. This approach also struck a balance between detail and clarity of interpretation, allowing the formulation of recommendations arising from the research.
Stage 3. Classification of the EU countries into groups with similar employment structures in high-tech, medium–high-tech and knowledge-intensive service sectors.
The third research stage focused on assessing hypothesis H2: European Union countries are characterized by different types of employment structures in the high-tech, medium–high-tech and knowledge-intensive service sectors, reflecting different models of economic transformation—from industrial specialization, through a balanced structure, to the dominance of knowledge-intensive services.
Ward’s hierarchical classification method and k-means clustering were used to carry out this stage of the research. More information on the classification methods can be found in the studies [
77,
78,
79,
80,
81,
82,
83]. This stage included the following steps:
Using Ward’s hierarchical classification method, based on the dendrogram structure and the course of the agglomeration process, to determine the optimal number of classes best reflecting the diversity of the analyzed countries in terms of employment structure. The squared Euclidean distance was used to determine the distance between countries.
Division of the EU countries into relatively homogeneous classes using k-means clustering.
Determining the typology classes of the EU countries regarding the structure of employment in high-tech manufacturing, medium–high-tech manufacturing and knowledge-intensive services.
Stage 4. The identification of differences in the structure of employment in the HTM, MHTM and TKIS sectors between the groups of EU countries characterized by different levels of digital transformation.
The fourth research stage allowed verifying hypothesis H3: Employment structures in the high- and medium–high-tech and TKIS sectors differ significantly between the groups of EU countries presenting high and low levels of digital transformation—the countries with higher levels of digitalization are characterized by a higher share of employment in the TKIS sector.
Stage 5. The assessment of relationships between the level of digital transformation advancement and the structure of employment in the HTM, MHTM and TKIS sectors between the groups of EU countries with different levels of digital transformation in the EU countries using regression analysis.
The robustness of the models was assessed in two ways: by identifying and, if necessary, excluding influential outliers based on scatterplot diagnostics, and by estimating extended regression models that included control variables such as GDP per capita and GERD per capita. These steps were undertaken to ensure the statistical reliability and substantive validity of the obtained results.
Stage 5 of the research allowed the verification of research hypothesis H4: There is a positive relationship between the level of digital business transformation in the EU countries and the employment structure of the HTM, MHTM and TKIS sectors, with the strongest impact observed in the case of knowledge-intensive services.
The Eurostat database was the information basis of the empirical research. The research procedure was conducted using STATISTICA 13.3.
4. Results
4.1. Description of the Research Sample
The assessment of the diversity of EU countries was conducted based on the indicators monitoring the advancement of digital transformation in enterprises.
Table 1 shows the selected descriptive parameters of the digital transformation of business indicators (for the output data before normalization).
Table 1 also presents information on the countries characterized by minimum or maximum values of individual indicators showing the intensity of digital transformation of enterprises.
It is worth noting that the smallest, and therefore the lowest rated, values of indicators forming the basis for assessing the advancement of digital transformation were characterized by the countries of the so-called new EU enlargement. Luxembourg is the exception in the share of enterprises selling at least 1% of their turnover online (X10). In turn, the most favorable values for the majority of indicators referred to the so-called old EU countries. Only Hungary and the Czech Republic stood out in this respect regarding the % of enterprises performing data analytics (X4) and % of enterprises’ total turnover from e-commerce sales (X9), respectively.
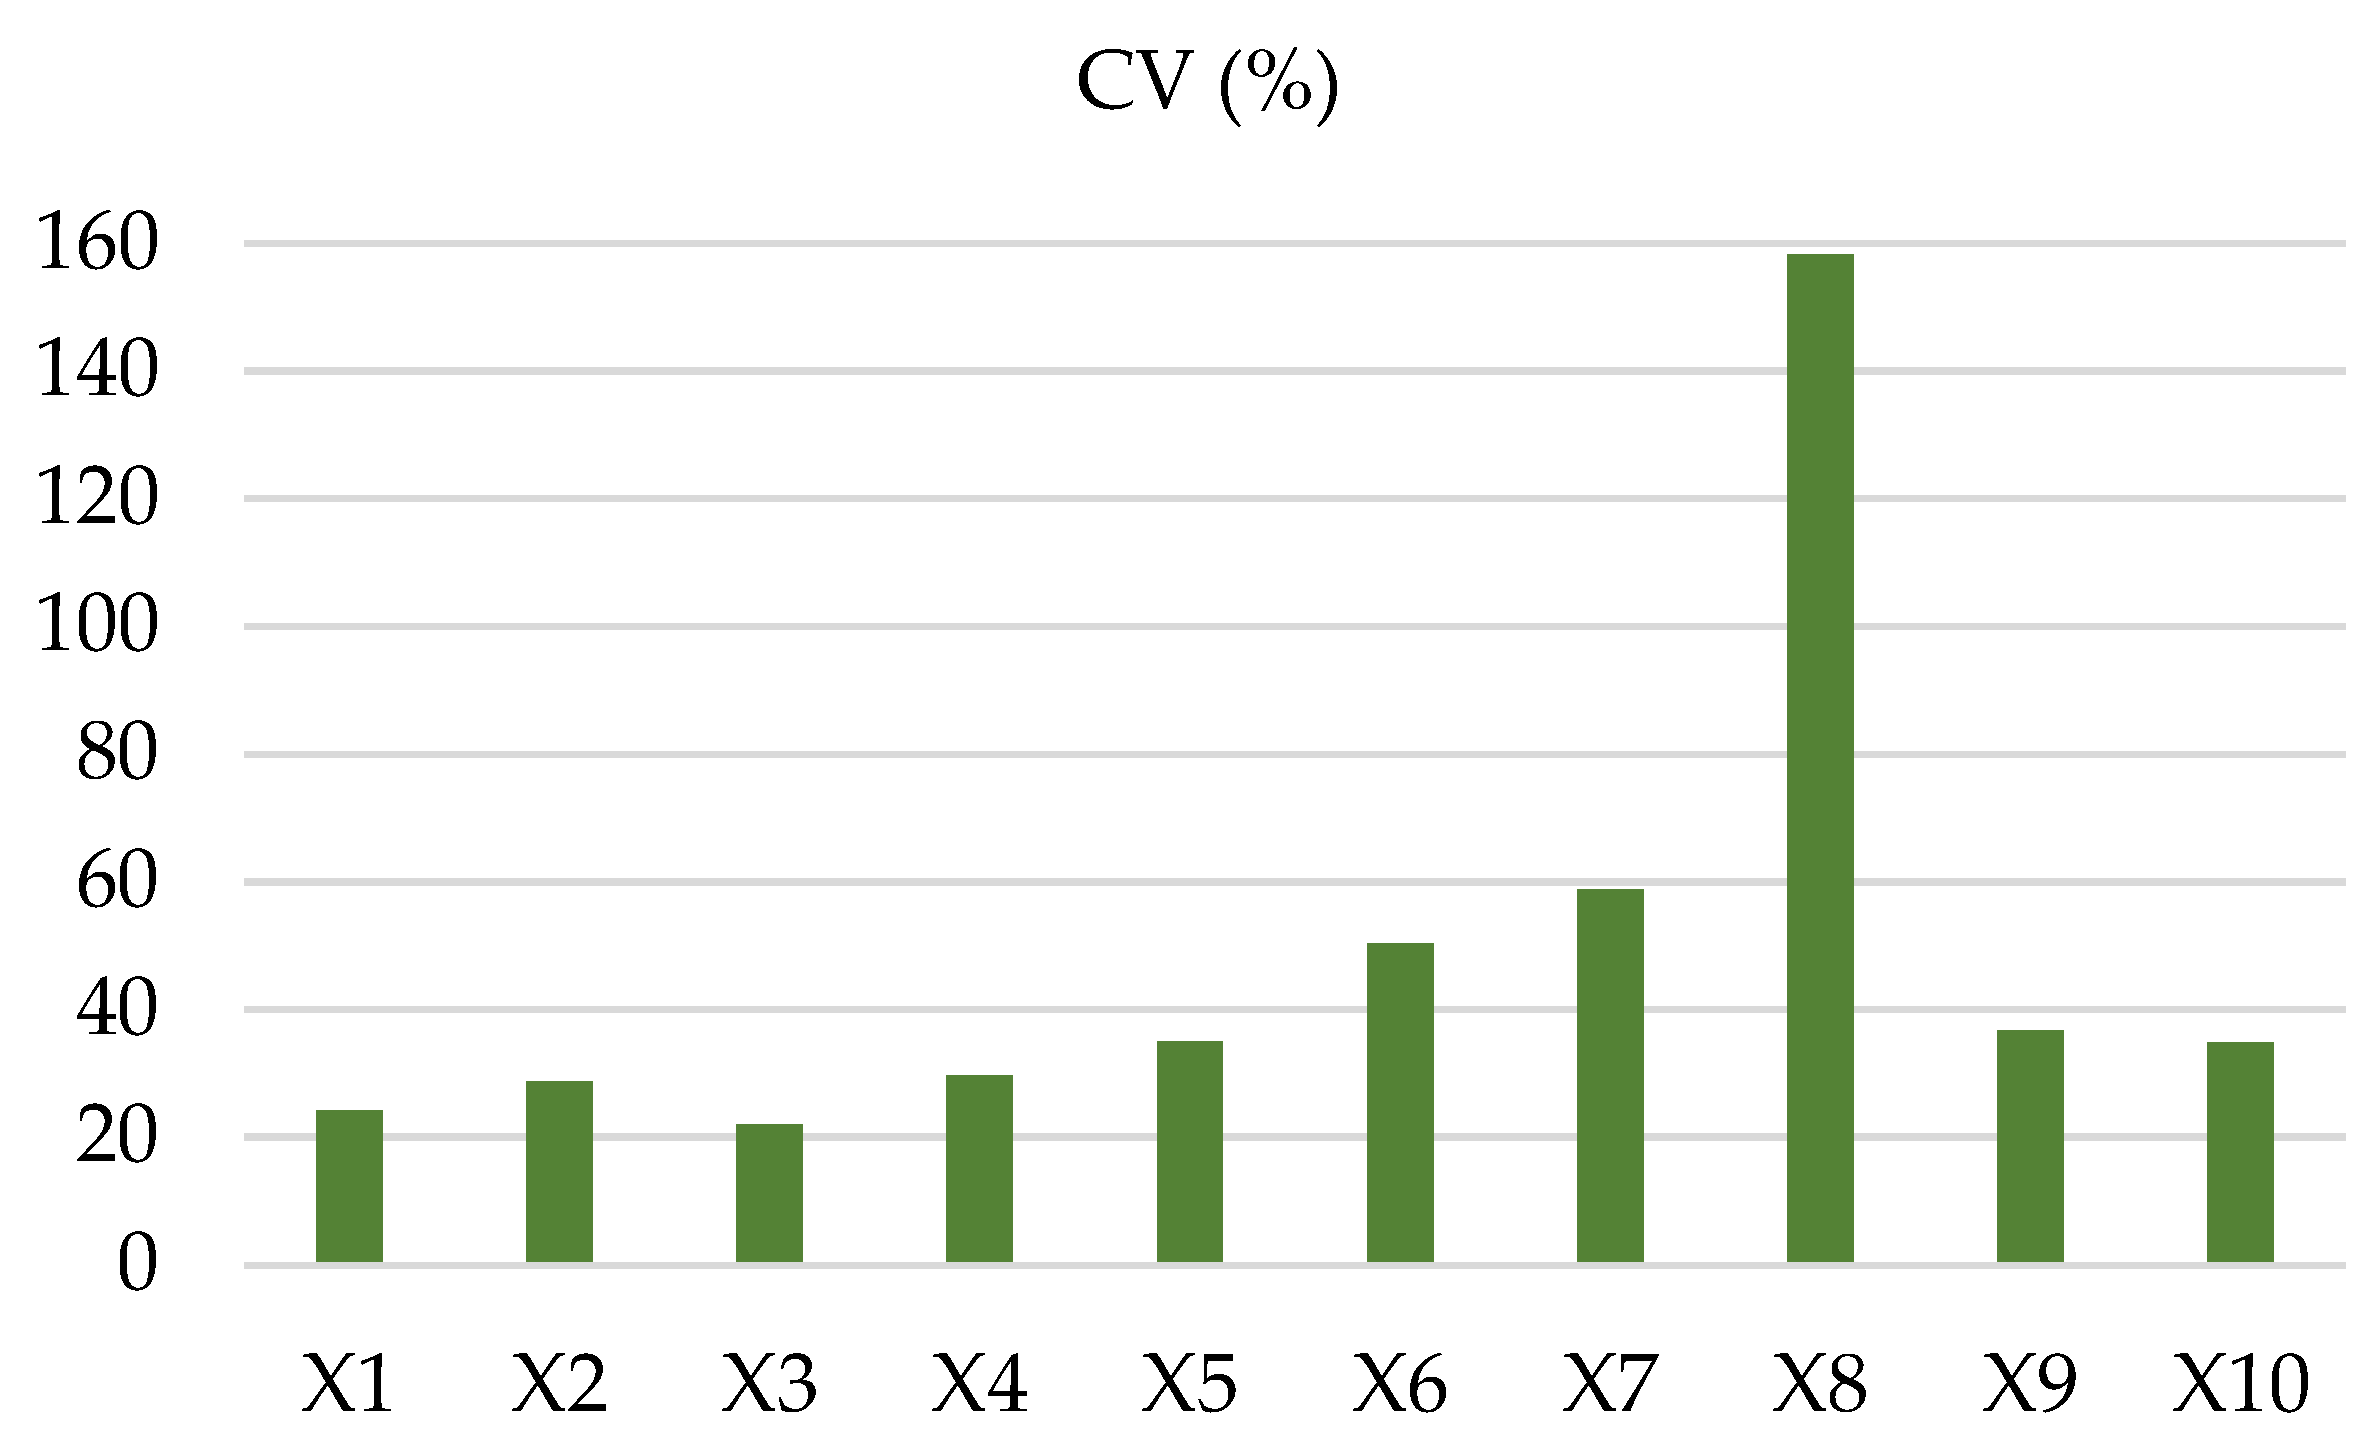
Figure 1 shows the values of coefficients of variation for all analyzed digital transformation intensity indicators. Its analysis shows that the diversification of the EU countries can be considered significant. In the case of each of the analyzed transformation indicators, the coefficient of variation exceeds 20%. The EU countries are characterized by extremely high variability regarding the cumulative number of unicorns (X
8).
Next, the assessment of the EU countries’ diversity based on the structure of employment in high-tech manufacturing, medium–high-tech manufacturing and knowledge-intensive services was performed.
Table 2 shows the values of descriptive parameters regarding the share of employment in high- and medium–high-technology manufacturing and knowledge-intensive services.
Table 2 also presents information on the EU countries characterized by the minimum or maximum values of the share of employment in the analyzed sectors. The structure of employment in Luxembourg is characteristic and features the lowest share of employment in the high- and medium–high-tech sectors and the highest share of employment in knowledge-intensive services.
Figure 2 illustrates the clear difference in the differentiation of the European Union countries regarding the share of employment in each sector of technological advancement of the economy.
It can be observed that the EU countries are characterized by a very large and by far dominant diversification in the share of those working in the medium–high tech sector, followed by the high-tech sector. The countries also differ in the share of employment in knowledge-intensive services, but the dispersion in this area is much smaller.
The research sample covering 27 EU countries is clearly diversified both in terms of indicators showing digital intensity and the share of employment in the high-tech sectors and knowledge-intensive services.
4.2. Linear Ordering and Division of the EU Countries into the Relatively Homogeneous Classes According to the Level of Digital Transformation Intensity
This section presents findings obtained after the application of stage 2 of the research procedure, which provide the empirical basis for the verification of hypothesis H1: EU countries differ significantly in terms of the level of digital transformation of enterprises, which allows for the identification of distinct groups characterized by high, medium and low levels of advancement.
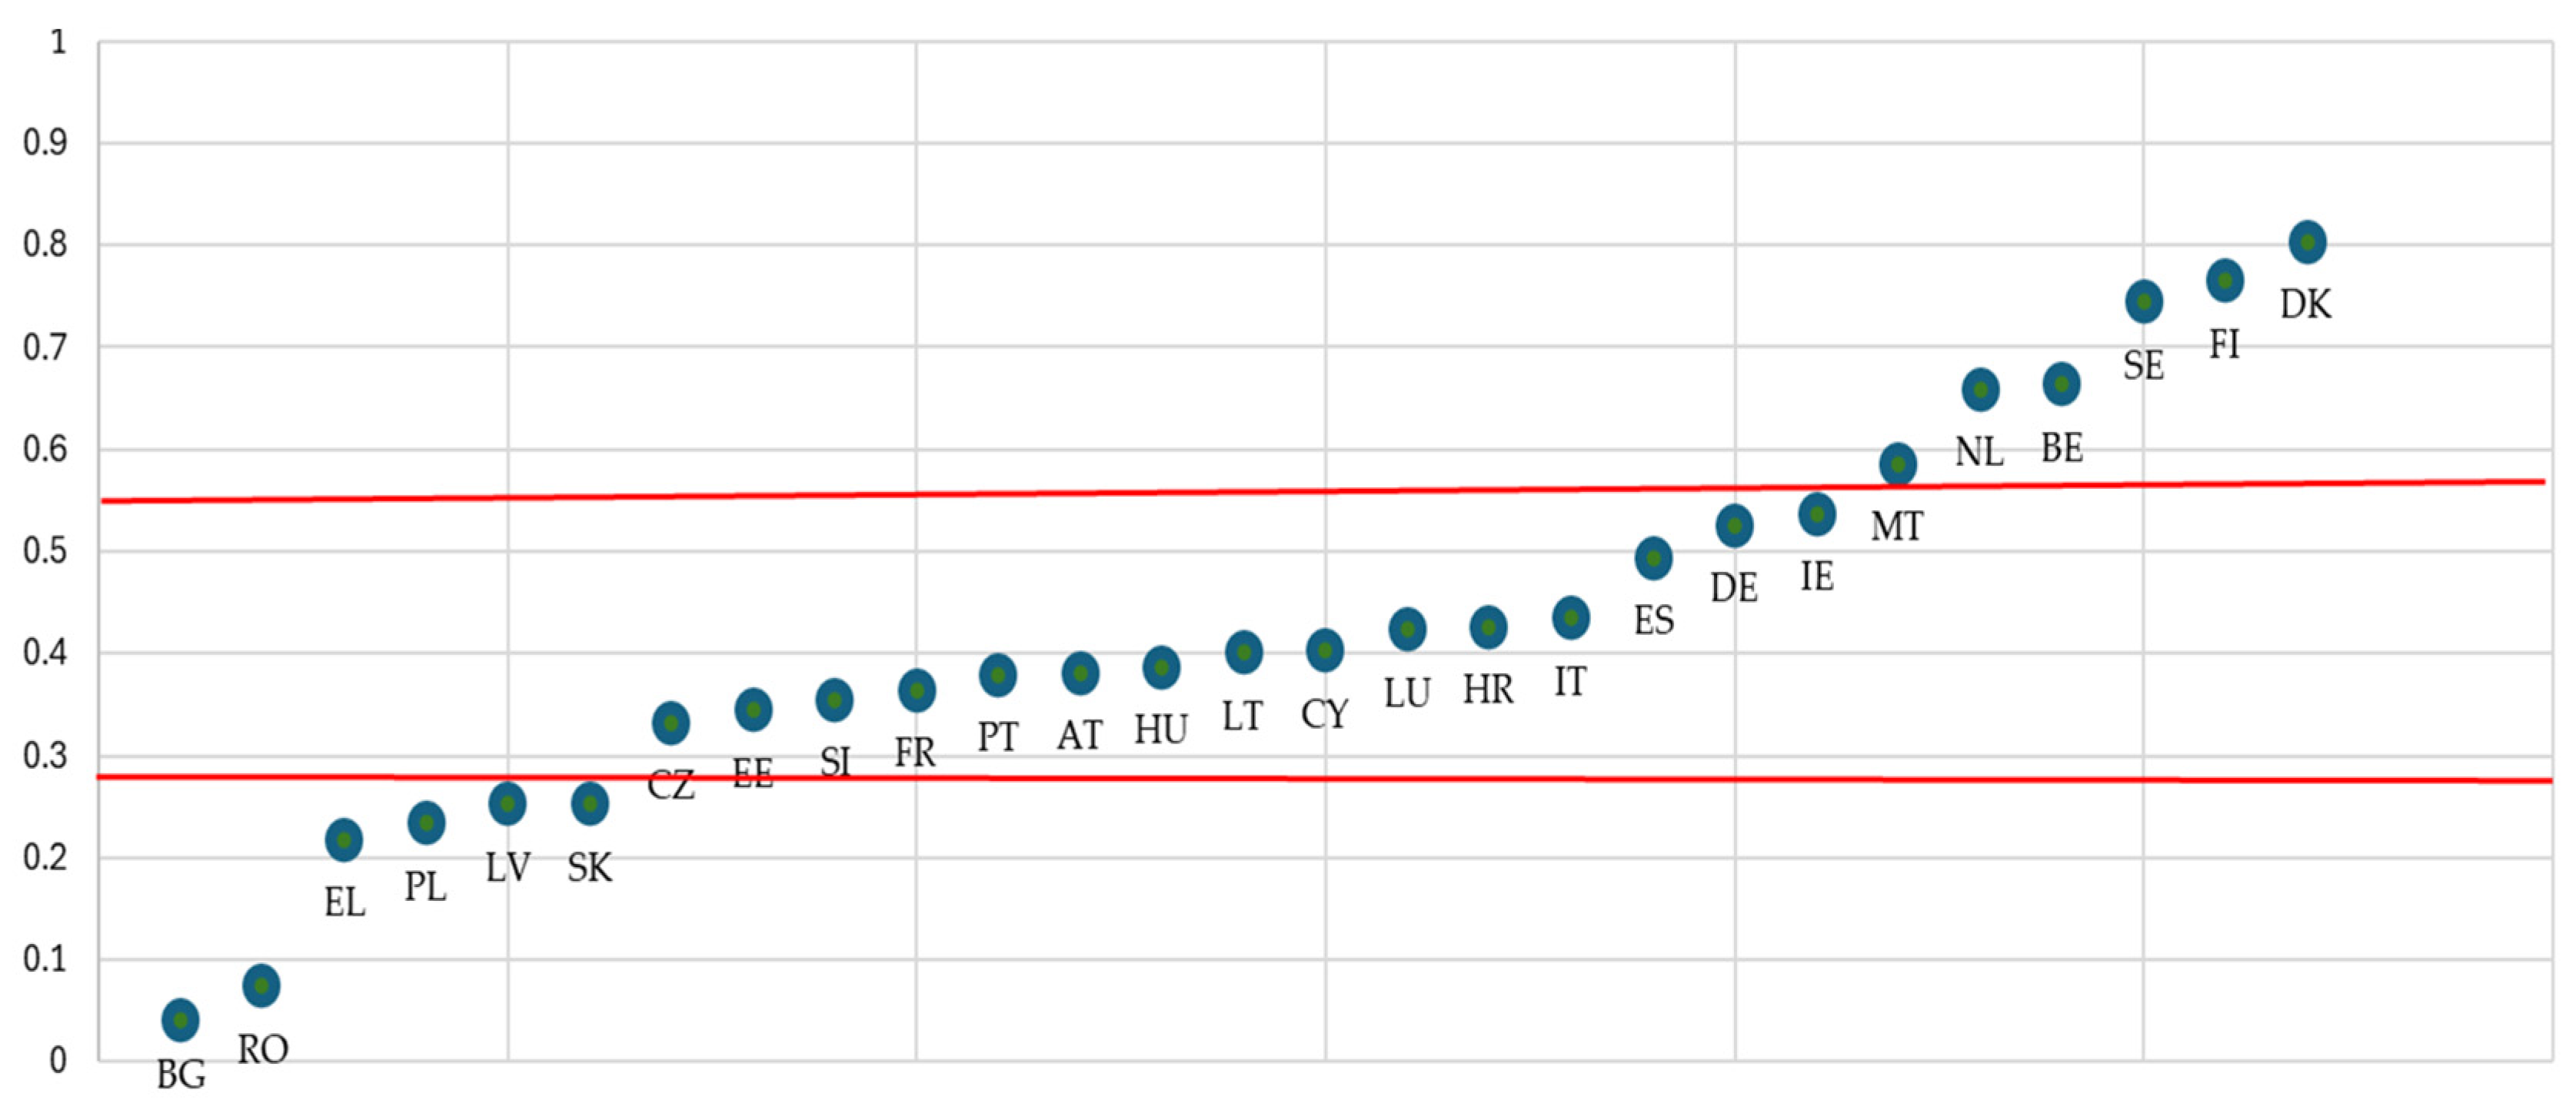
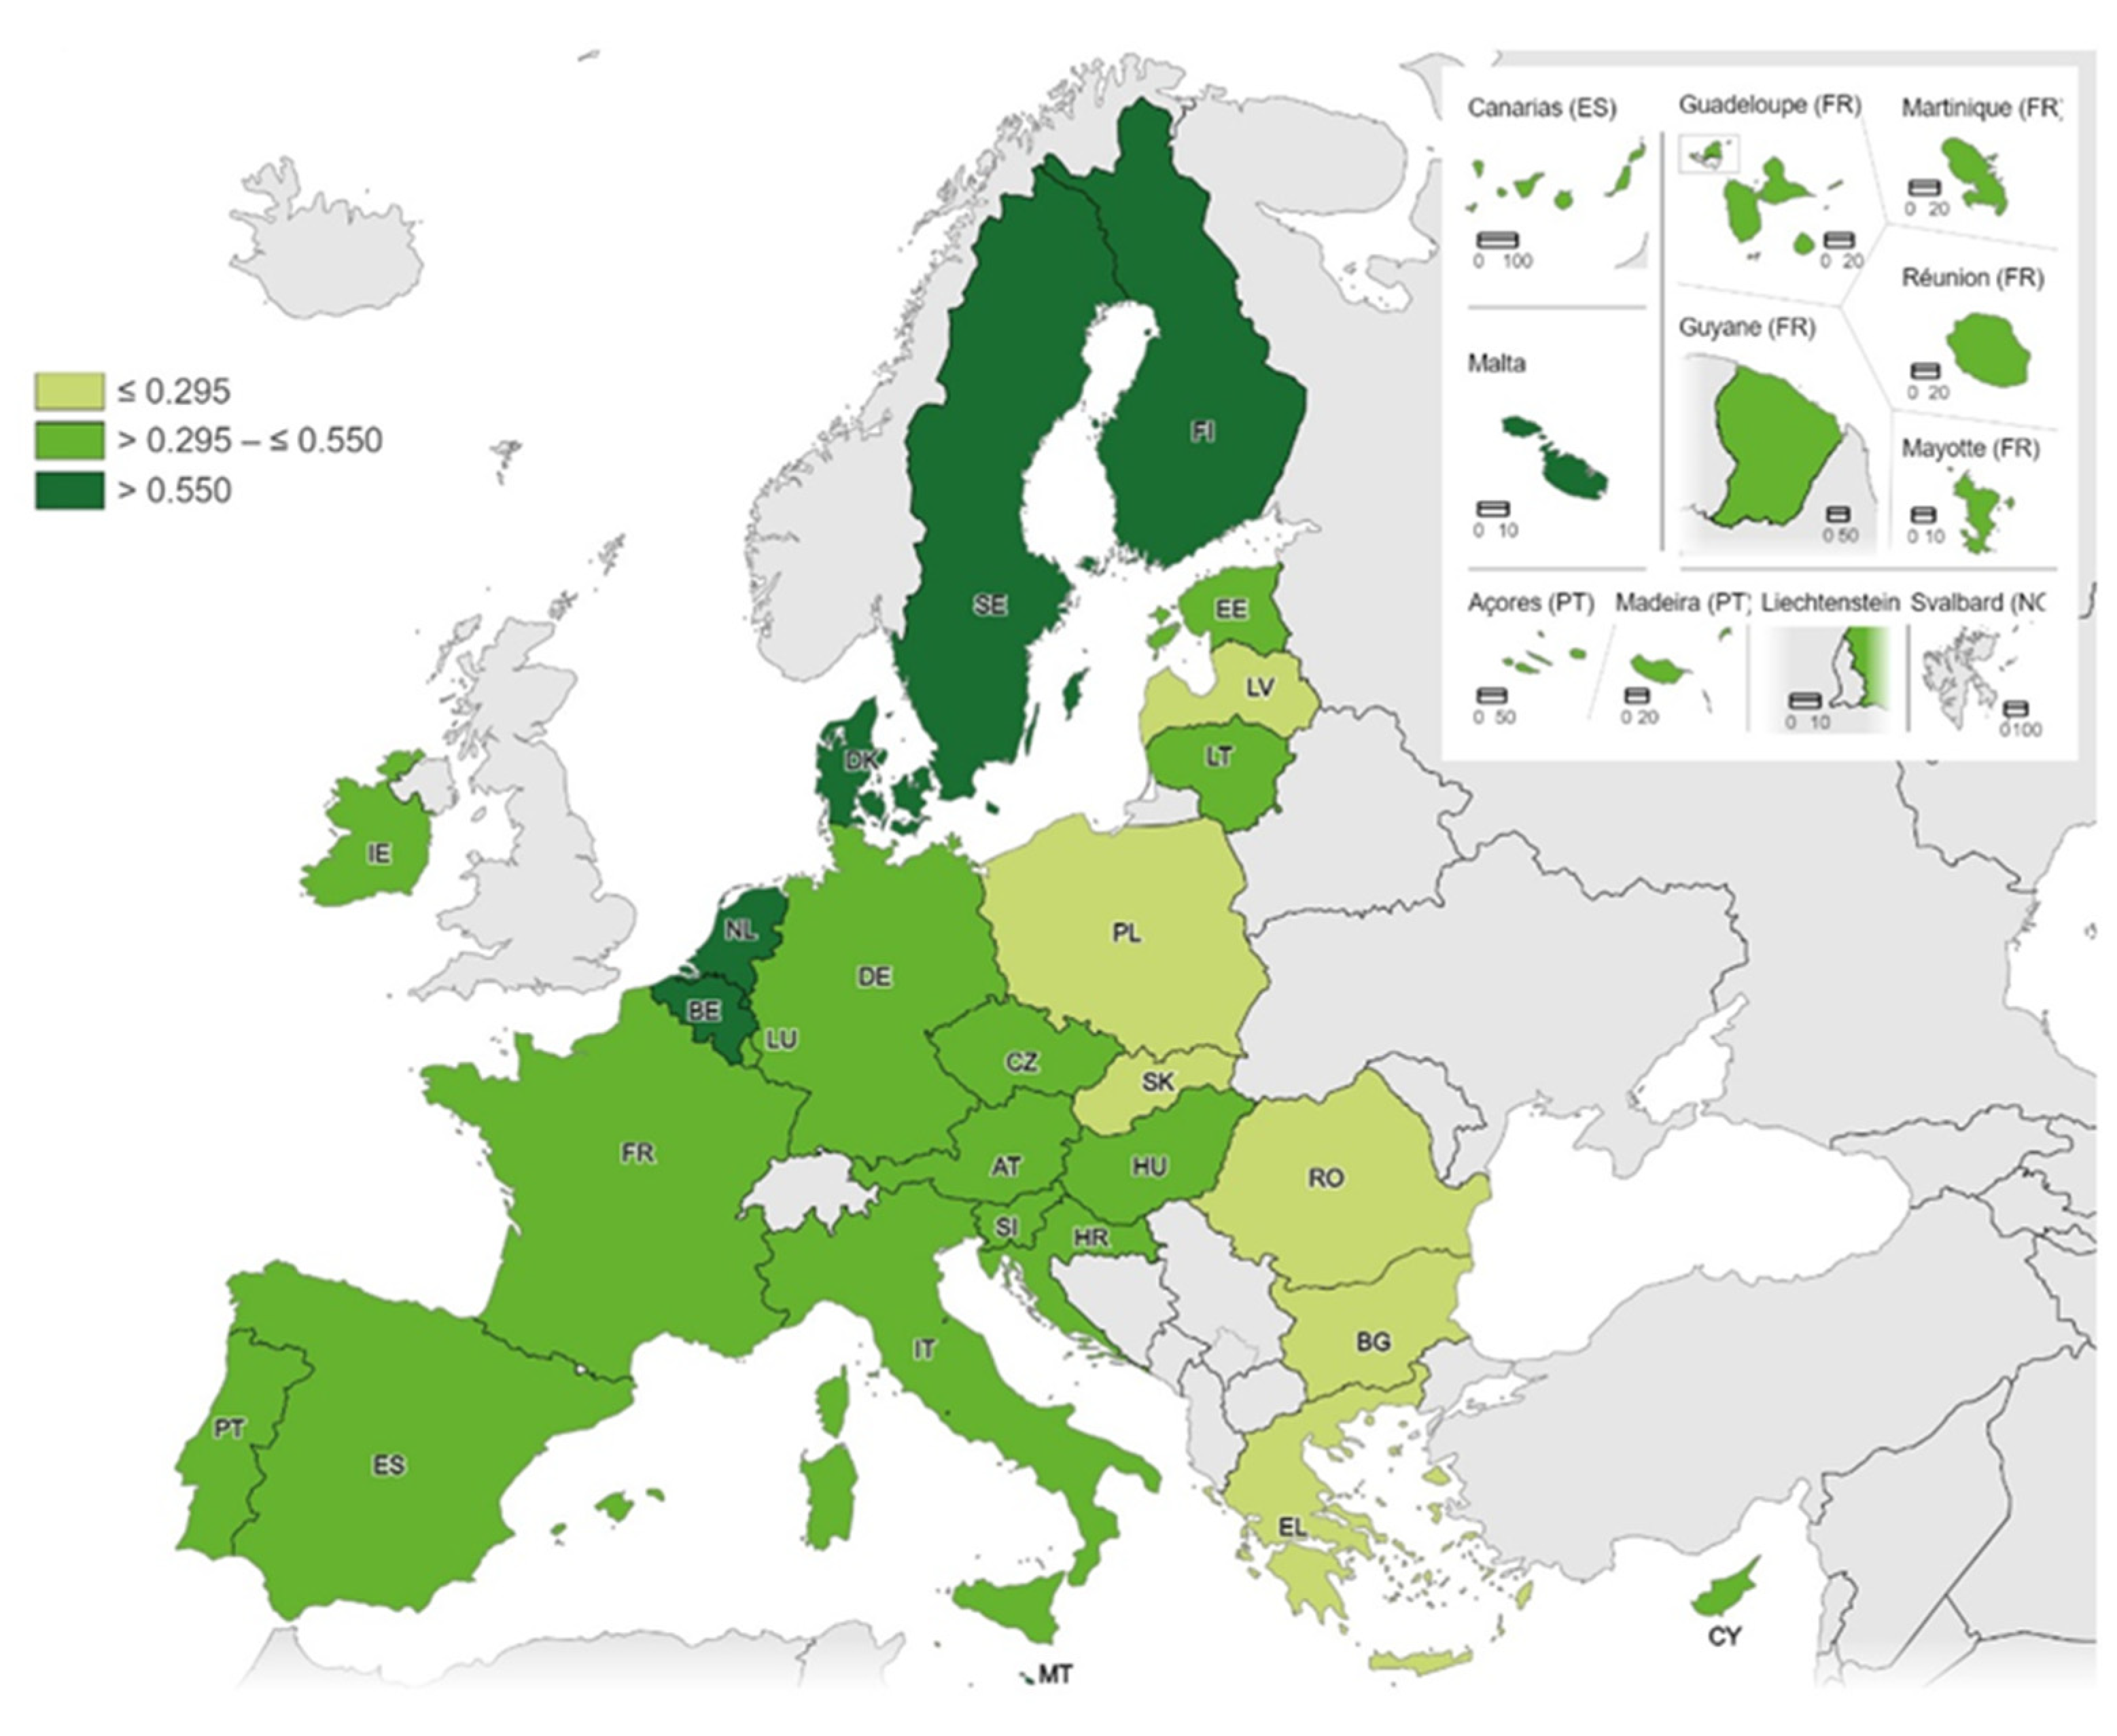
The results of the linear ordering and division of the EU countries into relatively homogeneous classes according to the level of digital transformation intensity are presented in
Figure 3,
Table 3 and
Scheme 1. The class of countries characterized by a low digitalization level of enterprises included the countries for which the synthetic measure of digital intensity level
did not exceed the value of 0.295 (cf. Formula (4)); the class presenting a medium level of digitalization covered the countries where the measure value was in the range (0.295; 0.550] (cf. Formula (5)). The countries featuring higher values of the measure of digitalization development formed a class characterized by a high digitalization level of enterprises (cf. Formula (6)).
The above calculations and presentations show that more than half of the EU Member States were qualified in the class characterized by the average intensity of digital trans-formation of small and medium-sized enterprises. This class primarily includes Western and Southwestern European countries. The most favorable position is occupied by Northern European countries. The average values of the synthetic measure of digital transformation development presented in
Table 3 indicate clear differences between countries classified in the low, medium and high digital transformation development classes. The average values of SM(DT) are 0.1788, 0.4126 and 0.7037, respectively.
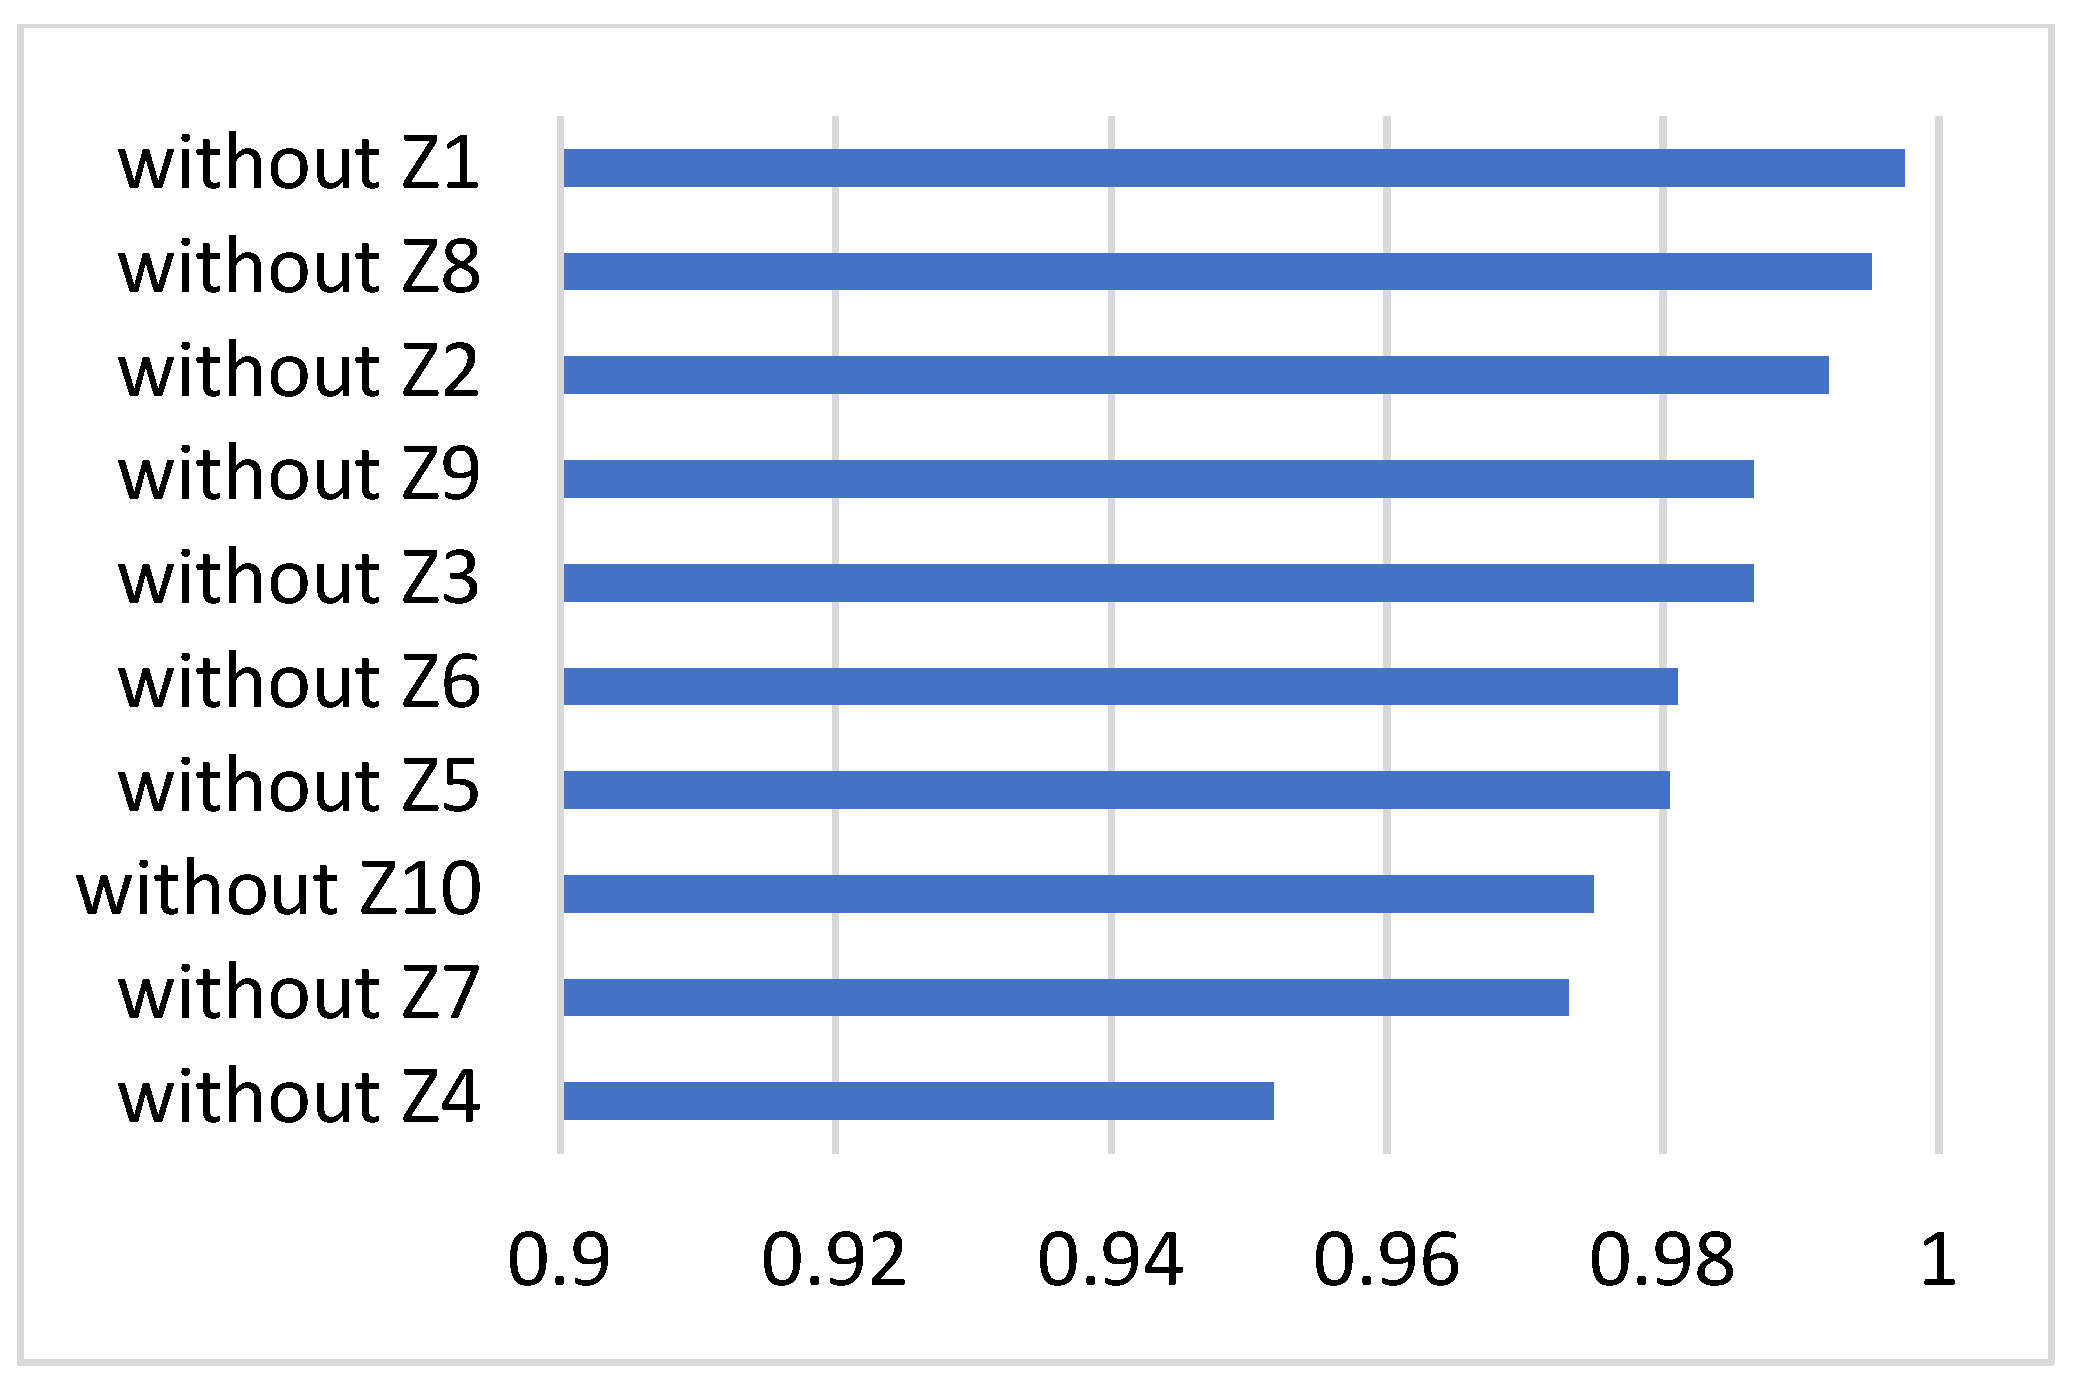
The next research step was to analyze the sensitivity of the synthetic measure of the digital transformation level to changes in the set of sub-indicators for digitalization.
Figure 4 shows the values of Spearman’s rank correlation coefficients between the rankings of EU countries obtained after sequential elimination of individual indicators with the baseline ranking, arranged in descending order. The analysis includes normalized values of indicators X
1 to X
10 (Z
1–Z
10, cf. Formula (1)).
All Spearman’s rank correlation coefficients take values greater than 0.95, which means that the synthetic measure of digital transformation development SM(DT) is relatively stable with no dominance of any indicator of digitalization. Removing indicator X4 (enterprises performing data analytics) had the greatest impact on the ranking, whereas removing indicator X1 (enterprises with at least a basic level of digital intensity) exerted the least impact.
In summary, the findings confirm research hypothesis H1, according to which the EU countries differ significantly in terms of the digital transformation level of enterprises, thus allowing the identification of distinct groups characterized by high, medium and low levels of advancement.
4.3. Classification of EU Countries into Groups with Similar Employment Structures in High-Tech, Medium–High-Tech and Knowledge-Intensive Service Sectors
This section presents the results of analyses obtained following the application of the third stage of the research procedure, which enable the empirical verification of hypothesis H2: European Union countries are characterized by different types of employment structures in the high-tech, medium–high-tech and knowledge-intensive service sectors, reflecting different models of economic transformation—from industrial specialization, through a balanced structure, to the dominance of knowledge-intensive services.
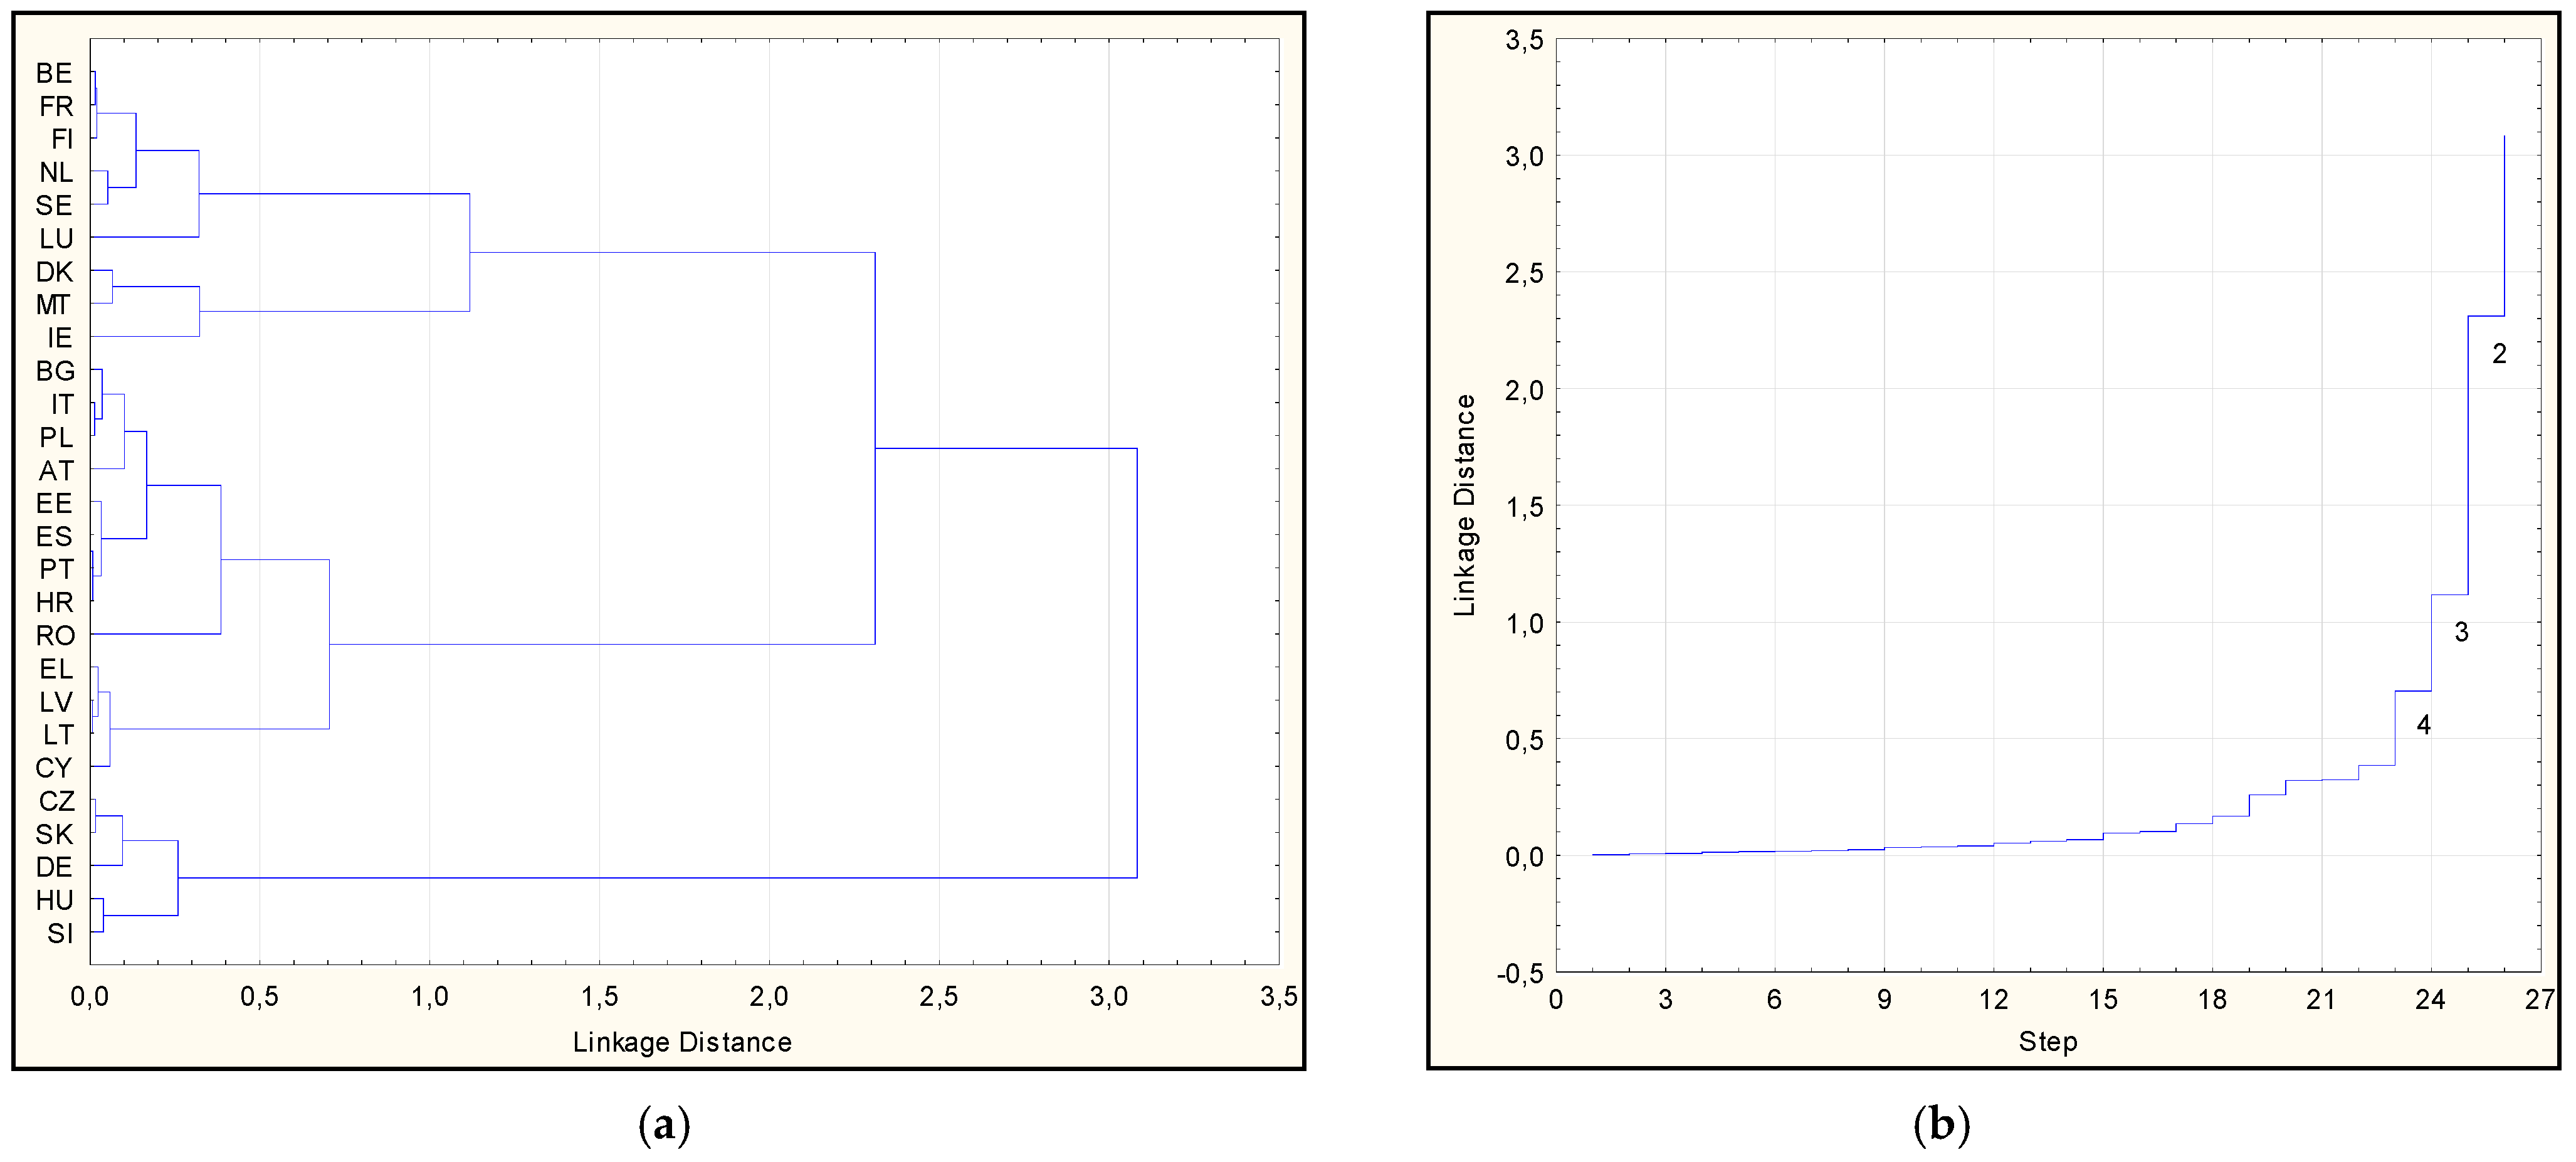
The third research stage consisted in the classification of the EU countries based on the share of employment in high-tech sectors of the economy. The optimum number of country classes was selected based on the dendrogram of connections, integration distances and classification stages obtained as a result of applying Ward’s hierarchical classification method, using squared Euclidean distance, as presented in
Figure 5a,b.
Based on the analysis of
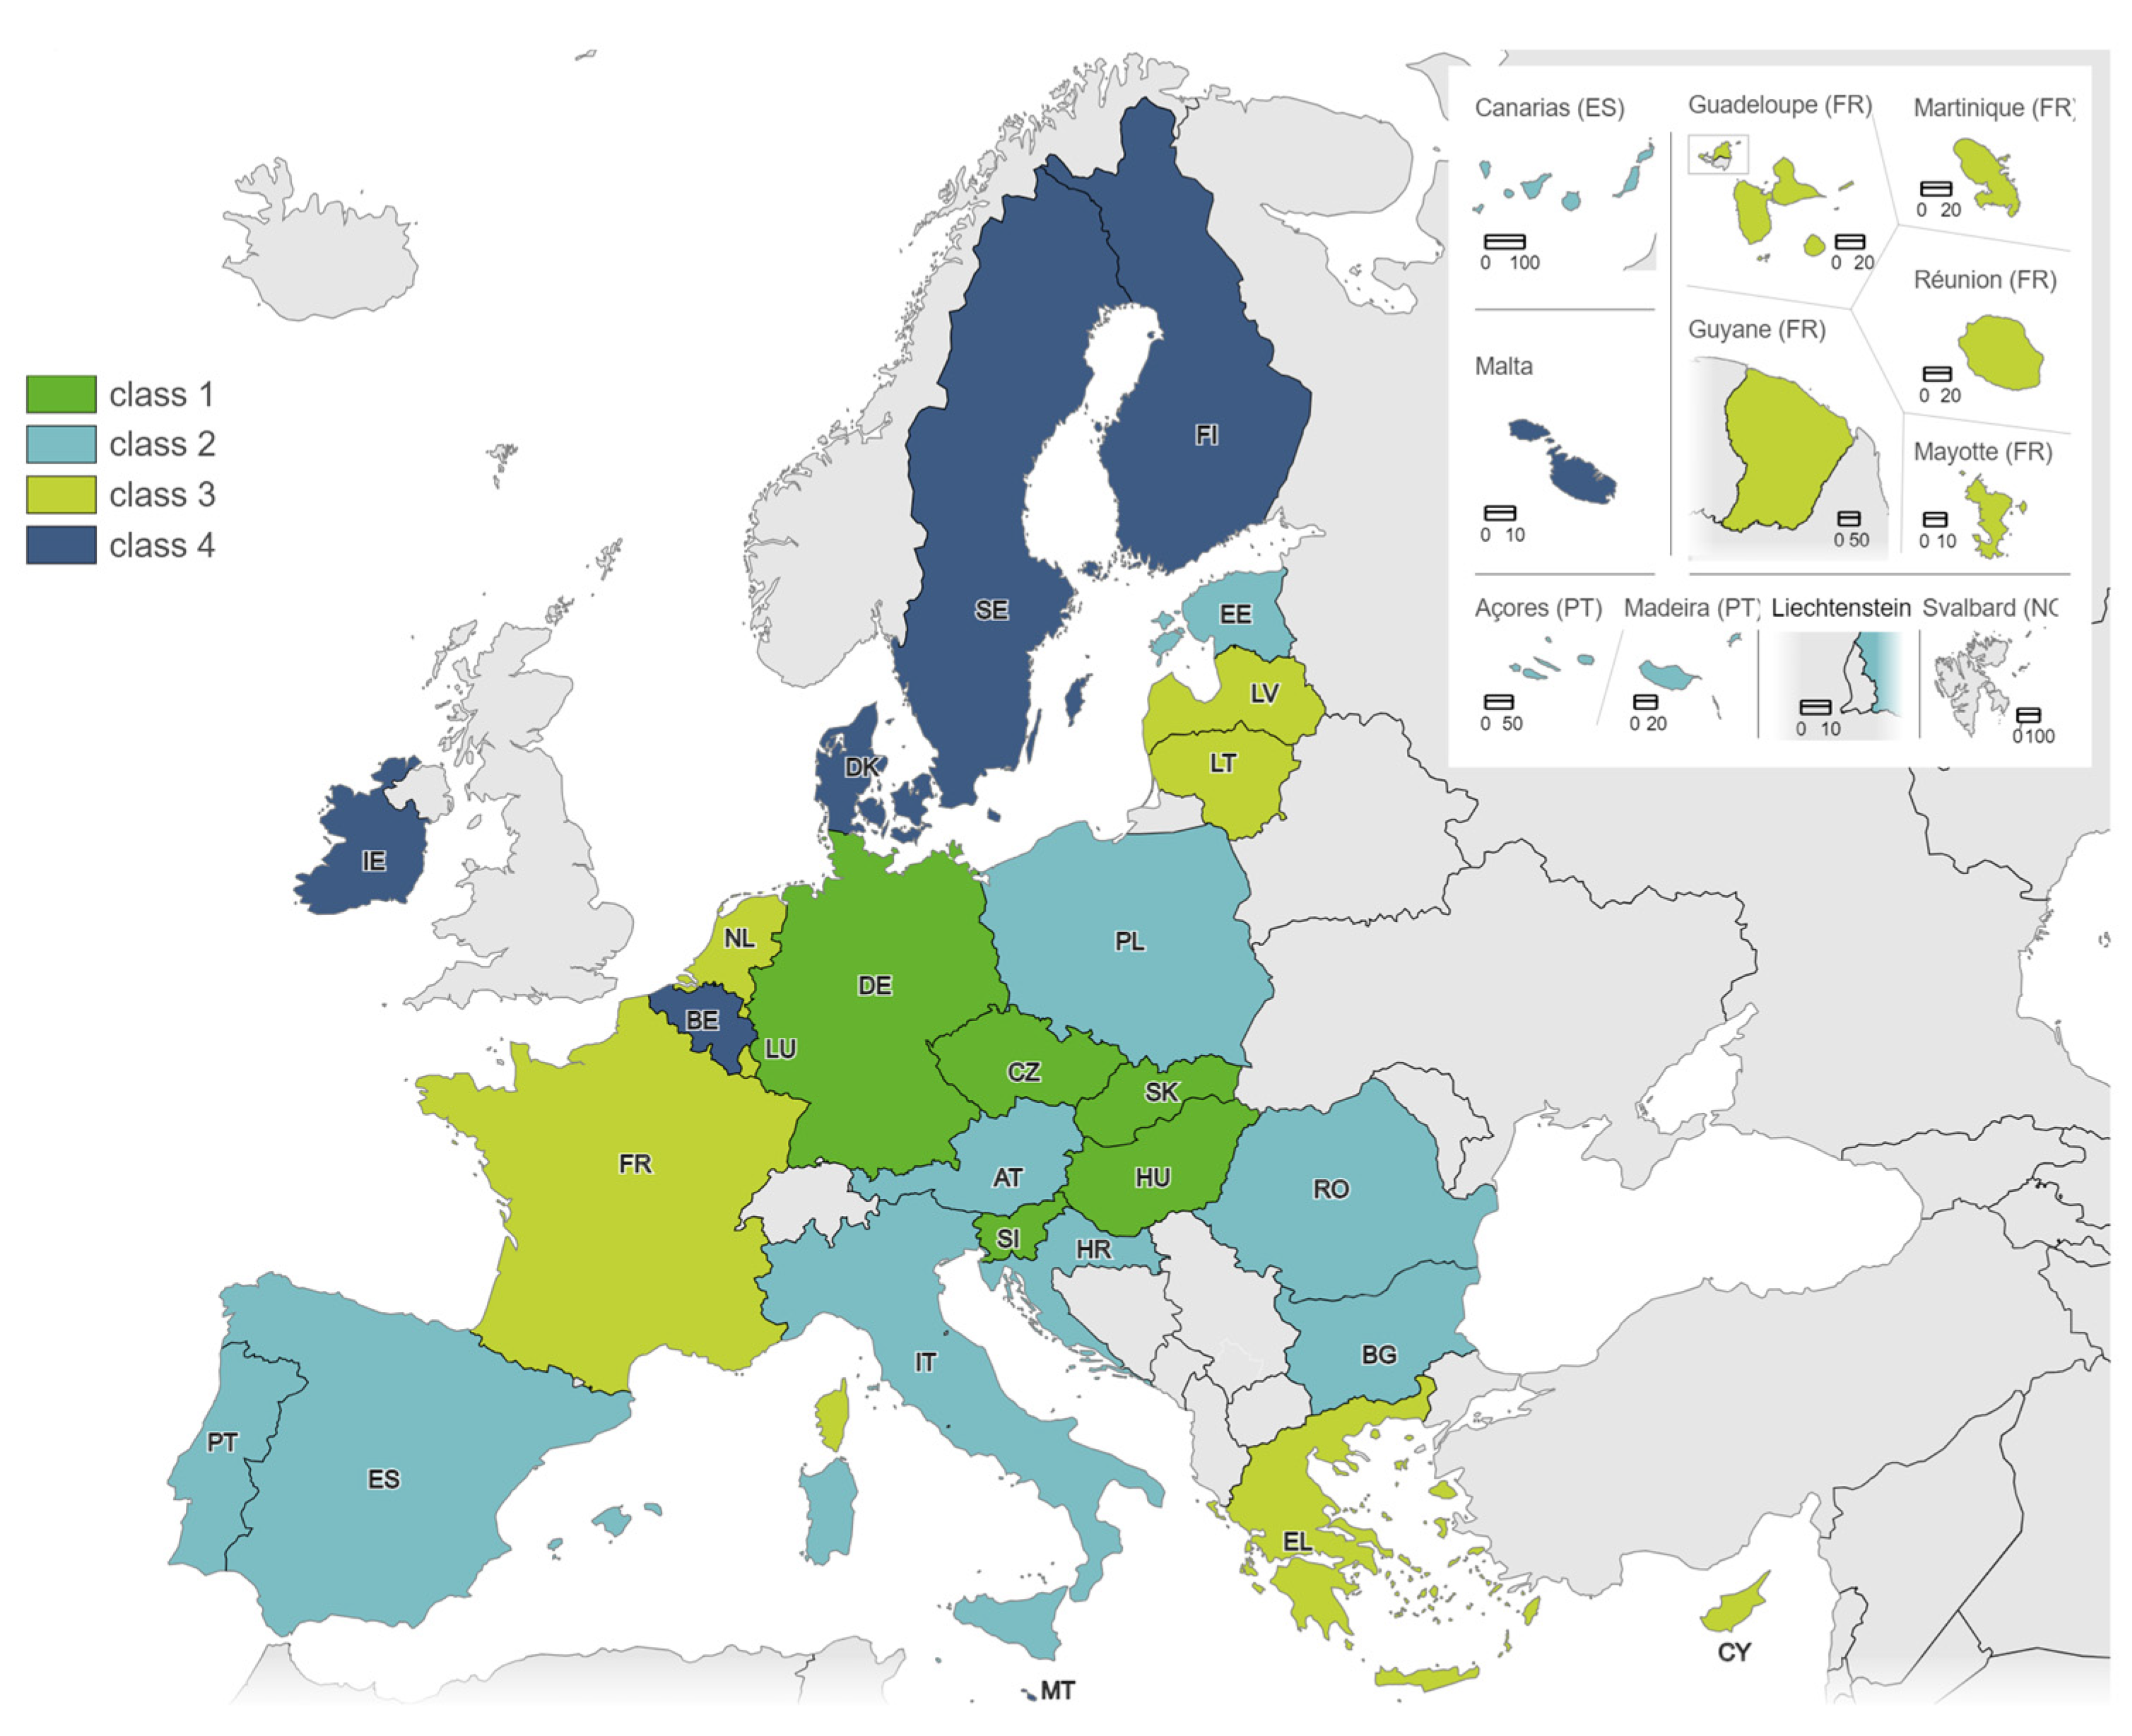
Figure 5a,b, the EU countries were classified, according to the values of high- and medium–high-technology manufacturing and knowledge-intensive services in 2023, into four relatively homogeneous classes using k-means clustering. The classification results are shown in
Table 4,
Scheme 2 and
Figure 6.
Table 4 also provides information on the characteristics of the obtained classes of countries.
Based on the obtained classification results, the types of identified employment structures in the HTM, MHTM and TKIS sectors occurring in the European Union countries in 2023 were determined. Then, for each type of employment structure (for each of the identified classes of countries), the typological characteristics were developed.
Table 5 shows the results of the above analysis.
The findings summarized in
Table 5 confirm research hypothesis H
2. In the European Union countries, different types of employment structures can be identified in the high-technology, medium–high-technology and knowledge-intensive service sectors, reflecting different models of economic transformation—from industrial specialization, through a balanced structure, to the dominance of knowledge-intensive services. Indeed, the conducted research made it possible to identify, in the EU countries, both industrial and technological structures (class 1), balanced-low-technological structures (class 2), and structures characterized by advanced development of knowledge-intensive services. The latter type of employment structure occurred in two classes of countries. Indeed, the EU countries characterized by the presence of service and innovation (class 3) and service and technologically advanced structures were identified, differing in their shares of employment in industrial sectors.
4.4. Employment Structures in High-Tech, Medium–High-Tech and Knowledge-Intensive Services Among EU Countries with Differing Intensities of Digital Transformation
The research results presented in this section allow assessing hypothesis H3: Employment structures in the high- and medium–high-tech and TKIS sectors differ significantly between the groups of EU countries characterized by high and low levels of digital transformation—the countries featuring higher levels of digitalization have a higher share of employment in the TKIS sector.
To identify differences in the structure of employment in high-tech manufacturing, medium–high-tech manufacturing and knowledge-intensive services between groups of the EU countries presenting different levels of digital business transformation,
Table 6 summarizes the results of the two classifications.
The analysis of
Table 6 shows that all EU countries characterized by a high level of digital transformation were classified only in the classes presenting a high and very high share of employment in knowledge-intensive services, i.e., Class 4, service and technologically advanced (five countries), and Class 3, service and innovation (one country). It can also be noted that none of the EU countries with a low level of digital transformation intensity were included in the class of countries with service and innovation structures (Class 4) characterized by the highest share of employment in both the TKIS and HTM sectors. However, this relationship is disrupted by Greece and Latvia, the countries featuring low levels of digital transformation of enterprises with service and innovation employment structures (Class 3). These countries show a high share of employment in knowledge-intensive services and very low shares in the HTM and MHTM sectors.
On this basis, it should be concluded that the results of the study only partially confirm hypothesis H2. The structures of employment in the high- and medium–high-tech and KIS sectors differ between the groups of EU countries presenting high and low levels of cyber transformation—generally, the countries featuring higher levels of digitalization are characterized by a higher share of employment in the KIS sector. However, in this study, such a relationship was disrupted by Greece and Latvia.
4.5. Relationship Between Digital Transformation Level and Employment Share in High-Tech and Medium–High-Tech Manufacturing and Knowledge-Intensive Services in EU Countries
This section presents findings allowing the verification of hypothesis H4: There is a positive relationship between the level of digital business transformation in the EU countries and the employment structure of the HTM, MHTM and TKIS sectors, with the strongest impact observed in the case of knowledge-intensive services.
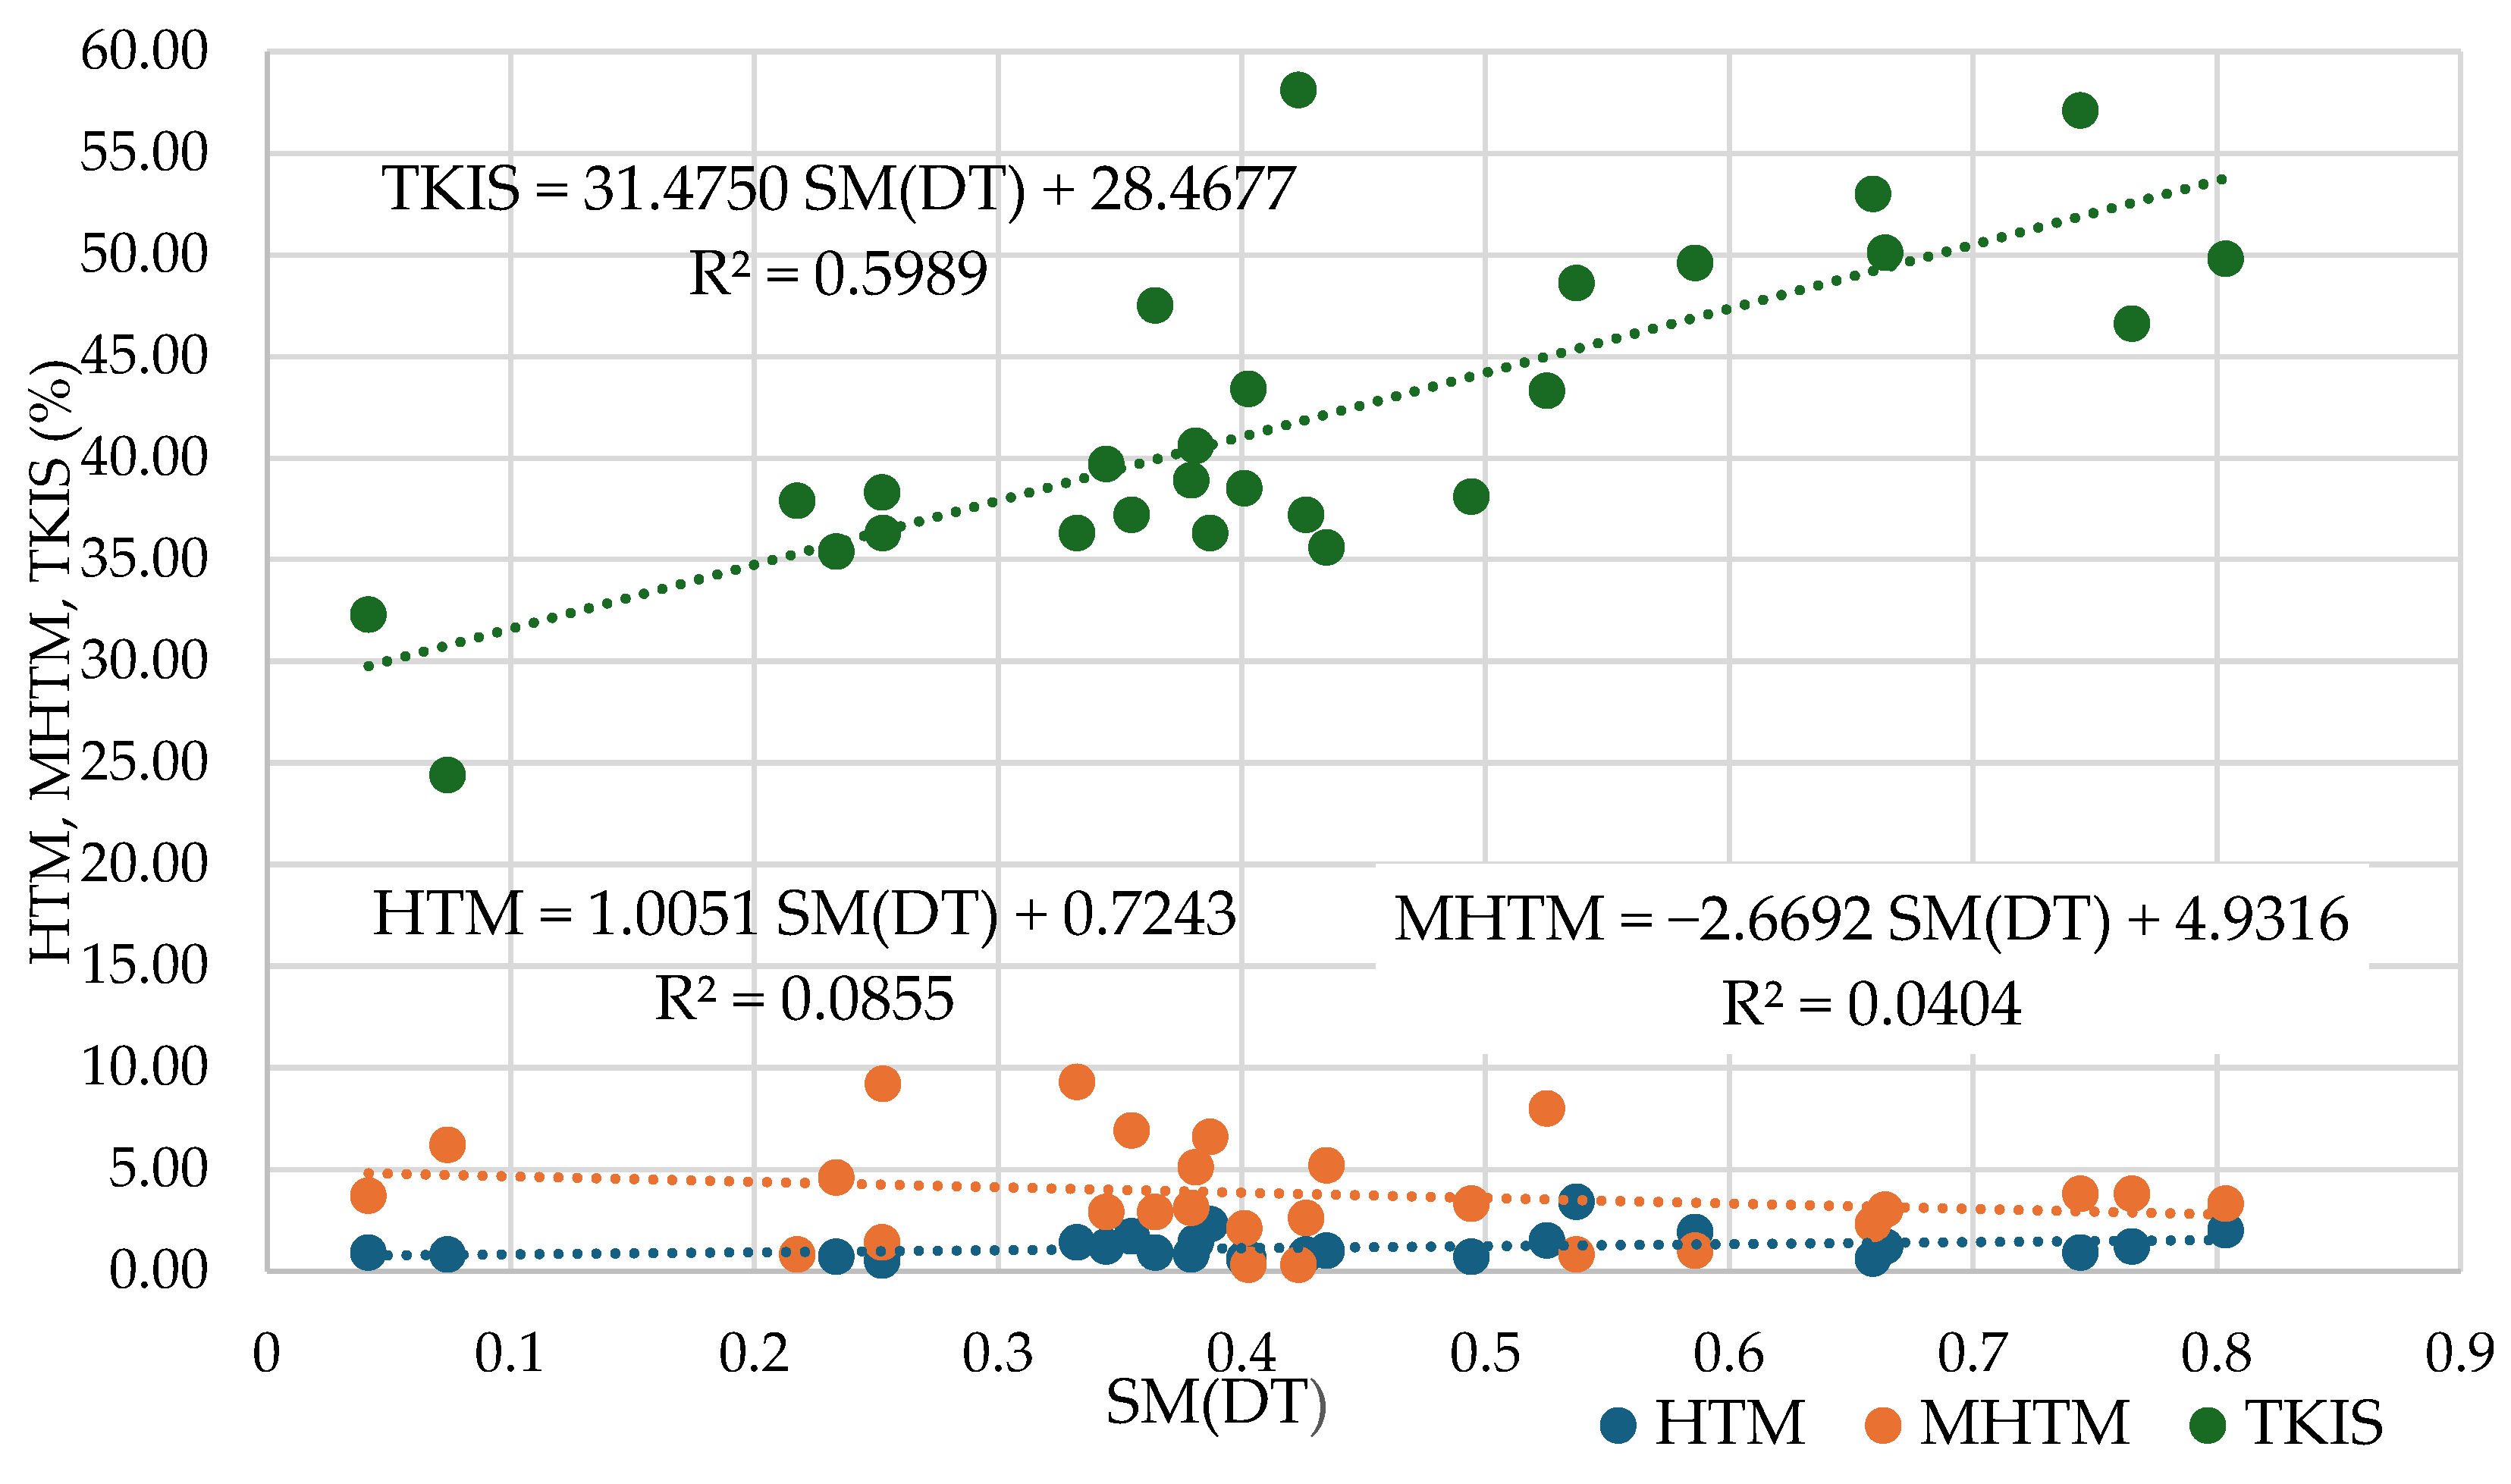
Figure 7 presents the relationships between the level of digital transformation advancement and the share of employment total in high- and medium–high-tech manufacturing and knowledge-intensive services in the EU countries using regression analysis.
Table 7 presents the results of the ordinary least squares (OLS) regression analysis, in which the level of digital transformation is the explanatory variable SM(DT) and employment shares in the HTM (high-tech manufacturing), MHTM (medium–high-tech manufacturing) and TKIS (total knowledge-intensive service) sectors are the explanatory variables.
The analysis addressing the relationship between the level of digital transformation intensity and the share of employment in the HTM, MHTM and TKIS sectors indicated significant differences between sectors. In the HTM and MHTM sectors, the regression coefficients turned out to be statistically insignificant (p = 0.1388 and p = 0.3150, respectively), and the R-squared coefficients of determination were very low (0.0855 and 0.0404). This means that there is no statistically significant linear relationship in the HTM and MHTM sectors.
The situation was different in the case of the model explaining the relationship between the level of digital transformation intensity in SMEs and the share of employment in the TKIS sector. The regression analysis results indicate a positive and statistically significant relationship (β1 = 31.475, p = 2.19 × 10⁻⁶). The coefficient of determination R-squared = 0.5989, meaning that approx. 60% of the variation in the share of employment in knowledge-intensive services can be explained by the level of digital transformation (SM(DT)). The standard error of regression RMSE indicates that the average deviation of empirical TKIS values from those predicted by the model amounts to approx. 5 percentage points, which is 12.1% of the average value for TKISs. The regression coefficient value (β1 = 31.475) shows that increasing the level of digital transformation intensity SM(DT) by 0.1 results in an average increase of approx. 3.15 percentage points in the share of employment in the TKIS sector of the EU countries. The normality of the distribution of residuals was assessed using the Shapiro–Wilk test. The test confirmed the normality of residuals in the MHTM model (p = 0.1895), which supports the reliability of inference for this model. In the case of the TKIS sector, the null hypothesis of normality was not rejected at the stricter α = 0.01 level (p = 0.0186), which still indicates an acceptable fit for the assumption of normality. For the HTM model, the low p-value (p = 0.0040) suggests that the normality assumption is not satisfied, which may limit the validity of parametric inference in this case.
A dot plot showing the relationship between the level of digital transformation development in the EU countries (SM(DT)) and the share of employment in the TKIS sector (
Figure 7) reveals the presence of a potential outlier observation, clearly distant from the regression line due to the relatively high value of the TKIS explanatory variable, despite the average value of the SM(DT) explanatory variable. This observation was identified as Luxembourg. Such observations may affect the results of the regression analysis; therefore, a robustness analysis was performed by estimating the model excluding this observation. For comparison, the calculation results for both regressions are presented in
Table 8. In contrast to this case, influential outlier observations were not detected in the models for the HTM and MHTM sectors. The distribution of observations in these models did not indicate any outliers justifying their exclusion.
A comparison of the regression results for the full sample of 27 EU countries with the results obtained after eliminating Luxembourg as an outlier shows the relative stability of the regression coefficient (β1), which was 31.4750 and 31.5091, respectively, and was statistically significant in both cases. A certain change was also recorded in the intercept (28.4677 and 27.8260). At the same time, the fit of the model improved. The R-squared value increased from 0.5989 to 0.7245, and the adjusted R-squared increased from 0.5828 to 0.7131. In addition, the consistency of the distribution of residuals with the normal distribution improved in the model without Luxembourg. According to the Shapiro–Wilk test, the residuals from the full model deviated significantly from normality (p = 0.0186), indicating potential issues with the validity of parametric inference at the standard α = 0.05 level. After the outlier was excluded, the test yielded p = 0.5636, suggesting that the residuals in the refined model do not significantly differ from a normal distribution and that the assumption of normality is met. In the model without Luxembourg, over 72% of the variation in the employment share in knowledge-intensive services can be explained by the level of digital transformation. The standard error of regression RMSE indicates that the average deviation of the empirical TKIS values from those predicted by the model amounts to approx. 3.9 percentage points, i.e., 9.45% of the average value for TKISs, and improves the predictive characteristics of the model. The findings indicate that the observed positive relationship between the level of digital transformation and employment in knowledge-intensive services (TKISs) can be considered statistically robust and resistant to the influence of outlier observations.
To increase the reliability of the regression analysis results, the original models were extended to include additional control variables:
- –
GDP per capita—Gross Domestic Product per capita in PPS at current prices;
- –
GERD per capita—Gross Domestic Expenditure on Research and Development per capita in PPS at constant 2005 prices.
The selection of control variables is justified by the theoretical basis indicating a possible relationship between the level of economic development and the intensity of R&D expenditure vs. the structure of employment in high-tech and knowledge-intensive sectors.
For each of the analyzed HTM (high-tech manufacturing), MHTM (medium–high-tech manufacturing) and TKIS (total knowledge-intensive service) sectors, regression models were estimated with one control variable (GDP per capita) and two control variables (GDP per capita and GERD per capita). Regarding the analyses for the TKIS sector, due to Luxembourg having been identified as an outlier in the simple regression model, the models were estimated based on the data for 26 EU Member States (excluding Luxembourg). For the HTM and MHTM sectors, the conducted analyses covered the full sample including 27 EU countries. The results of the regression analysis are presented in
Table 9.
The analysis of regression models for the HTM sector showed that both in the original model and in the models with one (GDP per capita) and two control variables (GDP per capita, GERD per capita), the regression coefficient for the SM(DT) variable was positive but not significant (p > 0.1). In addition, the R-squared coefficient of determination values ranged from 0.0855 to 0.1394, indicating a very poor fit of the model to the data. The original model did not meet the assumption of normality of the distribution of residuals (p = 0.0040), but when a control variable (GDP per capita) was added, the distribution became consistent with a normal distribution at the 0.05 significance level (p = 0.0901). The model extended with two control variables did not show such consistency (p = 0.0325). Despite the improved diagnostics of the model, in both cases, no statistically significant relationship was identified between the intensity of digital transformation and the share of employment in the HTM sector.
In the case of the medium–high-tech manufacturing (MHTM) sector, no statistically significant relationship was identified between the digital transformation intensity (SM(DT)) and employment share in any of the analyzed models. In the original model, the regression coefficient for SM(DT) was negative and insignificant (p = 0.3150), and the degree of model fit was very low (R-squared = 0.0404). The distribution of residuals followed a normal distribution. Regarding the model extended with one control variable (GDP per capita), the regression coefficient for SM(DT) remained insignificant (p = 0.7602), and the R-squared increased only slightly to 0.1193. The control variable was also found to be insignificant (p = 0.1553), indicating that the level of economic development alone does not explain the variation in employment in MHTM. Nonetheless, the model remained consistent with the assumption of normality of residuals. When the model was expanded to include two control variables (GDP per capita and GERD per capita), an improvement in model fit was observed (R-squared = 0.2773; adjusted R-squared = 0.1830), while the main explanatory variable SM(DT) remained insignificant (p = 0.0984). At the same time, the coefficients at both control variables, GDP per capita (p = 0.0310) and GERD per capita (p = 0.0349), proved to be statistically significant, which may indicate their stronger impact on employment in this sector. At the same time, a negative effect of GDP per capita and a positive effect of GERD per capita on the share of employment in the MHTM sector were identified, which may indicate the complex nature of the relationship. The distribution of residuals was consistent with a normal distribution (p = 0.1154).
The analysis did not confirm a statistically significant direct impact of digital transformation on employment in the MHTM sector, but the improvement in model fit after the inclusion of control variables indicates the possibility of indirect dependencies, requiring further in-depth research.
In the case of the total knowledge-intensive service (TKIS) sector, the results of all regression analyses indicate a statistically significant and strongly positive relationship between the level of digital transformation of SM(DT) enterprises and the share of employment in this sector. Even in the original model, without control variables, the regression coefficient for the SM(DT) variable was high (β1 = 31.4750) and statistically significant (p = 2.19 × 10⁻⁶), and the fit of the model was good (R-squared = 0.5989). However, the residuals showed consistency with the normal distribution only at the 0.01 significance level (W = 0.9062; p = 0.0186). In the model extended with one control variable (GDP per capita), the regression coefficient for the SM(DT) variable remained statistically significant (β1 = 27.2262; p = 9.42 × 10⁻⁶), and the model fit increased to R-squared = 0.7488 (adjusted R-squared = 0.7270), indicating a very good fit quality. The control variable had no significant effect (p = 0.1494), and the distribution of residuals followed a normal distribution (p = 0.8220). In the model with two control variables (GDP per capita and GERD per capita), the significance of the digital transformation impact was confirmed (β1 = 24.3992; p = 0.0004). Although the control variables did not reach the significance level (for GDP per capita, p = 0.3981; for GERD per capita, p = 0.3838), the model fit remained high (R-squared = 0.7575; adjusted R-squared = 0.7245). The residuals were consistent with a normal distribution (p = 0.6401).
All models confirmed the occurrence of a strong and statistically significant positive relationship between the level of digitalization and the share of employment in knowledge-intensive services. These results fully support hypothesis H4 for the TKIS sector and indicate that digital transformation can be an important factor enhancing higher employment in this area.
Based on the conducted research, it can be concluded that hypothesis H4 has been partially confirmed—there is a positive and significant relationship between the level of digital transformation and employment in the TKIS sector in the EU countries, whereas in the HTM and MHTM sectors, such a relationship has not been confirmed.
5. Discussion
The purpose of the study is to assess the differentiation and to classify the European Union countries in terms of the level of digital transformation advancement of enterprises and the share of employment in high-tech manufacturing (HTM), medium–high-tech manufacturing (MHTM) and total knowledge-intensive services (TKISs) and to identify the existing relationships between these phenomena.
The starting point of the conducted research was characterizing the research sample in terms of the degree of its diversity. The results clearly show a wide diversity among the EU countries in terms of both the intensity of digital transformation and the share of employment in high-tech manufacturing.
The dispersion of the EU countries based on individual criteria for assessing the intensity of digital business transformation in 2023 was very diverse (see
Table 1 and
Figure 1). A very strong variation and, at the same time, the largest variation occurred in the case of X
8 indicator, determining the cumulative number of unicorn companies, i.e., startups that reach a valuation of USD 1 billion and are not listed on the stock market. The coefficient of variation of this indicator exceeded the value of 158% (CV = 158.21%). In six EU countries, including Bulgaria, Latvia, Hungary, Romania, Slovenia and Slovakia, the value of this indicator was 0. The highest number of unicorn companies, i.e., as many as 65, operated in Germany. The median number of unicorns was 3, meaning that 50% of the EU countries had no more than 3 operating unicorns and 50% of countries had between 3 and 65 such companies.
There was also a strong variation in the share of enterprises using at least one AI technology (X6) and sending e-invoices (X7) in the analyzed countries; the values of CV were 50.36% and 58.74%, respectively. The largest number of SMEs using at least one AI technology was in Denmark (15.2%), and the smallest was in Romania (1.5%). On average, across the EU countries, approx. 8.22% of SMEs used AI technology. As for the share of enterprises sending e-invoices, the largest was in Italy (approx. 97.5%), and the smallest was in Poland (14.8%). On average, in the EU countries, more than 36.7% of SMEs use e-invoices.
A very small variation occurred for SMEs with at least a basic level of digital intensity (X1) and using two or more social media (X3) (CV = 24.14% and CV = 22.00%, respectively). On average, about 60% of SMEs in the EU countries present at least a basic level of transformation and use at least two social media in their operations. The minimum values of these indicators were recorded in Romania (27.9%) and Bulgaria (38%), respectively, whereas the highest were recorded in Finland (86%) and Malta (87.10%).
The variation among EU countries in terms of other indicators can be considered average (CV took values from approx. 28% to 35%). It can be observed that, taking into account the specific indicators of the digital transformation intensity, their minimum values were most often recorded in Bulgaria (five times), followed by Romania (three times). In turn, the highest value of indicators was most often observed in Denmark (three times), followed by Finland (twice).
The differentiation assessment of the EU countries regarding the share of employment in the analyzed sectors of technological intensity was carried out based on the results presented in
Table 2 and
Figure 2. The variation among EU countries in terms of the share of employment in the HTM, MHTM and TKIS sectors was low for the knowledge-intensive service sector (CV = 18.73%) and high for the HTM (CV = 57.51%) and MHTM (CV = 67.45%) sectors. In the case of high- and medium–high-tech manufacturing, by far the smallest share of employment was recorded in Luxembourg, amounting to 0.30% in each of the sectors. The maximum share of employment in high-tech manufacturing was in Ireland (3.4%), and that in medium–high-tech manufacturing was in the Czech Republic (9.3%). On average, the EU countries had an employment share of approx. 1.15% in high-tech manufacturing and 3.8% in medium–high-tech manufacturing. The EU countries were characterized by a significantly higher average share of employment in knowledge-intensive services, amounting to approx. 41.86%. In this sector, the dominant share of employment occurred in Luxembourg (58.10%), whereas the smallest was in Romania (24.4%). In half of the EU countries, the share of employment in knowledge-intensive services exceeded 38.9%.
Based on the above considerations, it can be concluded that the research sample, consisting of 27 European Union countries, used in the empirical study shows a clear diversity in terms of the level of digital transformation and the structure of employment in high-tech sectors. This diversity makes the sample suitable for carrying out the research objective and allows for a reliable and credible verification of the adopted research hypotheses.
Hypothesis H
1 assumes that the EU countries differ significantly in terms of the digital transformation level of enterprises, which enables the identification of distinct groups characterized by high, medium and low levels of advancement. The analysis conducted based on the synthetic measure value of the digital transformation level (SM(DT)) in 2023 allowed the identification of three classes of EU Member States characterized by clearly diversified levels of digital transformation: the classes of countries with low, medium and high levels of advancement (cf.
Figure 3,
Table 3 and
Scheme 1). The Nordic countries—Denmark, Finland and Sweden—were the leaders in this respect. The class of countries characterized by the highest level of digital transformation also included Belgium, the Netherlands and Malta. By far the lowest levels of digital business transformation were recorded in Bulgaria and Romania. These countries can be considered the most lagging in terms of the degree of digital transformation process implementation in small and medium-sized enterprises in the European Union. Greece, Poland, Latvia and Slovakia were also included in this class. The remaining EU countries were placed in the most numerous class of countries (15 countries), presenting an average level of digital transformation. The classes of countries characterized by high and low digital transformation intensity were equal-sized and included six EU Member States each. The findings confirm hypothesis H
1 and indicate a significant diversification among the EU countries in terms of the digital transformation level of enterprises. The identification of separate groups of countries with low, medium and high levels of advancement confirms the occurrence of such a diversification, which is partly in line with earlier studies carried out by the European Commission indicating persistent regional differences in the level of digitalization of the economy and a clear digital division in the EU between the countries of the “old” and “new” EU. The obtained results are consistent with the findings of the European Commission’s DESI reports, which confirm persistent differences in the level of digitalization presented by enterprises in the EU countries. Denmark, Finland and Sweden regularly score highest in terms of digital integration, while Bulgaria and Romania remain at the bottom of the list, reflecting the persistent digital division [
84,
85]. The above findings are also consistent with broader research addressing the digital maturity of EU countries, which points to the Nordic countries not only leading the way in terms of digital infrastructure, governance and digital competence, but also offering particularly favorable conditions for digital transformation across all sectors [
86]. The aforementioned studies do not directly refer to small and medium-sized enterprises, but allow the conclusion that the generally developed digital environment and high digital skills of the population create favorable conditions for achieving high digital intensity of all enterprises. In turn, countries such as Bulgaria, Romania, Slovakia and Greece have been identified as requiring comprehensive support, especially in the development of digital infrastructure and digital education, which also confirms the consistency of results with this study [
86]. These results also provide evidence of the need for a differentiated approach in the EU digital policy that takes into account the existing differences in the digital development of small and medium-sized enterprises across the EU countries.
Hypothesis H
2 assumed the occurrence of different types of employment structures in the high-technology, medium–high-technology and knowledge-intensive service sectors in the European Union countries, reflecting different models of economic transformation—from industrial specialization, through balanced structure, to the dominance of knowledge-intensive services. The conducted research showed that the structures of employment in the HTM, MHTM and TKIS sectors showed significant differentiation in small and medium-sized enterprises operating in the EU countries. In 2023, the division of the EU countries into four classes was found to be optimal in terms of the share of employment in the HTM, MHTM and TKIS sectors (cf.
Table 4,
Scheme 2 and
Table 5). On average, all the identified classes of countries are characterized by the highest share of employment in knowledge-intensive services and the lowest share in high-tech manufacturing. In turn, the particular classes differ both in the total share of employment in the three analyzed sectors of the economy and in the relationships between the shares of employment in each of the sectors. Class 1 of the EU countries, representing the type of industrial and technological employment structure, is characterized by an above-average total share of employment in all analyzed sectors (47.46%) and the largest share of employment in medium–high-tech manufacturing among all identified classes (8.00%). It is the smallest class, including five countries: the Czech Republic, Germany, Hungary, Slovenia and Slovakia. Hungary and Slovakia are the most distant from the center of the class. On the map, these countries are concentrated in Central Europe.
Class 2, defined as a type of sustainable low-tech employment structure, covers the countries presenting the smallest average total share of employment in all surveyed sectors (40.80%) and in knowledge-intensive services (35.80%). This structure lacks dominance of any modern sector. It is the most numerous class, including nine EU countries. The class comprises both the countries of the so-called old EU 15, such as Spain, Italy, Portugal and Austria, and the countries of the new EU enlargement, including Bulgaria, Romania, Estonia, Croatia and Poland. Romania turned out to be the furthest from the center of the class. Geographically, the countries included in this class are located in Southern and Central–Eastern Europe.
Class 3, characterized by a service and innovation employment structure, contains countries with the highest share of employment in the surveyed sectors (similar to Class 1), amounting to 47.29%, and the lowest share of employment in both medium–high manufacturing (0.61%) and high-tech manufacturing (1.44%). This class consists of seven countries, including Greece, France, Cyprus, Latvia, Lithuania, Luxembourg and the Netherlands. Luxembourg is placed by far the furthest from the center of the class. On the map, these countries are located in Western and Southern Europe.
Class 4 covers the EU countries characterized by the service and technological employment structure, where the average share of employment is the highest (among all the identified classes) both in all the analyzed sectors combined (54.69%) and in high-tech manufacturing (1.77%) and knowledge-intensive services (50.30%). The employment structures in this class of countries are the most innovative and digitally advanced. The following six countries were included in this class: Belgium, Denmark, Ireland, Malta, Finland and Sweden, located mainly in Northern and Western Europe. Sweden is the country most distant from the center of the class.
The findings confirm hypothesis H
2 and indicate the occurrence of four types of employment structures in the EU countries, reflecting various economic transformation strategies and different stages of their implementation. There are typologically diverse employment structures, ranging from the least modern low-tech sustainable structures, through industrial and technological as well as service and innovation structures, to the most digitally advanced service and technological structures, characteristic of knowledge economies. In addition, the geographic distribution of the classes indicates clear regional differences: the countries located in Central Europe dominate the industrial and technological class, the countries in the south and east of the EU dominate the sustainable low-technological class, while the countries in the north and west of the EU are the leaders of the most advanced service and technological structures (see
Scheme 2).
Hypothesis H
3 states that employment structures in the high-tech, medium–high-tech and TKIS sectors differ significantly between the groups of EU countries characterized by high and low levels of digital transformation—the countries featuring higher levels of digitalization have a higher share of employment in the KIS sector. The conducted research allowed a comparison of the classification of the European Union countries by the level of digital transformation with the types of employment structures in the HTM, MHTM and TKIS sectors (see
Table 6). The analysis shows that all the countries classified as those featuring a high level of digital transformation were assigned only to the classes characterized by a high or very high share of employment in knowledge-intensive services (TKISs), i.e., the service and technologically advanced class (Malta, Belgium, Denmark, Finland and Sweden) or the service and innovation class (the Netherlands). In turn, none of the countries with a low level of digital transformation intensity were included in the service and technologically advanced class, typical of the economies characterized by the highest share of employment in knowledge-intensive services and high-technology industries (see
Table 4). Diversification was observed in the countries covered by the class featuring a medium level of digital transformation, with all the distinguished types of employment structures present there.
Significantly, the analyzed data showed deviations from the adopted relationship. Greece and Latvia, despite belonging to the group of countries with a low level of digitalization, were classified in the class of service and innovation structures, characterized by a high share of employment in the TKIS sector.
The findings partially confirm hypothesis H3. Employment structures in the HTM, MHTM and TKIS sectors differ between the classes of countries presenting high and low levels of digitalization, generally; however, the countries with higher levels of digital transformation are characterized by a higher share of employment in knowledge-intensive services. The identified deviations indicate that the level of digital transformation is not the only factor shaping the structure of employment in the high-tech and knowledge-intensive service sectors. The results of conducted studies confirm a moderate correlation between the intensity of digital transformation and the structure of employment in high-tech manufacturing and knowledge-intensive services. Particularly clear relationships were observed in the countries characterized by a high level of digitalization, where politically and economically supported digital transformation processes contribute to employment growth in knowledge- and technology-intensive sectors, primarily in knowledge-intensive services. In the countries featuring medium levels of digital advancement, these relationships were less consistent, which may result from different national strategies, diverse structures of the economy and an asymmetric pace of digital implementation.
The countries featuring the most advanced digital development often invest in cutting-edge technology, R&D and education, which can have a direct impact on a higher share of employment in high-tech manufacturing (HTM, TKISs). Digital transformation is strategically supported there both politically and economically. Finland is an example of a country with extremely high efficiency in digital transformation owing to the implementation of the Digivisio 2030 digital development program and the Artificial Intelligence 4.0 program [
32], whereas Poland, e.g., belonging to the group of countries that present a low level of digital transformation, is currently at the stage of intensive work focused on developing a strategy for the country’s digitalization by 2035 [
27].
Countries with medium levels of digitalization may be more diverse in terms of digitalization policies, economic structure and development priorities; therefore, their employment structure does not directly reflect the level of digital transformation. This can also result from an asymmetric pace of technology implementation or different starting points. Moderate correlation may also stem from the fact that digital transformation does not always immediately translate into changes in the employment structure; it often takes time for the effects of investments in digitalization to be reflected in the labor market.
Hypothesis H
4 assumed the occurrence of a positive relationship between the level of digital business transformation in the EU countries and the structure of employment in the HTM, MHTM and KIS sectors, with the strongest impact expected in knowledge-intensive services. The results of the conducted OLS regression analysis indicate a diversified relationship between the level of digital transformation and the share of employment in each sector (see
Figure 7 and
Table 7). In the HTM and MHTM sectors, the regression coefficients proved statistically insignificant (
p = 0.1388 and
p = 0.3150). The calculated coefficients of determination took on very low values (R-squared = 0.0855 and 0.0404). This means that in the high- and medium–high-technology sectors, a significant linear relationship between the digital transformation of enterprises and the structure of employment in the European Union countries was not confirmed.
In the case of knowledge-intensive services, the results of regression analysis confirmed the statistically significant positive relationship between the level of digital transformation and the share of employment in knowledge-intensive services (β
1 = 31.4750;
p < 0.001). The R-squared coefficient of determination value, amounting to 0.5989, means that approx. 60% of the variation in the share of employment in TKISs can be explained by the level of digital transformation intensity. Robustness analysis, carried out by excluding an outlier observation (Luxembourg), showed stability in the regression coefficient and improved model characteristics (see
Table 8). In the model without Luxembourg, the value of the R-squared coefficient of determination increased to 0.7245, and the distribution of residuals was found to follow a normal distribution at the significance level of α = 0.05. The standard error of the regression was reduced, which translated into better predictive characteristics of the model. The findings indicate that the positive relationship between the level of digital transformation and employment in the TKIS sector is statistically robust and resistant to the influence of outlier observations, hence strengthening its reliability.
To confirm the reliability of findings, additional analyses were carried out by including control variables: GDP per capita and GERD per capita. The results of the extended regression models with control variables (
Table 9) provided additional information allowing a better assessment of the strength and nature of the relationship between the level of digital transformation and the structure of employment in the analyzed sectors.
For the HTM sector, none of the models showed statistically significant relationships, and the level of model fit remained low. The variable SM(DT), as well as GDP per capita and GERD per capita, proved to be statistically insignificant. This means that the relationship between the level of digitalization and employment in this sector was not confirmed.
In the MHTM sector, in turn, despite an increase in model fit after the inclusion of control variables, the regression coefficient for the SM(DT) variable remained statistically insignificant. Instead, a significant negative effect of GDP per capita and a positive effect of GERD per capita on employment were recorded in this sector. This may suggest that digital transformation affects employment indirectly or in interaction with other factors. However, such an interpretation requires further in-depth analysis.
In the TKIS sector, the relationship between the level of digital transformation and the share of employment maintained statistical significance in all models, and model fit improved after the inclusion of GDP per capita and GERD per capita. In both extended models, the control variables (GDP per capita and GERD per capita) were not statistically significant, and their inclusion did not affect the significance of the main variable. The increase in model fit and positive results of normality tests of the residuals (Shapiro–Wilk) confirm the stability and robustness of the original model.
In summary, a positive and statistically significant relationship was confirmed only for the knowledge-intensive service sector. In the case of the medium–high-tech industry sector, the results are inconclusive, and for the high-tech industry sector, no empirical evidence of such a relationship was found.
Thus, it can be concluded that hypothesis H4 has been partially confirmed. There is a significant and positive relationship between the level of digital transformation and the structure of employment in knowledge-intensive services, while in high- and medium–high-tech industries, such a relationship has not been confirmed. This means that digital transformation processes are more conducive to the development of knowledge-intensive services than high- and medium–high-tech industries.
The lack of significant correlations for the other sectors suggests that the digital transformation of small and medium-sized enterprises in a short-term perspective does not translate directly into employment changes in technology sectors. It should be highlighted that knowledge-intensive services may be more directly linked to digital transformation than high- and medium–high-tech manufacturing, whose growth depends on other factors too, such as capital investment or the development of R&D infrastructure. Digital transformation has a greater impact on increasing the share of employment in knowledge-intensive services than in high- and medium-tech manufacturing, because knowledge-intensive services have a more extensive potential for transformation in terms of the provision and scope of offered services owing to digital technologies. In knowledge-intensive services, such as digital education, financial services, consulting or IT, digitalization enables the formation of new industries and markets [
32,
37]. In the “data-driven” sectors, including media and entertainment services and financial services, relying most heavily on the Internet of All Things, i.e., networks connecting people, objects, data and processes for the digital exchange of value, digital transformation enables offering new services [
37]. The digitalization of services allows new markets and customers to be reached, which increases the demand for workers in this sector. In knowledge-intensive services, employees need to be competent in using digital technologies to provide services, analyze data, communicate with customers online, etc. As digital transformation keeps advancing, the demand for professionals presenting these skills is also increasing, contributing to employment growth in the sector [
27,
32].
In contrast, high- and medium–high-tech manufacturing, as the already technologically advanced sectors, may experience transformation focused on optimization and automation of production, which does not necessarily lead to a proportionally higher employment growth compared to the service sector intensely adapting these technologies to its operations [
32]. In addition, digital transformation in knowledge-intensive services affects the way work is organized and the employment profile more quickly than in industry, where changes are often more costly and complicated.
Previous studies describe digital transformation as a gradual process, involving automation and requiring digital maturity [
2,
27,
28,
37]. These aspects suggest that changes in employment are likely to occur with some delay from the implementation of digital technologies, as the full effects of transformation, including its impact on employment structure, manifest themselves as the process progresses and are spread out over time. Thus, a time gap may occur between the implementation of new technologies and their impact on the employment structure. Hence, it would be necessary to monitor the analyzed relationship over a longer period of time. Currently, the lack of statistical information is a limitation for conducting such research.
Despite drawing important conclusions, several key limitations of the conducted research, which affect the scope and interpretation of the findings, should be mentioned. One of them is the short time frame of available statistical information on the digital transformation rates of small and medium-sized enterprises. This limited the ability to capture the dynamic changes and the long-term impact of digitalization on the employment structure. Another limitation of the presented research is the narrow focus on the small and medium-sized enterprise sector. This choice was dictated both by practical considerations, including the availability of statistical data at the level of European Union countries, and by the substantive intention to focus the analysis on entities that, due to their scale of operation, may react differently to digital transformation processes than large enterprises. In addition, the empirical study was based on quantitative data, whereas a better understanding of the mechanisms influencing the impact of the level of digital transformation on the structure of employment in high- and medium–high-tech manufacturing and knowledge-intensive services could be achieved through qualitative research (e.g., interviews with entrepreneurs, case studies).
Identifying the reasons underlying the occurrence of relationships between the level of digital transformation and the structure of employment in high-tech and medium–high-tech manufacturing and knowledge-intensive services requires further in-depth research. The current results allow identifying general correlations, but due to their limitations, they do not fully explain the mechanisms behind the observed differences, especially in the group of countries characterized by a medium level of digital advancement. It is therefore reasonable to continue and deepen studies covering this area—in particular, long-term studies capturing the lagged impact of digitalization processes on the structure of employment, as well as analyses integrated with other aspects of the transformation—such as digital skills, infrastructure and the quality of digital public services. Then it will be possible to fully understand the dynamics and consequences of digital transformation in the social, economic and political context.
In the future, it is worth undertaking spatial–temporal analyses to capture the regional and dynamic dimensions of digital transformation. Expanding the methodological scope to include multivariate regression, panel models and more advanced estimation techniques would allow better identification and interpretation of the complex relationships between digital transformation and employment in high-tech sectors and knowledge-intensive services.
It may also be a valuable research direction to combine the results of empirical analyses with the effects of implementing specific European Union initiatives and strategies on digital transformation and employment development in high-tech and knowledge-intensive sectors. Such an approach will enable a deeper interpretation of the research results and make them more useful in the context of public policies.
Future research should also consider expanding the scope of analysis to include the large enterprise sector, thus allowing a comparison of the dynamics of digital transformation and its effects according to the scale of companies’ operations. Such an approach could also enable the identification of good practices in the implementation of digitalization to be adapted by smaller entities.


