Abstract
This paper proposes an integrated tree model architecture and a low-cost data construction method based on an improved Stacking strategy. It systematically analyzes the importance of safety indicators for mountainous sharp bends in plateau regions and conducts safety evaluation and optimization-strategy research for ten typical sharp-bend road segments in Tibet. In response to the challenges of traditional data collection in Tibet’s unique geographical and policy constraints, we innovatively use drone aerial video as the data source, integrating Tracker motion trajectory analysis, SegFormer road segmentation, and CAD annotation techniques to construct a dataset covering multi-dimensional features of “human–vehicle–road–environment” for mountainous plateau sharp-bend highways. Compared with similar studies, the cost of this dataset is significantly lower. Based on the strong interpretability of tree models and the excellent generalization ability of ensemble learning, we propose an improved Stacking strategy tree model structure to interpret the importance of each indicator. The Spearman correlation coefficient and TOPSIS algorithm are used to conduct safety evaluation for ten sharp-bend roads in Tibet. The results show that the output of the improved Stacking strategy and the sensitivity analysis of the three tree models indicate that curvature variation rate and acceleration are the most significant factors influencing safety, while speed and road width are secondary factors. The study also provides a safety ranking for the ten selected sharp-bend roads, offering a reference for the 318 Quality Improvement Project. From the perspective of indicator importance, curvature variation rate, acceleration, vehicle speed, and road width are crucial for the safety of mountainous plateau sharp-bend roads. It is recommended to implement speed limits for vehicles and widen the road-bend radius. The technical framework constructed in this study provides a reusable methodology for safety assessment of high-altitude roads in complex terrains.
1. Introduction
1.1. Research Background
Recent survey data indicate that hundreds of thousands of traffic accidents occur annually in China, resulting in approximately 60,000 fatalities and billions of dollars in direct economic losses. The significance of traffic safety evaluation lies in its potential to reduce accidents and protect public lives and property.
The G318 National Highway, located in the Sichuan–Tibet section of the Qinghai–Tibet Plateau, has its own distinct characteristics due to the unique environment of the plateau and the frequent traffic loads. Due to the mountainous terrain of the Qinghai–Tibet Plateau, many roads are built along the mountainside, where sharp curves (such as hairpin turns and continuous S-shaped bends) frequently appear, with small turning radii and some curves having large blind spots. The high-altitude climate leads to strong winds, and the road surface is prone to ice, snow accumulation, or slipperiness. Some sections of the road are narrow, making it difficult for vehicles to pass, and the edges may lack protective barriers or guardrails. Due to frequent sub-zero temperatures at night and multiple freeze–thaw cycles throughout the year, roadbed frost heave and pavement disease are common. In an environment with strong ultraviolet radiation, asphalt pavements age more quickly and, combined with frequent traffic loads, the asphalt layer experiences fatigue, leading to surface cracks, ruts, pavement displacement, low-temperature cracking, loosening, and peeling, all of which seriously affect vehicle driving conditions.
To improve the condition of the G318 National Highway, enhance traffic efficiency, and ensure safe travel, the Chinese government launched the “318 Quality Improvement Project,” aiming to achieve the goals of “safety upgrade, efficiency improvement, and ecological friendliness”. Therefore, conducting a safety assessment study of mountainous plateau roads is of great significance for the Quality Improvement Project.
Currently, there is limited research on traffic safety assessments in mountainous plateau areas. Given the limitations of terrain and geological conditions, traffic accidents frequently occur on mountain roads [1]. Furthermore, the thin oxygen levels at high altitudes lead to driving fatigue [2]. Therefore, research on traffic safety in mountainous plateau areas is highly necessary.
Many road traffic accidents occur on curves, with sharp turns being more accident-prone than gentle ones [3]. To reduce traffic accidents, this paper focuses on the safety assessment of sharp-curve roads in the mountainous plateau traffic environment.
1.2. Literature Review
In the field of traffic safety evaluation, scholars consider different factors and conduct safety evaluations for different research subjects. In terms of intersection safety evaluation, Alghafli, A. et al. [4] considered the impact of geometric road conditions on intersection safety performance. Shawky, M. et al. [5] conducted a traffic safety evaluation of roundabouts by utilizing drones to extract traffic conflict points. Wu, K. et al. [6] used the Time-to-Collision (TTC) as a surrogate indicator for collisions and assessed the effectiveness of Intersection Movement Assist (IMA) in improving the traffic safety of intersections. Yaibok, C. et al. [7] used the VISSIM simulation tool and the Safety Surrogate Assessment Model (SSAM) to evaluate the safety of three types of roundabouts. Alhajyaseen, W. K. [8] proposed a safety evaluation measure based on changes in total kinetic energy before and after a vehicle collision, collision angle, and Post-Encroachment Time (PET), evaluating some signalized intersections in Nagoya, Japan. Ghaneei, Z. et al. [9] evaluated the safety impact of implementing a randomized phase before and after an intersection based on driving behavior and conflict frequency.
In terms of tunnel safety evaluation, Zhao, Y. et al. [10] used the Fuzzy Analytic Hierarchy Process (FAHP) and Set Pair Analysis (SPA) to assess the safety risks of long and large tunnels on highways. Chen, J et al. [11] collected data from 29 experimenters and 300 experimental scenarios, and successfully predicted traffic safety coefficients under different tunnel lighting conditions using a PSO-BP neural network model. Liu, H [12] evaluated the structural safety of highway tunnels using possibility and prospect theory. Zhao, X et al. [13] recruited 30 drivers and applied an entropy-weighted fuzzy comprehensive evaluation model to assess the impact of different tunnel sidewall decorations on safety. Jiao, F et al. [14] constructed four types of urban highway tunnel horizontal-curve schemes and analyzed and evaluated four scenarios through visual tests, speed perception tests, and subjective evaluations. The results showed that urban highway tunnel scenarios with LED arches were the safest.
For highway safety evaluation, Chen, Y. et al. [15] considered vehicle safety boundary characteristics and constructed an overall collision probability model based on Fault Tree Analysis (FTA) to evaluate linear safety on highways. Khattak, A. J. et al. [16] proposed a new method for evaluating highway stopping and overtaking sight distance safety based on GIS and LiDAR data. Mullakkal-Babu, F. et al. [17] used microscopic traffic flow simulators to assess the safety impact of Automated Driving System (ADS)-equipped vehicles in mixed traffic with Human-Driven Vehicles (HVs). Wang, J. et al. [18] combined Rank and Significance Ratio (RSR), Criteria Importance Through Intercriteria Correlation (CRITIC), and Least Squares Support Vector Machines (LSSVM) to construct a risk assessment model for general trunk roads and used Extended Fourier Amplitude Sensitivity Test (EFAST) for factor sensitivity analysis.
For rural road safety evaluation, Shi, L. et al. [19] constructed a bucket evaluation model based on fuzzy and bucket theories and weighted analysis to analyze rural road safety. Li, Q. et al. [20] proposed a safety assessment method using the Normal Cloud Model (NCM) and conducted a traffic safety evaluation for rural roads in the Loess Plateau Gully Region. Llopis-Castelló, D. et al. [21] proposed a new local consistency model based on the Inertia Consistency Index (ICI) to estimate the collision frequency on horizontal curves of rural roads.
In terms of mountainous road safety evaluation, Lamm, R. et al. [22] were the first to propose a safety evaluation method for two-lane rural roads, establishing an evaluation index system for rural road safety, which laid the foundation for subsequent safety evaluations of mountainous roads. Yuan, Z. et al. [23] used the Gray–Markov model to predict accidents in mountainous plateau areas. Wang, J. J. et al. [24] proposed an attribute reduction algorithm based on traffic accident data and traffic flow characteristics in mountainous roads, performing significance weighting for data and constructing a system analysis. Sheng, L. I. N. et al. [25] collected driver heart rate indicators on continuous long downhill sections of mountainous highways and constructed a driving load model. Zhang, H. et al. [26] developed an innovative geographical information system (GIS)-based model for evaluating the geometric design quality of mountainous roads. Qin, W. et al. [27] proposed a driving risk assessment model—the Comprehensive Driving Risk Field (CDRF)—for safety evaluation in following and overtaking scenarios on mountainous roads.
The aforementioned studies focus on safety evaluations for intersections, tunnels, highways, rural roads, and mountainous roads, but few studies have addressed the safety of sharp curves in high-altitude, mountainous roads. In terms of research methods, the aforementioned studies have certain limitations. For example, in reference [5], drones were used to collect data at urban roundabouts, but in plateau areas, wind speed can cause the drone to shake, making it difficult to stabilize video data collection (due to the impact of wind speed, this study manually labeled the trajectory during trajectory extraction). In references [7,19], parameter input before simulation and determining indicator weights are subject to the subjective influence of researchers. In reference [16], an aircraft equipped with a Light Detection and Ranging (LiDAR) system was used for terrain data collection, but the cost is too high. In reference [25], 23,549 heart rate data points from drivers were collected, resulting in an excessively large experimental scale. Refs. [18,20] did not consider traffic participants. Ref. [8] required kinetic energy and angle data during vehicle collisions, while references [15,26] both used Fault Tree Analysis (FTA), which requires prior knowledge of accident probabilities. Refs. [23,24] both require accident data, which is difficult and time-consuming to obtain.
From the perspective of data acquisition difficulty and cost, this study only uses video footage captured by drones as the source data and forms a high-altitude, mountainous, sharp-curve road dataset through a series of data preprocessing techniques. An improved Stacking strategy is used to explain the importance of factors affecting the safety of high-altitude, mountainous, sharp-curve roads and to conduct safety assessments, aiming to reduce the accident rate of these roads and fill the research gap in this field. Therefore, the contributions of this study can be summarized as follows:
- The research focuses on high-altitude, mountainous, sharp-curve roads, filling the research gap in this field.
- Compared to previous studies, this research has the advantage of low data acquisition costs, using only drone-collected video as the raw data source. The dataset is constructed using data processing methods such as Tracker software 6.2, SegFormer road image segmentation technology, and CAD 2021 annotations. The dataset comprehensively covers all key elements in the traffic system, including humans, vehicles, roads, and the environment.
- Unlike other machine learning models, this research selects decision trees, random forests, and gradient boosting trees as base learners. These models are advantageous because of their strong interpretability, and by integrating multiple tree models, they can effectively improve the overall model’s generalization ability.
- This study innovatively replaces the second-level meta-learner in the traditional Stacking strategy with a linear weighting function. Unlike the traditional Stacking strategy, where meta-learners learn from the meta-training set produced by base learners, the traditional method cannot interpret feature importance. In contrast, the simple structure of a linear weighting function can achieve this function.
- This study also supplements the explanation of feature importance using a perturbation-based sensitivity analysis method, which avoids the issues of dataset limitations and potential multicollinearity of some features.
- This study uses the Spearman correlation coefficient to determine the positivity or negativity of the indicators and employs a weighted TOPSIS evaluation method to assess and rank the safety of sharp-bend roads in Tibet, providing a decision-making basis for the Quality Improvement Project of National Highway 318.
2. Research Methodology
2.1. Selection of Indicators
Traffic safety evaluation should cover the entire transportation system, and the transportation system is a complex system where humans, vehicles, roads, and the environment are deeply integrated. To ensure that the safety indicator evaluation system constructed is applicable to high-altitude, mountainous, sharp-curve roads, the indicators must cover the entire transportation system, i.e., they must reflect humans, vehicles, roads, and the environment. Therefore, the selection of indicators is crucial.
(1) Humans are the core of the transportation system, including primarily drivers and pedestrians. For low-altitude areas, pedestrians, especially the elderly and children, have a significant impact on traffic safety [24,25]. However, on high-altitude, mountainous roads, where the population is sparse, the impact of pedestrians can be neglected.
Statistics show that more than 85% of traffic accidents in China are directly related to dangerous driving behavior by motor vehicle drivers [26]. For drivers, their psychological state and driving behavior during travel directly affect vehicle speed. This study focuses on key feature variables that can accurately reflect the driver’s psychological state and driving behavior. In overtaking and following scenarios, to ensure driving safety, drivers tend to concentrate and adopt cautious driving strategies. Therefore, this study uses whether a driver is in an overtaking or following situation as an objective, quantifiable indicator of the driver’s psychological state. Additionally, the specific driving behavior of the vehicle on curves, including whether it is close to the inner side of the lane, the outer side of the lane, the centerline, or whether it occupies the lane, is considered a direct external manifestation of driving behavior.
Therefore, the metrics chosen for humans include whether or not to meet or follow a vehicle and the driving behavior of the vehicle.
(2) Research has shown that vehicle type has an important impact on traffic safety [27]. Compared to smaller vehicles, larger vehicles generally require a larger turning radius and slower speeds. Acceleration can reflect the vehicle’s driving state and road conditions to some extent. When road conditions are poor, vehicles will drive more smoothly, and acceleration will generally be low. When road conditions are good, vehicles tend to drive more aggressively, and acceleration will generally be high. Thus, acceleration should also be included as an indicator. Literature [28] has found a positive correlation between accident frequency and speed, as accidents due to speeding often occur. Therefore, vehicle speed should also be included as an indicator.
Therefore, the indicators selected for vehicles include vehicle type, acceleration, and velocity.
(3) Road alignment is an important indicator for evaluating road safety [29]. Modern road alignment consists of straight lines, circular curves, and transition curves. The curvature of a straight line is 0, while the curvature of a circular curve is 1/R. At the junction of a straight line and a circular curve, curvature discontinuity can occur, which does not conform to the vehicle’s driving trajectory and increases safety risks. Therefore, a transition curve is introduced as a transitional linear element between straight lines and circular curves. Although scholars have proposed forms such as cubic parabolas and double-loop curves for transition curves, the clothoid curve is used in China due to its simplicity and ease of calculation [30]. The basic formula is shown in Equation (1).
where r is the radius of curvature of a point on the gyratory line (m); l is the length of the curve from a point on the gyratory line to the origin (m); A is the gyratory line parameter (m).
Although the clothoid curve parameter A characterizes the rate of curvature change, it cannot be used as a safety evaluation indicator for road alignment because at the starting point of the clothoid curve, the curvature is 0, and the radius of curvature is infinite, making it unsuitable as a numerical indicator.
Road traffic safety is very sensitive to the curvature change rate (CCR) [31]. The curve radius plays a significant role in the occurrence of accidents [32,33,34]. When the radius of a horizontal curve significantly deviates from the average radius of the road segment, the curve may violate the driver’s expectations, leading to inconsistency. The CCR calculation formula is as follows [35]:
where is the curvature change rate; is the ith plane curve radius of the road (m); is the average radius (m).
A high curvature change rate can cause misalignment in the road, which may induce driver anxiety, affecting operational stability and vehicle performance. Lane width has a significant impact on road accidents; research has shown that the wider the lane, the lower the accident rate [36]. The deflection angle of a curve, as an important condition for assessing the easing of a curve, should also be considered.
Therefore, the indicators selected for roads include curvature change rate, lane width, and curve deflection angle.
(4) For high-altitude, mountainous, sharp-curve roads, the most significant environmental characteristic is the altitude. The hypoxic environment at high altitudes can easily lead to driver fatigue and slower reactions.
Therefore, altitude is selected as an environmental indicator.
(5) Research results indicate that when the radius of horizontal curves increases, the number of road accidents tends to decrease [37]. Vehicle speed is a core indicator for assessing traffic safety [38], and the literature [39] suggests that the 85th percentile of vehicle speed is a key factor in reducing vehicle collisions. This highlights the critical impact of horizontal curve radius and vehicle speed on traffic safety. In the absence of actual collision data, surrogate safety measures (SSM) are typically used as alternative indicators. Previous studies have used maximum deceleration rate (MDR) as an SSM, with a safety threshold of 1.5 m/s2 [40].
For instance, in the literature [40], based on a rural case study in Iran, the safety threshold was considered to be a road-curve radius of 358 m and a speed of 23 m/s. However, traffic conditions vary across countries. In China, the “Highway Alignment Design Code” (JTG D20-2017) states that a 50 m radius is commonly considered the critical value that distinguishes standard curves from high-risk curves. China also generally considers the corresponding vehicle speed at the 85th percentile of the cumulative speed distribution curve as the speed limit. Therefore, this study uses the 85th percentile vehicle speed, a curve radius of 50 m, and a maximum deceleration rate of 1.5 m/s2 as the target threshold for determining safety.
The selection of indicators for this study is shown in Table 1.

Table 1.
Selection of indicators.
The original data for this study is derived from video footage captured by drones. Although numerous factors, such as road superelevation, can affect traffic safety, some indicators cannot be extracted from the video data due to the limitations of the source data. Therefore, this study only extracts the aforementioned relevant indicators from the video data. This approach to dataset construction is characterized by low cost and high efficiency, and it can provide a useful reference for subsequent research in this field, offering valuable insights for related researchers.
2.2. Calculation of the Importance of Indicator Features
Most machine learning algorithms are considered ‘black box’ models, with limited interpretability. As a result, they are not well-suited for explaining the importance of safety indicators for highways with sharp curves in mountainous plateau areas. Therefore, this study selects tree-based models, which offer greater interpretability, to determine the significance of each safety indicator. Common tree models include the basic decision tree (Decision Tree), the random forest model based on the bagging strategy (Random Forest), and the gradient boosting decision tree model based on the boosting strategy (GBDT). The characteristics of these three tree models are outlined in Table 2.
Table 2.
Summary of the characteristics of the three tree models.
The focus of the three tree models differs, and to ensure more accurate determination of index importance, all three models are employed simultaneously to calculate feature importance. Additionally, the Stacking strategy of ensemble learning is adopted to provide more precise feature importance values. The traditional Stacking model consists of two layers: the first layer contains base learners, while the second layer hosts the meta-learner. While this two-layer structure improves the model’s generalization ability, it sacrifices interpretability. To enhance interpretability, this study modifies the traditional Stacking model. Specifically, the modification occurs in the second layer: the three tree models serve as base learners in the first layer, and instead of using traditional machine learning methods in the second layer, a linear weighting model with high interpretability is employed. The weights for this model are determined based on the accuracy of the tree models on the test set, outputting objective values that characterize the performance of the three tree models. The improved output methods for the second layer in this study are presented in Equations (3)–(6).
where are the model weights of the three tree models; are the accuracy rates of the three tree models; are the outputs of the three tree models in terms of the importance of the indexes; and is the output of the final indexes in terms of the importance of the indexes.
The structure of the traditional Stacking model is depicted in Figure 1. The structure of the improved Stacking model in this study is shown in Figure 2, while Figure 3 illustrates the tree model within the improved Stacking strategy employed in this study.
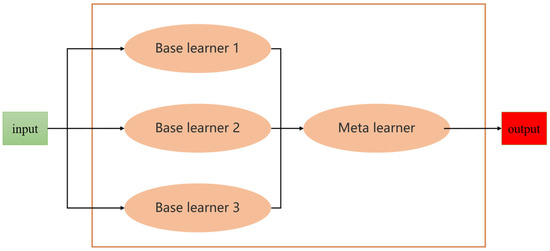
Figure 1.
Traditional Stacking model structure.
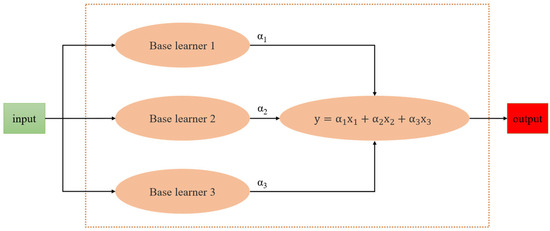
Figure 2.
Improved Stacking model structure.
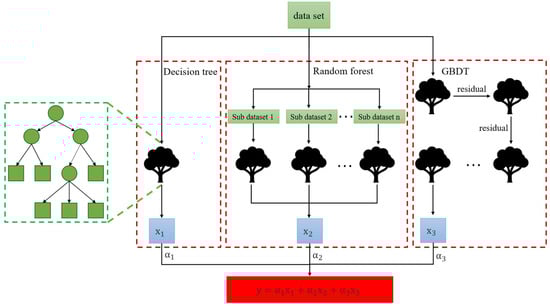
Figure 3.
Improved tree model structure for Stacking strategy.
2.3. Integrated Evaluation Method
This study includes ten independent but dimensionally inconsistent indicators: whether to meet, whether to follow, driving behavior, vehicle type, acceleration, speed, curvature change rate, road width, curve deflection angle, and altitude. TOPSIS (Technique for Order Preference by Similarity to Ideal Solution) is a classical multi-criteria decision-making (MCDM) method used for ranking and selecting alternatives. It eliminates differences in scale among indicators through vector normalization (e.g., Euclidean Paradigm Normalization), making multi-dimensional data comparable. Therefore, this study adopts TOPSIS for comprehensive evaluation. However, before applying this method, the indicators must be homotrended, meaning their data must reflect a clear relationship of superiority and inferiority, where larger values represent better conditions and smaller values indicate worse conditions. To achieve this, this study introduces the Spearman correlation coefficient to calculate the positivity or negativity of indicators for sharp-bend roads in plateau regions. If an indicator is negative, the positive ideal solution and negative ideal solution should be reversed.
The calculation method of the Spearman correlation coefficient is shown in Equation (7).
where is the Spearman correlation coefficient; is the rank difference between the corresponding observations of the two variables; n is the sample size.
TOPSIS is calculated as follows:
(1) Construct the decision matrix, where there are m evaluation objects and n evaluation indicators.
where denotes the value of the ith program under the jth indicator.
(2) To eliminate the influence of different indicator scales, the data in each column of the original matrix must be standardized.
(3) The tree model, based on the improved Stacking strategy, calculates the importance of each indicator, yielding the weight vector W.
(4) The weighted normalization matrix V is calculated.
(5) Determine the positive and negative ideal solutions.
(6) Calculate the distance from each solution to the positive and negative ideal solutions.
(7) Calculate the scores for each alternative.
3. Overview of the Research Subject and Dataset Creation
3.1. Study Area
This study selected ten sharp-curve roads located on the G318 National Highway in the Tibet Autonomous Region of China. The stake numbers are as follows: G318-K3657+200, G318-K3665+300, G318-K3665+450, G318-K3669+250, G318-K3671+900, G318-K3675+600, G318-K3682+500, G318-K3685+100, G318-K3707, and G318-K3712+400. These curves are all located within the famous “72 Bends of the Nujiang River” area, distributed along a 50 km stretch of road. This area is characterized by frequent sharp curves and large curve radii. Additionally, it experiences high traffic flow, with common pavement defects such as cracks and ruts, and overall poor road conditions, making it a typical representative of high-altitude, mountainous, sharp-curve roads.
Data collection was conducted in April 2025. During the data collection process, due to high wind speeds in the plateau region, drones were unable to take off and operate properly in certain sections of the G318 National Highway within the “72 Bends of the Nujiang River”. Therefore, this study only collected data from the ten sharp curves where the drones were able to safely take off and complete data acquisition.
Images of the ten sharp-curve roads captured by the drone are shown in Figure 4.
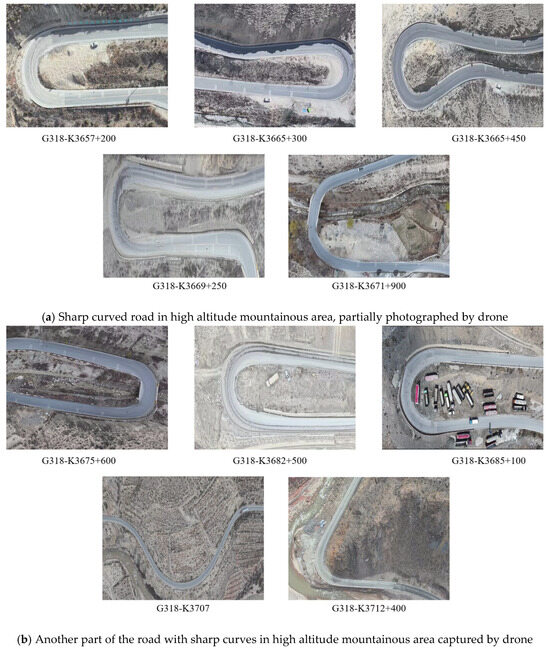
Figure 4.
High-altitude, mountainous, sharp-curve road captured by drone (a,b).
3.2. Dataset Creation
Based on Table 1, the feature values of the dataset in this study are as follows:
Meeting (Binary feature: 0 means no meeting, 1 means meeting).
Following (Binary feature: 0 means not following, 1 means following).
Driving behavior (Four categories: 1 means driving on the outer curve, 2 means driving on the centerline, 3 means driving on the inner curve, 4 means occupying the lane).
Vehicle type (Four categories: 1 means non-motor vehicle, 2 means standard vehicle, 3 means small truck, 4 means large truck).
Acceleration.
Speed.
Curvature change rate (CCR).
Altitude.
Road width.
Curve deflection angle.
The target value of this dataset is Safety (Binary features: A speed less than the 85th percentile vehicle speed, a curve radius greater than 50 m, and acceleration less than 1.5 m/s2 are considered safe, represented by 0. Unsafe conditions are represented by 1).
Data collection and processing involve various technical means. Features like meeting, following, driving behavior, and vehicle type are manually labeled from the videos collected by drones. Acceleration and speed data are extracted using Tracker software after capturing the vehicle’s driving trajectory. Curvature change rate is calculated using SegFormer image segmentation technology. After segmenting the road from images, the data is imported into AutoCAD for labeling. Altitude data is obtained directly through the drone’s labeling function. Road width and curve deflection angle are also labeled using AutoCAD 2021 software.
During trajectory capture, the research team encountered issues like missing trajectory data and video instability caused by wind, which affected the data. Specifically, due to limitations in trajectory capture technology, instantaneous data before and after entering a curve could not be effectively recorded, leading to missing acceleration data. To address this, a nearest-neighbor data-filling method was employed. Although this method resulted in some inaccuracies, the minor noise it introduced improved model training and ensured the integrity and usability of the dataset. Due to wind speed interference, the video was not static. To ensure accurate trajectory extraction, manual trajectory annotation was applied. In terms of space, we performed proportional calibration using our own research vehicle. In terms of time, we ensured a certain frame interval for each trajectory capture to minimize errors.
Although there are differences in the road alignment of each bend, leading to varying driving behaviors and speed distributions, when considering the 85th percentile speed for each bend individually, it is found that the lowest 85th percentile speed among the ten bends is 7.5 m/s, while the highest reaches 24.2 m/s. If considered separately, using 7.5 m/s as the safety speed threshold for some bends is obviously too small, while using 24.2 m/s as the threshold is too large. Therefore, this study aggregates the speed values from the ten bends and uses the overall 85th percentile speed as the safety threshold for all ten bends.
To present the vehicle speed and acceleration data distribution more clearly, cumulative frequency distribution graphs for acceleration and speed were plotted, as shown in Figure 5 and Figure 6. The distribution characteristics from the figures indicate that the 85th percentile speed corresponds to 17.21732 m/s, while the threshold speed from the literature [40] is 23 m/s. Considering the differences in traffic conditions between countries and the specificity of this study, the threshold speed is reasonable.
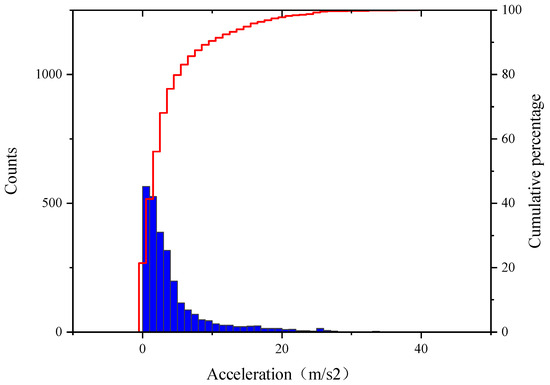
Figure 5.
Cumulative frequency curve of acceleration.
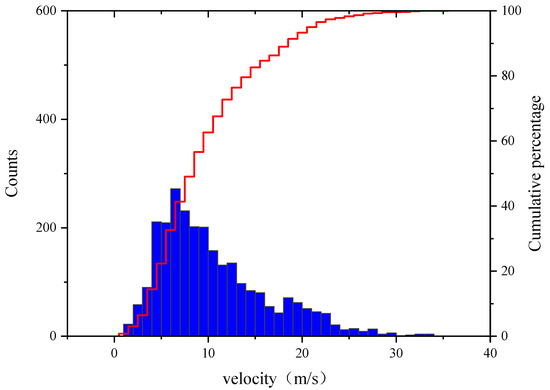
Figure 6.
Cumulative frequency curve of speed.
This study uses SegFormer image segmentation and CAD annotation methods to determine the curvature change rate of sharp curves on highways in mountainous plateau areas. Through image segmentation, the segmented road is imported into CAD, where the centerline of the road is approximated using a spline curve. Finally, curvature radius is obtained through the annotation method, from which the curvature change rate is calculated. The specific steps are as follows:
- Road Segmentation: The SegFormer is used to segment the road images, separating the road from the background.
- Import to CAD Software: The segmented images are imported into CAD software.
- Determining the Road Centerline: The road edges are fitted using a spline curve, and then the road edges on both sides are connected to determine the fitting points of the road centerline.
- Spline Curve Fitting: A spline curve is used to fit the road centerline in order to obtain a smooth representation of the road centerline.
- Polyline Fitting: The fitted spline curve is segmented and converted into a polyline.
- Curvature Variation Rate Calculation: Spatial calibration is performed using vehicle reference objects on the image. After calibration, the curvature radius is obtained using the annotation function of CAD software, and the rate of curvature change in the road is calculated.
SegFormer is an efficient image segmentation model based on the Transformer architecture. It reduces computational costs while maintaining high accuracy through multi-scale feature fusion and lightweight design. In this study, SegFormer is used for the road segmentation task, with specific hyperparameter settings shown in Table 3 and the model structure illustrated in Figure 7. The results of the image segmentation are presented in Figure 8.
Table 3.
Hyperparameter settings.
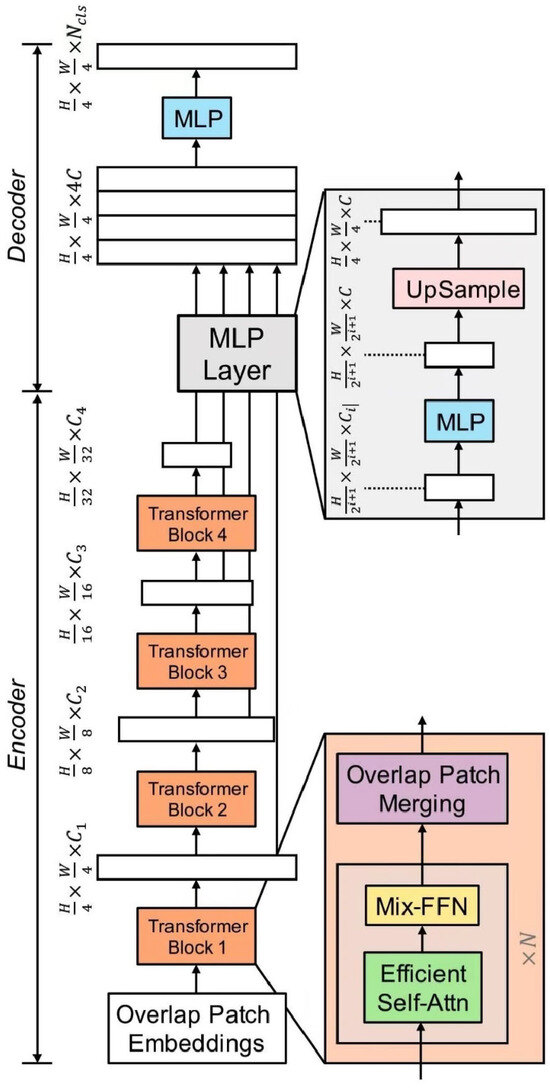
Figure 7.
Segformer model structure.
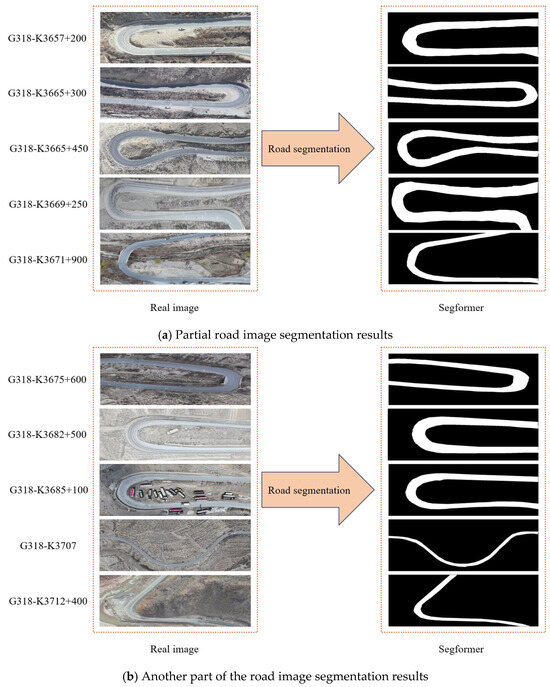
Figure 8.
Road image segmentation results (a,b).
4. Safety Evaluation
4.1. Indicator Importance Calculation
This study utilizes a Jupyter Notebook 7.0.8 program and the Sklearn machine learning library for computation. The dataset is split into training and test sets in an 80:20 ratio. The training set is used to train decision tree, random forest, and gradient boosting tree models, while the test set is used to evaluate model accuracy. Specifically, tree models are introduced by importing sklearn.tree and sklearn.ensemble, data processing is performed using sklearn.model_selection, and model performance is evaluated with sklearn.metrics.
In machine learning, hyperparameters can influence model outcomes, so this study employs the RandomizedSearchCV algorithm for hyperparameter tuning. Unlike traditional grid search, RandomizedSearchCV randomly selects combinations of parameters, making it more efficient when the parameter space is large. The hyperparameter space settings used in this study are shown in Table 4.
Table 4.
Hyperparameter space.
To avoid ignoring important parameter combinations due to too few iterations, set n_iter = 1000, traverse 1000 random parameter combinations, and output the optimal parameter combinations. The results are shown in Table 5.
Table 5.
Optimal parameter combinations.
To evaluate the performance of the models, this study conducts a model comparison. Since the focus of the research is on interpreting the importance of various indicators, interpretable machine learning models were chosen, including Logistic Regression, Ridge Regression, and Lasso Regression. During the comparison, hyperparameter optimization was performed for each of the three models to ensure a fair comparison of model performance. The hyperparameter settings are shown in Table 6.
Table 6.
Hyperparameter settings for the comparison models.
The ROC curve and AUC value are widely used in various binary classification problems, especially when a comprehensive evaluation of model classification performance is required. The closer the AUC value is to 1, the better the model’s performance. In this study, the ROC curve and AUC value are used to evaluate the performance of the decision tree, random forest, gradient boosting tree, logistic regression, ridge regression, and lasso regression models. The comparison results are shown in Figure 9. To better assess the performance and reliability of the machine learning models, this study also evaluates the AUC value using 5-fold cross-validation on models including decision trees, random forests, gradient boosting trees, logistic regression, ridge regression, and lasso regression. The results are shown in Table 7.
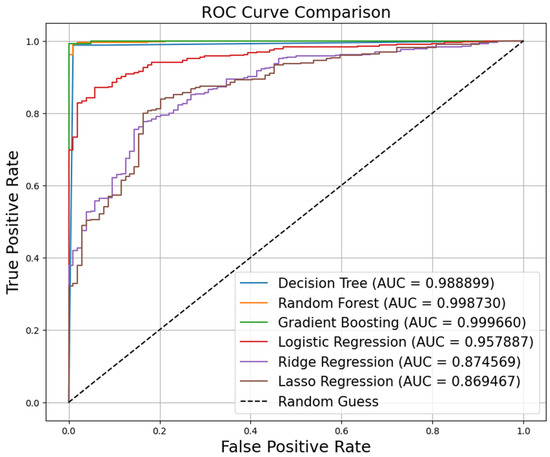
Figure 9.
Model comparison chart.
Table 7.
Five-fold cross-validation AUC table.
The model comparison results indicate that the three tree models selected in this study outperform logistic regression, ridge regression, and lasso regression. Therefore, the three tree models are used to calculate feature importance. The optimal hyperparameter combinations are selected, and the feature importance and accuracy calculated by the three tree models are presented in Figure 10 and Table 8.
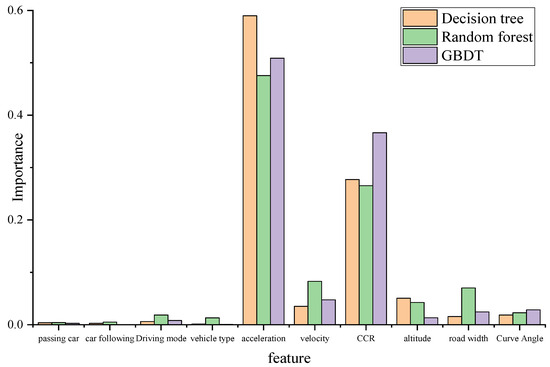
Figure 10.
Feature importance plot derived from the three tree models.
Table 8.
Feature importance table output by the three tree models.
The accuracy of the models is used as the weight of the models. An improved Stacking strategy structure is adopted, and feature importance is re-established using the linear weighted function in Equation (6). The output results are shown in Figure 11. However, considering the dataset limitations and the potential multicollinearity of some features, this study uses a perturbation-based sensitivity analysis method to further explain feature importance. The advantage of this method lies in its strong generalizability, making it applicable to any type of model, including the decision tree, random forest, and gradient boosting tree models used in this study. Specifically, the method involves applying perturbations to each feature and observing the changes in the model’s prediction results to measure the impact of each feature on the model output. The sensitivity analysis results for the three tree models are shown in Figure 12, Figure 13 and Figure 14.
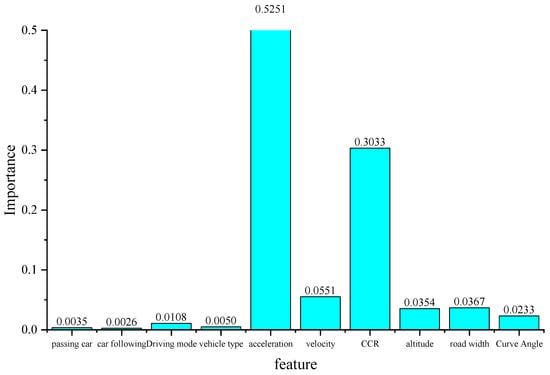
Figure 11.
Feature importance output from the improved Stacking strategy.
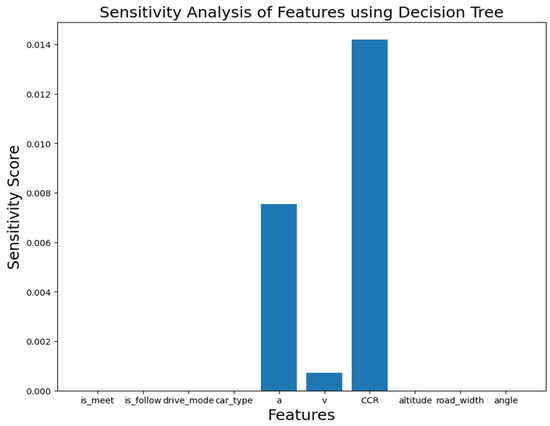
Figure 12.
Sensitivity analysis of decision tree.
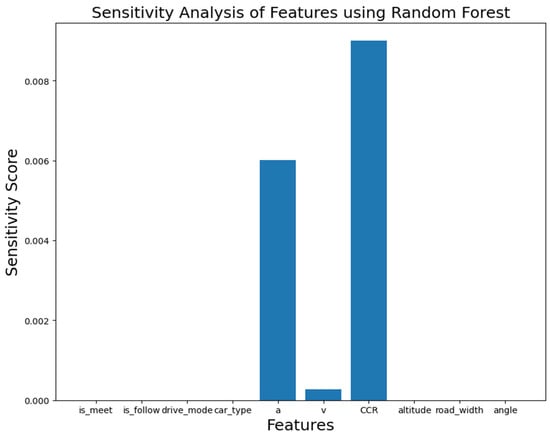
Figure 13.
Sensitivity analysis of random forest.
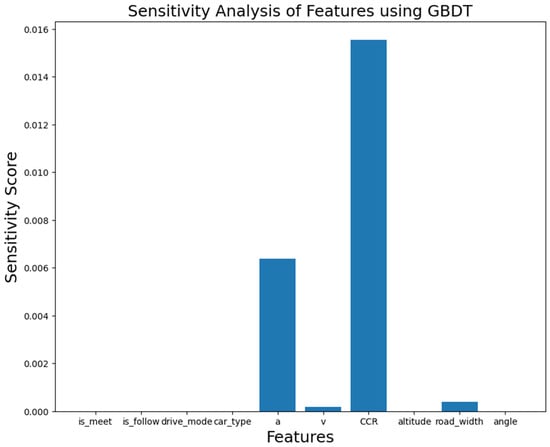
Figure 14.
Sensitivity analysis of GBDT.
Based on the output results of the improved Stacking strategy model, this study ranks the importance of indicators for sharp-bend roads in plateau regions as follows: Acceleration > Curvature variation rate > Speed > Lane width > Altitude > Curve deflection angle > Driving style > Vehicle type > Oncoming traffic > Following distance, with importance values of 0.5251, 0.3033, 0.0551, 0.0367, 0.0354, 0.0233, 0.0108, 0.005, 0.0035, and 0.0026, respectively. Sensitivity analysis from the three tree models indicates that curvature variation rate and acceleration have the greatest impact on safety, while speed and road width have a secondary impact on safety.
Considering the results from both the improved Stacking strategy and the sensitivity analysis of the three tree models, this study concludes that curvature variation rate and acceleration are critical for safety, while speed and road width are also relatively important for safety.
4.2. TOPSIS Evaluation
To conduct the safety evaluation for the sharp-bend roads at G318-K3657+200, G318-K3665+300, G318-K3665+450, G318-K3669+250, G318-K3671+900, G318-K3675+600, G318-K3682+500, G318-K3685+100, G318-K3707, and G318-K3712+400, the first step is to establish the positivity or negativity of the indicators. After performing a normality test, the p-values of all indicators were found to be less than the significance level, indicating that they do not follow a normal distribution. Therefore, this study uses the Spearman correlation coefficient to determine the positivity or negativity of the indicators and calculates the Spearman correlation coefficient between each indicator and the target value. The calculation results are shown in Table 9.
Table 9.
Spearman correlation coefficients for indicators.
The average values of the indicators for the ten sharp curves on the highway are calculated to construct the decision matrix. The safety of the ten sharp curves is then evaluated using the TOPSIS method. The decision matrix is shown in Table 10, and the evaluation results are presented in Table 11.
Table 10.
Decision matrix.
Table 11.
Safety evaluation ranking of the ten sharp curves.
The safety evaluation results indicate that the safety ranking of the ten sharp-bend roads is as follows: G318-K3682+500 > G318-K3712+400 > G318-K3685+100 > G318-K3669+250 > G318-K3707 > G318-K3671+900 > G318-K3657+200 > G318-K3675+600 > G318-K3665+300 > G318-K3665+450.
5. Conclusions
There is a research gap in the safety evaluation of sharp curves on highways in mountainous plateau areas. This study focuses on the sharp curves of the G318 National Highway in Tibet, China, for safety evaluation. Due to the policies and natural environmental factors of the Tibet Autonomous Region, data acquisition in this area is more challenging compared to other regions (e.g., road construction maps are confidential, and strong winds prevent drones from flying in certain areas). This research proposes a low-cost dataset creation method based on drone videos from the perspectives of people, vehicles, roads, and the environment. The dataset is created using various data processing techniques, such as manual trajectory capture using Tracker software, SegFormer road image segmentation, and CAD data annotation.
The improved Stacking strategy for indicator importance analysis was then proposed. Through model comparison, tree models performed better than traditional logistic regression, ridge regression, and lasso regression. Therefore, decision tree, random forest, and gradient boosting tree algorithms were integrated, and the indicator importance was output using the improved Stacking strategy. Considering the dataset limitations, this study also uses a perturbation-based sensitivity analysis method to further explain feature importance. Finally, the TOPSIS algorithm was used to evaluate and rank the safety of ten sharp-bend roads located in the 72 Nujiang Bends, providing decision-making references for the 318 Quality Improvement Project.
Considering both the results of the improved Stacking strategy and the sensitivity analysis of the three tree models, this study concludes that curvature variation rate and acceleration are the most important factors affecting safety, while speed and lane width are secondary factors.
The safety ranking of the ten sharp-bend roads is as follows: G318-K3682+500 > G318-K3712+400 > G318-K3685+100 > G318-K3669+250 > G318-K3707 > G318-K3671+900 > G318-K3657+200 > G318-K3675+600 > G318-K3665+300 > G318-K3665+450. Relevant authorities should focus on the roads ranked lower in safety. Based on the indicator importance ranking, if funding is sufficient, it is recommended to widen the curves to achieve smoother road alignment and increase the curve radius to better accommodate vehicles’ rear wheel trajectories when turning. Additionally, lane widths should be increased to provide more space for vehicles. If funding is limited, it is advised to set speed limit signs and deceleration signs to reduce vehicle speed and acceleration, ensuring safety.
6. Limitations
Machine learning models typically rely on datasets, and although the low-cost dataset creation method proposed in this study is efficient and cost-effective, some indicators cannot be effectively extracted, such as driver variability and indirect environmental factors.
The data collection for this study was conducted in April 2025, without collecting video data from different seasons, which limits the applicability of the current static data to different seasonal evaluation results.
Although this study proposes a low-cost dataset creation method, its limitation lies in the small scale of the dataset (11 × 2640), and the method lacks actual collision data or verified safety reports as a basis. It can only use the 85th percentile vehicle speed, curve radius, and maximum deceleration rate (MDR) as proxy indicators to determine safety. Compared to studies that include relevant accident data, the accuracy of this method may be reduced. However, its advantage is the higher efficiency in dataset creation.
The dataset creation process in this study includes multiple data preprocessing steps to extract feature values. However, due to the complexity of objective conditions, some feature extraction may contain potential errors. Taking the Tibet Autonomous Region as an example, data collection conditions are unique, and confidentiality restrictions prevent access to road construction design plans. Road centerline fitting relies on spline curves, which, while introducing errors, serve as a compromise in the absence of road design plans. Vehicle trajectory extraction is affected by wind speed, which impacts drone stability; manual tracking and spatial calibration are required, along with ensuring that the time interval between frames is not too large. Although errors exist, reference data can still be generated. Overall, the feature extraction methods employed in this study provide innovative ideas for data collection in similar special environments.
Author Contributions
Conceptualization, X.G. and W.B.; methodology, F.C. and D.L.; software, X.W.; validation, F.C. and H.R.; formal analysis, W.B.; investigation, W.B. and X.Z.; resources, X.W.; data curation, F.G.; writing—original draft preparation, X.G.; writing—review and editing, H.R.; visualization, D.L.; supervision, H.R.; project administration, W.B.; funding acquisition, W.B. All authors have read and agreed to the published version of the manuscript.
Funding
This research was funded by the Science and Technology Project of Lhasa, grant number LSKJ202469. This research was also funded by the Traffic Management Research Institute of the Ministry of Public Security, grant number 2024ZDSYSKFKT.
Institutional Review Board Statement
Not applicable.
Informed Consent Statement
Not applicable.
Data Availability Statement
The raw data supporting the conclusions of this article will be made available by the authors on request. (The dataset of this study was collected by UAV in the Tibet Autonomous Region of China, and the Tibet Autonomous Region has the UAV-restricted flight policy. The research team benefited from the support of relevant funds of the Tibet Autonomous Region and was approved to use UAV for collection, so the dataset obtained is very precious and has a certain confidentiality. In order to ensure the scientific nature of the research, we provide the processed dataset in the form of an attachment, and the processing method has been mentioned in the manuscript).
Conflicts of Interest
The authors declare no conflicts of interest.
References
- Huiying, W.; Xiaolong, C. Traffic safety evaluation model for mountain road under bad weather based fuzzy comprehensive evaluation. In Proceedings of the 2011 International Conference on Multimedia Technology, Hangzhou, China, 26–28 July 2011; pp. 1865–1868. [Google Scholar]
- Tian, L.; Li, J.; Li, Y. Analysis of driving fatigue characteristics in cold and hypoxia environment of high-altitude areas. Big Data 2023, 11, 255–267. [Google Scholar] [CrossRef] [PubMed]
- Haynes, R.; Lake, I.R.; Kingham, S.; Sabel, C.E.; Pearce, J.; Barnett, R. The influence of road curvature on fatal crashes in New Zealand. Accid. Anal. Prev. 2008, 40, 843–850. [Google Scholar] [CrossRef] [PubMed]
- Alghafli, A.; Mohamad, E.; Ahmed, A.Z. The Effect of Geometric Road Conditions on Safety Performance of Abu Dhabi Road Intersections. Safety 2021, 7, 73. [Google Scholar] [CrossRef]
- Shawky, M.; Alsobky, A.; Al Sobky, A.; Hassan, A. Traffic safety assessment for roundabout intersections using drone photography and conflict technique. Ain Shams Eng. J. 2023, 14, 102115. [Google Scholar] [CrossRef]
- Wu, K.F.; Ardiansyah, M.N.; Ye, W.J. An evaluation scheme for assessing the effectiveness of intersection movement assist (IMA) on improving traffic safety. Traffic Inj. Prev. 2018, 19, 179–183. [Google Scholar] [CrossRef]
- Yaibok, C.; Suwanno, P.; Pornbunyanon, T.; Kanjanakul, C.; Luathep, P.; Fukuda, A. Improving urban intersection safety insights from simulation analysis. IATSS Res. 2024, 48, 523–536. [Google Scholar] [CrossRef]
- Alhajyaseen, W.K. The integration of conflict probability and severity for the safety assessment of intersections. Arab. J. Sci. Eng. 2015, 40, 421–430. [Google Scholar] [CrossRef]
- Ghaneei, Z.; Momeni Rad, F.; El-Basyouny, K. A surrogate safety assessment of scrambled phase intersections. Can. J. Civ. Eng. 2024, 52, 155–169. [Google Scholar] [CrossRef]
- Zhao, Y.; Qiu, R.; Chen, M.; Xiao, S. Research on operational safety risk assessment method for long and large highway tunnels based on FAHP and SPA. Appl. Sci. 2023, 13, 9151. [Google Scholar] [CrossRef]
- Chen, J.; You, L.; Yang, M.; Wang, X. Traffic safety assessment and prediction under different lighting service states in road tunnels. Tunn. Undergr. Space Technol. 2023, 134, 105001. [Google Scholar] [CrossRef]
- Liu, H. Safety state evaluation method of the highway tunnel structure. Heliyon 2023, 9, e17537. [Google Scholar] [CrossRef] [PubMed]
- Zhao, X.; Liu, Q.; Li, H.; Qi, J.; Dong, W.; Ju, Y. Evaluation of the effect of decorated sidewall in tunnels based on driving behavior characteristics. Tunn. Undergr. Space Technol. 2022, 127, 104591. [Google Scholar] [CrossRef]
- Jiao, F.; Du, Z.; Wong, Y.D.; Mei, J.; Sun, F. Design and evaluation of visual guiding facilities along urban road tunnel horizontal curves based on vision and speed perception. Tunn. Undergr. Space Technol. 2023, 133, 104937. [Google Scholar] [CrossRef]
- Chen, Y.; Wang, K.; Xu, C.; Shi, Q.; He, J.; Li, P.; Shi, T. Evaluation of the safety performance of highway alignments based on fault tree analysis and safety boundaries. Traffic Inj. Prev. 2018, 19, 409–416. [Google Scholar] [CrossRef]
- Khattak, A.J.; Shamayleh, H. Highway safety assessment through geographic information system-based data visualization. J. Comput. Civ. Eng. 2005, 19, 407–411. [Google Scholar] [CrossRef]
- Mullakkal-Babu, F.A.; Wang, M.; van Arem, B.; Happee, R. Comparative safety assessment of automated driving strategies at highway merges in mixed traffic. IEEE Trans. Intell. Transp. Syst. 2020, 23, 3626–3639. [Google Scholar] [CrossRef]
- Wang, J.; Ma, C.; Wang, S.; Lu, X.; Li, D. Risk Assessment Model and Sensitivity Analysis of Ordinary Arterial Highways Based on RSR–CRITIC–LVSSM–EFAST. Sustainability 2022, 14, 16096. [Google Scholar] [CrossRef]
- Shi, L.; Huseynova, N.; Yang, B.; Li, C.; Gao, L. A Cask Evaluation Model to Assess Safety in Chinese Rural Roads. Sustainability 2018, 10, 3864. [Google Scholar] [CrossRef]
- Li, Q.; Cui, J.; Wu, X.; Chen, Z.; Lv, S.; Liu, Y.; Li, W. Evaluation of Rural Road Traffic Safety in Loess Plateau Gully Area of China. Sustainability 2025, 17, 721. [Google Scholar] [CrossRef]
- Llopis-Castelló, D.; Camacho-Torregrosa, F.J.; García, A. Calibration of the inertial consistency index to assess road safety on horizontal curves of two-lane rural roads. Accid. Anal. Prev. 2018, 118, 1–10. [Google Scholar] [CrossRef]
- Lamm, R.; Psarianos, B.; Cafiso, S. Safety evaluation process for two-lane rural roads: A 10-year review. Transp. Res. Rec. 2002, 1796, 51–59. [Google Scholar] [CrossRef]
- Yuan, Z.; Huang, D.; Tong, W.; Liu, Z. Characteristic analysis and prediction of traffic accidents in the multiethnic plateau mountain area. J. Transp. Eng. Part A Syst. 2020, 146, 04020068. [Google Scholar] [CrossRef]
- Wang, J.J.; Cao, X.D. System analysis of potential accidents on mountain road based on rough set and quantitative theory. KSCE J. Civ. Eng. 2021, 25, 1031–1042. [Google Scholar] [CrossRef]
- Lin, S.; Liu, J.-B.; Yan, Y.; Luo, J.; Yua, Z.-Z. Safety evaluation model of long-steep downgrade section for montane highway based on driving workload. J. Traffic Transp. Eng. 2013, 13, 99–106. [Google Scholar]
- Zhang, H.; Zhang, M.; Zhang, C.; Hou, L. Formulating a GIS-based geometric design quality assessment model for Mountain highways. Accid. Anal. Prev. 2021, 157, 106172. [Google Scholar] [CrossRef]
- Qin, W.; Li, H.; Li, W.; Han, C.; Ji, X.; Gu, J. A proactive driving risk assessment on mountainous two-lane roads considering opposite-direction vehicle interactions from video-based trajectories. Comput. Ind. Eng. 2025, 200, 110848. [Google Scholar] [CrossRef]
- Kim, S.; Ulfarsson, G.F. Traffic safety in an aging society: Analysis of older pedestrian crashes. J. Transp. Saf. Secur. 2019, 11, 323–332. [Google Scholar] [CrossRef]
- Deluka-Tibljaš, A.; Šurdonja, S.; Ištoka Otković, I.; Campisi, T. Child-Pedestrian Traffic Safety at Crosswalks—Literature Review. Sustainability 2022, 14, 1142. [Google Scholar] [CrossRef]
- Li, X.; Zhuge, C.; Yu, B. Analysis on the impact of illegal driver behaviors on road traffic accidents case study on China. In Proceedings of the 2019 11th International Conference on Intelligent Human-Machine Systems and Cybernetics (IHMSC), Hangzhou, China, 24–25 August 2019; Volume 1. [Google Scholar]
- Zhang, S.; Xing, Y.; Lu, J.; Zhang, H.M. Exploring the Influence of Truck Proportion on Freeway Traffic Safety Using Adaptive Network-Based Fuzzy Inference System. J. Adv. Transp. 2019, 2019, 3879385. [Google Scholar] [CrossRef]
- Taylor, M.C.; Baruya, A.; Kennedy, J.V. The Relationship Between Speed and Accidents on Rural Single-Carriageway Roads; TRL: Crowthorne, UK, 2002; Volume 511. [Google Scholar]
- Tang, Z.; Chen, S.; Cheng, J.; Ghahari, S.A.; Labi, S. Highway design and safety consequences: A case study of interstate highway vertical grades. J. Adv. Transp. 2018, 2018, 1492614. [Google Scholar] [CrossRef]
- De Santos-Berbel, C.; Ferreira, S.; Couto, A.; Lobo, A. Development of Motorway Horizontal Alignment Databases for Accurate Accident Prediction Models. Sustainability 2024, 16, 7296. [Google Scholar] [CrossRef]
- Anderson, I.B.; Bauer, K.M.; Harwood, D.W.; Fitzpatrick, K. Relationship to safety of geometric design consistency measures for rural two-lane highways. Transp. Res. Rec. 1999, 1658, 43–51. [Google Scholar] [CrossRef]
- Aram, A. Effective safety factors on horizontal curves of two-lane highways. J. Appl. Sci. 2010, 10, 2814–2822. [Google Scholar] [CrossRef][Green Version]
- Abebe, M.T. Quantifying the influence of road geometric parameters on road safety (case study: Hawassa-Shashemene-Bulbula Rural Two-Lane Highway, Ethiopia). J. Transp. Technol. 2019, 9, 354. [Google Scholar] [CrossRef]
- Wang, C.; Zhang, W.; Wu, C.; Ding, H.; Li, Z. A short-term vehicle speed prediction approach considering dynamic traffic scene. Phys. A Stat. Mech. Its Appl. 2024, 655, 130182. [Google Scholar] [CrossRef]
- Montella, A.; Pariota, L.; Galante, F.; Imbriani, L.L.; Mauriello, F. Prediction of drivers’ speed behavior on rural motorways based on an instrumented vehicle study. Transp. Res. Rec. 2014, 2434, 52–62. [Google Scholar] [CrossRef]
- Nadimi, N.; Fathipour, H.; Sheykhfard, A. Assessing safety in horizontal curves using surrogate safety measures and machine learning. Sci. Rep. 2025, 15, 12384. [Google Scholar] [CrossRef]
Disclaimer/Publisher’s Note: The statements, opinions and data contained in all publications are solely those of the individual author(s) and contributor(s) and not of MDPI and/or the editor(s). MDPI and/or the editor(s) disclaim responsibility for any injury to people or property resulting from any ideas, methods, instructions or products referred to in the content. |
© 2025 by the authors. Licensee MDPI, Basel, Switzerland. This article is an open access article distributed under the terms and conditions of the Creative Commons Attribution (CC BY) license (https://creativecommons.org/licenses/by/4.0/).