Article

The Impact of Different Underlying Surfaces and Topography on the Wind-Sand Dynamic Environment at the Southern Edge of the Hobq Desert

1
Research Laboratory of Desert and Desertification/Dunhuang Gobi and Desert Research Station, Northwest Institute of Eco–Environment and Resources, Chinese Academy of Sciences, Lanzhou 730000, China
2
University of Chinese Academy of Sciences, Beijing 100049, China
3
Ordos Water Resources Development Center, Ordos 017200, China
*
Author to whom correspondence should be addressed.
Sustainability 2025, 17(13), 5856; https://doi.org/10.3390/su17135856
Submission received: 20 April 2025 / Revised: 5 June 2025 / Accepted: 19 June 2025 / Published: 25 June 2025

Abstract

The desert-steppe transition zone at the southern edge of the Hobq Desert features complex topography and frequent wind/sand activities. To explore the impact of different underlying surfaces and topography on the wind-sand environment in this area, field measurements were conducted to analyze the temporal and spatial variations of sand-moving wind conditions and sand drift potential. The results indicate that the average wind speed, sand-moving wind frequency, sand drift potential and sand transport rate in this area were higher in spring and winter than in summer and fall temporally. Spatially, different underlying surfaces and topographic conditions, the characteristics of the average wind speed, sand-moving wind frequency, sand drift potential and sand transport rate were as follows: quicksand surface > grassland surface > shrub surface, and top of slope > quicksand surface > middle of slope. The predominant annual wind directions and sand-moving wind directions were W, WNW and NW. The sand drift direction was towards the E or ESE in winter and spring. This study provides a theoretical basis and scientific support for the development of targeted sand control measures in the desert-steppe transition zone at the southern edge of the Hobq Desert, thereby maintaining regional ecological sustainability.

1. Introduction

Wind is one of the main influencing factors in both the positive and negative processes of desertification [1,2,3]. It serves as the basic driving force shaping the surface morphology and the direct cause of wind-sand hazards [4,5]. As an important ecological security barrier and a typical area for desertification prevention in China, the Hobq Desert has a harsh natural environment and serious wind-sand hazards. The desert is the physical source of near-surface wind-sand movement, directly threatening the survival of oases [6]. The vegetation in an oasis is easily disturbed by natural and anthropogenic disturbances [7,8], which in turn lead to increased soil desertification [4]. The interaction between wind-sand activities and vegetation is especially obvious in the desert margins, desert-steppe transition zone and grassland areas, exhibiting complex processes of wind erosion, accumulation and interaction [9,10,11]. In recent years, domestic and international scholars have conducted numerous studies on deserts, oases and desert-steppe transition zones in different regions through theoretical analyses, field observations and wind tunnel experiments, covering topics such as wind-sand flow structure [12,13], sediment particle size characteristics [14,15] and erosion processes [16,17]. These studies have provided an important theoretical basis for understanding the wind dynamic environment and sand transport mechanism in desert-steppe transition zones. The vegetation types and distribution, topography, soil properties and other factors within the desert-oasis transition zone all influence the formation of the transition zone environment, and their interactions lead to environmental heterogeneity. Relevant scholars have conducted extensive research on wind-sand activities in transition zones. Meng [18] found that wind speed, vegetation coverage and soil moisture have varying degrees of interactive influence on the mass flux in wind-sand transport. Mao [19] suggested that vegetation type, vegetation coverage and topography are the main factors affecting the characteristics of the wind field over different underlying surfaces. However, there is limited comprehensive research on the differences in wind field characteristics between different underlying surfaces and topography in the desert margin transition zone of the southern edge of the Hobq Desert. This study selected different underlying surfaces, such as quicksand surfaces, grassland surfaces and shrub surfaces, and different topographic positions like the top of slope and the middle of slope at the southern edge of the Hobq Desert. Meteorological stations were installed to monitor the data of wind speed, wind direction, and temperature and humidity. This study systematically investigated the characteristics of sand-moving wind conditions, sand drift potential and sand transport rate in this region, exploring the near-surface wind-sand environment characteristics of the desert-steppe transition zone. The aim is to deepen the understanding of the impact of the underlying surfaces and topography on the local wind-sand dynamics environments, providing a theoretical basis for differentiated wind-sand prevention and control at the southern edge of the Hobq Desert.

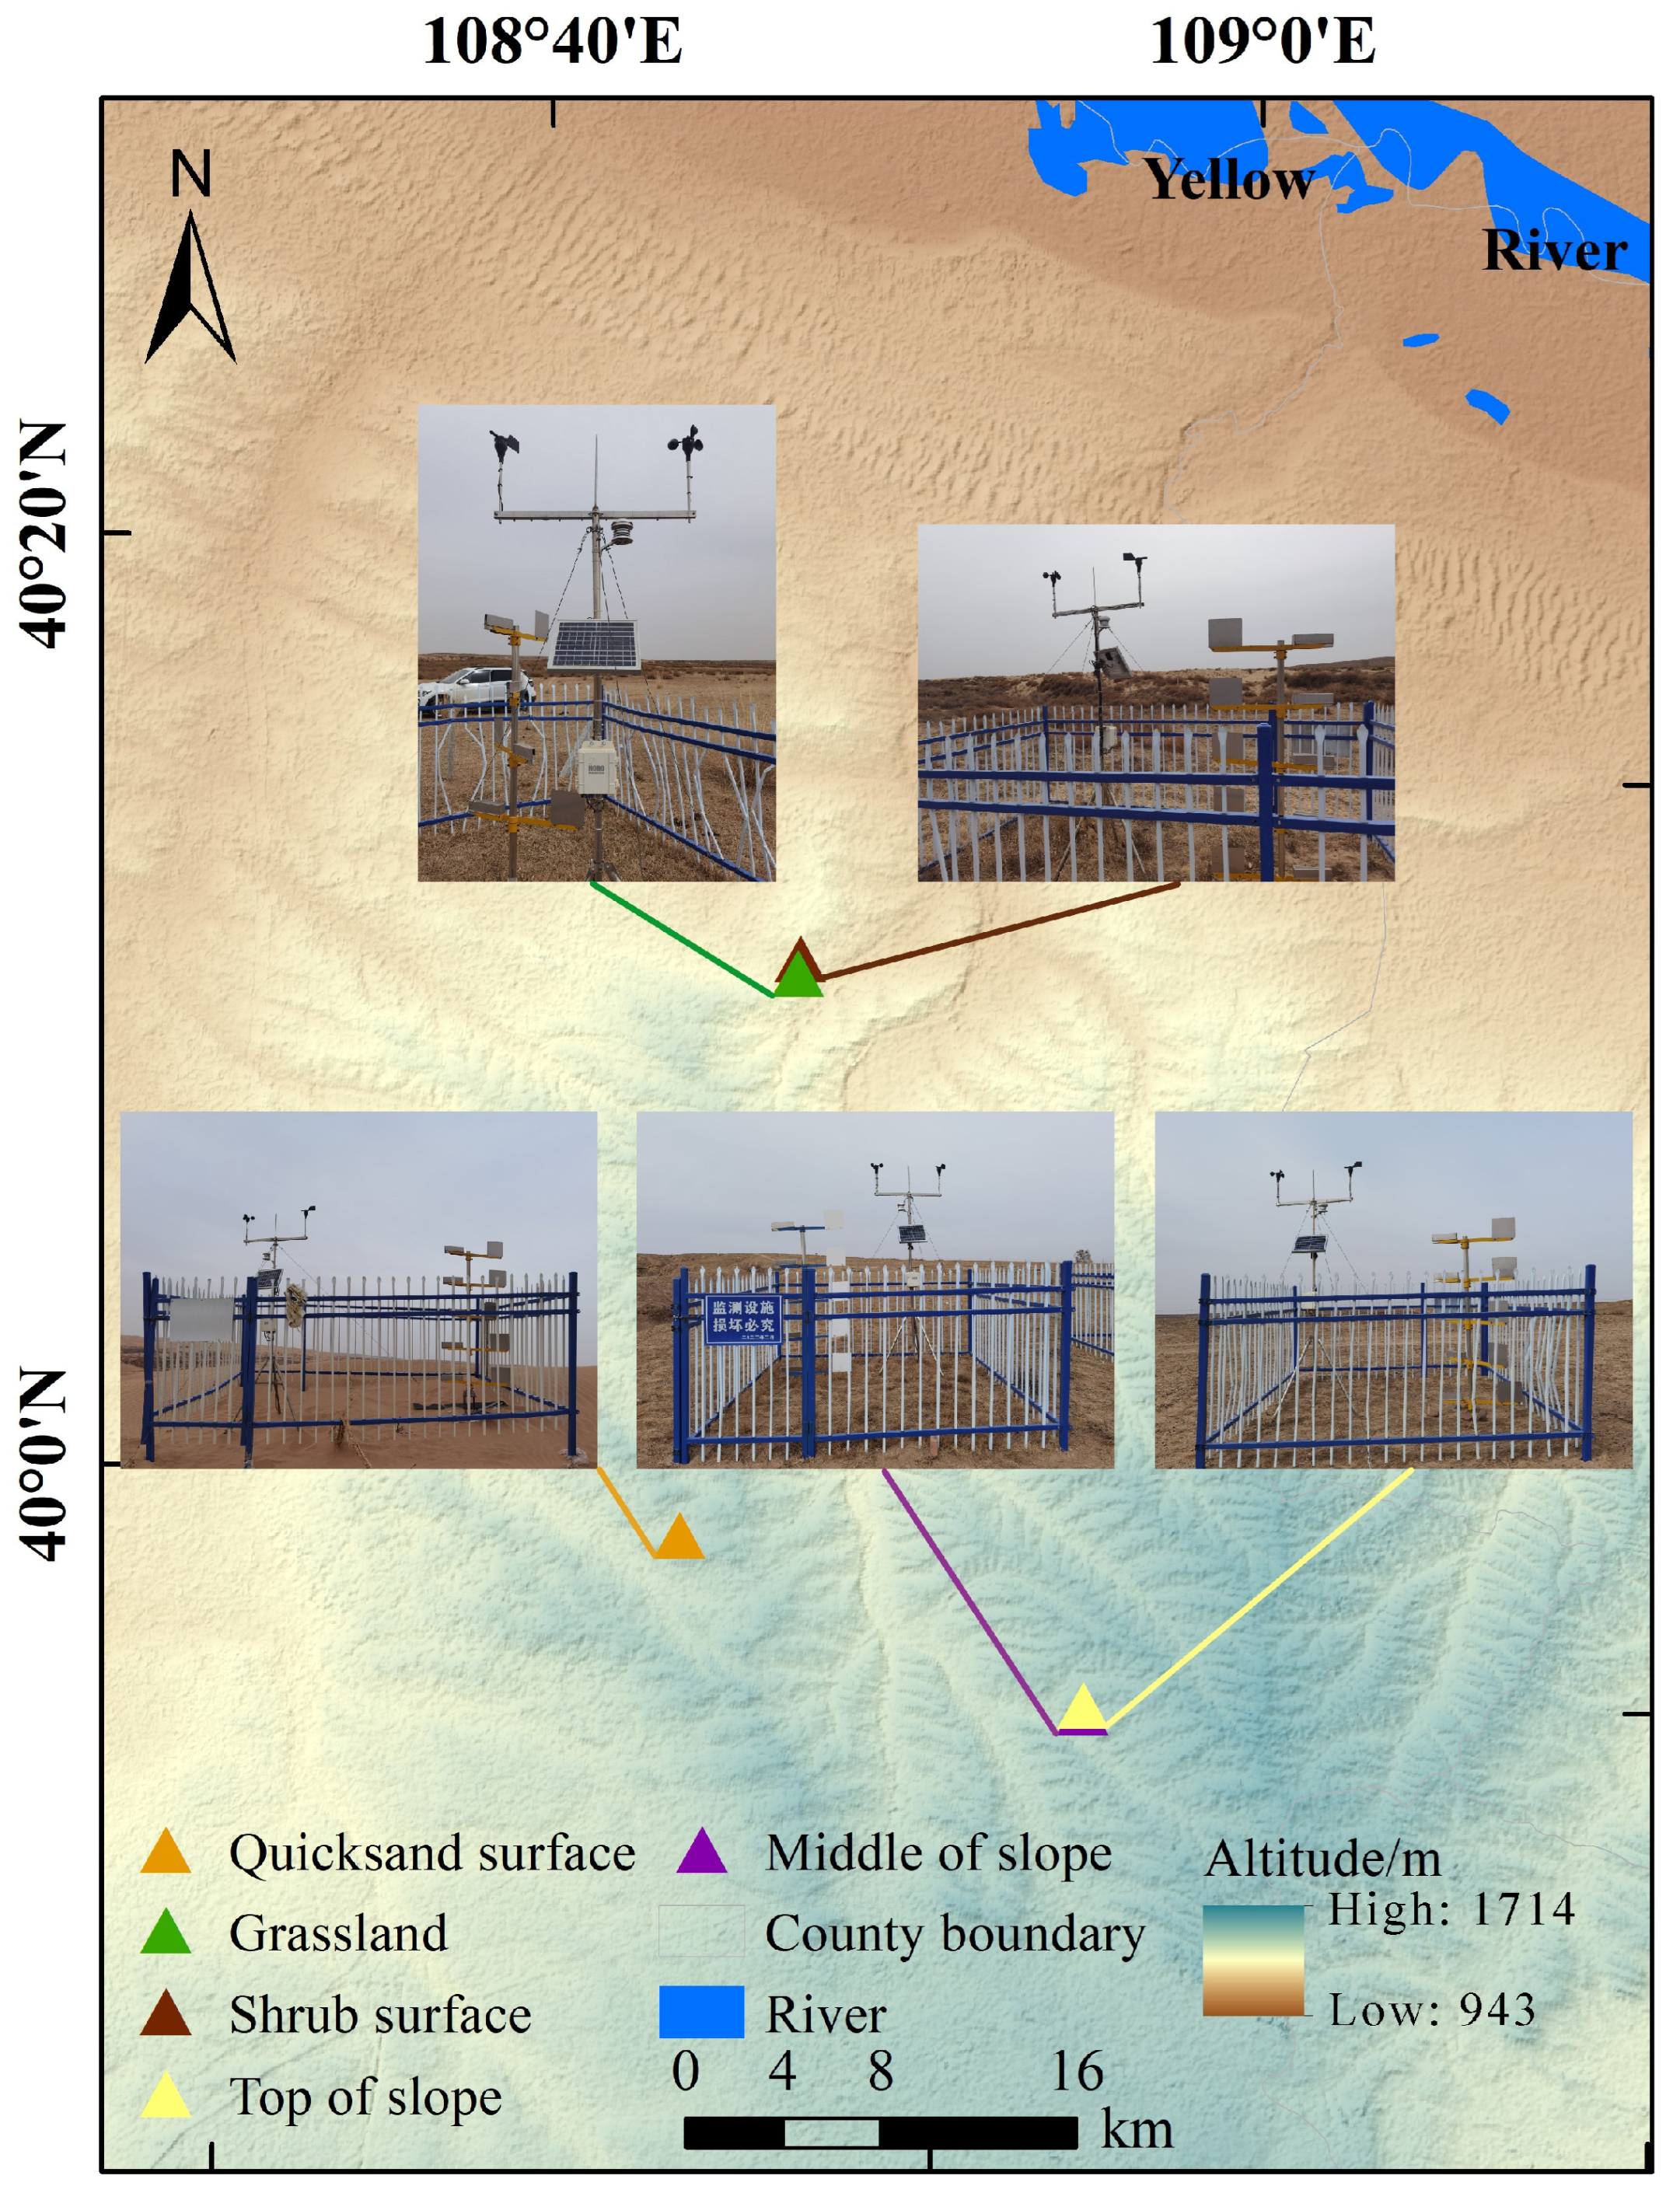
2. Overview of the Study Area

The Hobq Desert is located at the northern edge of the Ordos Plateau, adjacent to the Hetao Plain to the south, representing a typical transition zone from arid desert to semi-arid grassland. The desert is predominantly distributed in an east-west belt across Hanggin Banner, Dalate Banner, Dongsheng District and Jungar Banner, extending about 400 km with a north-south width of 15–40 km, covering a total area of 1.61 × 10⁴ km2. The study area is located at the southern edge of the Hobq Desert, within the desert-steppe transition zone, where different zonal vegetation types including desert, desert steppe and typical steppe, are distributed from west to east. Additionally, the study area also features non-zonal vegetation such as sandy-dwelling vegetation and grassland vegetation. This region experiences frequent sandstorms and wind-sand disasters in the area, with mobile sand dunes widely distributed, mainly in the forms of dune chains, grid dunes and composite dunes.

3. Data and Methods

3.1. Data Sources

The study area is connected to the Hobq Desert in the north, which is in the desert-steppe transition zone, and the main types of subsurface are quicksand, grassland, shrubs and trees. It is also in the transition zone from the Ordos Plateau to the Loess Plateau, with obvious topographic relief. Therefore, the flat quicksand surfaces in the desert-steppe transition zone were selected as a reference, while different underlying surfaces such as grassland and shrubs, as well as different topographic positions like top of slope and middle of slope, were used for comparison. Five sets of HOBO U30 meteorological observation stations were installed and calibrated in a harmonized manner (Figure 1, Table 1). The sensors were positioned at a height of 2 m above the vegetation canopy to measure wind speed, wind direction, air temperature and relative atmospheric humidity, with observations taken every 5 min.

3.2. Research Methodology

3.2.1. Statistics of Wind Conditions and Sand-Moving Wind Conditions

Using wind speed and wind direction data from field observations conducted from October 2023 to September 2024, the annual wind conditions for 16 directions were statistically analyzed. The threshold wind speed of 4.5 m·s−1 was used to count the wind speed and frequency of sand-moving winds at each observation point for each month and the entire year. The wind speed and frequency of sand-moving wind in each of the 16 directions were recorded, and the distribution characteristics were analyzed.

3.2.2. Calculation of Sand Drift Potential

The sand drift potential was calculated using the formula by Fryberger [20]. Fryberger’s formula is based on representative wind speeds and measured wind speeds, which are subject to differences in wind speed observation intervals and wind speed averaging time intervals, and the sand-moving speed varies with a variety of factors such as sand grain shape and size, surface water content and vegetation cover. The sand-moving speed varies with a variety of factors such as sand particle shape and size, surface water content and vegetation cover. In this paper, the sand-moving speed is observed and used as a standard on the surface of quicksand, so there is an error in the calculation of the sand transport potential of different subsurfaces.
DP = V2 (V − Vt) t
where DP is the sand drift potential (VU); V is the wind speed higher than the sand-moving wind (m·s−1); Vt is the sand-moving wind speed (m·s−1); and t is the time affected by the sand-moving wind (%). Statistical analysis was conducted on the occurrence frequency of wind speeds greater than the threshold wind speed in 16 directions. Additionally, the resultant sand drift potential RDP (VU) and resultant sand drift direction RDD (°) for each direction were calculated to represent the wind direction combinations and the complexity of wind.
In order to analyze the spatial differences in sand drift potential, one-way ANOVA and least significant difference (LSD) were used to test the significance of the differences in DP, RDP and so on, among the regions of each observation point and between different seasons, with the confidence level set at 95%. The above analyses were performed in IBM SPSS Statistics 23.

3.2.3. Calculation of Maximum Possible Sand Drift Quantity

According to the local actual situation and related research results [21], the following formula is used to calculate the maximum possible sand transport rate:
Q = 8.95 × 10⁻¹ (V − Vt) × T
where Q is the maximum possible sand transport rate (kg·m−1·a−1); V is the wind speed greater than the threshold wind speed (m·s−1); Vt is the threshold wind speed (m·s−1); and T is the cumulative duration of the different levels of wind speed.

4. Results and Analysis

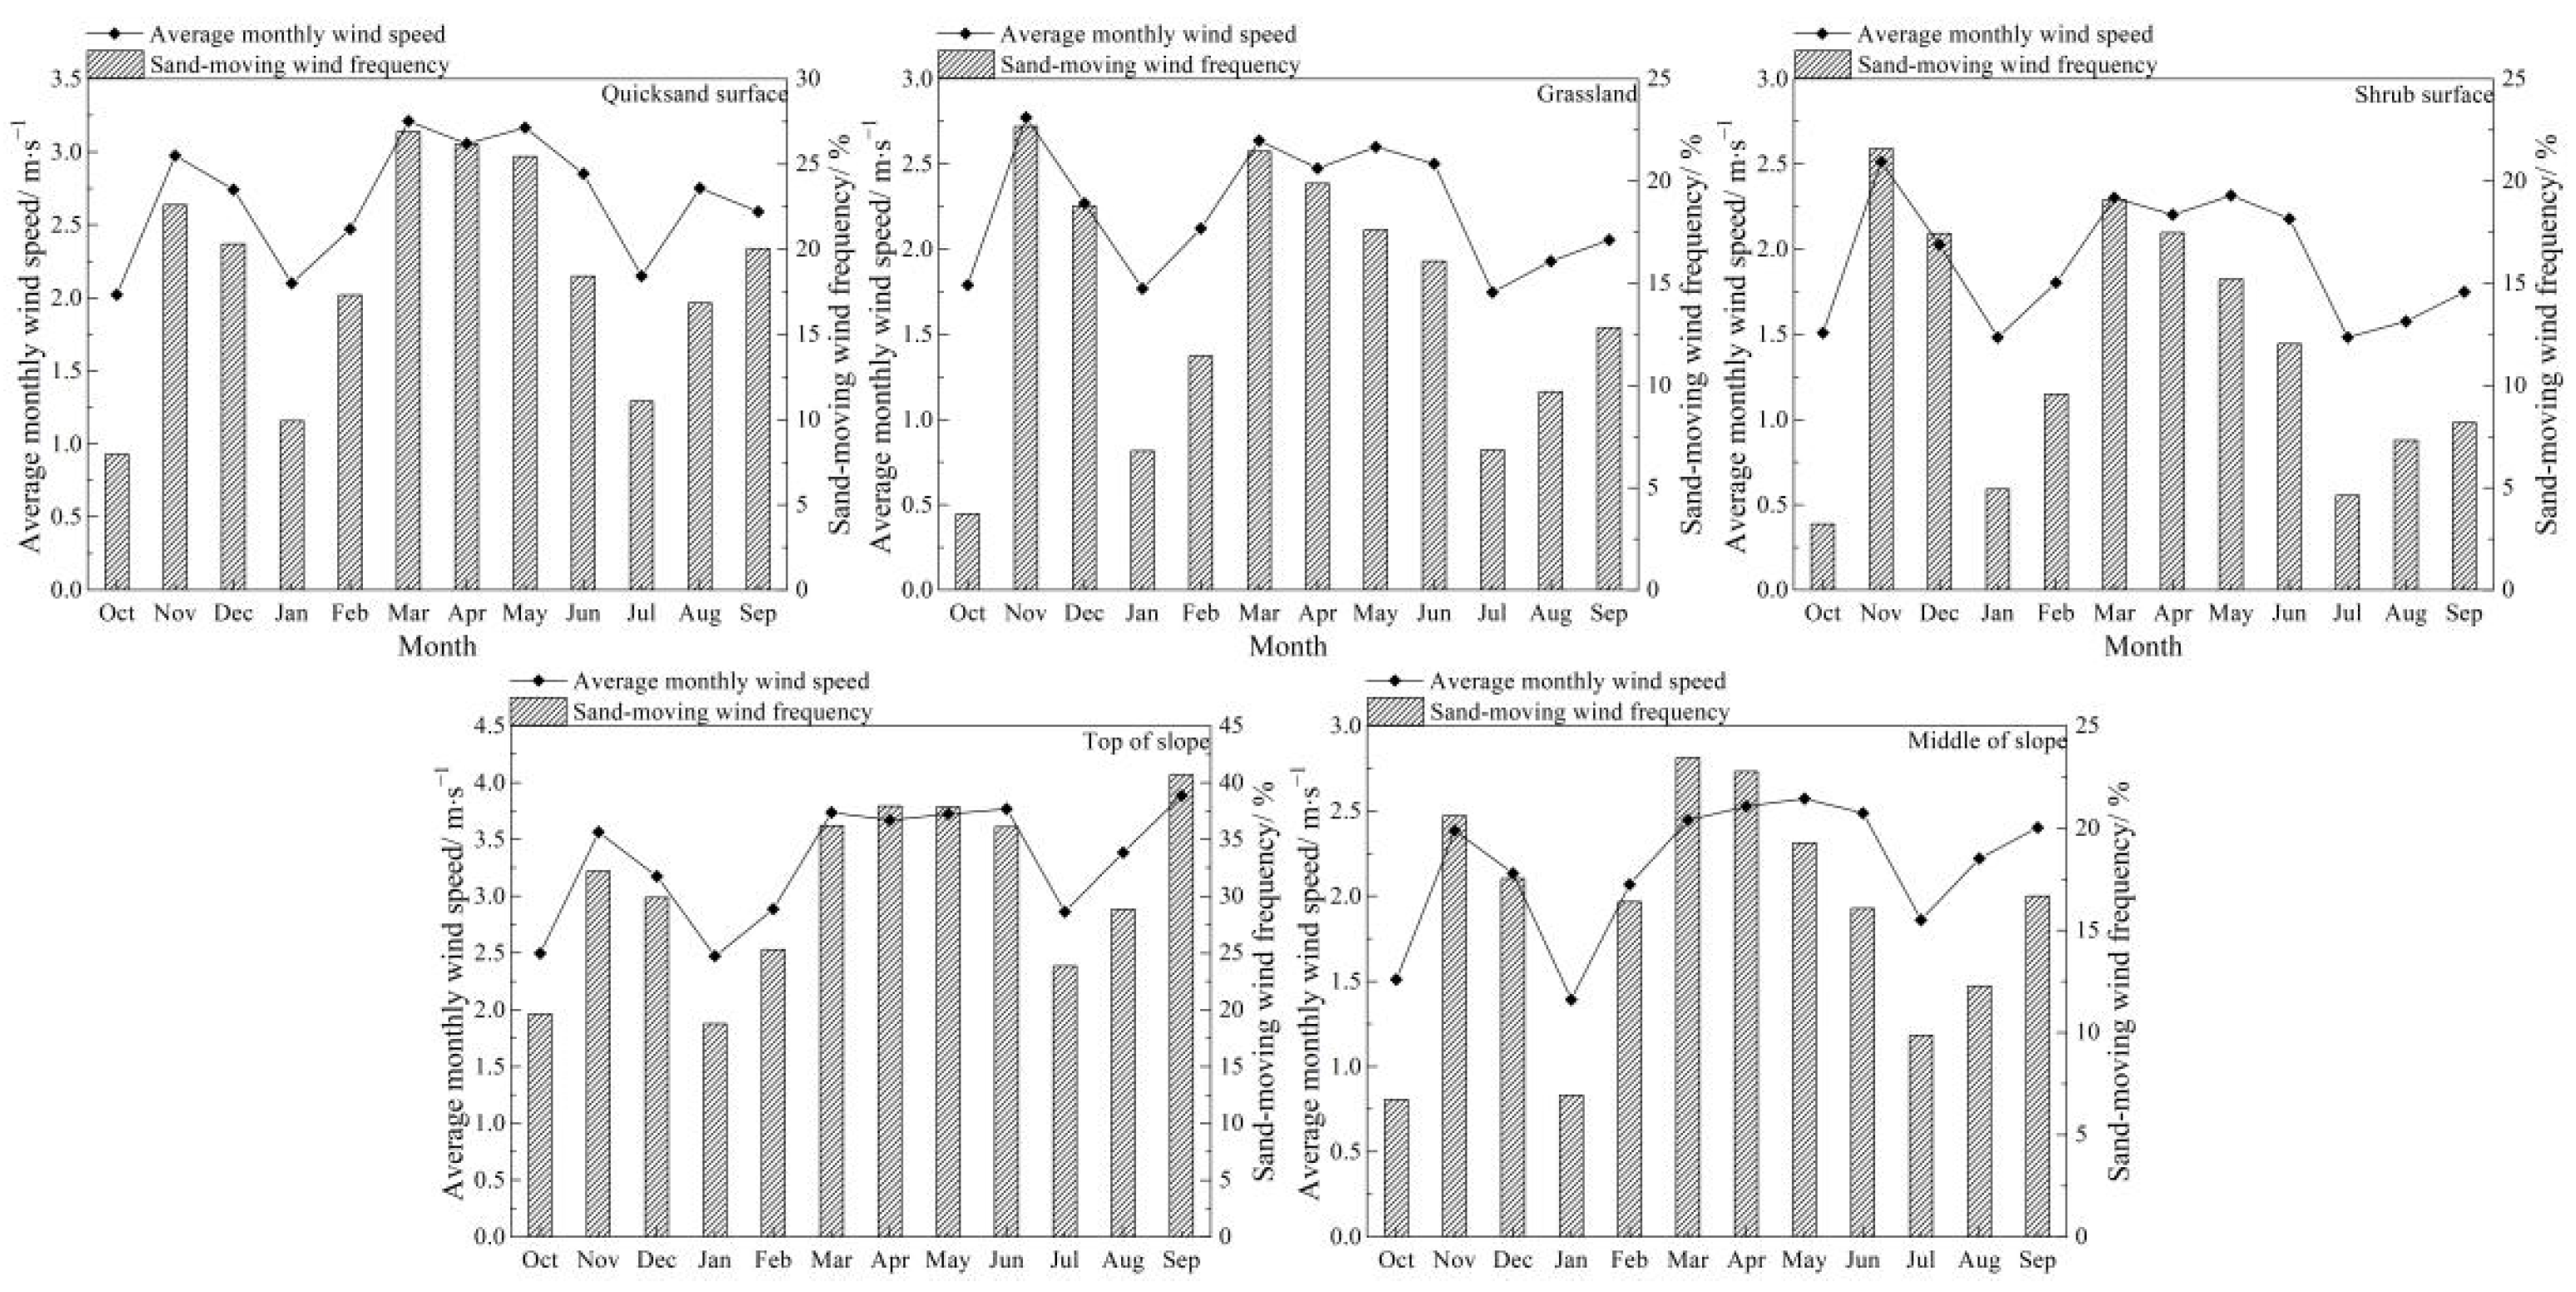
4.1. Wind Conditions and Sand-Moving Wind Conditions

From the monthly variation charts of wind conditions (Figure 2), the yearly average wind speed at the quicksand surface was 2.67 m·s−1, with a 5 min average maximum wind speed of 15.10 m·s−1. The average wind speed in March was the highest, reaching 3.21 m·s−1. The annual sand-moving wind frequency was 18.56%, with the highest frequency in March. At the grassland surface, the annual average wind speed was 2.22 m·s−1, and the maximum 5 min average wind speed was 12.58 m·s−1. The average wind speed in November was the highest, reaching 2.77 m·s−1. The yearly sand-driving wind frequency was 13.96%, with the highest frequency in November. For the shrub surface, the annual average wind speed was 1.93 m·s−1, and the 5 min average maximum wind speed was 12.58 m·s−1. The average wind speed in November was the highest, reaching 2.51 m·s−1. The yearly sand-driving wind frequency was 11.71%, with the highest frequency also in November. At the top of the slope, the annual average wind speed was 3.30 m·s−1, and the 5 min average maximum wind speed was 16.10 m·s−1. The average wind speed in September was the highest, reaching 3.89 m·s−1. The yearly sand-driving wind frequency was 30.57%, with the highest frequency in September. In the middle of the slope, the annual average wind speed was 2.17 m·s−1, and the 5 min average maximum wind speed was 13.59 m·s−1. The average wind speed in May was the highest at 2.57 m·s−1. The yearly sand-driving wind frequency was 15.68%, with the highest frequency in March. Overall, the characteristics of the annual average wind speed and the frequency of sand-moving winds indicate that the wind conditions are strongest at the quicksand surface, followed by the grassland surface and then the shrub surface. Additionally, the wind intensity is highest at the top of the slope, followed by the quicksand surface and then the middle of the slope. Low values occurred primarily in January, July and October, while the sand-moving wind frequency was higher in spring. The annual average wind speed was closely related to the annual sand-moving wind frequency. When the average wind speed was higher, the sand-moving wind frequency was also relatively high.
From the annual wind rose diagram (Figure 3), the direction of predominant wind at the quicksand surface was WNW, accounting for 9.72% of the total annual wind, followed by SSE, which accounted for 8.24% of the total. At the grassland surface, the direction of predominant wind was W, which accounted for 11.99% of the total annual wind, followed by WSW, which accounted for 9.18%. At the shrub surface, the direction of predominant wind was also W, which accounted for 11.19% of the total yearly wind, followed by WNW, which accounted for 10.22%. At the top of the slope, the direction of predominant wind was NW, accounting for 9.41% of the total annual wind, followed by S, which accounted for 8.56%. In the middle of the slope, the direction of predominant wind was WNW, which accounted for 8.62% of the total yearly wind, followed by W, which accounted for 6.73%. Overall, the main wind directions at each observation site were W, WNW and NW.
According to the annual sand-driving wind rose diagram (Figure 4), the direction of the predominant sand-moving wind at the quicksand surface was WNW, accounting for 25.66% of the total annual sand-moving wind, followed by W, which accounted for 13.47%, and S, which accounted for 10.09%. The other sand-moving wind directions rarely appeared. At the grassland surface, the direction of the predominant sand-moving wind was W, accounting for 22.63% of the total yearly sand-moving wind, followed by WNW, which accounted for 13.06%. At the shrub surface, the direction of the predominant sand-moving wind was also W, which accounted for 25.48% of the total yearly sand-moving wind, followed by WSW, which accounted for 18.08%. At the top of the slope, the direction of the predominant sand-moving wind was NW, which accounted for 16.49% of the total yearly sand-moving wind, followed by S, which accounted for 15.50%. In the middle of the slope, the direction of the predominant sand-moving wind was WNW, which accounted for 20.31% of the total yearly sand-moving wind, followed by W, which accounted for 19.23%, with sand-moving wind from other directions being rarely observed. Overall, the main sand-moving wind directions at each observation point were W, WNW and NW.

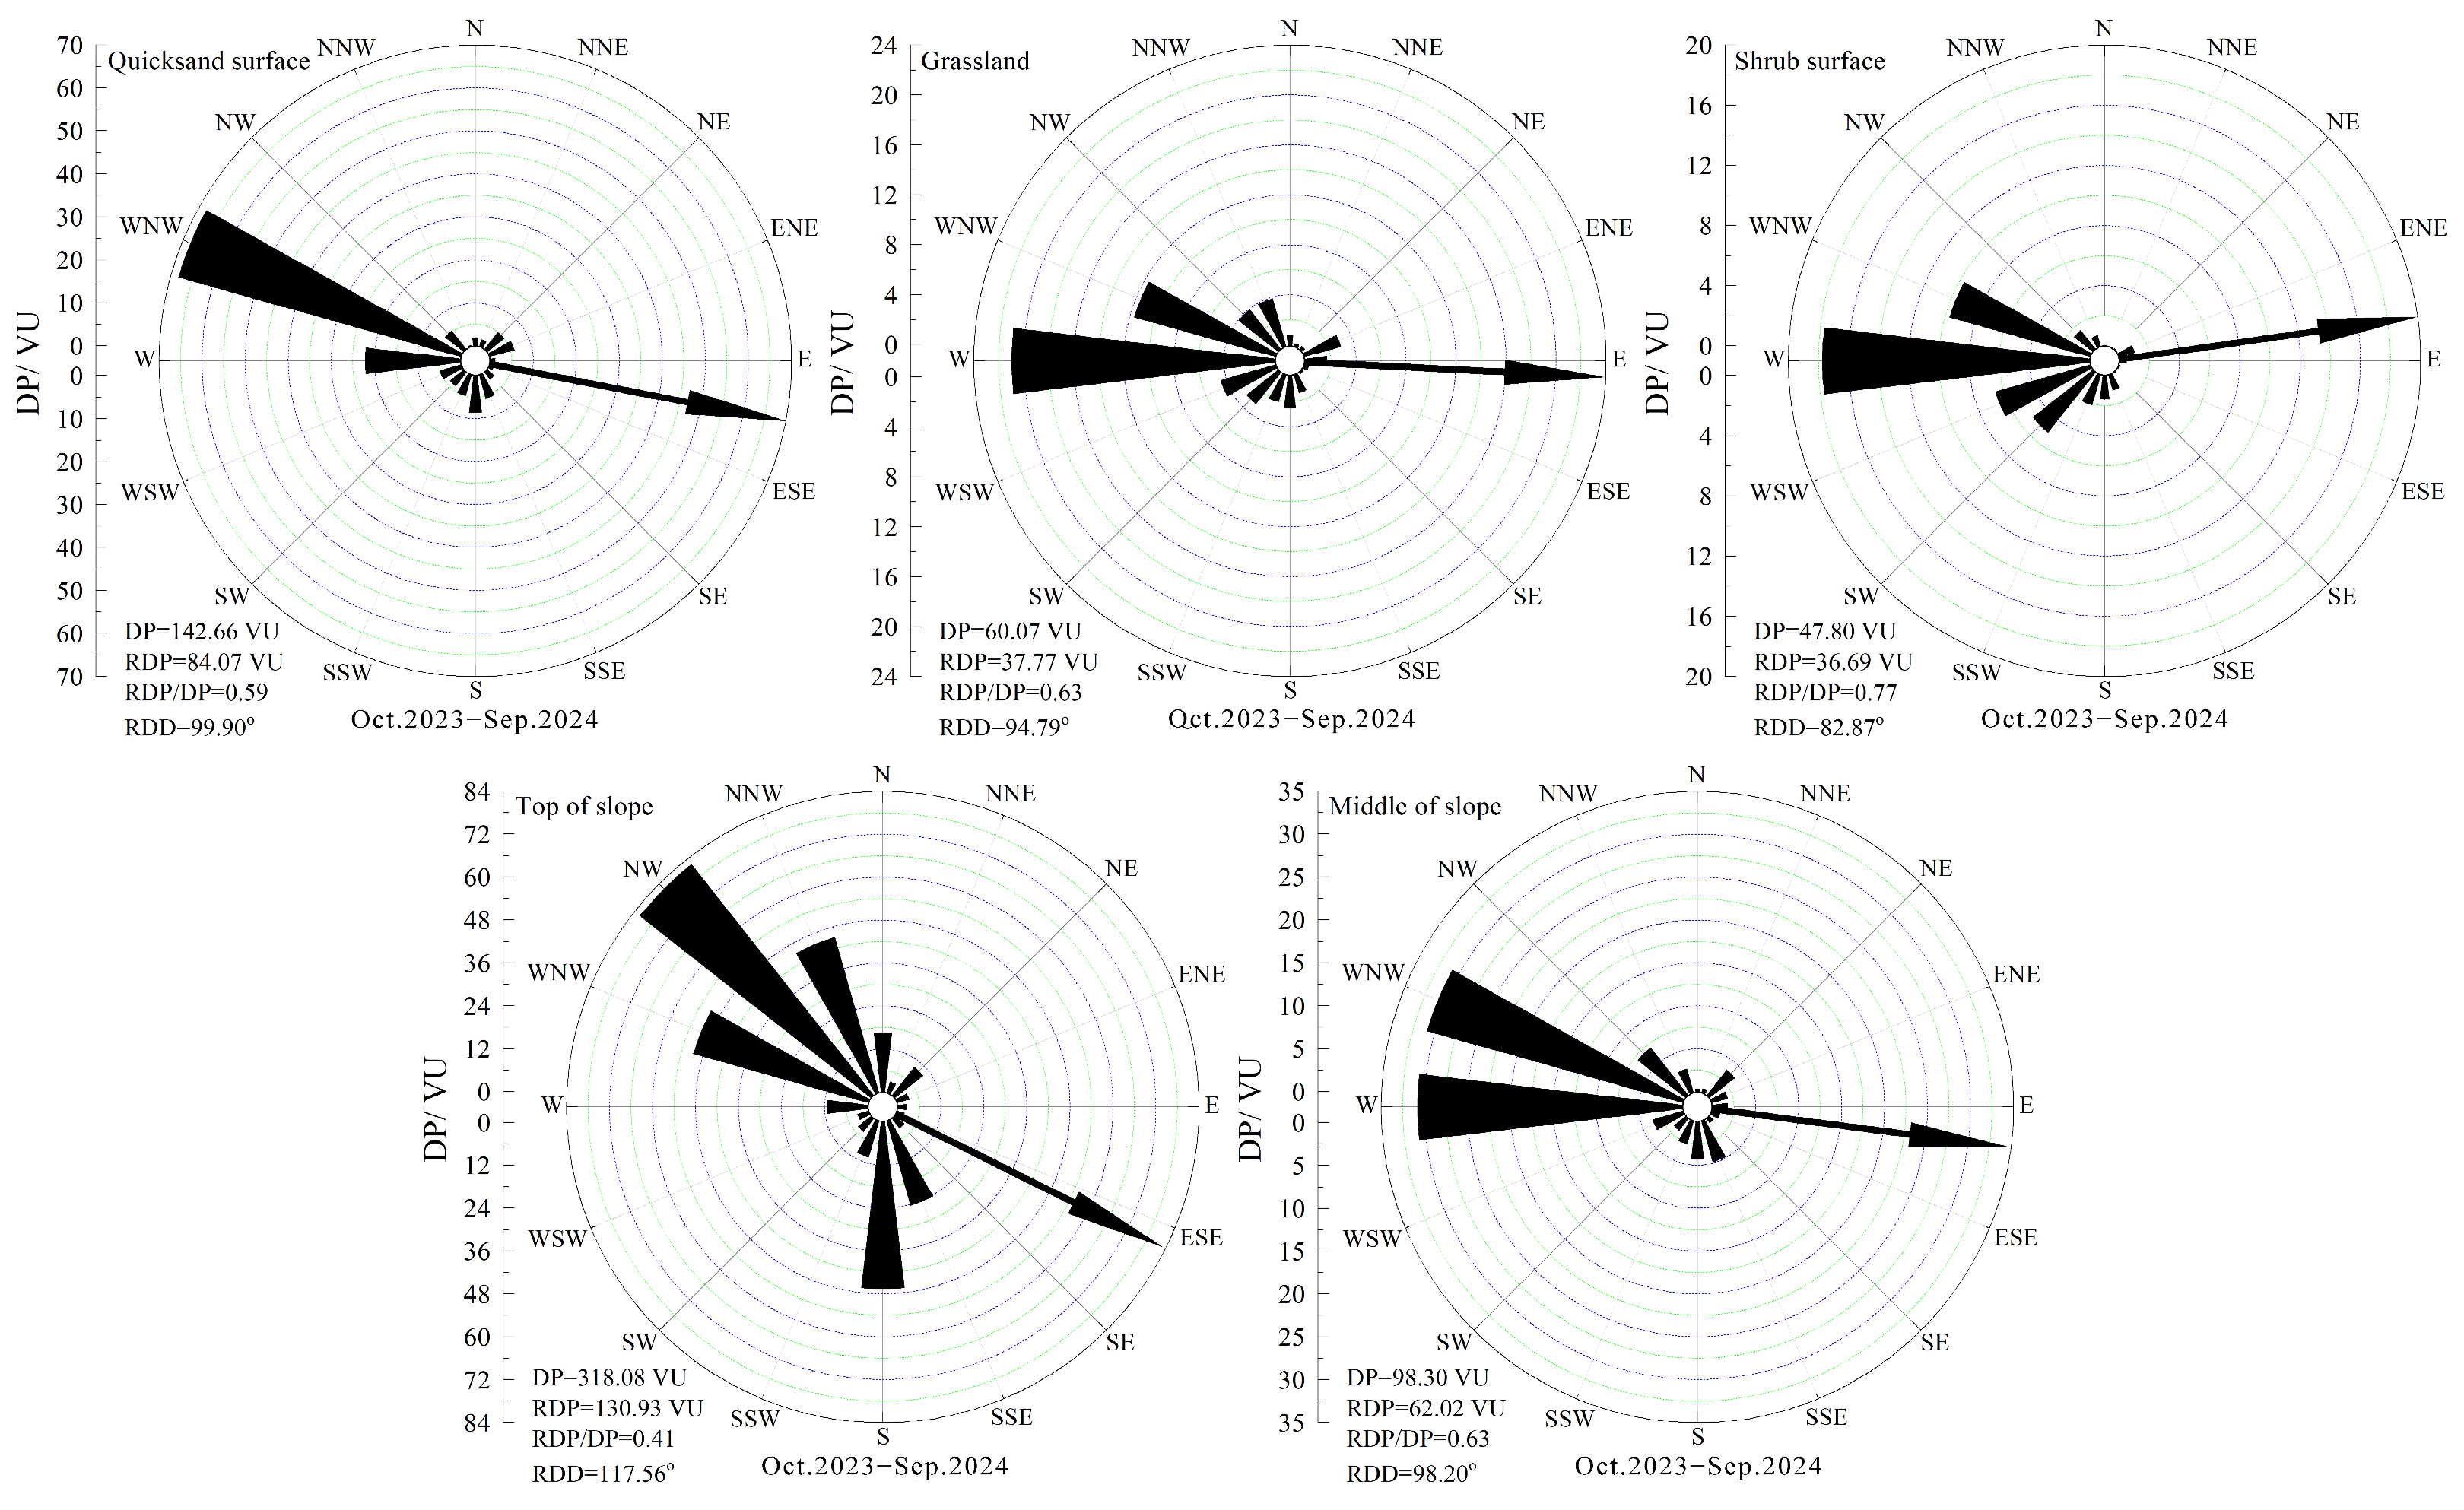
4.2. Sand Drift Potential

From the monthly data of DP, RDP, RDD and RDP/DP (Figure 5, Table 2), the quicksand surface shows that the maximum DP and RDP in winter (November) were 26.90 VU and 25.98 VU, respectively, accounting for 18.86% and 30.90% of the total for the year. Between November and April, the RDD was in the direction of E and ESE, while in summer and fall (May to October), the RDD was more dispersed. From January to October, the RDP/DP was less than 0.8, indicating a medium to low ratio, while in November and December, it was greater than 0.8, indicating a high ratio. At the grassland surface, the DP and RDP were large in November to January, with November having the maximum values of 11.66 VU and 10.69 VU, accounting for 19.41% and 28.30% of the annual total, respectively. In winter and spring, the RDD was in the E, while in summer and fall, the RDD was more dispersed. From May to September, the RDP/DP values were all less than 0.8, indicating a medium to low ratio, while from October to April, most values were greater than 0.8, indicating a high ratio. For the shrub surface, the maximum DP and RDP in winter (November) were 9.19 VU and 8.66 VU, respectively, accounting for 19.22% and 23.61% of the annual total. Between November and April, the RDD was in the E, while in summer and fall, the RDD was in the NE and ENE directions. Between June and September, the RDP/DP was less than 0.8, indicating a medium to low ratio, while from October to May, most values were greater than 0.8, indicating a high ratio. At the top of the slope, the maximum DP occurred in March, reaching 48.88 VU, accounting for 15.37% of the annual total. The maximum RDP in November was 43.14 VU, accounting for 32.95% of the annual total. In winter and spring (November to April), the RDD was in the ESE and SE directions, while in summer and fall (May to October), the RDD was more dispersed. Except for November, the RDP/DP was less than 0.8 in other months, indicating a medium to low ratio. In the middle of the slope, the maximum values in winter (November) were 18.95 VU and 18.15 VU for DP and RDP, respectively, accounting for 19.28% and 29.27% of the annual total. In winter and spring (November to April), the RDD was in the E and ESE directions, while in summer and fall (May to October), the RDD was more dispersed. From February to October, the RDP/DP was mostly less than 0.8, indicating a medium to low ratio, while from November to January, it was greater than 0.8, indicating a high ratio. Overall, the DP and RDP peak in March and November during spring and winter, with the RDP/DP indicating a high ratio, and the RDD direction was relatively consistent, mostly in the E or ESE direction. In summer and fall, the RDP/DP was primarily at a medium to low ratio, with a dispersed RDD direction and variable wind direction.
According to the annual DP rose diagram (Figure 6), the DP at the quicksand surface was 142.66 VU, indicating a low wind energy. The RDP was 84.07 VU, with an RDP/DP ratio of 0.59, and the RDD was 99.90°, indicating an E direction. At the grassland surface, the DP was 60.07 VU, also indicating a low wind energy. The RDP was 37.77 VU, with an RDP/DP ratio of 0.63, and the RDD was 99.79°, indicating an E direction. For the shrub surface, the DP was 47.80 VU, indicating a low wind energy. The RDP was 36.69 VU, with an RDP/DP ratio of 0.77, and the RDD was 82.87°, indicating an E direction. At the top of the slope, the DP was 318.08 VU, indicating a medium wind energy. The RDP was 130.93 VU, with an RDP/DP ratio of 0.41, and the RDD was 117.56°, indicating an ESE direction. In the middle of the slope, the DP was 98.30 VU, indicating a low wind energy. The RDP was 62.02 VU, with an RDP/DP ratio of 0.63, and the RDD was 98.20°, indicating an E direction. Overall, the characteristics of DP reveal that the quicksand surface experiences the highest DP, followed by the grassland surface and then the shrub surface. In terms of slope position, the top of the slope has the highest potential, followed by the quicksand surface and then the middle of the slope. The annual resultant sand drift direction is mainly in the E direction, and the annual direction variability belongs to the medium ratio, and the wind condition of sand initiation is a bimodal wind condition.

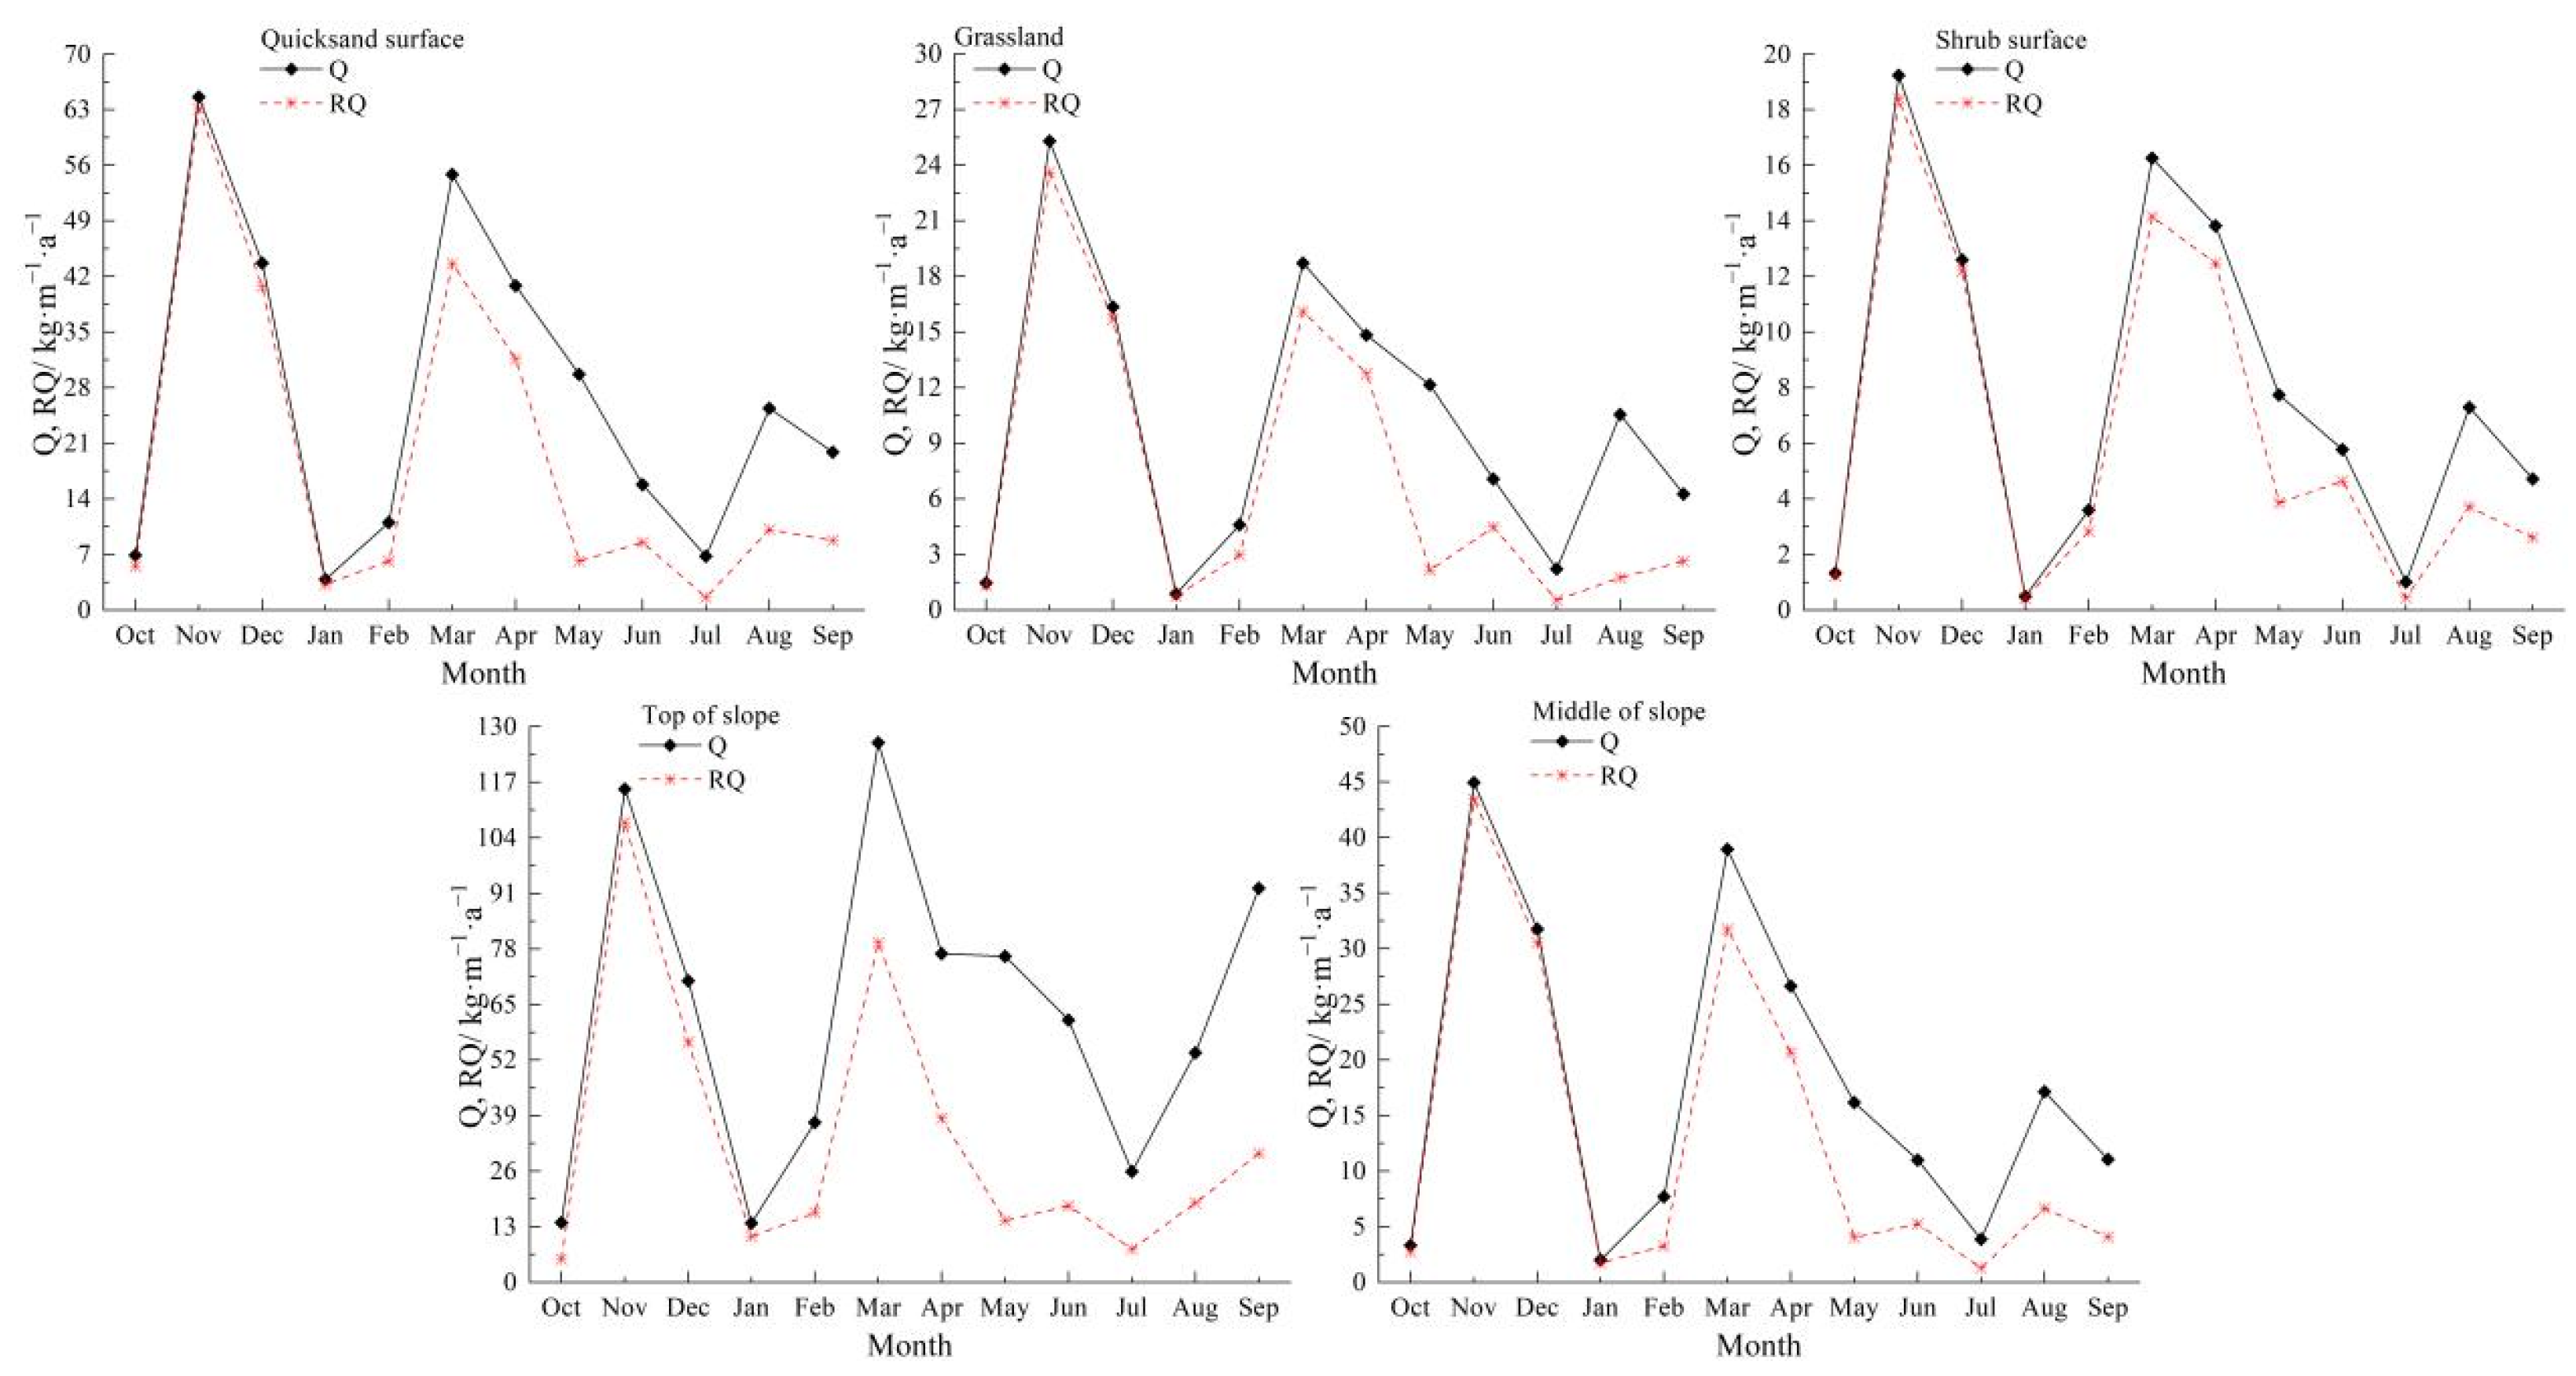
4.3. Maximum Possible Sand Transport Rate

From the annual variation in the maximum possible sand transport rate (Figure 7), the Q and RQ at the quicksand surface were highest in winter (November), reaching 64.61 and 63.12 kg·m−1·a−1, respectively, which accounted for 19.97% and 31.04% of the annual total. In winter and spring (November to April), the RA was in the ESE and E directions, while in summer and fall, the RA was in the ENE and SE directions. At the grassland surface, the Q and RQ were also highest in winter (November), reaching 25.31 and 23.61 kg·m−1·a−1, respectively, which accounted for 21.02% and 30.11% of the annual total. In winter and spring, the RA was in the E, while in summer and fall, the RA was more dispersed. For the shrub surface, the Q and RQ were the highest in winter (November), reaching 19.24 and 18.39 kg·m−1·a−1, respectively, contributing 20.49% and 24.74% of the annual total. In winter and spring (November to April), the RA was in the direction of E and ENE, while in summer and fall, the RA was in the ENE, NE and E directions. At the top of the slope, the maximum Q occurred in March, reaching 126.22 kg·m−1·a−1, which accounted for 16.53% of the annual total. The maximum RQ was 107.60 kg·m−1·a−1 in November, which accounted for 32.03% of the annual total. In winter and spring, the RA was in the ESE and SE, while in summer and fall, the RA was more dispersed. In the middle of the slope, the maximum Q and RQ occurred in winter (November), reaching 44.94 and 43.42 kg·m−1·a−1, respectively, which accounted for 20.93% and 30.21% of the annual total. In winter and spring (November to April), the RA was in the direction of E and ESE, while the RA in summer and fall (May-October) was more dispersed. Overall, both the Q and RQ were higher in March and November, and lower in January and July. The RA was in the E or ESE direction in winter and spring, while it was more dispersed in summer and fall.
According to the yearly rose diagram of the Q (Figure 8), the annual Q at the quicksand surface was 323.53 kg·m−1·a−1, with an annual RQ of 203.36 kg·m−1·a−1. The RA was 101.94°, indicating an ESE direction. At the grassland surface, the annual mQ was 120.38 kg·m−1·a−1, with an annual RQ of 78.43 kg·m−1·a−1. The RA was 96.94°, indicating an E direction. For the shrub surface, the yearly Q was 93.93 kg·m−1·a−1, with an annual RQ of 74.35 kg·m−1·a−1. The annual RA was 85.39°, indicating an E direction. At the top of the slope, the annual Q was 763.80 kg·m−1·a−1, with a yearly RQ of 335.90 kg·m−1·a−1. The RA was 119.23°, indicating an ESE direction. In the middle of the slope, the yearly Q was 214.69 kg·m−1·a−1, with a yearly RQ of 143.74 kg·m−1·a−1. The yearly RA was 99.21°, indicating an E direction. Overall, the Q follows this order: the quicksand surface has the highest, followed by the grassland surface and then the shrub surface. Regarding the slope position, the Q is greatest at the top of the slope, followed by the quicksand surface and then the middle of the slope. The annual resultant maximum possible sand drift directions were primarily in the E and ESE directions.

5. Discussion

The sand-driving wind frequency at each observation position showed a significant correlation with the average wind speed. The sand-moving wind frequency and the average wind speed in spring were significantly higher than in other seasons, indicating that the wind-sand activities in the study area are most frequent and active during this period. The main reason is that the upper-level low-pressure trough moves rapidly eastward in spring, causing the position of the pressure activity center to be unstable. The passage of the sea-level cold front and the intense development of the Mongolian cyclone form a gradient wind [22]. Additionally, the fact that evaporation is much higher than precipitation in spring results in a dry and loose surface. In addition, the vegetation is still in the early stage of greening in spring, and the coverage is low, which makes the loose surface more susceptible to wind erosion under strong winds. The variations in wind conditions, DP and Q in the study area show obvious seasonality, specifically, the wind speed and sand transport rates are higher in winter and spring, while the sand transport rate in summer and fall is obviously lower than that in winter and spring. This aligns with findings from the northern foothills of Yinshan Desert, Ulanbuh Desert and Horqin Sandy Land [23,24,25]. The lower DP and Q in January and July were mainly due to the lower average wind speed and lower sand-moving wind frequency in January and July, which limited sand movement. In addition, lower temperatures in winter, surface condensation and soil moisture make the surface soil frozen, thus significantly reducing the erodible sand sources [24].
As shown in Figure 9, during summer, higher temperatures lead to lower air density, reducing the drag force on sand particles. The higher relative humidity and increased surface moisture enhance soil stability, making it more difficult for sand particles to be lifted [26,27], further reducing the frequency of wind-sand activities. With the increase in summer rainfall, soil water content rises, and vegetation cover also increases. In contrast, the wind-sand prevention is weaker in winter and spring. Vegetation reduces soil wind erosion by directly covering the surface, absorbing air movement, intercepting and blocking saltation particles, and adsorbing fine particles [28,29]. Moreover, influenced by the vegetation coverage and surface roughness of the desert-steppe transition zone, the near-surface wind exhibited a spatial variation characteristic of gradually decreasing wind speed and sand-driving wind frequency across the quicksand, grassland and shrub surfaces [30]. Research on the wind energy environment in desert-oasis transition zones has found that vegetation characteristics are also a major factor influencing sand transport characteristics. High vegetation coverage and healthy growth increase surface roughness, which effectively reduces near-surface wind speed [10]. Due to topographic factors, the average wind speed, sand-moving wind frequency, DP and Q at the top of the slope were higher than those at the quicksand surface and in the middle of the slope. At the top of the slope, where there is a lack of topographical barriers, wind speed is higher, leading to enhanced sand transport capacity. When the slope is steeper, wind and sand flow quickly along the slope, making it difficult for sand particles to settle.
The distribution trends of sand-moving wind and DP are generally consistent, with the study area mainly being influenced by sand-moving wind from W and WNW directions, and the RDD being E and ESE. This provides dynamic conditions for the formation of parabolic dunes oriented in the W-E and WNW-ESE directions in the study area [31]. The sand material generally moves towards the west, with the greatest sand transport occurring in the winter and spring. This is related to the geographic location of the study area. The northern part of the study area borders the Hobq Desert, which provides abundant sand sources, making it easier for drifting sand to invade the transition zone. In winter and spring, it is crucial to strengthen the wind and sand prevention systems at the eastern and northern edges. The orientation of sand control engineering measures should be perpendicular to the prevailing wind direction to effectively block the intrusion of wind and sand. Existing sand control measures should be supplemented with the planting of artificial vegetation to increase vegetation coverage and enhance the protective function of the desert-oasis transition zone.
The vegetation coverage, topography, soil moisture content and other factors of the underlying surface jointly influence the intensity of wind and sand activities. Therefore, in the study of wind and sand environments in desert-oasis transition zones, it is necessary to specifically investigate the impact of each factor on the surface wind and sand activity patterns, explore the interactions and degree of influence of these factors on wind and sand activities, and provide theoretical support and practical guidance for the restoration and protection of ecosystems in desert-oasis transition zones.

6. Conclusions

The average wind speed, sand-moving wind frequency, DP and Q in the study area were higher in spring and winter than in summer and fall. Spatially, under different underlying surfaces and topographic conditions, the characteristics of the average wind speed, sand-moving wind frequency, DP and Q are as follows: quicksand surface > grassland > shrub surface, and top of slope > quicksand surface > middle of slope. The predominant annual wind directions were W, WNW and NW. DP, RDD, Q and RQ were all higher in March and November and lower in January and July, and the RDD was in the E or ESE in winter and spring, and was more scattered in summer and fall.

Author Contributions

Conceptualization, X.Y.; methodology, S.X.; validation, X.Z.; formal analysis, X.Z.; investigation, X.Y.; resources, D.Z., Y.L. and R.X.; data curation, D.Z., Y.L. and R.X.; writing—original draft preparation, X.Z.; writing—review and editing, S.X. All authors have read and agreed to the published version of the manuscript.

Funding

This research project was supported by the Ordos Science and Technology Plan (grant no. 2021EEDSCXQDFZ013).

Institutional Review Board Statement

Not applicable.

Informed Consent Statement

Not applicable.

Data Availability Statement

Data is contained within the article.

Conflicts of Interest

The authors declare no conflict of interest.

References

  1. Hua, T.; Wang, X.M. Research Progresses on the Interaction between Desertification and Climate Change in Arid and Semiarid East Asia. Prog. Geogr. 2014, 33, 841–852. [Google Scholar]
  2. Guan, C.; Hasi, E.; An, J.; Tao, B.B.; Liu, D.; Zhou, Y.G. Spacial Variation of Transverse Dunes Landform Pattern in the North of Hobq Desert. J. Beijing Norm. Univ. (Nat. Sci.) 2015, 51 (Suppl. S1), 13–22. [Google Scholar]
  3. Zhang, Z.C.; Dong, Z.B. Field Observation on the Flow Turbulence Characteristics Over Transverse Dune. Geogr. Sci. 2015, 35, 652–657. [Google Scholar]
  4. Liu, X.W. Experimental Wind and Sand Physics and Wind-Sand Engineering; Science Press: Beijing, China, 1995; pp. 1–20. [Google Scholar]
  5. Tian, Q.M.; Ma, T.D.; Liu, X.Y.; Yue, P. Analysis on the Upper-air Temperature, Humidity, Wind Speed and Heat Stability during a Sandstorm. Arid Zone Res. 2008, 05, 700–704. [Google Scholar]
  6. Wang, C.; Lei, J.Q.; Li, S.Y.; Mao, D.L.; Zayulla, R. Vertical Differentiation of Sand Granularity in Wind-sand Flow in the Celle Oasis-desert Transition Zone. Arid Land Geogr. 2014, 37, 230–238. [Google Scholar] [CrossRef]
  7. Haq, M.A.; Khan, M.Y.A. Crop Water Requirements with Changing Climate in an Arid Region of Saudi Arabia. Sustainability 2022, 14, 13554. [Google Scholar] [CrossRef]
  8. Haq, M.A. Intellligent sustainable agricultural water practice using multi sensor spatiotemporal evolution. Environ. Technol. 2024, 45, 2285–2298. [Google Scholar] [CrossRef]
  9. Yang, D.L.; Wang, X.Q.; Hu, Y.F. Some Problems in Wind Data Analyzing in Oasis-desert Ecotone: A Case of Qira Oasis. Arid Land Geogr. 2015, 38, 549–555. [Google Scholar]
  10. Xing, W.J.; Lei, J.Q.; Wang, H.F.; Li, S.Y.; Jin, Z.Z.; Zeng, F.J. Analysis on Wind Regime and Wind Borne Sand Potential in a Desert-oasis Ecotone—A Case Study in Qira County, Xinjiang. Arid Zone Res. 2008, 25, 894–898. [Google Scholar]
  11. Liu, F.; Hao, Y.G.; Xu, J.; Xing, Z.M.; Chen, H.L.; Zhao, Y.M. Sand Flow Characteristics in Ulan Buh Desert. Arid Land Geogr. 2014, 37, 1163–1169. [Google Scholar]
  12. Yan, M.; Chen, Y.X.; Zuo, H.J.; Wang, H.B.; Xi, C. Redistribution Characteristics of Aeolian Sand Flow on Different Underlying Surfaces at the Edge of Hobq Desert and their Enrichment Effect on Nutrients. Arid Land Geogr. 2023, 46, 889–899. [Google Scholar]
  13. Wu, W.Y.; Zhang, D.S.; Tian, L.H.; Zhang, H. Aeolian Activities and Protective Effects of Artificial Plants in Re-vegetated Sandy Land of Qinghai Lake, China. Chin. Geogr. Sci. 2020, 30, 1129–1142. [Google Scholar] [CrossRef]
  14. Tan, L.H.; Zhang, K.; Wang, H.T.; An, Z.; Wang, T. Vertical Sand Flux Density and Grain-Size Distributions for Wind-Blown Sand Over a Gobi Surface in Milan, Southern Xinjiang, China. Front. Environ. Sci. 2022, 10, 859631. [Google Scholar] [CrossRef]
  15. Jiang, N.; Cheng, H. Regional Differences in the Grain Size Characteristics of Surface Sediments from Typical Barchan Dunes in Arid Zones. Aeolian Res. 2024, 70–71, 100939. [Google Scholar] [CrossRef]
  16. Tan, L.H.; Zhang, W.M.; Bian, K.; Yang, G.; Zhong, S. Effect of Gravel Mulch on Soil and Water Conversation—A Case Study in the Northern Edge of Hobq Desert. Res. Soil Water Conserv. 2017, 24, 172–178. [Google Scholar]
  17. Zhang, H.B.; Gao, Y.; Sun, D.F.; Liu, L.; Cui, Y.; Zhu, W. Wind Erosion Changes in a Semi-Arid Sandy Area, Inner Mongolia, China. Sustainability 2019, 11, 188. [Google Scholar] [CrossRef]
  18. Meng, Z.J.; Dang, X.H.; Gao, Y.; Ren, X.; Ding, Y.; Wang, M. Interactive effects of wind speed, vegetation coverage and soil moisture in controlling wind erosion in a temperate desert steppe, Inner Mongolia of China. J. Arid Land 2018, 10, 534–547. [Google Scholar] [CrossRef]
  19. Mao, D.L.; Cai, F.Y.; Yang, X.F.; Wang, X.M.; Lai, F.B.; Xue, J. Characteristics of Wind Filed over Different Underlying Surfaces in the Oasis-Desert Ecotone in Qira, Xinjiang. Arid Zone Res. 2019, 36, 1117–1126. [Google Scholar]
  20. Fryberger, S.G.; Dean, G. Dune forms and wind regime. In A Study of Global sand Seas; Mckee, E.D., Ed.; United States Government Printing Office: Washington, DC, USA, 1979; pp. 137–169. [Google Scholar]
  21. Lin, Y.Q. Engineering Calculation of Maximum Possible Sand-transporting Quantity. J. Desert Res. 1997, 17, 362. [Google Scholar]
  22. Chen, Y.; Shang, K.Z.; Wang, S.G.; Li, Y.; Xiong, G. Characteristics of Sand-dust Weather and the Relationship between Land Surface Conditions and Sand-dust Weather in Semiarid Region of Inner Mongolia, China. J. Desert Res. 2013, 33, 1131–1137. [Google Scholar]
  23. Liu, T.; Yang, X.P.; Dong, J.F.; Fan, X.Y.; Li, H.W.; Zhu, B.Q. A Preliminary Study of Relation Between Megadune Shape and Wind Regime in the Badain Jaran Desert. J. Desert Res. 2010, 30, 1285–1291. [Google Scholar]
  24. Miao, H.L.; Wang, J.; Zhang, R.Q.; Li, J.R.; Gao, T.M. Characteristics of Wind Regime and Drift Potential of the Desert Steppe in Northern Slope of Yinshan Mountains, Inner Mongolia. J. Arid Land Resour. Environ. 2022, 36, 102–110. [Google Scholar]
  25. Dang, X.H.; Wei, Y.J.; Meng, Z.J.; Han, Y.L. Characteristics of Dustfall on Different Underlying Surfaces in the Northeast UlanBuhe Desert. J. Basic Sci. Eng. 2020, 28, 1122–1133. [Google Scholar]
  26. Chen, W.N.; Dong, Z.B.; Li, Z.S.; Yang, Z. Wind Tunnel Test of the Influence of Moisture on the Erodibility of Loessial Sandy Loam Soils by Wind. J. Arid Environ. 1996, 34, 391–402. [Google Scholar] [CrossRef]
  27. Kong, K.; Nandintsetseg, B.; Shinoda, M.; Ishizuka, M.; Kurosaki, Y.; Bat-Oyun, T.; Gantsetseg, B. Seasonal Variations in Threshold Wind Speed for Saltation Depending on Soil Temperature and Vegetation: A Case Study in the Gobi Desert. Aeolian Res. 2021, 52, 100716. [Google Scholar] [CrossRef]
  28. Zou, X.Y.; Zhang, C.L.; Cheng, H.; Kang, L.; Wu, X.; Chang, C.; Wang, Z.; Zhang, F.; Li, J.; Liu, C.; et al. Classification and Representation of Factors Affecting Soil Wind Erosion in A Model. Adv. Earth Sci. 2014, 29, 875–889. [Google Scholar]
  29. Wolfe, S.A.; Nickling, W.G. The protective role of sparse vegetation in wind erosion. Prog. Phys. Geogr. Earth Environ. 1993, 17, 50–68. [Google Scholar] [CrossRef]
  30. Zhang, K.C.; An, Z.S.; Cai, D.W.; Guo, Z.C.; Wang, J.Z. Spatial Variation of Wind Dynamical Characteristics in the Desert-oasis Transitional Zone under Typical Weather Conditions. Arid. Land Geogr. 2016, 39, 1004–1010. [Google Scholar]
  31. Tao, B.B.; Hasi, E.; Wugetemole; Guan, C. Variation of Surface Wind Velocity and Sand Transport of Parabolic Dune at Southern Fringe of the Hobq Desert. J. Desert Res. 2015, 35, 1445–1452. [Google Scholar]
Figure 1. Location of the study area and views of the observation sites.
Sustainability 17 05856 g001
Figure 2. Monthly variation in wind speed at various observation positions.
Sustainability 17 05856 g002
Figure 3. The rose diagram of annual wind at various observation positions.
Sustainability 17 05856 g003
Figure 4. The rose diagram of annual sand-moving wind at various observation positions.
Sustainability 17 05856 g004
Figure 5. Monthly variation in DP at various observation positions.
Sustainability 17 05856 g005
Figure 6. The rose diagram of annual DP at various observation positions.
Sustainability 17 05856 g006
Figure 7. Monthly variation in Q at various observation positions.
Sustainability 17 05856 g007
Figure 8. The annual rose diagram of Q at various observation positions.
Sustainability 17 05856 g008
Figure 9. Temperature and relative humidity at various observation positions.
Sustainability 17 05856 g009aSustainability 17 05856 g009b
Table 1. Overview of the five field observation sites at the edge of the Hobq Desert.
Observation LocationVegetation, Topographic FeaturesThree-Dimensional CoordinatesObservation ElementsObservation Time
Quicksand SurfaceCanopy Cover, Quicksand Area, Flat Terrain40°0′31″ N, 108°50′12″ E,
Altitude: 1435 m
Wind Speed and Direction, Sand Transport Rate, Temperature, Humidity and Pressure1 October 2023
–30 September 2024
GrasslandGrassland, Stabilized Sand Area, Flat Terrain40°13′01″ N, 108°50′57″ E,
Altitude: 1247 m
Wind Speed and Direction, Sand Transport Rate, Temperature, Humidity and Pressure1 October 2023
–30 September 2024
Shrub SurfaceLow Shrubs, Stabilized Sand Area, Flat Terrain40°13′20″ N, 108°50′57″ E,
Altitude: 1257 m
Wind Speed and Direction, Sand Transport Rate, Temperature, Humidity and Pressure1 October 2023
–30 September 2024
Top of SlopeGrassland, Stabilized Sand Area39°58′15″ N, 109°02′14″ E,
Altitude: 1489 m
Wind Speed and Direction, Sand Transport Rate, Temperature, Humidity and Pressure1 October 2023
–30 September 2024
Middle of SlopeGrassland, Stabilized Sand Area, Relatively Large Topographic Variations 39°58′07″ N, 109°02′15″ E,
Altitude: 1461 m
Wind Speed and Direction, Sand Transport Rate, Temperature, Humidity and Pressure1 October 2023
–30 September 2024
Table 2. Monthly variation in RDD at various observation positions.
Observation LocationParameterJanFebMarAprMayJunJulAugSepOctNovDec
Quicksand surfaceRDD (°)99.0865.6999.9895.05268.0960.64325.00123.4422.7097.97112.93106.68
DirectionEENEEEWENENWESENNEEESEESE
RA (°)103.1663.42100.2596.71256.0963.10316.93124.2931.9699.66112.98107.72
DirectionESEENEEEWSWENENWSENNEEESEESE
Grassland
surface
RDD (°)92.8690.44101.4194.15193.5873.68337.91139.4342.8388.5091.5090.82
DirectionEEESEESSWENENNWSENEEEE
RA (°)89.0997.20102.5295.96209.8871.47313.32145.8841.8491.98100.8691.00
DirectionEEESEESSWENENWSENEEEE
Shrub SurfaceRDD (°)79.4670.9795.3882.0661.7744.3226.5599.2147.4878.0394.0183.99
DirectionEENEEEENENENNEENNEENEEE
RA (°)71.1873.6597.4784.9144.8263.7718.13102.8256.2581.3594.7584.06
DirectionENEENEEENEENENNEESENEEEE
Top of SlopeRDD (°)130.00117.97119.05119.89178.8577.952.24146.0012.5184.70130.22122.22
DirectionSEESEESEESESENENSENNEESEESE
RA (°)132.06119.32120.45121.25179.5777.400.50145.0812.9788.20130.40122.84
DirectionSEESEESEESESENENSENNEESEESE
Middle of SlopeRDD (°)103.5779.39100.4892.39219.8365.49352.48118.8831.9784.85105.51100.58
DirectionESEEEESWENENESENNEEESEE
RA (°)104.2078.28100.8392.37219.3164.59349.14118.6239.6786.81105.20100.45
DirectionESEENEEESWENENESENEEESEE
Disclaimer/Publisher’s Note: The statements, opinions and data contained in all publications are solely those of the individual author(s) and contributor(s) and not of MDPI and/or the editor(s). MDPI and/or the editor(s) disclaim responsibility for any injury to people or property resulting from any ideas, methods, instructions or products referred to in the content.

