1. Introduction
The accelerated expansion of urban areas has emerged as a defining characteristic of contemporary societal progress. This phenomenon manifests through the swift transformation of rural landscapes into metropolitan zones, accompanied by significant demographic shifts and infrastructure development. The process reflects fundamental changes in economic structures and living patterns across multiple regions. Modern societies increasingly demonstrate this trend through concentrated population movements toward urban centers, creating complex challenges for resource allocation and spatial planning. Such transformations occur alongside technological advancements and evolving employment opportunities that reshape traditional community dynamics. The consequences of this widespread urban growth permeate various aspects of human existence, from environmental impacts to cultural assimilation patterns [
1]. With urban expansion, extensive land is used for development and construction, resulting in a serious threat of the fragmentation of original ecological space [
2]. Habitat division significantly impacts species diversity while simultaneously impairing ecosystem organization and operational capacity, leading to diminished environmental benefits. The segmentation of natural areas influences biological variety and interferes with ecological system dynamics, causing a reduction in nature’s provisioning functions [
3]. High-intensity development activities have changed land use patterns, destroyed ecological land, and thus exacerbated the loss of biodiversity, the degradation of ecosystem services, and the increase in environmental health risks [
4]. These problems not only affect ecological environments themselves but also pose a direct threat to the sustainable development of regions [
5]. Therefore, ensuring the structural stability and functional safety of natural ecosystems has become one of the core challenges facing the global community [
6]. To address this, it is particularly urgent to construct ecological security patterns (ESPs). These sustain ecosystem operations and benefits through strategic spatial arrangements of natural components, efficiently linking fragmented wildlife areas while improving terrain interconnectivity. This approach guarantees environmental resilience and adaptability when confronting climate variations and anthropogenic disruptions [
7,
8]. The construction of ESPs not only helps to enhance the resilience of regions’ ecosystems but also provides necessary guarantees for regional health and sustainable development, facilitating the discovery of an improved equilibrium between economic progress and environmental conservation [
9,
10]. Therefore, ESPs are crucial tools for achieving integrated, resilient, and sustainable regional development.
An ESP refers to the potential structure formed by integrating key ecological elements and their spatial connections in a landscape, aiming to create a sustainable design [
11]. Creating an ecological security framework (ESF) aims to fulfill regional environmental demands by preserving vital ecological areas within limited natural landscapes, supporting both economic advancement and societal development. This approach ensures the protection of essential ecosystems while accommodating the needs of human progress within defined geographical constraints. The strategy focuses on maintaining ecological integrity through targeted conservation measures in areas facing spatial limitations [
12]. ESPs are rooted in landscape ecology and closely aligned with restoration ecology. The former identifies, connects, and protects key ecological elements, while the latter guides the recovery of degraded habitats within the network. This management approach is regarded as a macro-ecosystem management tool [
13]. Currently, ESPs (ecological spatial plans) have emerged as crucial territorial approaches for balancing environmental conservation with socioeconomic progress [
14]. The techniques employed in establishing ecological security patterns (ESPs) continue to undergo refinement and creative advancement, though a reasonably well-developed framework has already taken shape. This established approach follows the sequence of identifying core ecological zones, analyzing landscape barriers, and designing connectivity pathways [
15]. Relevant studies have shown a diversified trend: Zhao et al. evaluated ecological protection effectiveness in Hubei Province [
16], Zhou et al. analyzed the impact of policy by considering both ecosystem services and ecological resilience [
17], and Li et al. used this method to identify ecological protection areas [
18], among others. Identifying key ecological sources is a core step in constructing ESPs [
19]. Integrating habitat connectivity as a key factor for source identification alongside morphological spatial pattern analysis (MSPA) enhances the precision and logical foundation of ecological source determination. This dual approach ensures more scientifically grounded selections while maintaining methodological rigor in landscape conservation planning. The synergistic application of these techniques addresses critical spatial configuration aspects that single-method analyses might overlook [
20]. The determination of resistance parameters must correspond to the regional development characteristics. Satellite-derived nighttime illumination serves as an indicator for anthropogenic interference intensity, which is subsequently applied to adjust the foundational resistance layer. This methodology enhances the precision and logical consistency of ecological corridor modeling [
21,
22]. The development of biological passageways primarily employs the minimum-resistance route (MRR) approach [
23], the minimum cumulative resistance (MCR) model [
24], the gravity model [
25], and circuit theory [
26]. In this context, the MCR framework demonstrates superior capability in integrating both environmental and anthropogenic stressors for resilience assessment. Conversely, gravitational modeling and electrical circuit analogies provide solutions for managing connectivity redundancy and spatial configuration fragmentation [
27].
However, at present, existing studies mostly focus on qualitative descriptions or static analyses, lacking dynamic simulation of land use change trends and drivers of urban expansion, which limits the ability to predict and intervene in future ecological pattern evolution [
28]. Although this static protection strategy helps preserve existing ecological patches to some extent, this challenge hinders the balanced progression of local ecological systems, while overlooking comprehensive assessments regarding how land utilization shifts influence forthcoming terrain configurations. The situation complicates efforts to establish harmonious growth across interconnected environmental networks [
29]. Common models used in land use change studies include the cellular automata (CA) model [
30], the conversion of land use and its effects (CLUE-S) model [
31], the future land use simulation (FLUS) model [
32], and the patch-based land use simulation (PLUS) model [
33]. The PLUS framework excels at detecting subtle variations in land surface patterns, rendering it highly effective for environmental monitoring purposes. This methodology demonstrates superior performance in identifying minute landscape transformations, which proves especially valuable for ecosystem-related research initiatives. The system’s precision in tracking terrain modifications positions it as an optimal solution for conservation studies requiring detailed spatial analysis, and it enables the precise prediction of habitat fragmentation and potential restoration areas. Therefore, compared to earlier models, this one offers a more comprehensive and adaptive platform for ESP formation under rapid urbanization. Therefore, considering land type changes during the ESP construction process can facilitate more effective ecological planning. For example, Zhang et al. conducted spatial optimization for Wuhan in 2035 based on the ESV-FLUS model [
34], and Gao et al. used the PLUS model for multi-scenario simulations based on the Wuhan metropolitan area [
35]. In recent years, ecological civilization construction has become an important strategy for national development [
36]. As the province with the highest forest coverage rate in China, ecological construction in Fujian is particularly crucial [
37]. The Fuzhou metropolitan area is centered around Fuzhou City and is symmetrically connected with the Xiamen–Zhangzhou–Quanzhou metropolitan area in the south and north of Fujian’s southwestern region, possessing unique economic characteristics. With the economic development of the northeastern Fujian region, issues such as forest fragmentation and the isolation of ecological patches have become increasingly prominent [
38]. However, there is limited research on land type changes and ESPs in the Fuzhou metropolitan area. Therefore, in this study, we select the Fuzhou metropolitan area as the research subject and construct its ESP. This holds substantial value for preserving biological diversity across Fuzhou and neighboring urban centers, while simultaneously establishing a foundation for spatial ecological planning and enhancing future ecological connectivity within the metropolitan region.
First, the PLUS framework was employed to project 2030 land use patterns under an ecological conservation scenario, integrating historical data from 2000, 2010, and 2020 as baseline inputs for ESP development. Following this, critical ecological hubs were pinpointed through MPSA methodology and habitat connectivity assessments. Applying circuit theory principles alongside the MCR modeling approach enabled the identification of wildlife corridors and strategic nodes across four distinct temporal phases. The comprehensive ESP for Fuzhou’s metropolitan region was ultimately assembled through spatial integration of these ecological cores, passageways, and junction points. We aim to lay the ecological foundation for the coordinated and linked development of Fuzhou and surrounding cities and promote the high-quality development of the Guangdong–Fujian–Zhejiang coastal city cluster, while also providing scientific references for other similar regions.
2. Study Area and Material
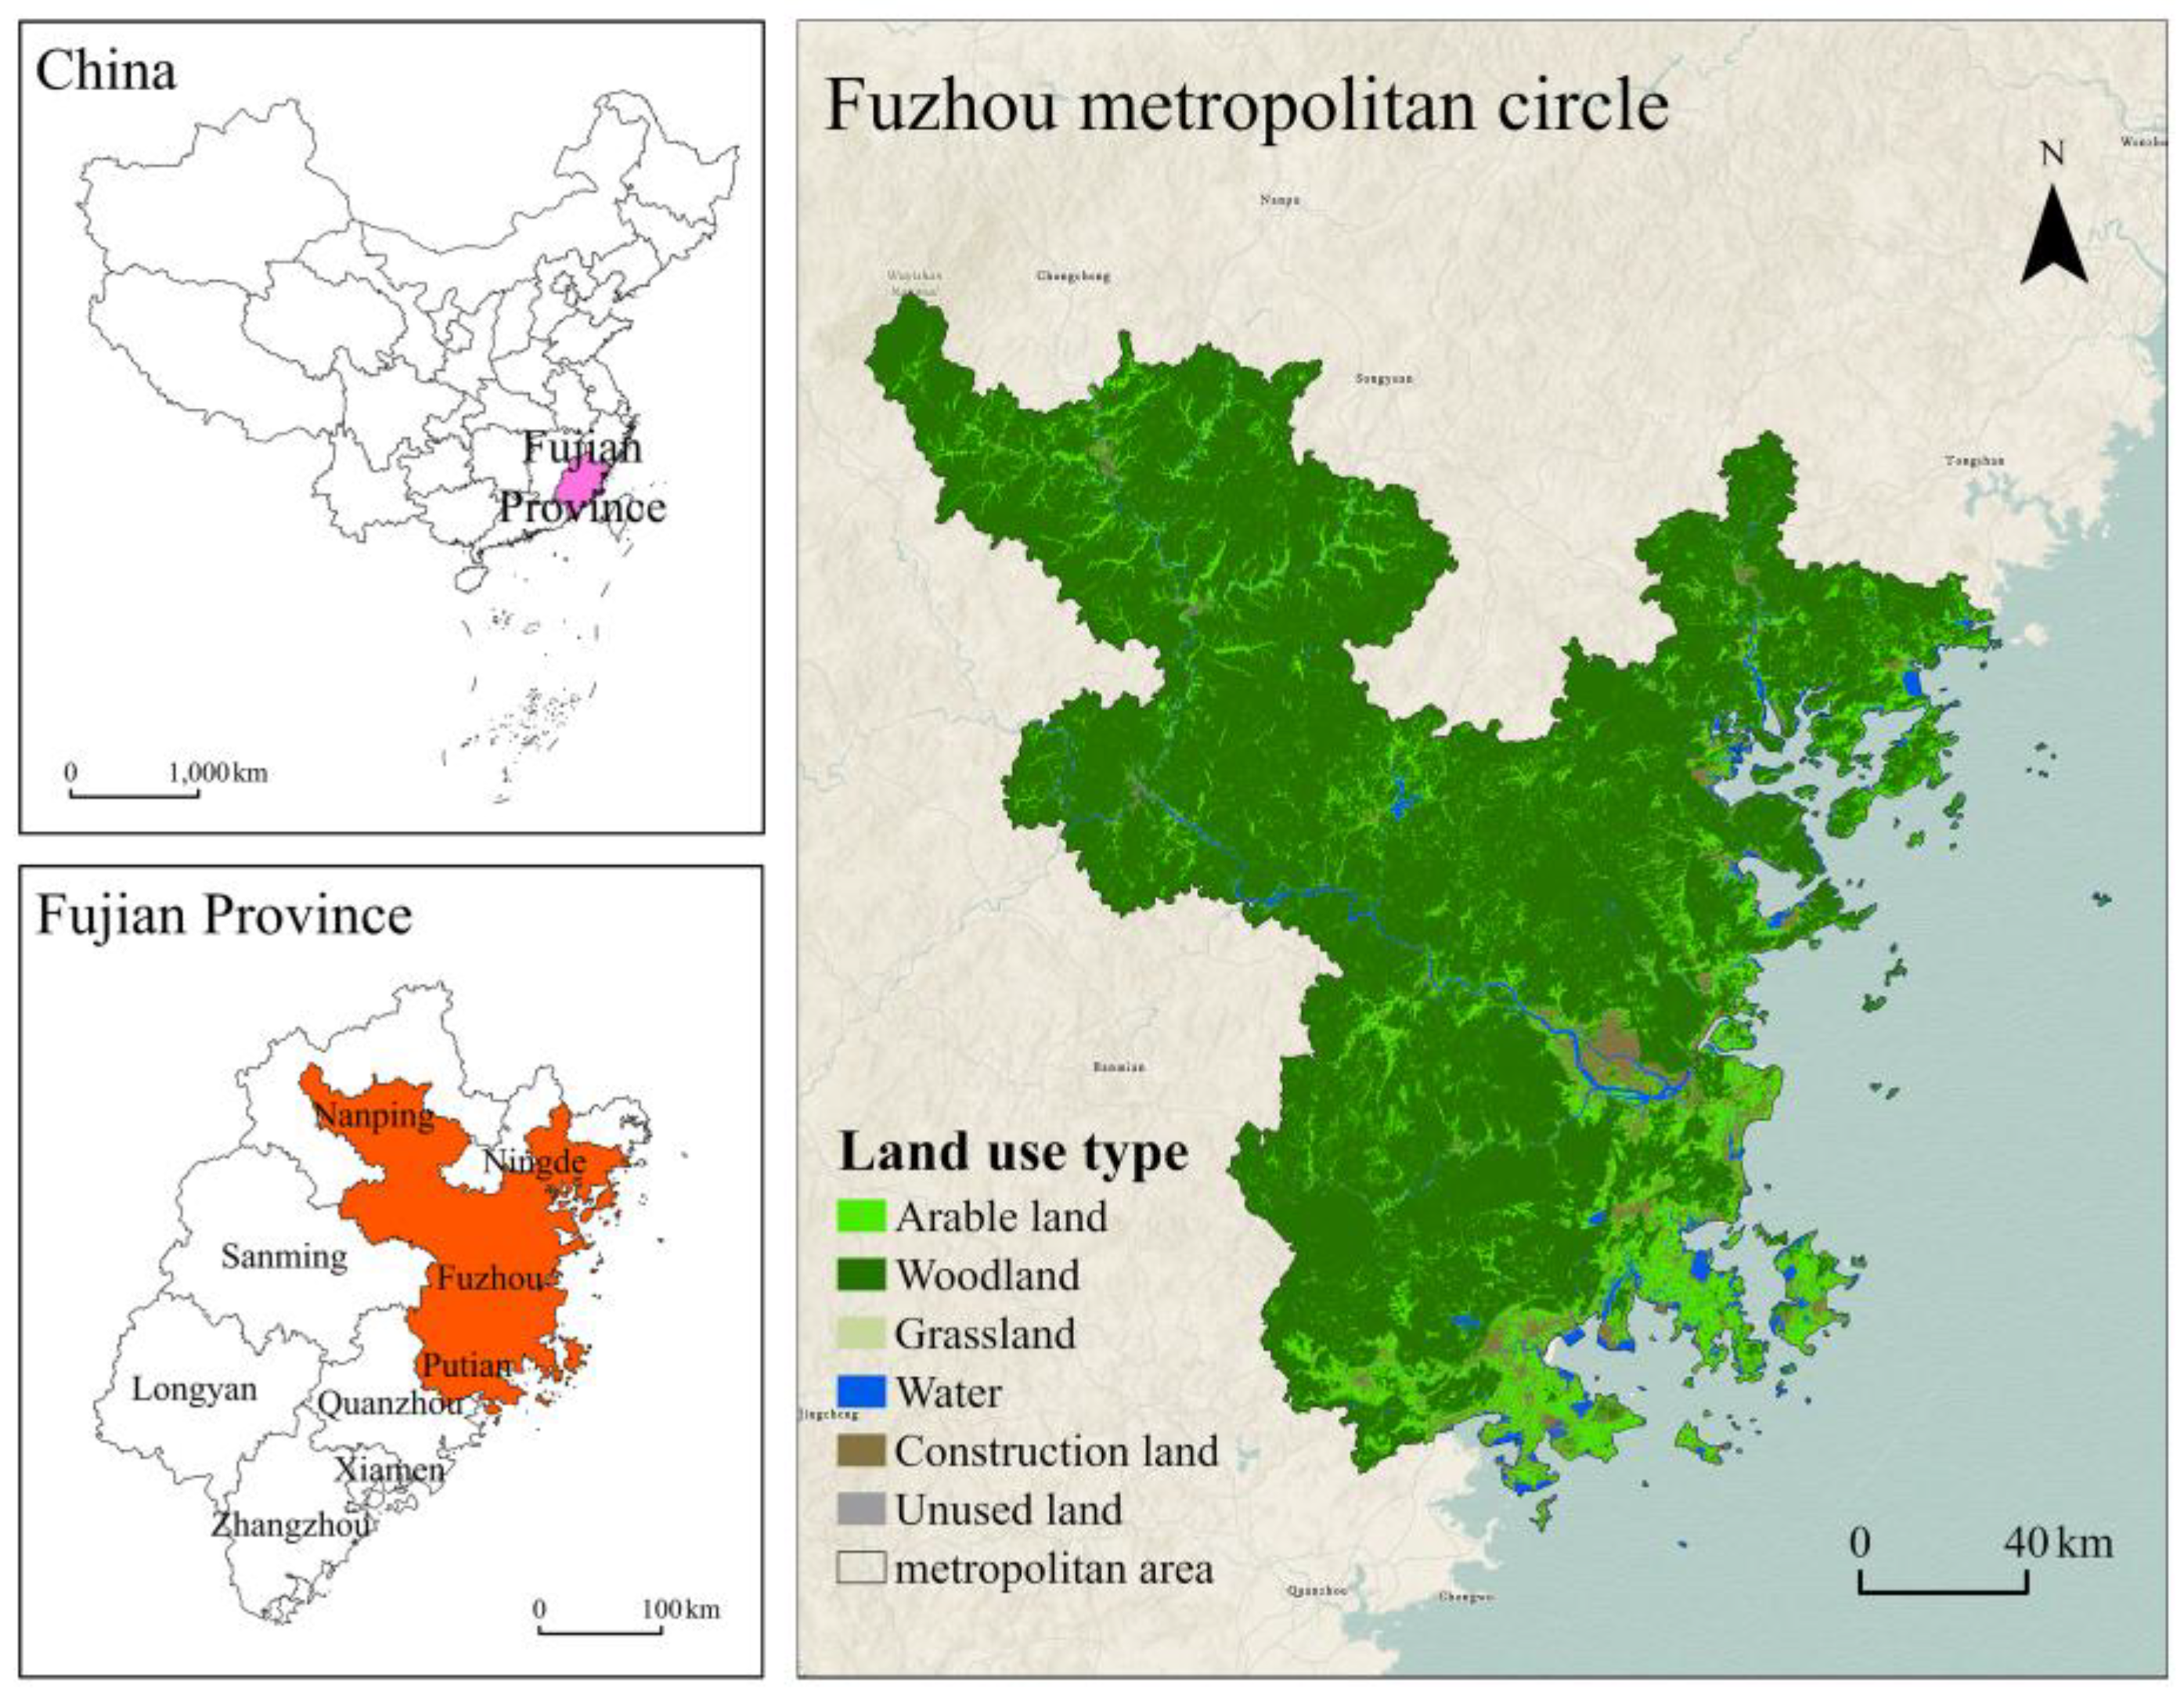
This investigation focuses on the Fuzhou metropolitan region as its primary case study, given its status as a key economic hub within Fujian’s provincial boundaries. The area’s dynamic commercial environment and significant contribution to regional development make it an ideal location for detailed analysis, a model for regional integration development, and located in northeastern Fujian, where the delicate ecosystem requires careful conservation efforts, establishing this region as a crucial zone for environmental preservation. The Fuzhou metropolitan area consists of the region centered around Fuzhou City, Fujian Province, closely linked with surrounding cities. The metropolitan area primarily includes the entirety of Fuzhou City and Putian City, as well as the districts of Jiao, Fu’an, Xiapu, and Gutian in Ningde City; the Yanping and Jianyang districts and parts of Jianou City in Nanping City; and the Pingtan Comprehensive Experimental Zone (
Figure 1). The region has a land area of 26,000 square kilometers, with a total population of approximately 13 million in 2020 and a regional GDP of about CNY 1.5 trillion. These figures account for 21.5%, 33.5%, and 34.5% of the total values in Fujian Province, respectively.
The data required for this study included administrative boundary data; the land utilization metrics, including processed vegetation index (NDVI) datasets specific to Fujian’s geographical region; natural environmental data; and socioeconomic data. The geographic demarcation and vegetation index records for Fujian were acquired through Google’s Earth Engine system, with greenness metrics specifically derived from mid-summer measurements during relevant research periods. Terrain classification information originated from China’s Land Cover Database, which processes satellite observations from the Landsat program, with the years 2000, 2010, and 2020 selected, and they were divided into six categories. The dataset comprises geospatial variables such as topographic elevation, mean yearly rainfall, mean annual air temperature, ground thermal readings (LST), and carbon concentrations in soil organic matter (SOC). The socioeconomic data include population density (POP), road network data, government locations, gross domestic product (GDP), and nighttime light data (
Table 1).
All datasets underwent standardized processing within the ArcMap 10.8 environment, where they were spatially clipped to match the research boundaries. The coordinate reference framework employed was WGS1984 World Mercator, with a standardized raster resolution of 30 m square pixels. For this particular investigation, the CLCD dataset necessitated categorical restructuring. The initial land cover classifications were reorganized into six distinct categories: cultivated areas, forested zones, pasture regions, aquatic bodies, developed territories, and barren terrain. Utilizing the digital terrain representation, gradient information for the research zone was derived through the analytical functions available in ArcMap version 10.8. Road network data were filtered to extract major roads and railways. The investigation zone included administrative and public service sites, with subsequent proximity measurements conducted using straight-line distance calculations.
3. Methodology
The research initially employed the PLUS framework to project 2030 land utilization patterns under an ecologically focused scenario, drawing upon spatial data from 2000, 2010, and 2020. Following this, the MSPA technique was applied to identify prospective ecological core areas across four distinct temporal phases, with subsequent evaluation of their spatial linkages. All resistance parameters then underwent normalization through standardized processing, while the analytic hierarchy process methodology facilitated the weighting distribution among various resistance elements, constructing ecological resistance (ER) surfaces for the four periods. The analysis was enhanced through the incorporation of nocturnal illumination datasets. Subsequently, ecological pathways and critical junctions were identified utilizing the Linkage Mapper application. These fundamental components—source areas, connecting routes, and strategic intersection points—were integrated to establish a comprehensive ecological framework. This interconnected system subsequently underwent thorough assessment procedures.
3.1. Simulation of Land Use Change
The PLUS framework represents a sophisticated land use transformation modeling system engineered to deepen insights into land cover dynamics and their fundamental drivers, while simultaneously refining the simulation of spatial pattern evolution. This computational framework comprises two primary functional components: a rule mining framework based on the land expansion analysis strategy (LEAS) and a cellular automaton (CA) based on multiple random seeds (CARS). LEAS is used to identify areas of change from land use data at two time points and extract change rules through data mining methods. The CARS algorithm produces randomized initialization values for terrain allocation throughout computational iterations, enhancing the framework’s capacity to replicate authentic geographical configurations. Additionally, the PLUS framework possesses scenario-based predictive functionality for forthcoming terrain utilization arrangements, generates reliable landscape patterns, provides important insights for exploring sustainable development paths, and assists in planning future development goals.
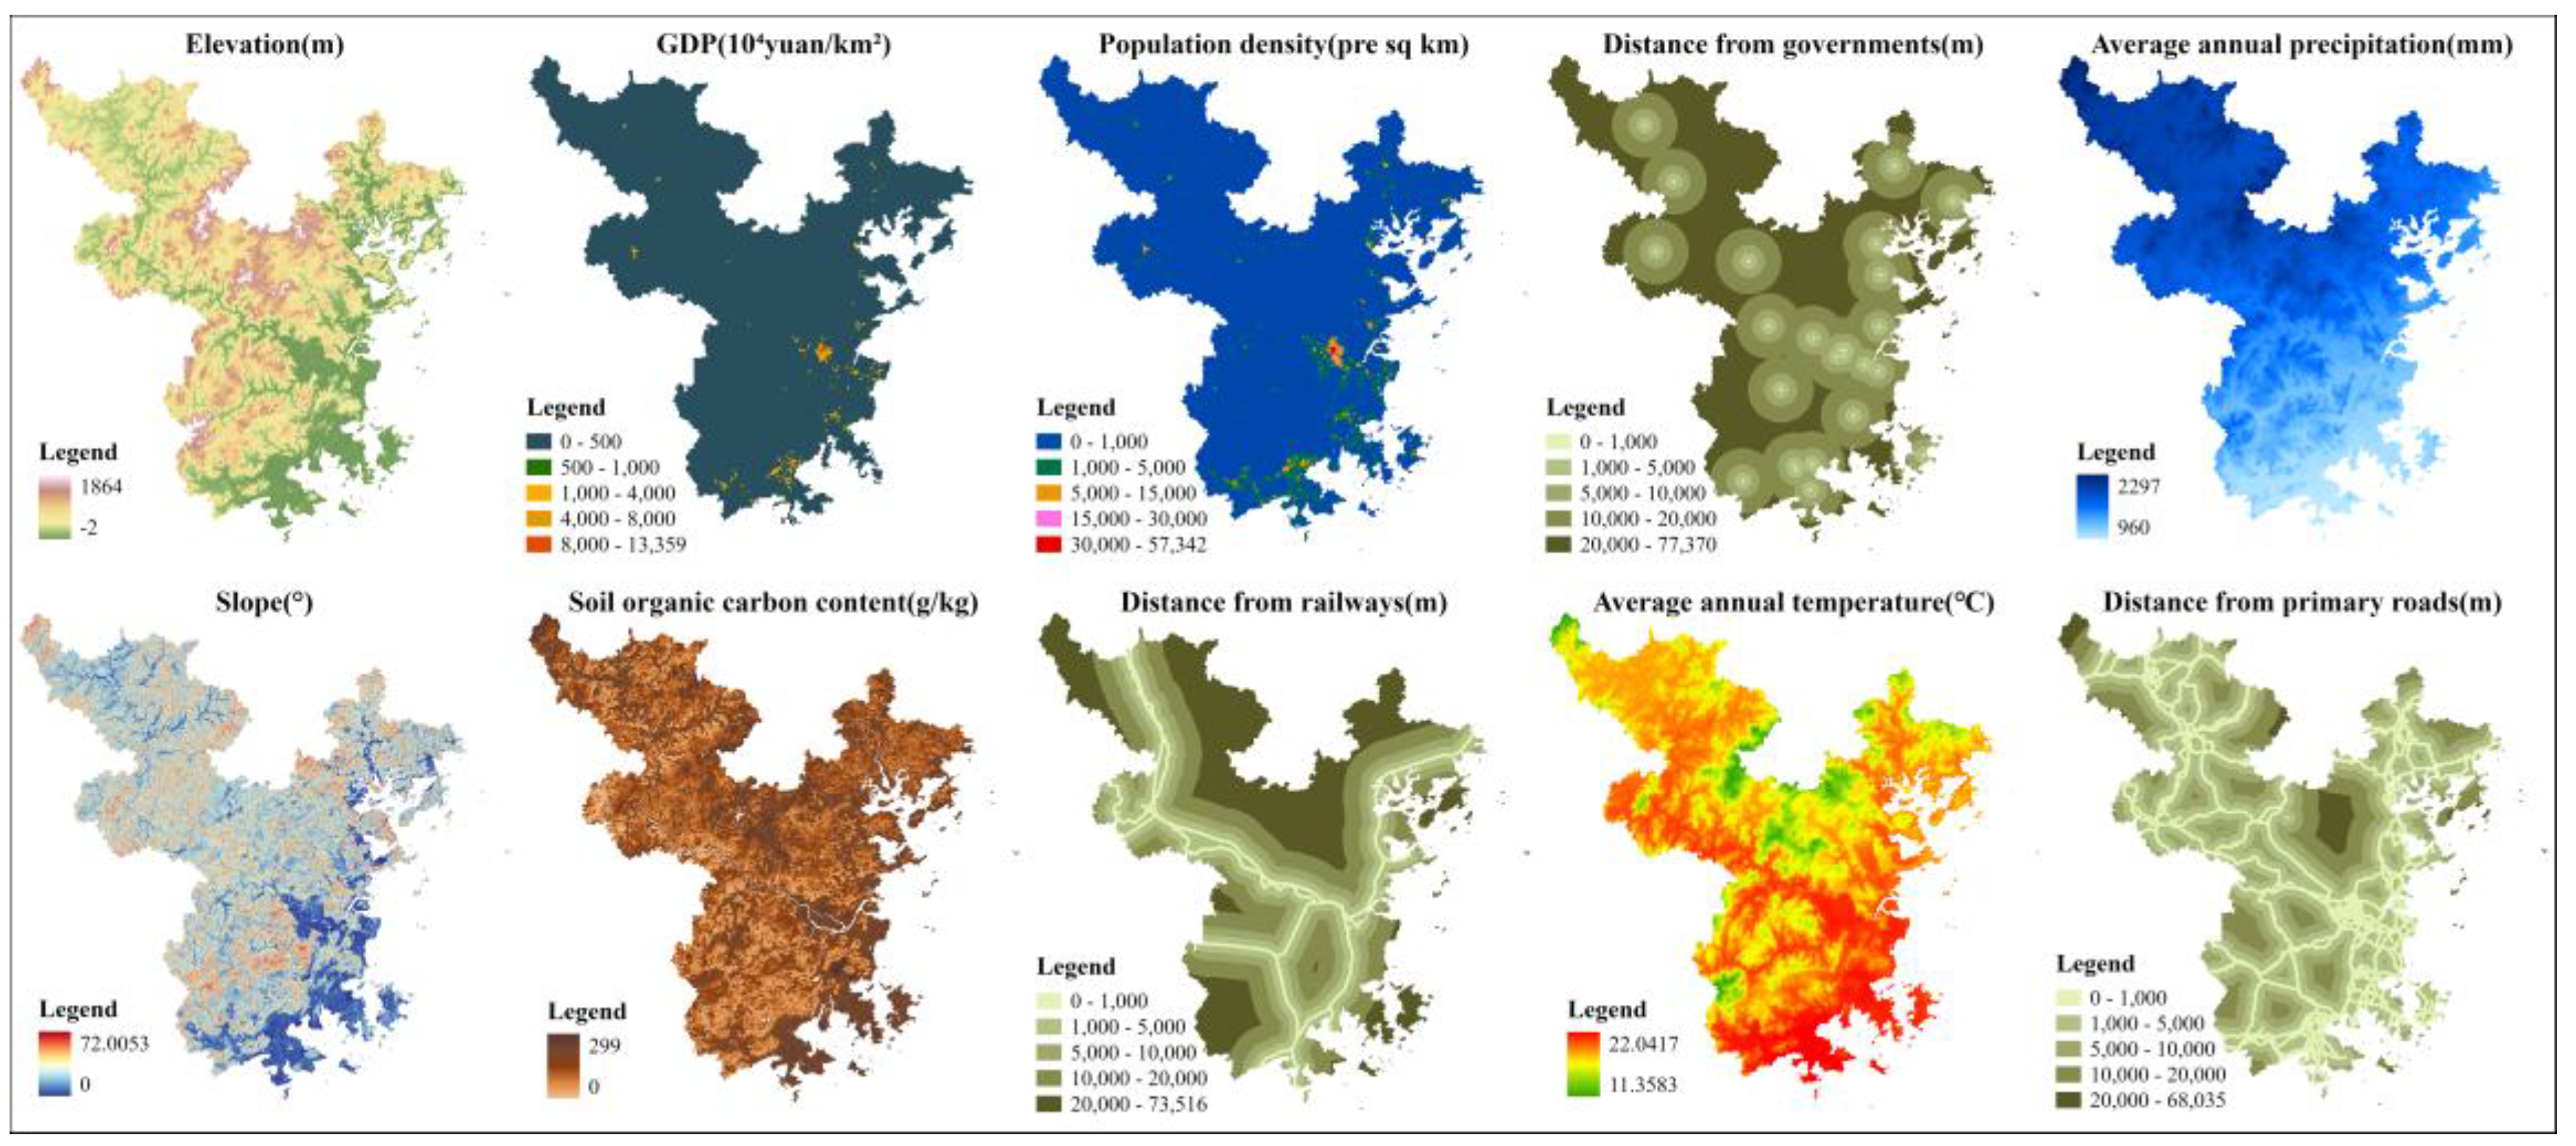
First, land expansion was extracted using the PLUS tool, identifying land expansion areas in the Fuzhou metropolitan area for the periods 2010–2020 and 2020–2030. Next, ten driving factors were selected, including elevation, slope, annual average temperature, annual average precipitation, SOC, GDP, population density, distance from primary roads, distance from railways, and distance from governments (
Figure 2). The LEAS module was used to identify these driving factors, with the primary goal of analyzing land use transition rules. Then, the transition matrix, land use demand, and neighborhood weight settings were configured within the CARS module. The transfer matrix for ecological conservation scenarios is set as follows (
Table 2). Under the ecological priority scenario, land use demand differs slightly from the natural development scenario. Based on regional policies and development conditions, the transformation of forested areas, pastures, and cultivated fields into urban development zones decreased by one-fifth, whereas the shift from farmland and built-up areas to wooded regions rose by 10 percent. Aquatic zones remain protected from conversion, with assigned importance scores spanning zero to one—elevated figures denote stronger impacts on territorial growth. The weights were adjusted according to the formula, resulting in the following values: arable land (1.0), grassland (0.6), woodland (0.1), water (0.5), construction land (0.8), and unused land (0.6). Finally, The analysis incorporated land utilization records from 2000 and 2010 as foundational datasets. Projections for 2020 land cover patterns were generated through computational modeling under baseline development conditions. These predictive outputs underwent rigorous evaluation against observed 2020 spatial data to verify model reliability. Following successful calibration, subsequent simulations forecasted 2030 land distribution patterns under environmental conservation constraints.
3.2. Determination of Ecological Sources
Ecological sources serve as fundamental elements within natural systems, functioning as critical zones that sustain environmental equilibrium. These areas contribute significantly to preserving biological diversity while fostering harmonious interactions between human activities and the natural world. Through the integration of morphological spatial pattern analysis (MSPA) with habitat linkage assessments, researchers can identify suitable ecological source locations that align with study requirements.
MSPA is a spatial analysis technique based on raster data, which is used to analyze landscape patterns and changes. It relies heavily on the basic principles of landscape ecology, including the concepts of landscape patches, edges, and connections. This method treats different patches or areas in a raster image as spatial units in an ecosystem, and combines mathematical and morphological principles to analyze the spatial structure and pattern between them. MSPA surpasses ecological sources selection by identifying ecologically meaningful core areas based on spatial morphology, enhancing accuracy and connectivity in ecological networks. Ecosystem connectivity describes how effectively distinct regions within a natural environment remain linked. Enhanced connectivity between habitats directly correlates with improved ecological resilience and species variety preservation. The probability of connectivity index (PC), the integral index of connectivity (IIC), and the patch importance index (dPC) serve as crucial metrics for evaluating connection intensity among originating regions. The detailed computational approach can be outlined as follows:
where
represents the total number of patches in the area;
and
denote the area of patches
i and
j, respectively;
represents the maximum product of all path probabilities between patches
i and
j;
is the total area of the study region;
is the connectivity index after the removal of a given landscape element; and
denotes the number of connections on the shortest path between patches
i and
j.
According to the spatial distribution of land use categories within the research zone, forested areas exhibit extensive coverage, whereas cultivated fields and developed zones maintain close spatial proximity. Following thorough evaluation, pasturelands, aquatic features, and wooded regions were designated as primary study materials, while farmlands, urbanized sections, and undeveloped territories served as contextual references. These datasets were subsequently transformed into binary raster files in TIFF format.
Landscape configuration analysis was conducted on four temporal datasets using Guidos Toolbox, employing specific configuration parameters: foreground linkage established at “8”. Boundary zones represent transitional spaces separating central ecological patches from predominant non-vegetated sectors, with their dimensional characteristics directly influencing core habitat integrity. Drawing upon the existing literature and regional conditions, the perimeter threshold was fixed at “10”. Transition metrics and textual outputs were both activated.
The processed outputs categorized the landscape into seven distinct classifications: central zones, isolated fragments, perforated sections, peripheral bands, connecting corridors, circular formations, and protruding extensions. After assessing regional ecological conditions, potential source locations were identified as core ecological zones exceeding 5 square kilometers in area.
Analyzing ecological source areas from 2000 to 2030, landscape connectivity assessments were performed using Conefor 2.6. Distance parameters were established at 500 m, 1 km, 2 km, 4 km, 8 km, and 15 km intervals, maintaining a 50% linkage probability threshold. Connectivity metrics were derived across these varying spatial scales, and the connectivity index was used to determine the optimal threshold (
Table 3). The study employs an 8000 m threshold with 50% connection likelihood as a key parameter. Using these criteria, annual connectivity metrics for candidate ecological sources are computed. Areas demonstrating dPC values exceeding 1 are identified as the primary ecological sources for this research.
3.3. Construction of Ecological Resistance Surface
3.3.1. Selection of Resistance Factors
Resistance factors represent the degree to which different types of terrain or landform characteristics hinder the movement or diffusion of organisms. Properly selecting resistance factors can more accurately reflect the ease or difficulty of organism movement around corridors. Considering the regional conditions and existing research findings, eight key parameters were identified as determining variables: altitude, vegetation index (NDVI), gradient, land cover classification, MSPA spatial configuration, proximity to primary transportation routes, land surface temperature, and soil organic carbon content.
3.3.2. Construction of Resistance Surface
The measurement units of the various resistance factors are not the same, so they cannot be directly synthesized into a resistance surface and need to be unified. Common methods for unification include the grading assignment method and the normalization method. In this study, we use both methods for unification. The normalization method involves transforming the original values of each resistance factor into a range between 0 and 1 using a formula, where higher values indicate higher resistance. The normalization method can be further divided into direct normalization and inverse normalization. If the resistance factor value is directly proportional to the resistance required for animal movement, direct normalization is used; otherwise, inverse normalization is applied. The specific formulas are as follows:
where
X represents the current value of different data;
denote the minimum and maximum values within the same data group, respectively.
The land use types and MSPA landscape patterns require the grading assignment method, where each land use type is assigned a resistance value between 0 and 1 based on the resistance needed for animal movement. Hierarchical analysis is then conducted using the YAAHP software to determine the weight of each resistance factor in the composite resistance surface. Determining the weights of each factor was carried out using the multiple expert scoring method (
Table 4).
3.3.3. Correction of the Resistance Surface
Resistance surface correction refers to the supplementation or improvement of resistance surface data to enhance its accuracy and completeness, serving as a crucial step in data processing and analysis [
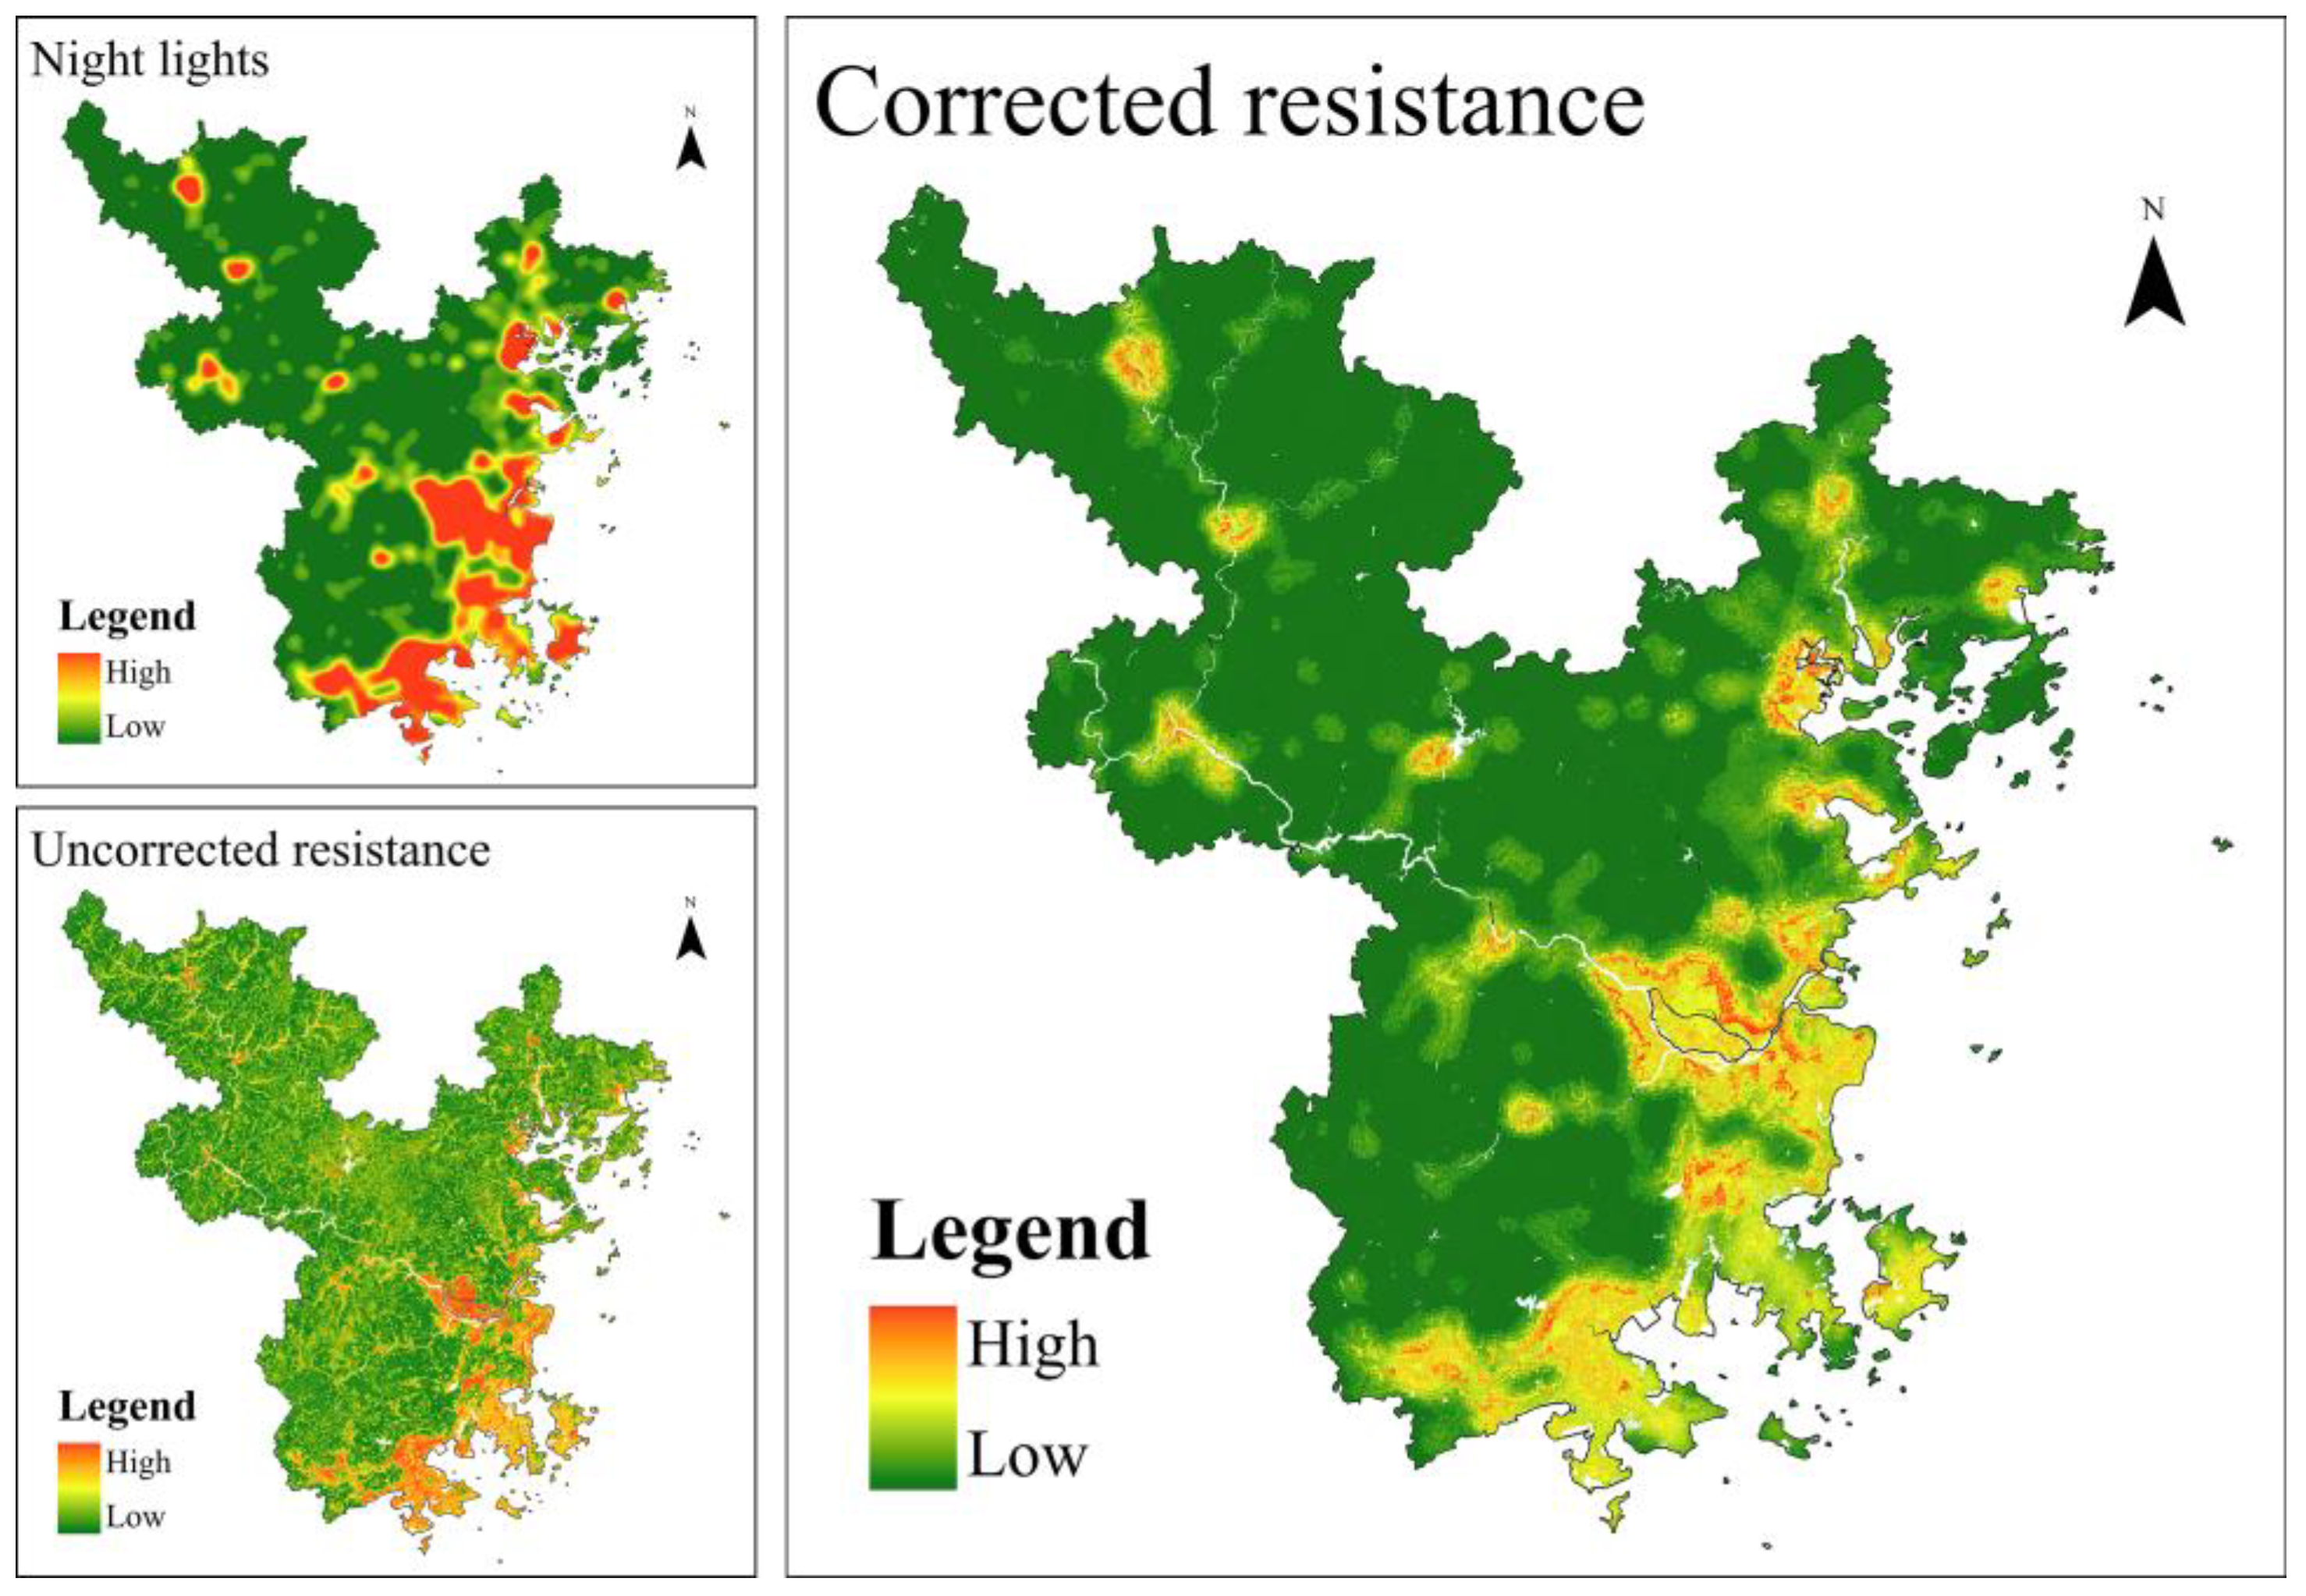
39]. This process aids in improving the quality and reliability of resistance surface data, thereby enhancing the accuracy and credibility of subsequent analysis and model development. Nighttime light data serve as a comprehensive indicator of human activity intensity. Therefore, this study employs the average nighttime light value method for raster assignment of different land use types. Then, nighttime light data were used to represent human activities and thereby adjust the ecological resistance surface. The specific formula is as follows:
where
represents the corrected raster resistance coefficient;
denotes the nighttime light intensity value of raster
;
represents the average nighttime light intensity value of land type
; and
is the base resistance value of raster
.
We have repaired the resistance surfaces of various periods. The figure below shows the map of resistance value corrections for 2020 (
Figure 3). The overall trend of the corrected resistance value remains the same as the initial resistance value; however, regions exhibiting elevated resistance measurements demonstrate stronger correlations with anthropogenic influences.
3.4. Construction of Ecological Security Pattern
3.4.1. Circuit Theory and MCR Model
The research employs Linkage Mapper software to identify ecological pathways and critical connection points following principles of circuit theory. Linkage Mapper is a specialized geographic information system (GIS) tool used for landscape connectivity analysis and ecological corridor extraction, among other tasks. It provides a set of powerful tools and algorithms that help researchers assess and quantify the connectivity of different regions within the landscape, and identify potential ecological corridors. Circuit theory is a commonly used spatial analysis method in landscape ecology, which views the landscape as a conductive surface, where each grid cell has a value representing resistance, reflecting the difficulty or resistance of moving through that area. This model assumes that ecological processes are similar to the random walk of electrons on a conductive surface, where a 1A current is injected from an ecological source, and the current flows through the network via various paths, ultimately reaching other ecological sources, determining the optimal path, and extracting ecological corridors.
The MCR framework employs an expense trajectory evaluation methodology, with its fundamental principle centered on identifying the route exhibiting minimal impedance between origin and destination points. Impedance metrics are typically influenced by variables including terrain characteristics, land utilization patterns, and anthropogenic disturbances. The MCR model tends to generate a single optimal path or a small set of paths, and is suitable for analyzing clear ecological connectivity needs. The basic formula of the MCR model is as follows:
where
represents the minimum cumulative resistance value,
denotes the positive correlation between minimal resistance and ecological activities,
represents the spatial distance of a species from source
j to landscape unit
i, and
Ri denotes the resistance of landscape
i to the movement of a given species.
3.4.2. Extraction of Ecological Corridors
Ecological corridors are continuous, non-interfering pathways or channels that connect different ecosystems, nature reserves, or important biological communities. Their purpose is to provide safe migration and passageways for wildlife, facilitating species migration, gene flow, and ecosystem connectivity. The creation and maintenance of ecological corridors are crucial for maintaining biodiversity, preserving ecological balance, and addressing biodiversity loss. This research employed the ArcGIS 10.8 software environment, utilizing the Linkage Mapper extension to process ecological core area information alongside landscape permeability datasets from the period spanning 200, 2010, 2020, and 2030, with other parameters set to default, for ecological corridor extraction.
3.4.3. Extraction of Ecological Pinch Points
Ecological bottlenecks represent critical zones within wildlife passageways characterized by exceptional species richness. These strategic locations serve as vital intersections where diverse lifeforms concentrate along migratory routes. The identification of such concentrated biodiversity hotspots helps conservationists prioritize protection efforts along natural connectivity pathways, ecological sensitivity, or biological richness, and are key nodes in the migration pathways of species. In ecological corridors, pinch points are typically junctions that connect different ecosystems or biological communities, serving as important stopover points and habitats for species migration. In ecological corridor planning and management, pinch points are often considered important conservation targets, and measures are needed to protect and maintain their ecological functions and integrity to ensure the smooth progression of species migration and the healthy development of ecosystems. Ecological pinch points were extracted using the Pinchpoint Mapper module in the Linkage Mapper tool. After comparison at different scales, setting the corridor threshold to 20,000 m aligned better with the study area, and operations were performed for each year.
3.4.4. Ecological Network of Superposition Analysis
Within the framework of spatial organization for Fuzhou’s urban agglomeration, this research integrates identified environmental assets, passageways, and strategic points to establish the metropolitan ecological framework. Subsequently, analytical techniques for network configuration assessment are employed to measure interconnection levels within the studied ecological system. In this study, we selected the network closure index (α), line point rate (β), and network connectivity index (γ) as comprehensive evaluation indicators to verify whether the ecological network model constructed in this research is optimized relative to the existing ecological network. The specific calculation formulas are as follows:
where
represents the number of corridors;
represents the number of nodes. A higher
index indicates more closed loops within the network, facilitating smoother internal material and energy flow. A higher
index signifies that each node connects to more corridors, indicating a more complex network structure. When the
coefficient is large, it indicates that the actual number of path connections between nodes is close to the possible number of connections, thereby enhancing the network’s connectivity.
5. Discussion
5.1. Advantages of the PLUS Model in Ecological Networks
The advantages of PLUS in ecological network construction lie primarily in its high-precision prediction and dynamic adjustment capabilities. This model integrates various natural and social factors, enabling land use simulation to accurately predict future land use changes under different scenarios [
40]. Using PLUS can generate precise landscape patterns, providing scientific support for ESP construction. Furthermore, the model can dynamically optimize ecological network construction strategies based on actual needs and future development goals, ensuring adaptability to future changes and growth [
41].
Amidst rapid urban expansion, alterations in land utilization patterns have emerged as pivotal elements shaping the development and transformation of ecological connectivity systems. Our research employed an innovative approach to ecological network modeling that combines land use prediction techniques, with the methodology fundamentally comprising these sequential phases: (1) define the study area; (2) predict future land use changes; (3) identify ecological sources; (4) construct historical, current, and future ecological networks; (5) select and classify ecological corridors; (6) delineate ecological nodes based on corridor types; (7) construct the ESP. This method exhibited strong model compatibility and broad indicator applicability, making it adaptable to ecological planning needs in different regions. Given that many cities and regions worldwide are experiencing rapid urbanization, this method has high generalizability and can serve as a reference for ecological network construction at various scales.
Recent academic discourse has shifted significant attention toward evaluating the capacity of existing ESP frameworks to adapt to forthcoming alterations in land utilization patterns caused by urban expansion. As an illustration, in a study of Huaibei, China, Yu et al. utilized the PLUS framework to project land cover distributions across multiple policy-driven scenarios (including agricultural conservation and ecosystem prioritization) by the year 2025. The simulation outcomes demonstrated that, compared to the CLUE-S model, PLUS achieved higher simulation accuracy for woodland, water, and construction land and provided a more precise assessment of the potential impacts of ecological protection strategies [
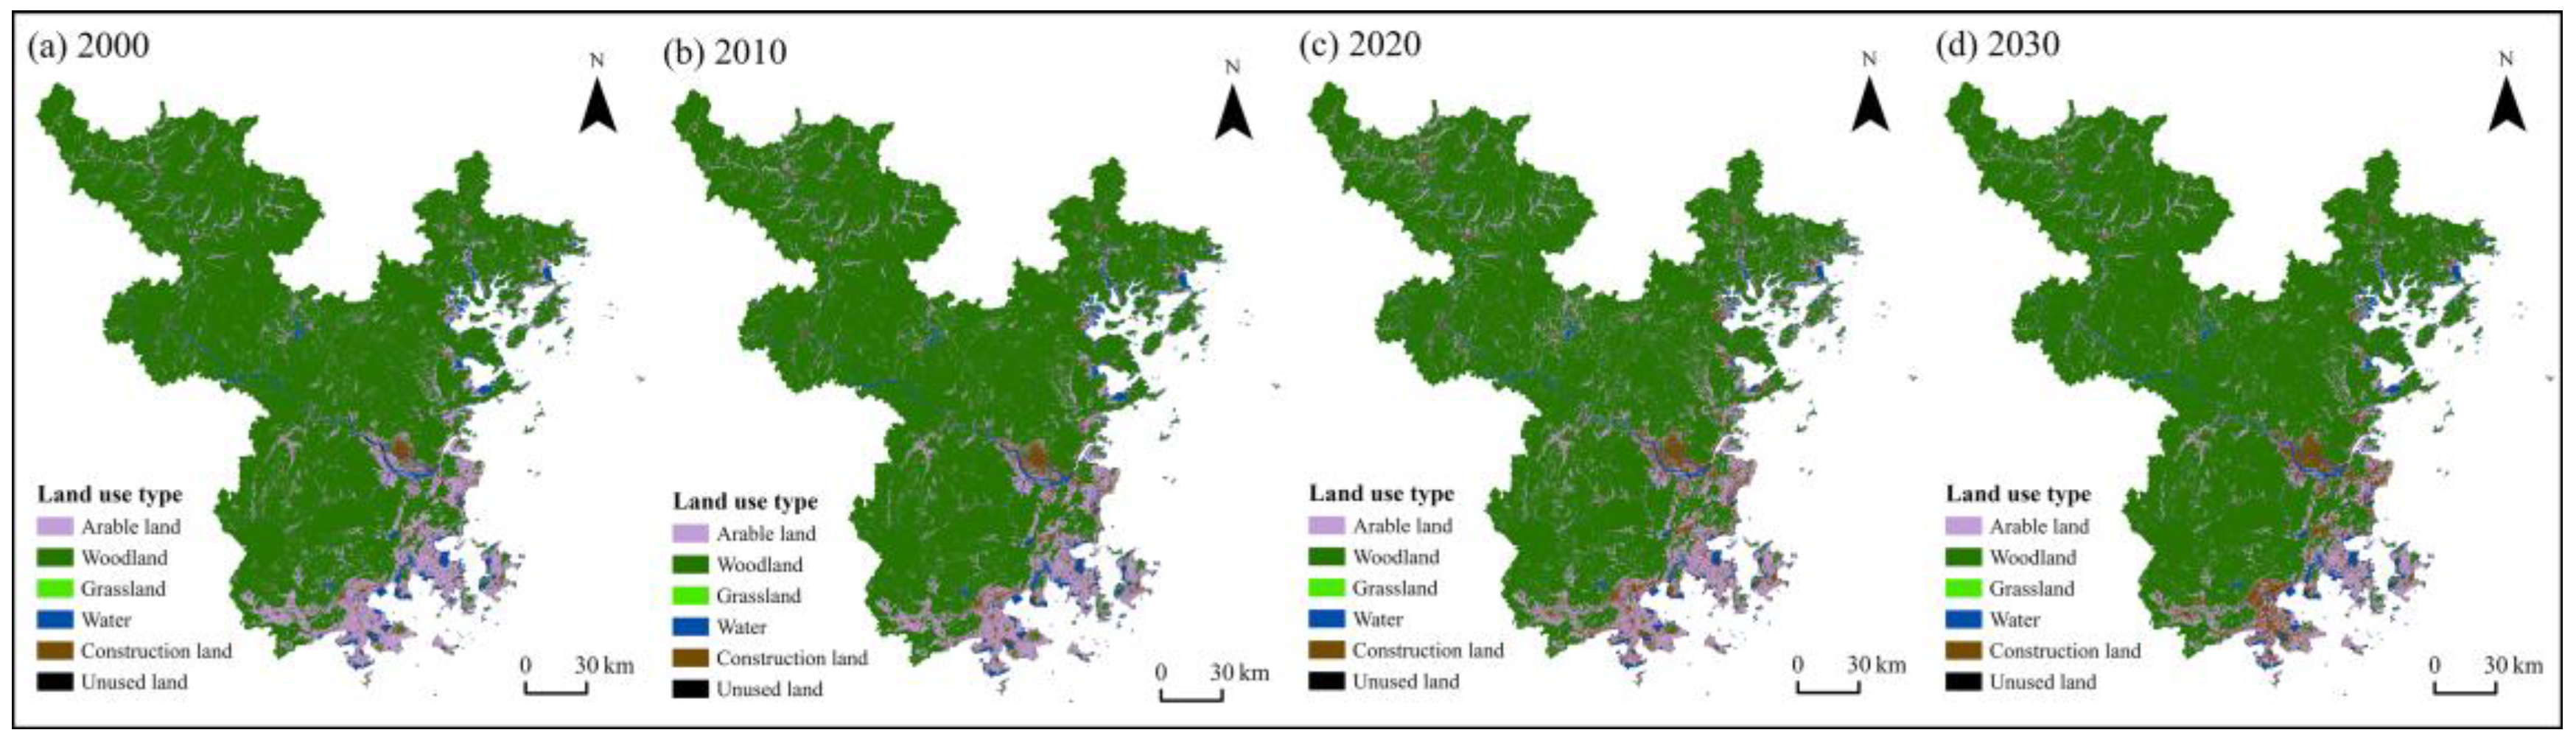
42]. Therefore, this study simulated land use changes in the Fuzhou metropolitan area under the ecological priority scenario for 2030, providing a crucial basis for dynamically constructing the ecological network pattern. The key to simulation under this scenario is selecting appropriate ecological constraint indicators. This study employed the PLUS model, restricting the conversion of ecological land to construction land and unused land. Additionally, drawing on relevant studies, the weight of farmland was increased to 1.0 to enhance its expansion intensity, while the weight of forest land was set at 0.1 to minimize its changes, facilitating modern urban expansion while advancing environmental sustainability initiatives.
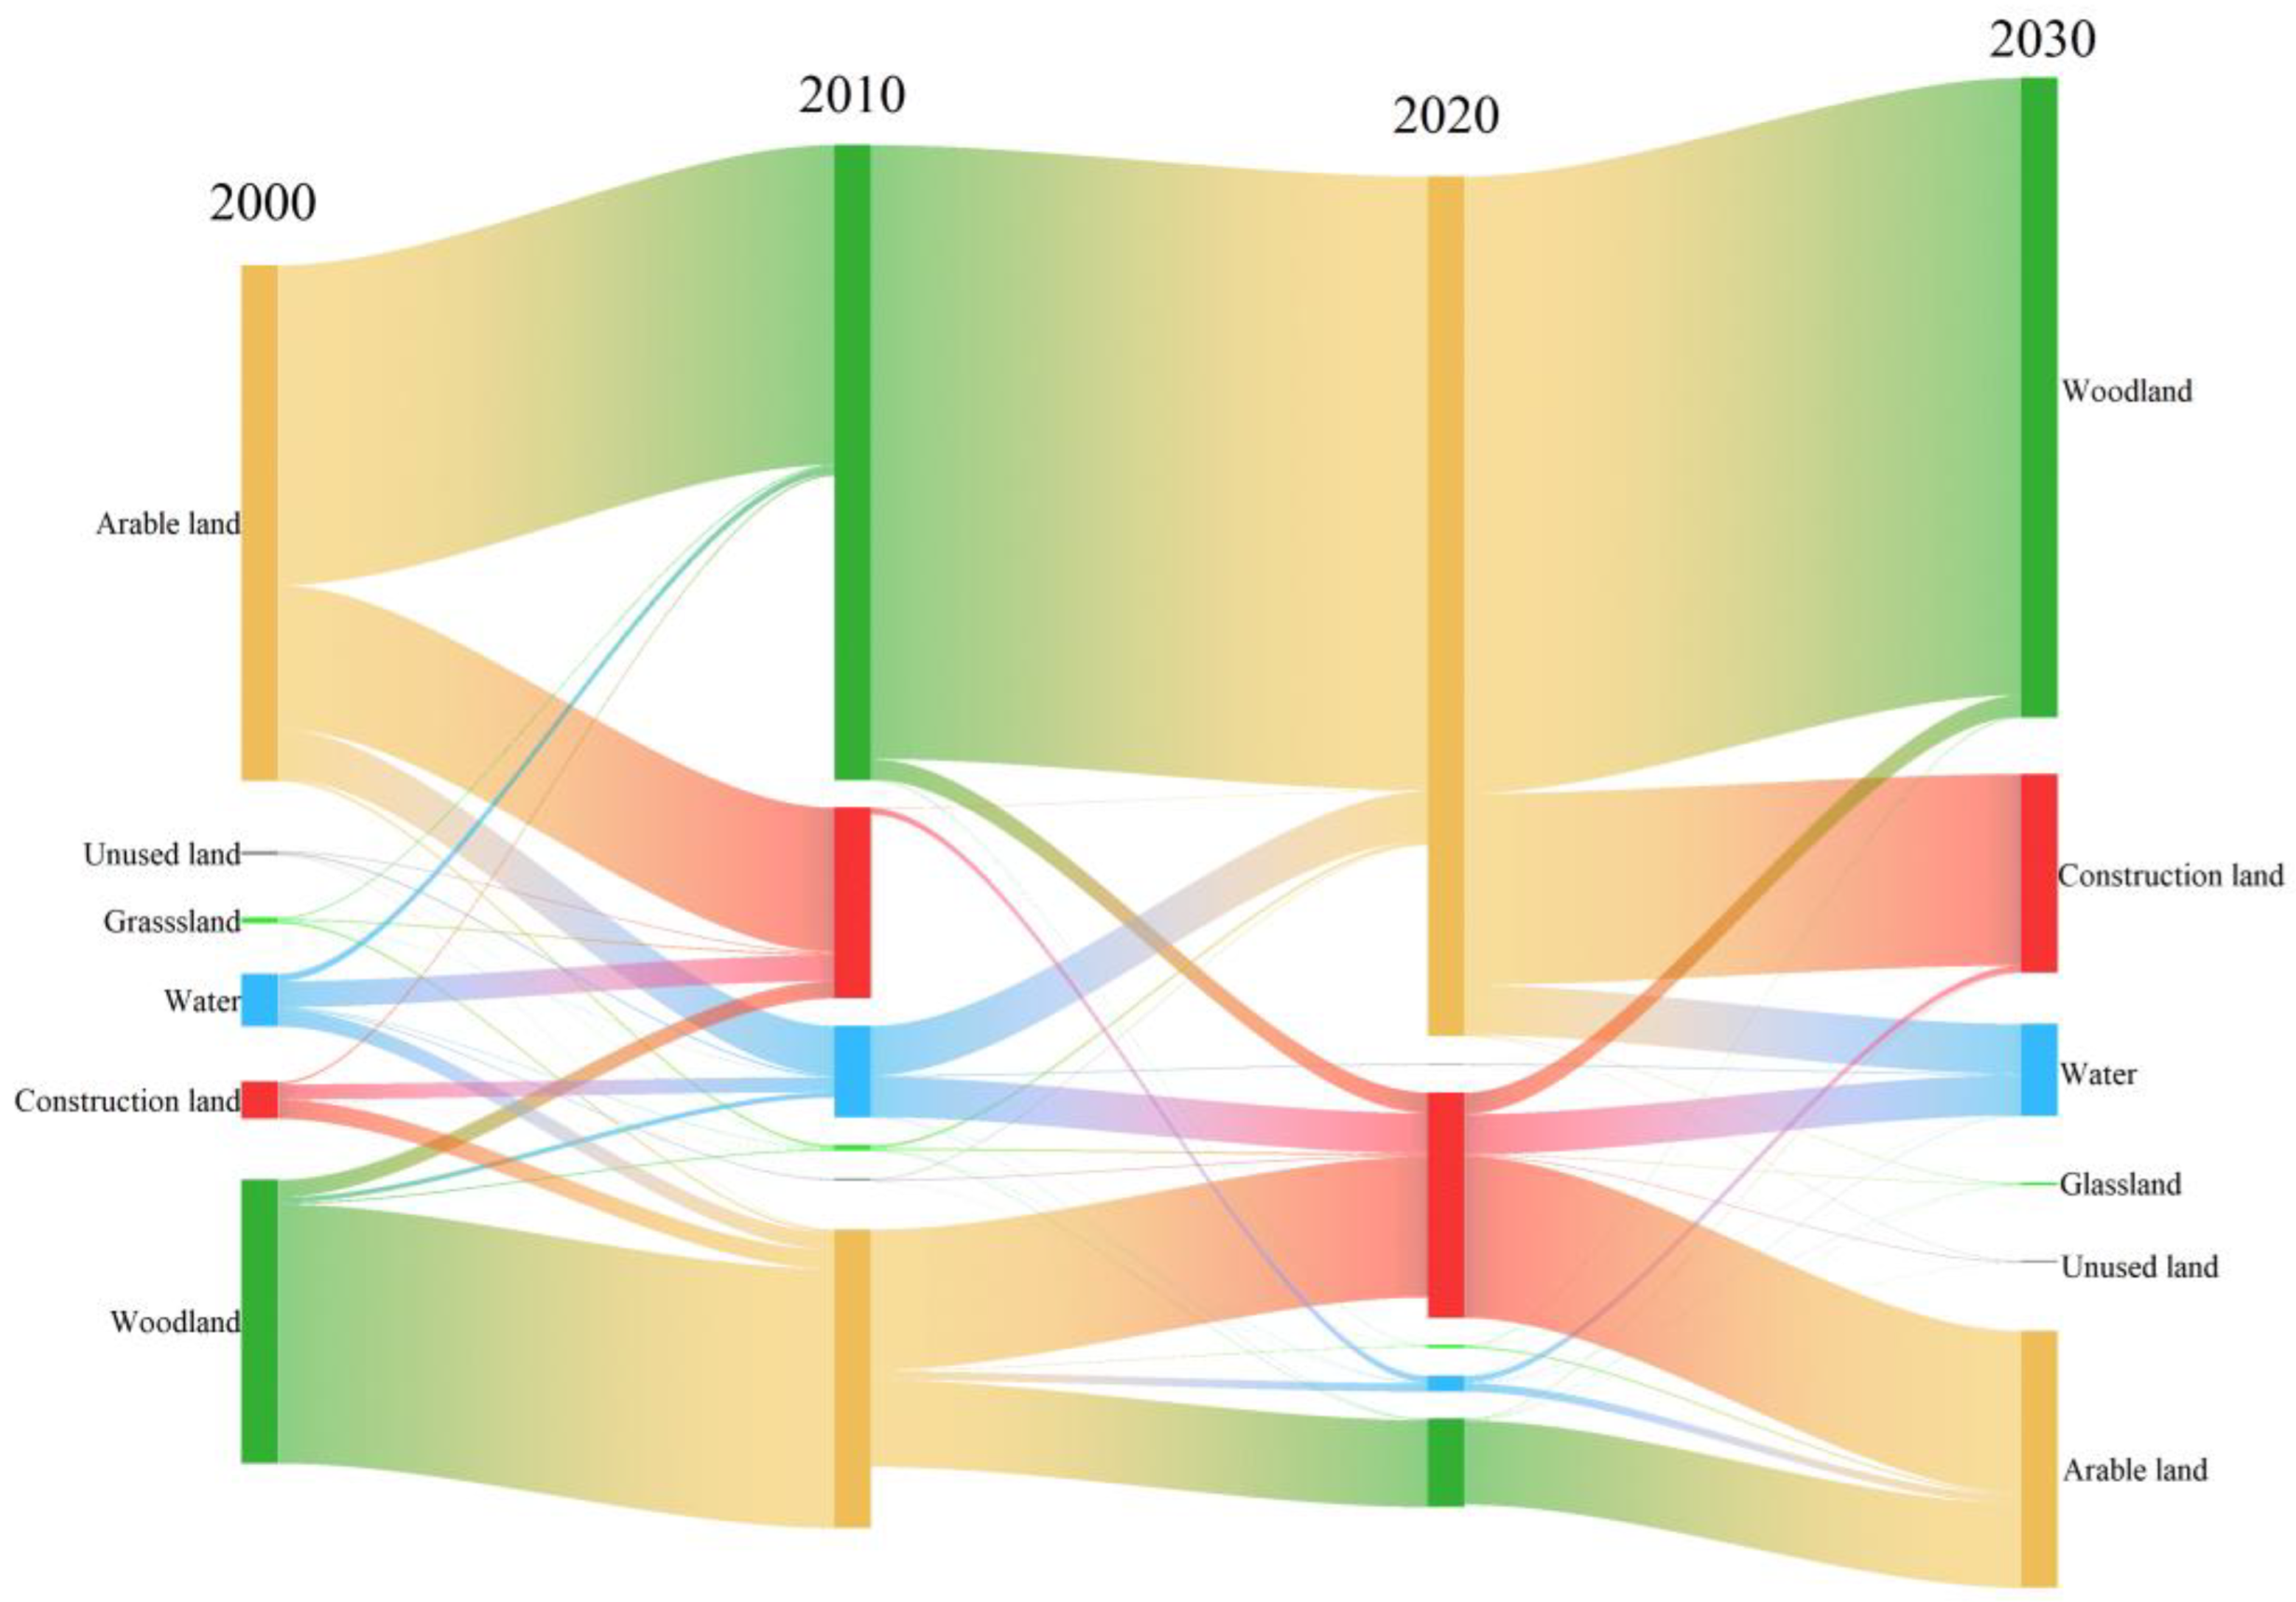
The data visualization in
Figure 4 reveals that land utilization patterns between 2020 and 2030 exhibited negligible modifications within the ecological priority framework. This observation suggests Fuzhou’s urban expansion has decelerated significantly, transitioning toward an era emphasizing sustainable growth and development excellence. Moreover, during land use transitions, some construction land was converted into farmland, while most farmland transitioned into forest land, assisting in reducing the environmental segmentation resulting from urban development.
5.2. Reflections on Ecological Source Identification
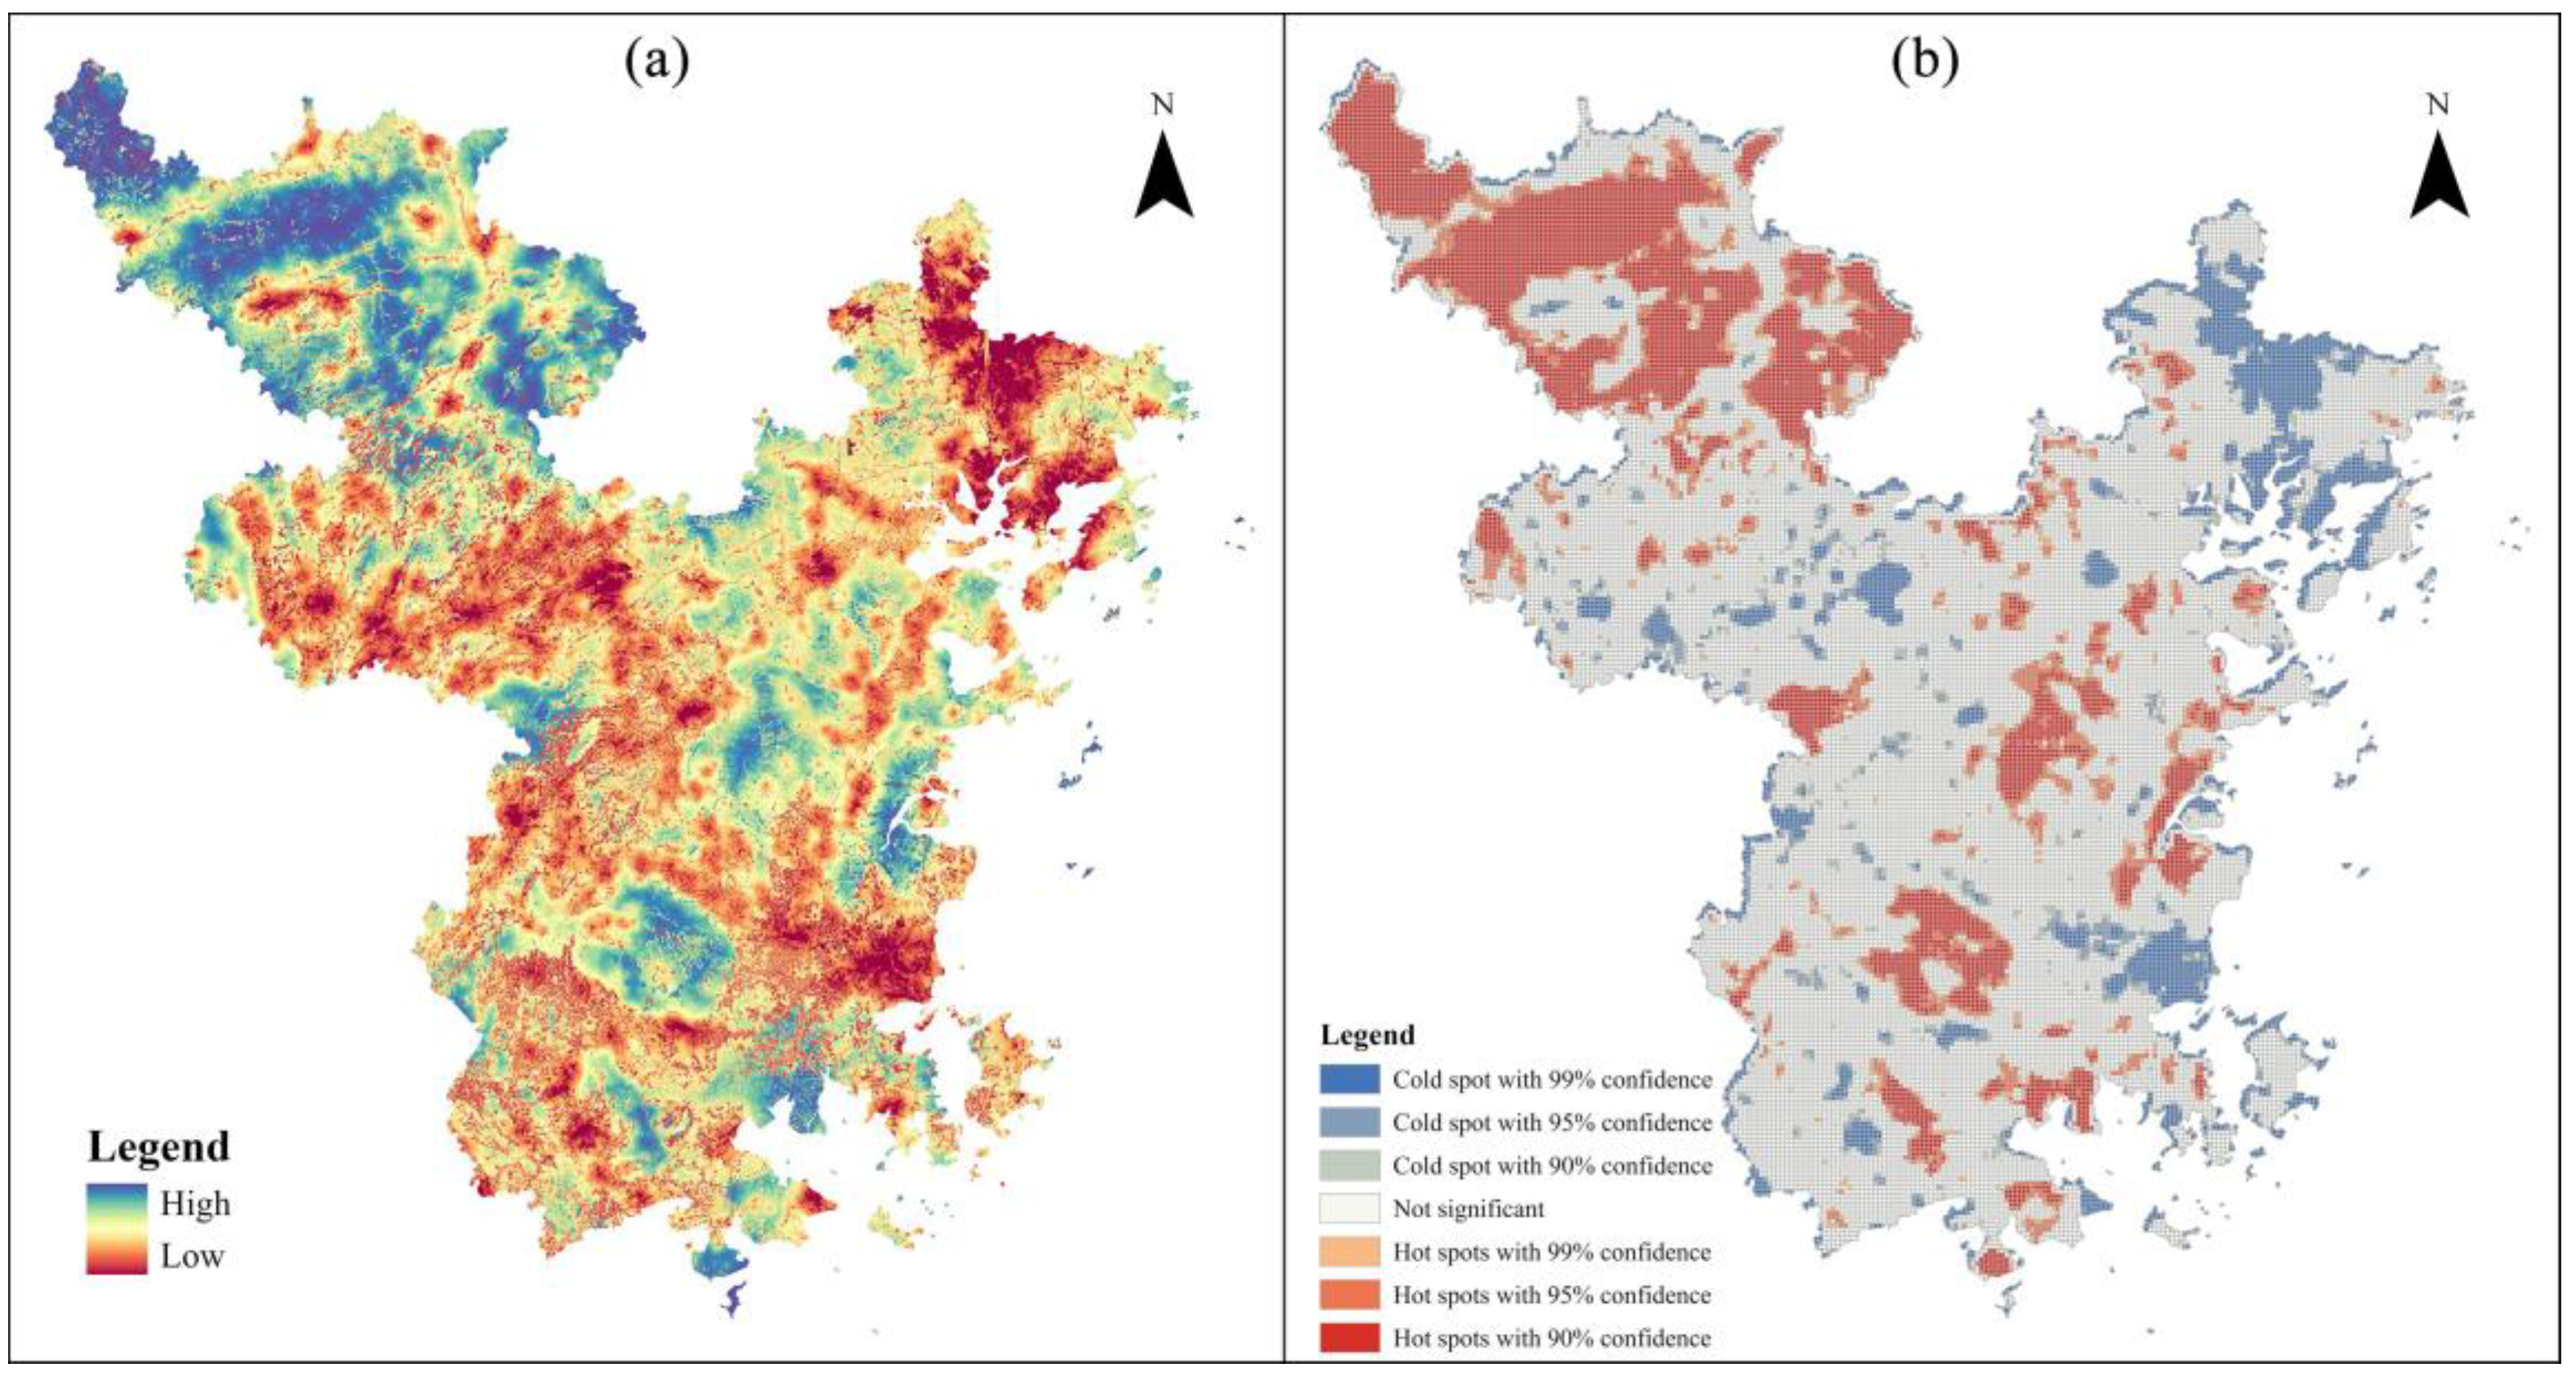
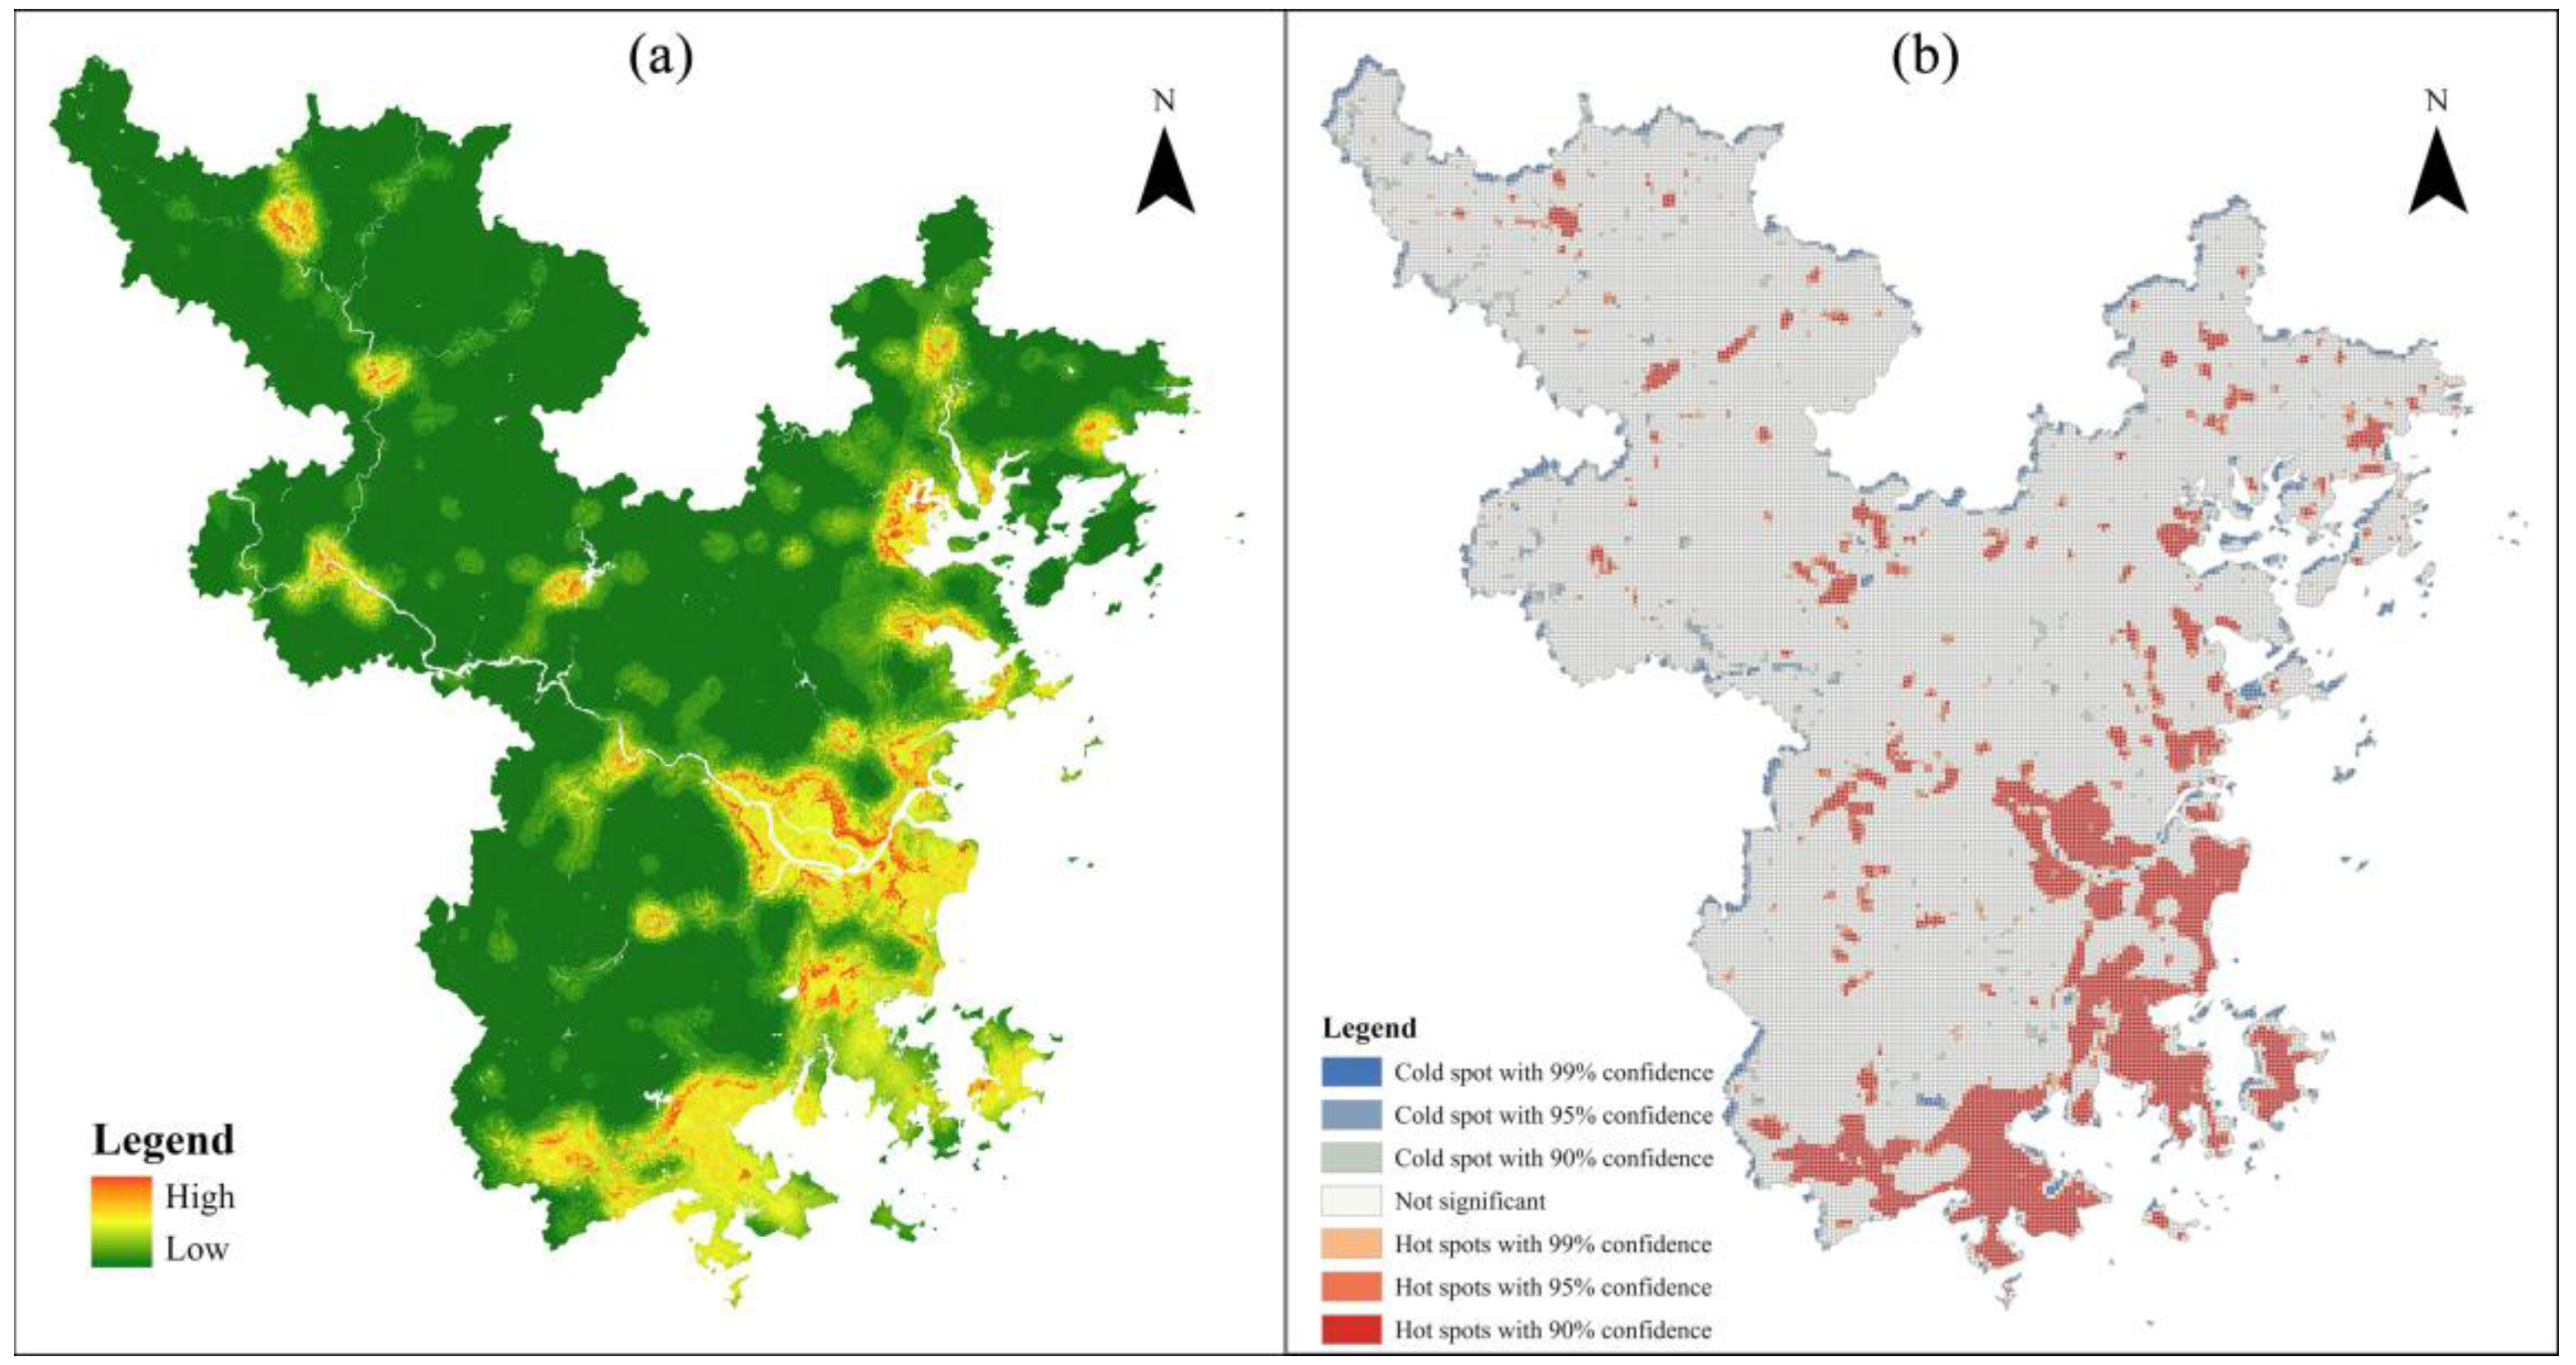
MSPA has significant advantages in identifying ecological sources. It comprehensively considers the degree of ecological fragmentation and patch connectivity’s impact on regional ecosystems. By analyzing spatial landscape structures, MSPA can accurately identify various ecological source types, including core, islet, perforation, edge, bridge, loop, and background areas, thereby enhancing the scientific and precise construction of ecological security patterns (ESPs). Especially for smaller core areas, MSPA optimizes edge effect width to effectively mitigate its negative impacts and enhance the ecological stability of core areas. Furthermore, by integrating landscape connectivity analysis, MSPA can set a maximum diffusion distance to accurately evaluate patch connectivity, ensuring that identified ecological sources maintain effective ecological functionality in real-world conditions.
This research utilized morphological spatial pattern analysis (MSPA) alongside landscape linkage techniques to pinpoint ecological core zones, thoroughly evaluating habitat fragmentation levels and examining how patch interconnections affect local ecological networks. Through MSP, edge effects exhibit a significant nonlinear impact on the number of core areas, as varying edge effect widths can alter the number identified. Smaller core areas are particularly susceptible to edge effects; thus, selecting an appropriate width is crucial for MSPA. According to relevant studies, the effective corridor width for wildlife such as black bears and gray wolves is typically 500 m, while the predation edge effect for forest birds extends to approximately 600 m [
43,
44]. Therefore, this study adopted a maximum edge effect width of 300 m to identify ecological sources, excluding smaller sources to meet the migration needs of forest-dwelling wildlife. When selecting ecological sources, we set the maximum diffusion distance to 20 km and applied landscape connectivity criteria for selection. For medium-to-large-scale areas, the diffusion distance should not be excessively large, as this may result in corridor lengths exceeding the actual dispersal capacity of certain species, thereby overestimating patch connectivity. Additionally, our analysis examined how varying dPC measurements influenced both the overall size of ecological source zones and the number of habitat fragments, ultimately selecting dPC > 1 as the screening threshold.
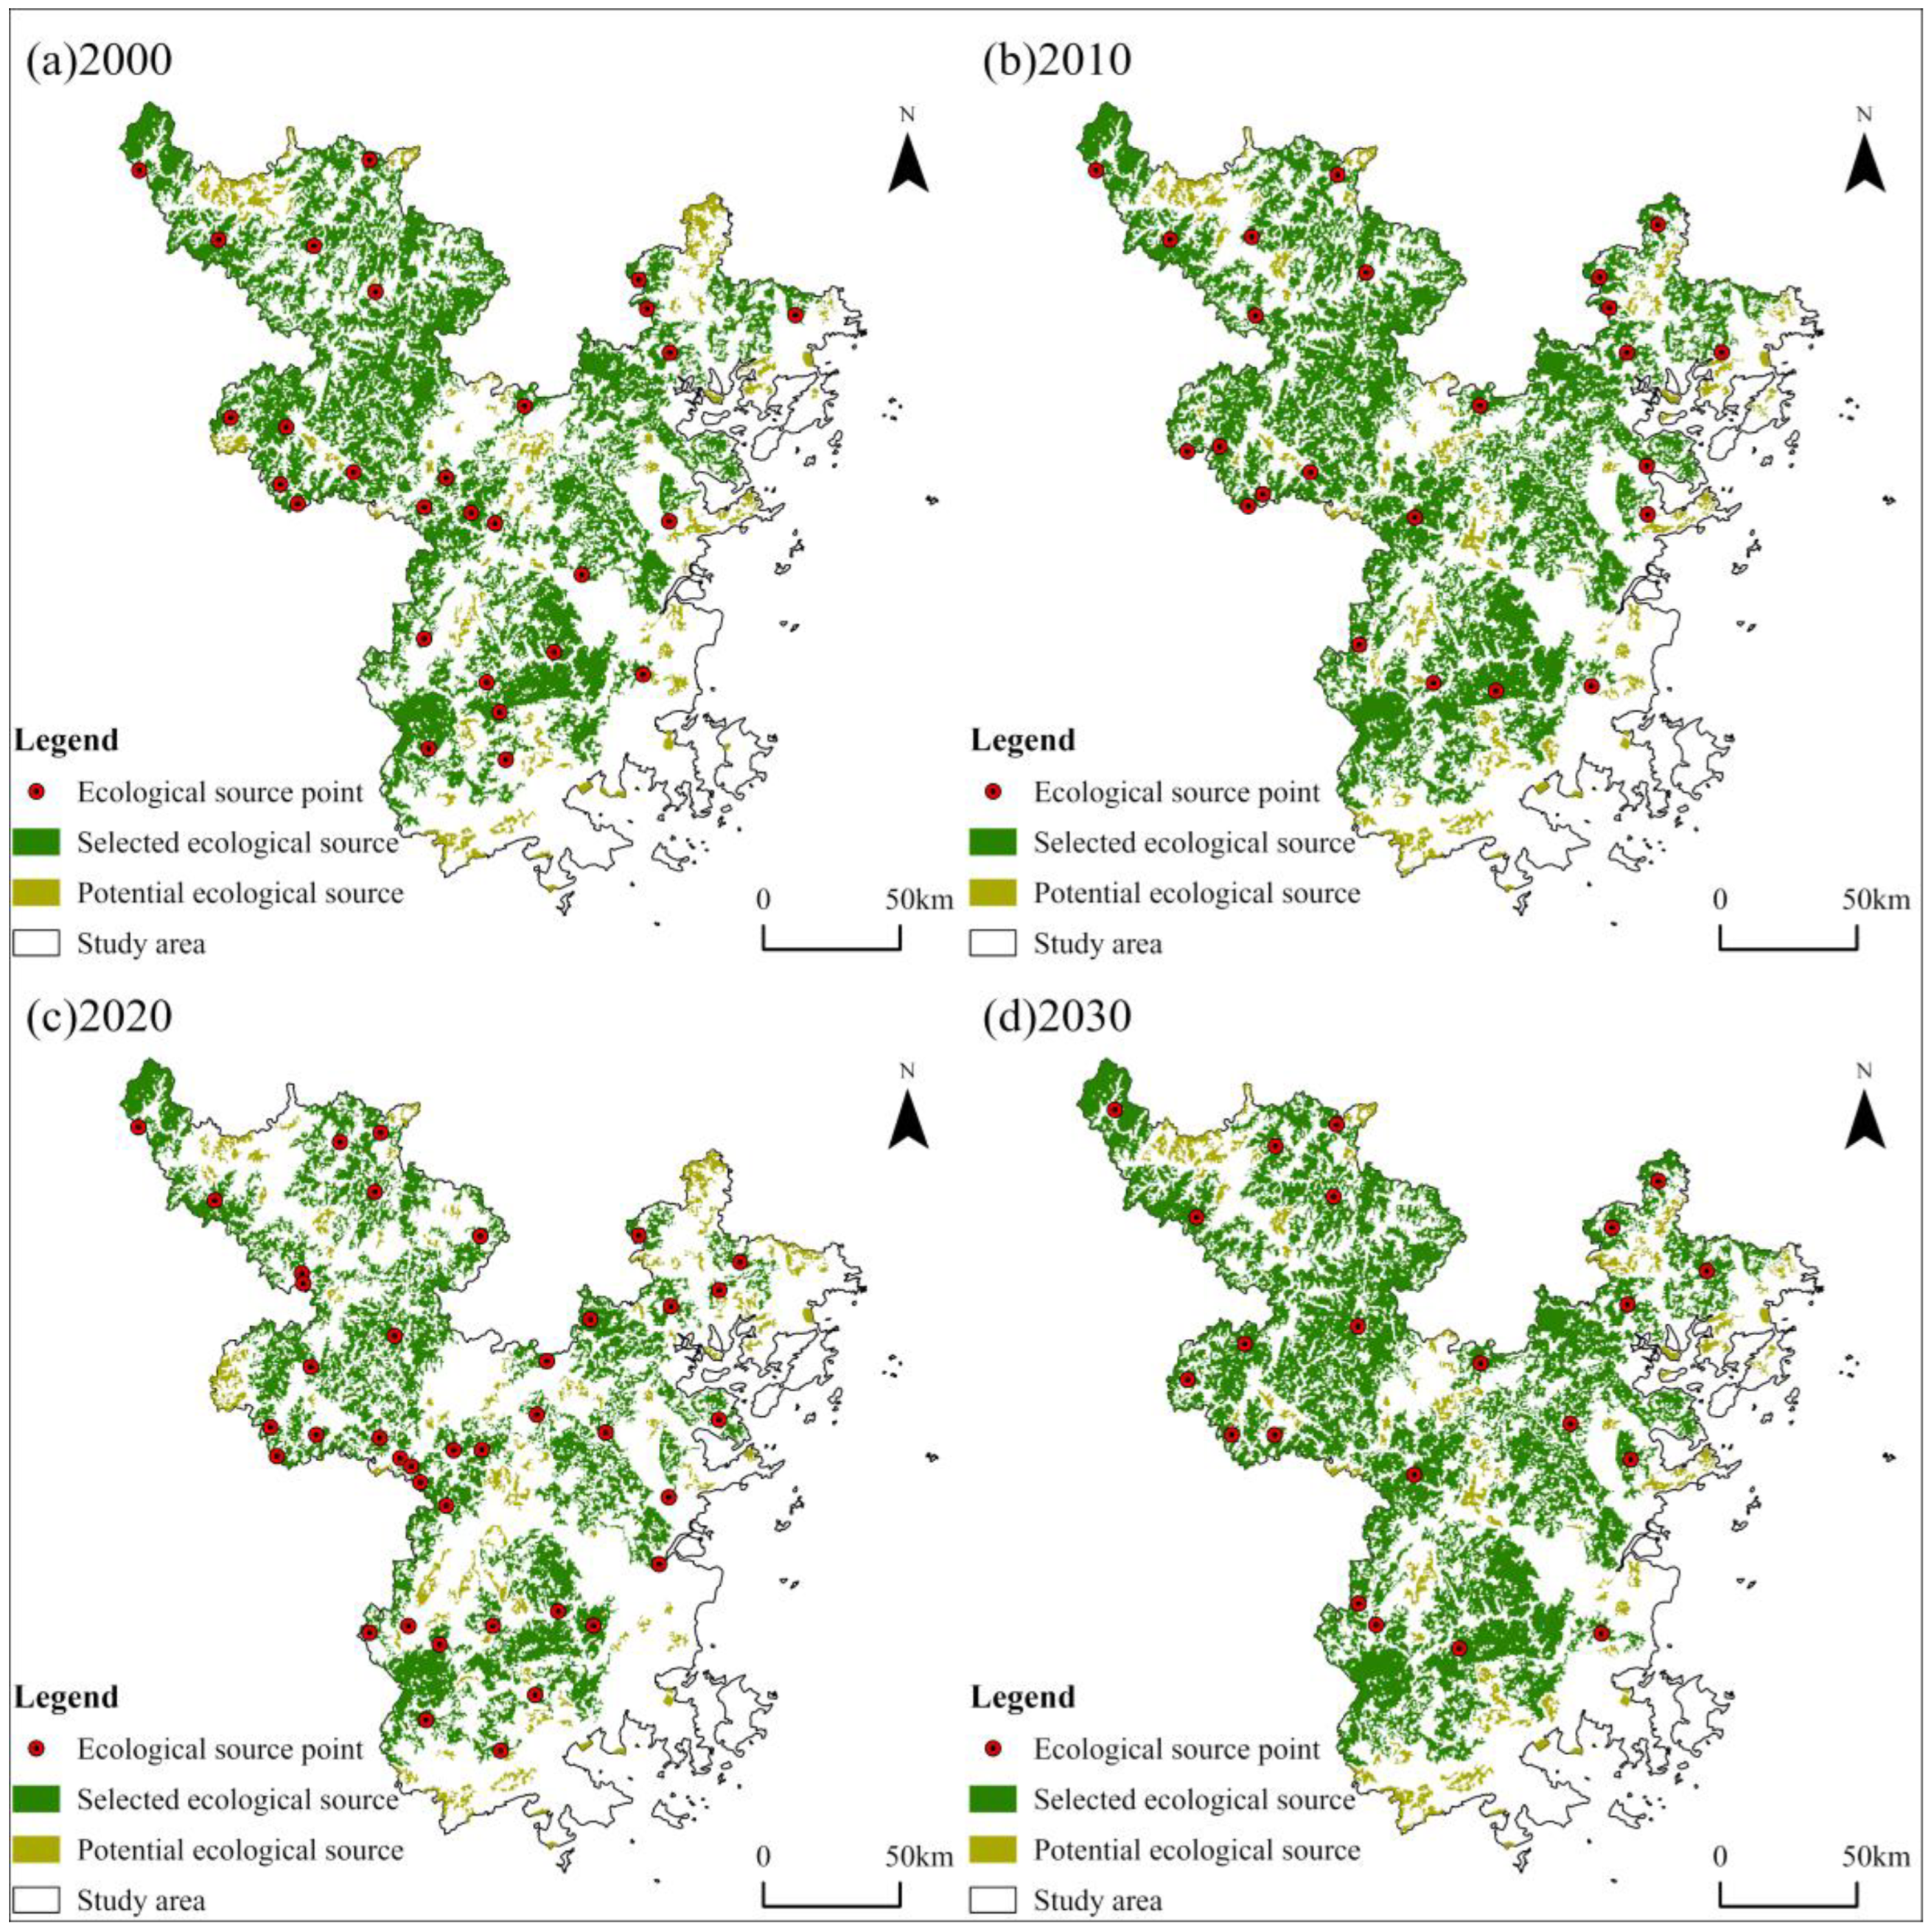
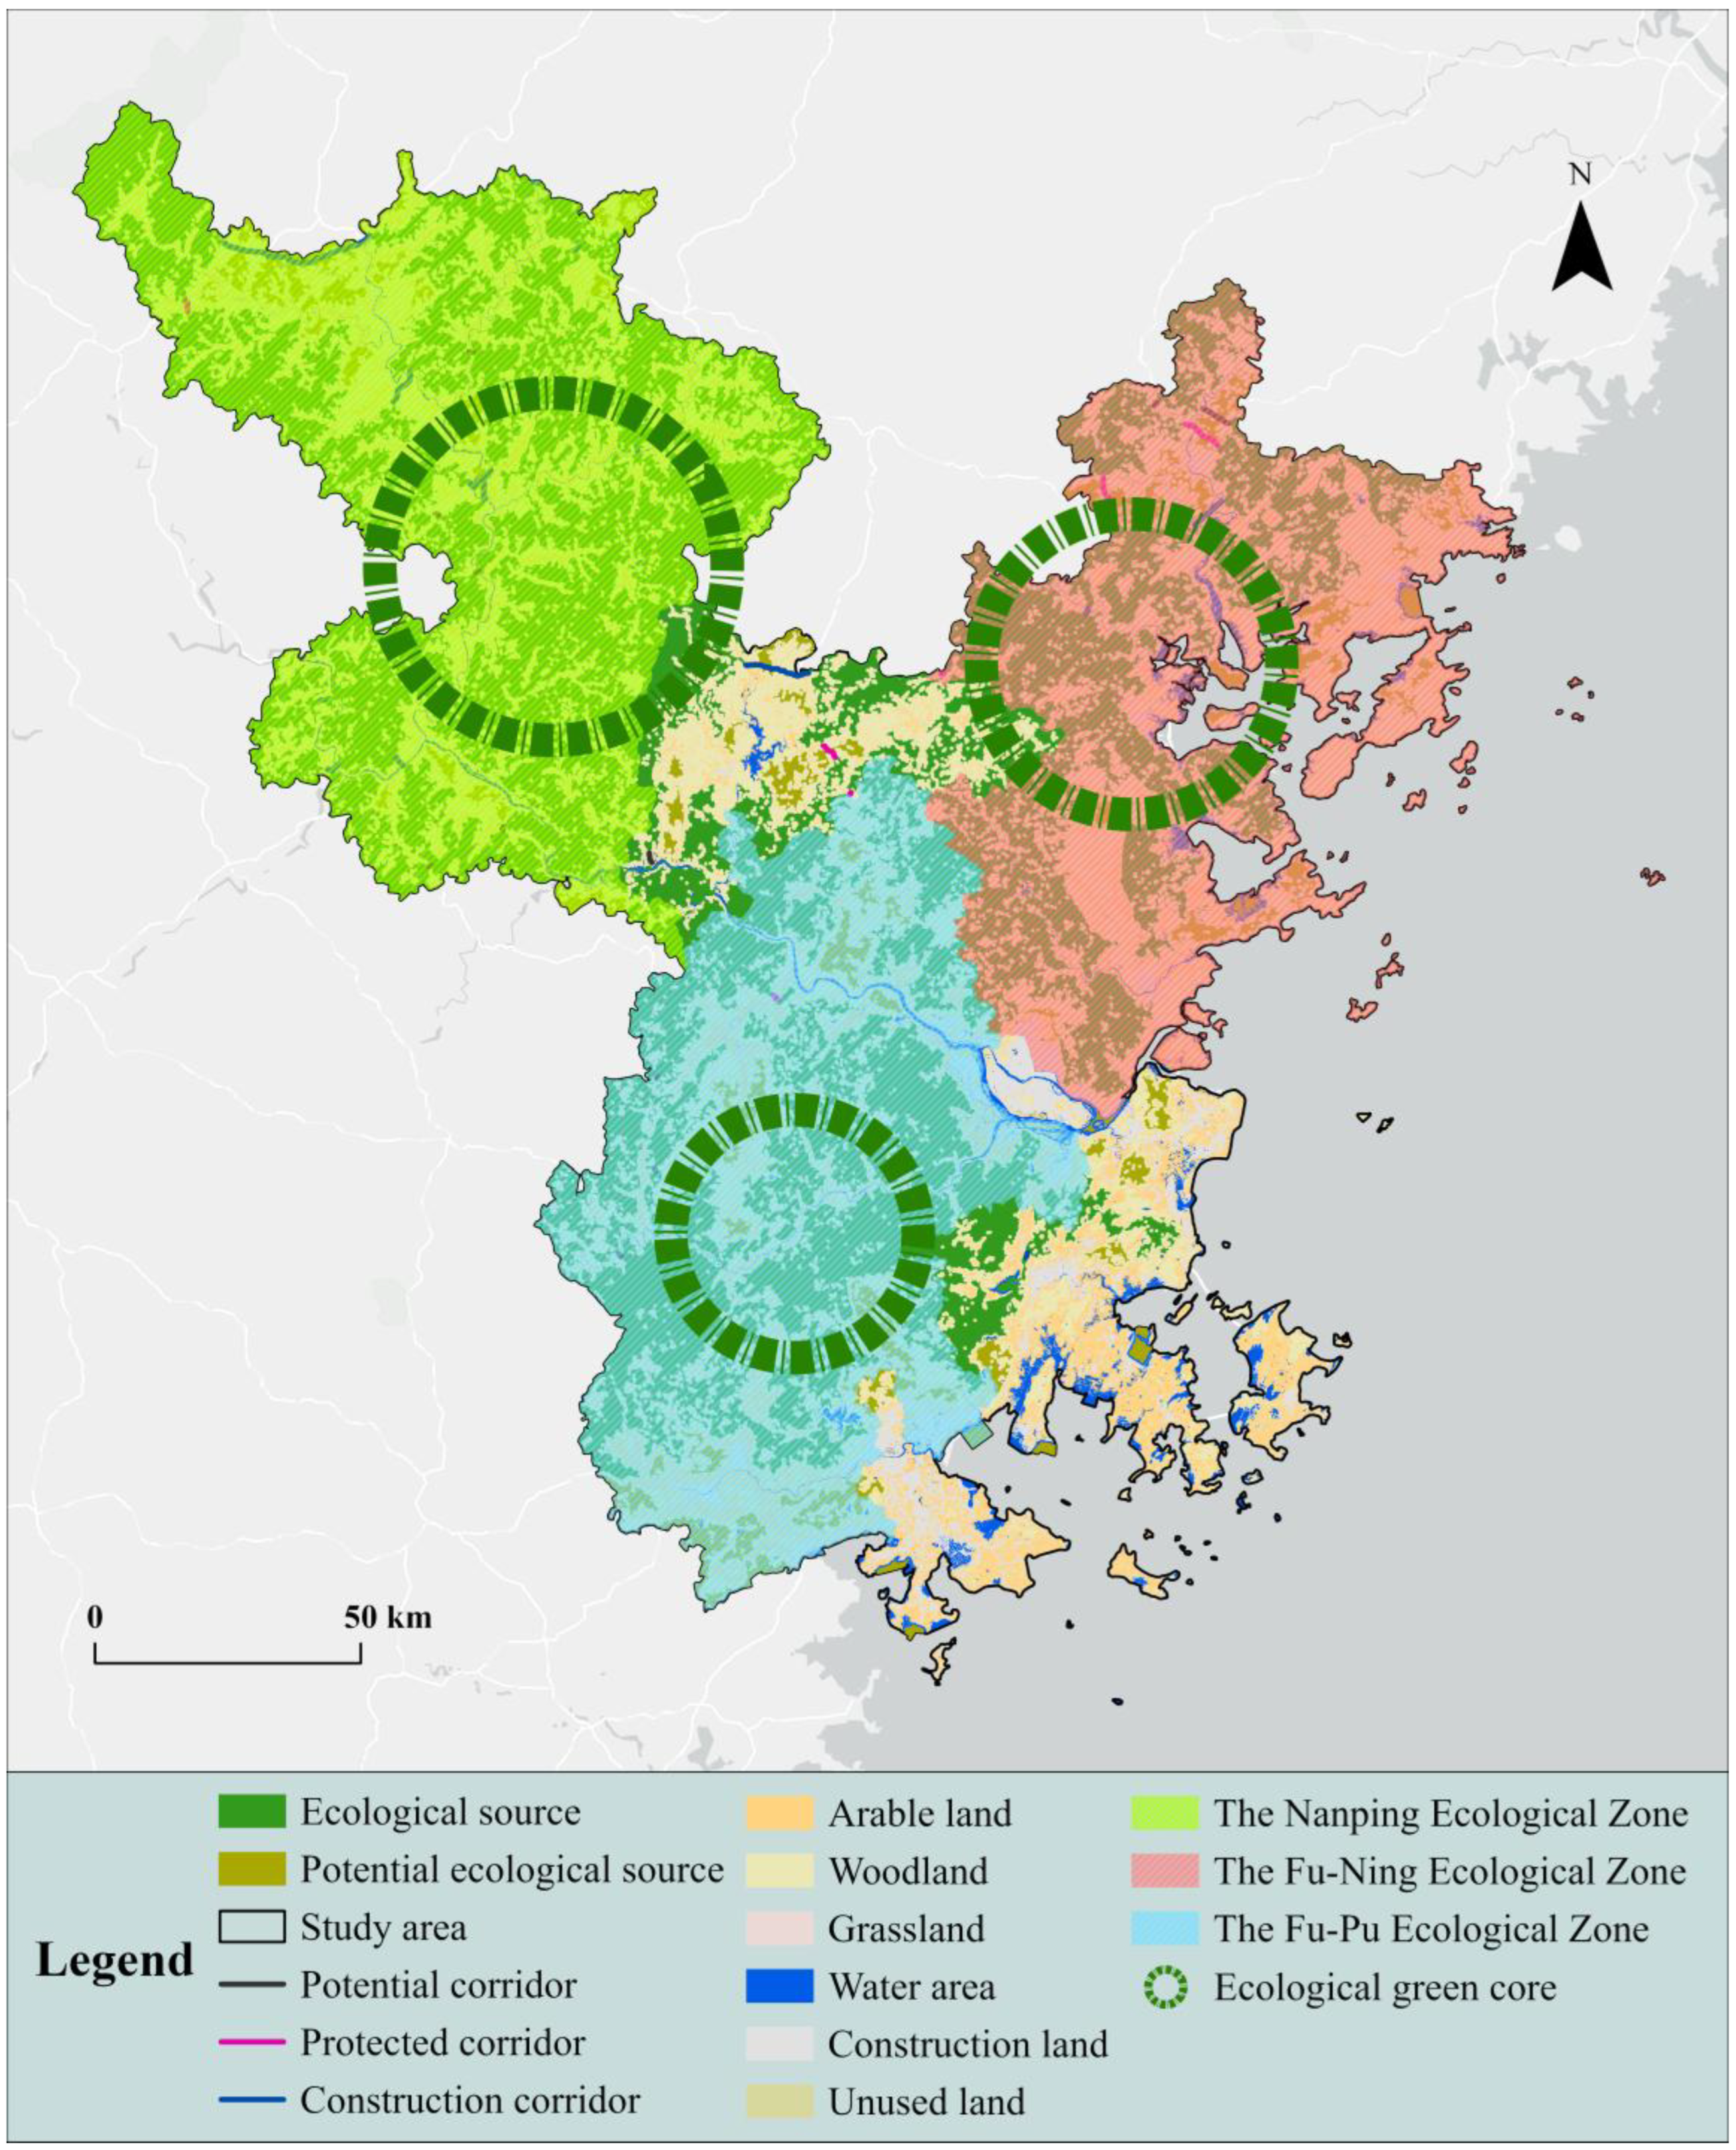
As shown in
Figure 7, in the identified ecological sources, only certain areas of Ningde City in the northeast and Nanping City in the northwest were designated as ecological sources, while other areas outside the study region were not included. This does not imply that these areas lack ecological resources; rather, the vast forested land connected to surrounding large-scale forests provides high-quality habitats for wildlife, playing a vital role in enhancing ecological network stability and connectivity. Therefore, future ecological network studies should extend beyond the current study area’s boundaries and consider larger-scale ecological network patterns, such as the construction of an ESP in the Guangdong–Fujian–Zhejiang coastal urban agglomeration.
5.3. Advantages of Circuit Theory in Corridor Identification
Circuit theory has significant advantages in identifying ecological corridors, particularly in its precise evaluation of corridor connectivity and functionality. By conceptualizing the landscape as a resistance network, circuit theory effectively simulates species migration paths and dispersal processes, thereby identifying key ecological corridors. This approach quantifies the permeability and resistance of different pathways in the landscape, determines optimal migration routes, and overcomes the subjectivity and limitations of traditional corridor identification methods.
In this study, circuit theory principles facilitated the accurate pinpointing of crucial wildlife passageways across the examined region. This analytical approach revealed essential connectivity pathways that maintain ecological functionality within the designated landscape. The methodology successfully determined strategic biological linkages necessary for species movement and genetic exchange. Through electrical circuit analogies, researchers mapped fundamental habitat connections that sustain biodiversity in the investigation zone. The technique provided reliable detection of vital landscape conduits supporting ecological processes in the target environment, ensuring their effective connection to important ecological sources and enhancing the overall stability and connectivity of the ecological network. Moreover, circuit theory is applicable to analyses at multiple scales, accommodating ecological network planning needs from local to regional and even cross-regional levels, providing robust theoretical support and practical guidance for ecological corridor conservation and construction in the context of urbanization.
5.4. Optimization Recommendations
The ecological sources and corridors identified in this study should be incorporated into regional ecological protection red lines and protected areas. Priority should be given to protecting areas with high ecological flow, particularly in Nanping and Ningde, to ensure that the connectivity of their core habitats is not disrupted, thus maintaining long-term ecological resilience. Based on the spatial distribution of HQ and ER, combined with the ESP, environmental rehabilitation efforts must be prioritized around key biological hubs within the Fuzhou–Putian region, accompanied by the establishment of specialized ecological offset policies. The restoration initiatives should concentrate on strategic locations exhibiting significant biodiversity value, while concurrently developing customized compensation frameworks to support conservation objectives. Implementing these measures requires careful consideration of local ecosystem dynamics and the creation of adaptive incentive structures for sustainable environmental management. According to the study’s findings, although forested areas have increased compared to those in 2020, some regions, such as the southeastern part of Fuzhou and the western part of Putian, are severely degraded. These areas should strictly enforce afforestation policies to improve their fragmentation. Protective boundaries must be created surrounding wildlife passageways, transformed into conservation areas or nature trails, to not only protect the environment but also promote public health and well-being.
5.5. Limitations and Future Research Directions
Amidst accelerating urban development, alterations in land utilization patterns exert significant impacts on ecosystems, representing a crucial area of investigation both presently and in upcoming research. Consequently, our research incorporates the PLUS framework, designed to facilitate detailed simulations of land cover changes, and combined it with models required for ESP construction to carry out dynamic simulations, thus constructing an ESP that aligns with the land use development trends of the Fuzhou metropolitan area. However, this study still has certain limitations. Firstly, while the PLUS framework effectively measured the influence of different drivers on land use transitions, the factor selection process retained elements of arbitrariness, with insufficient attention given to policy-related variables. Subsequent investigations might benefit from employing multi-criteria optimization techniques that systematically incorporate diverse determinants into the simulation framework, thereby improving the representation of nonlinear and temporal dynamics in land use evolution. Additionally, constrained by the current research parameters and model functionality, certain adjacent woodland zones beyond the designated study perimeter were not incorporated as ecological nodes. Given that extensive forest cover represents the dominant landscape feature in this region, expanding the geographical boundaries in future analyses could significantly improve the coherence of ecological connectivity assessments. Lastly, this study primarily focuses on research methods and model applications, with limited discussion on ecological optimization. Subsequent research could build on this foundation to further delve into ecological optimization evaluations to enhance the practical value of this research.


