
Policy-Driven Land Use Optimization for Carbon Neutrality: A PLUS-InVEST Model Coupling Approach in the Chengdu–Chongqing Economic Circle

Abstract
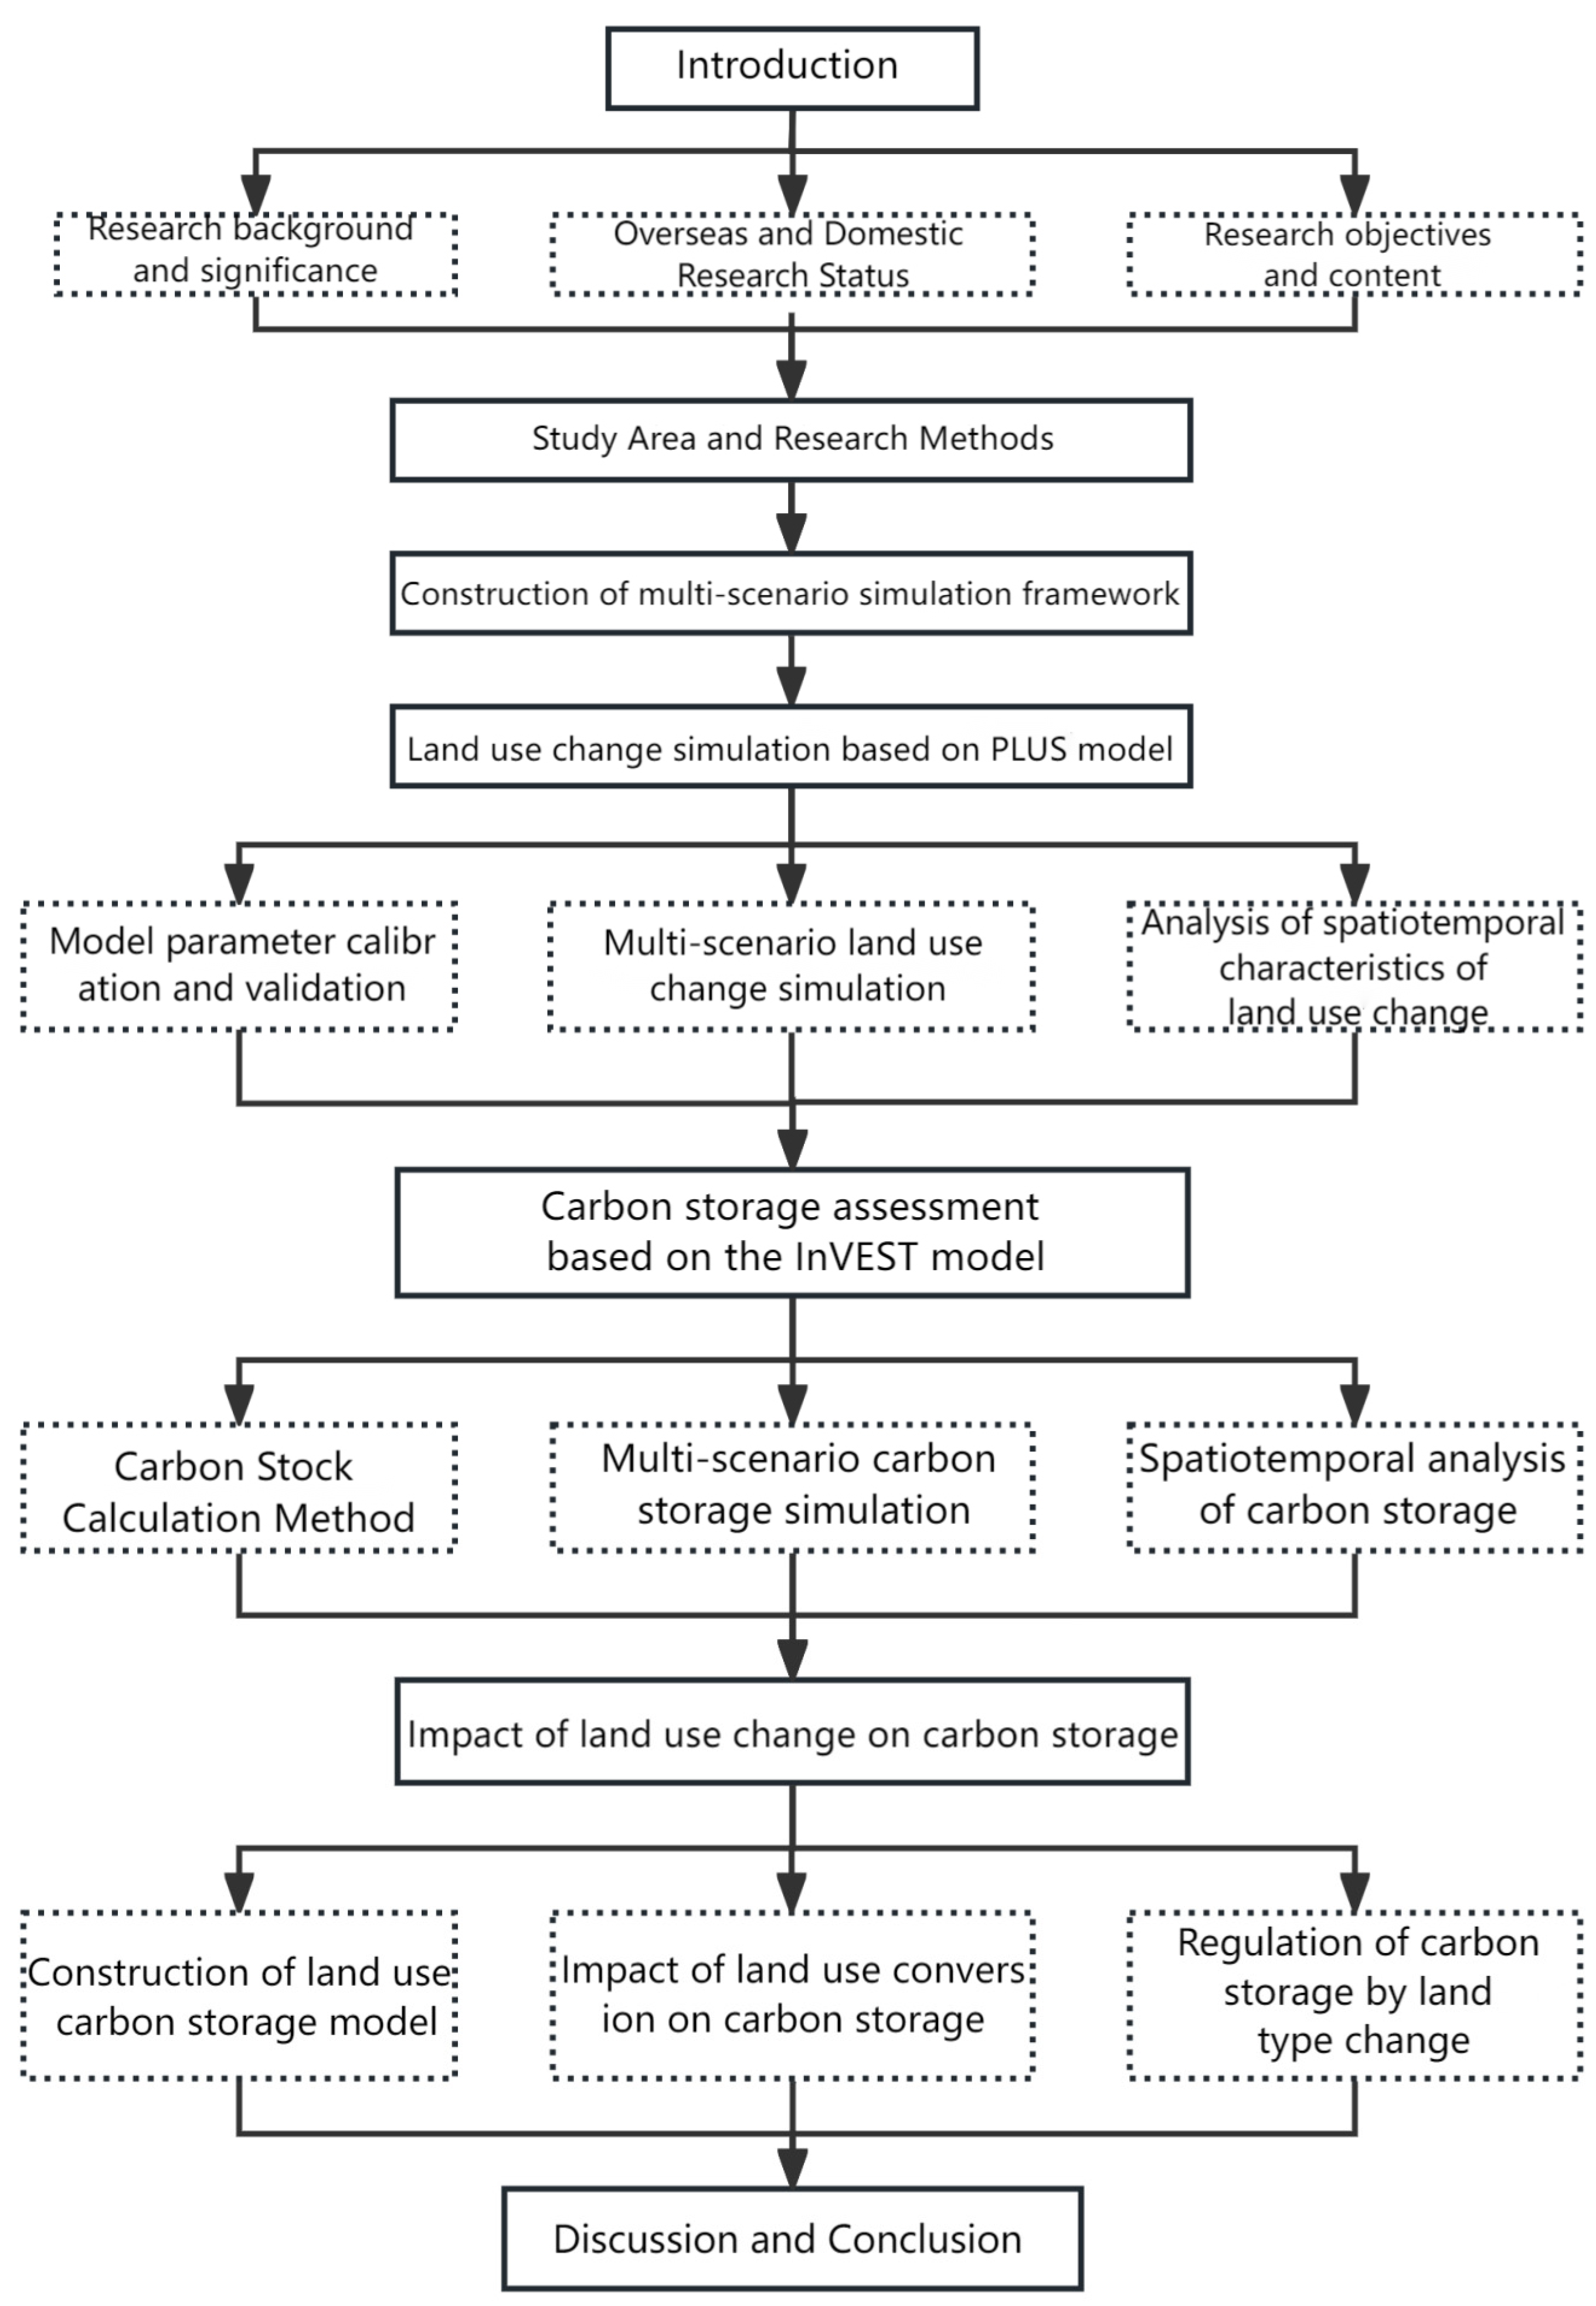
1. Introduction
2. Materials and Methods
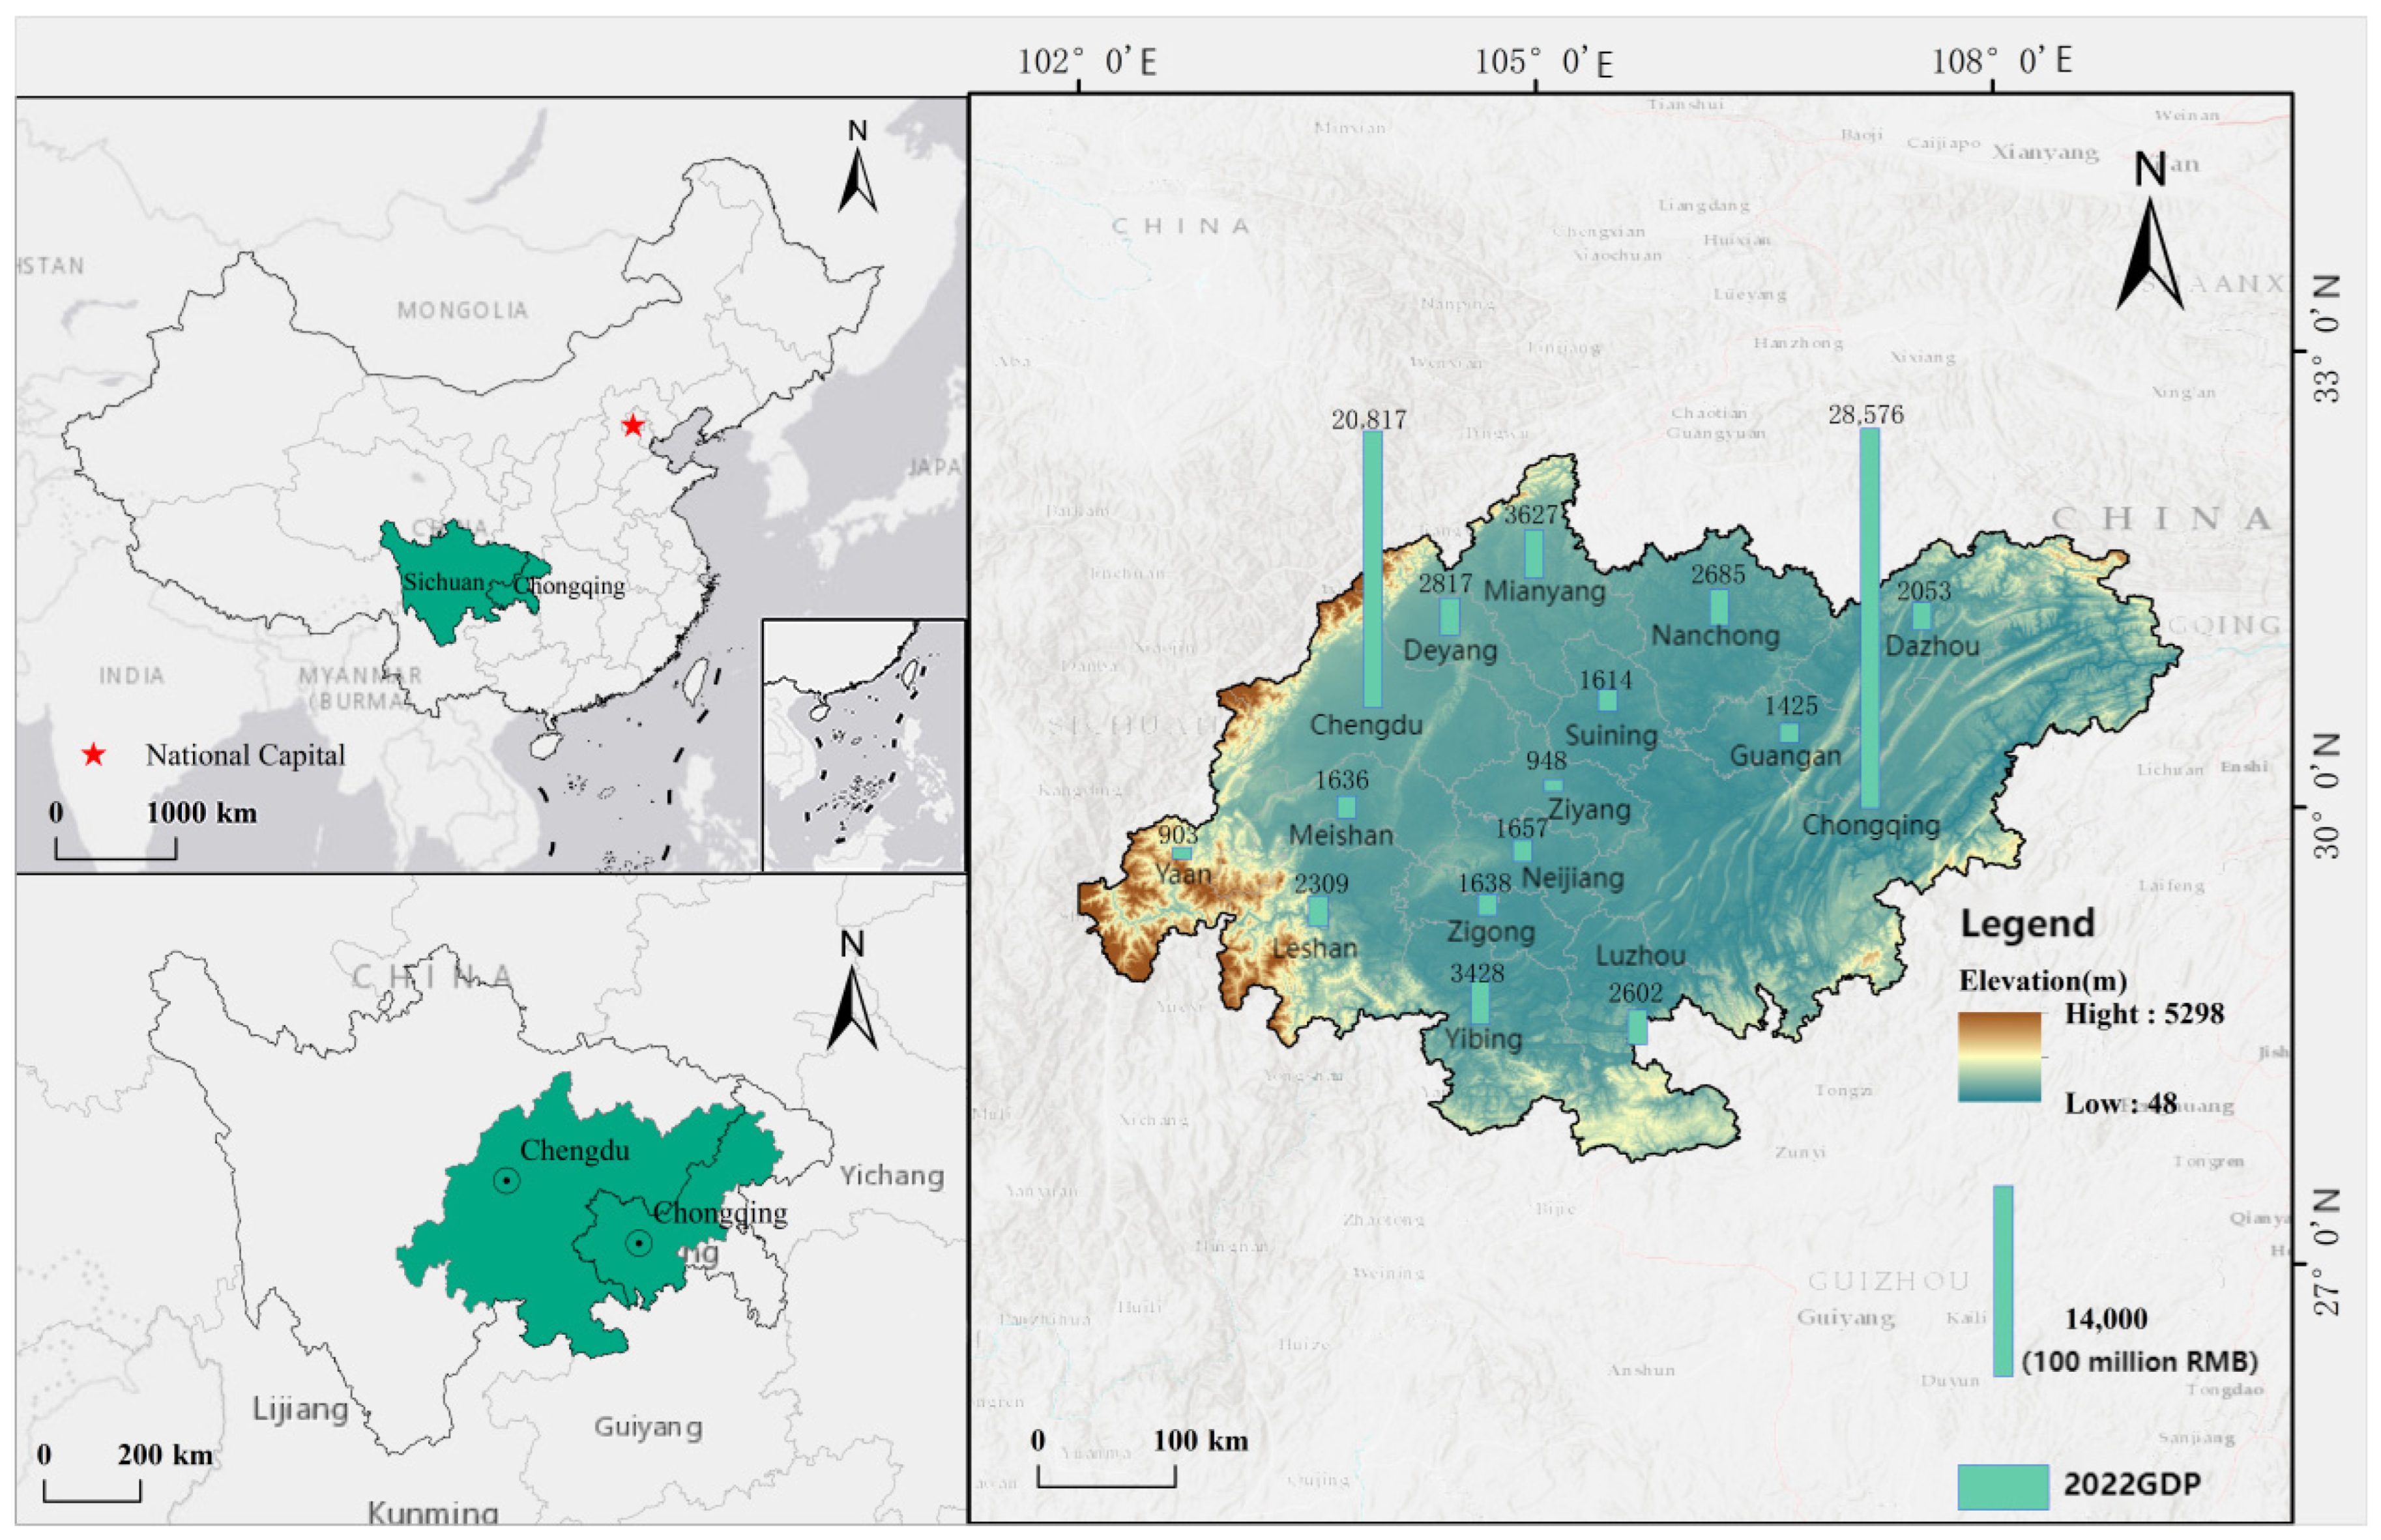
2.1. Study Area
2.2. Data Source and Processing
2.3. Research Methods
2.3.1. PLUS Model
2.3.2. Land Use Transfer Matrix
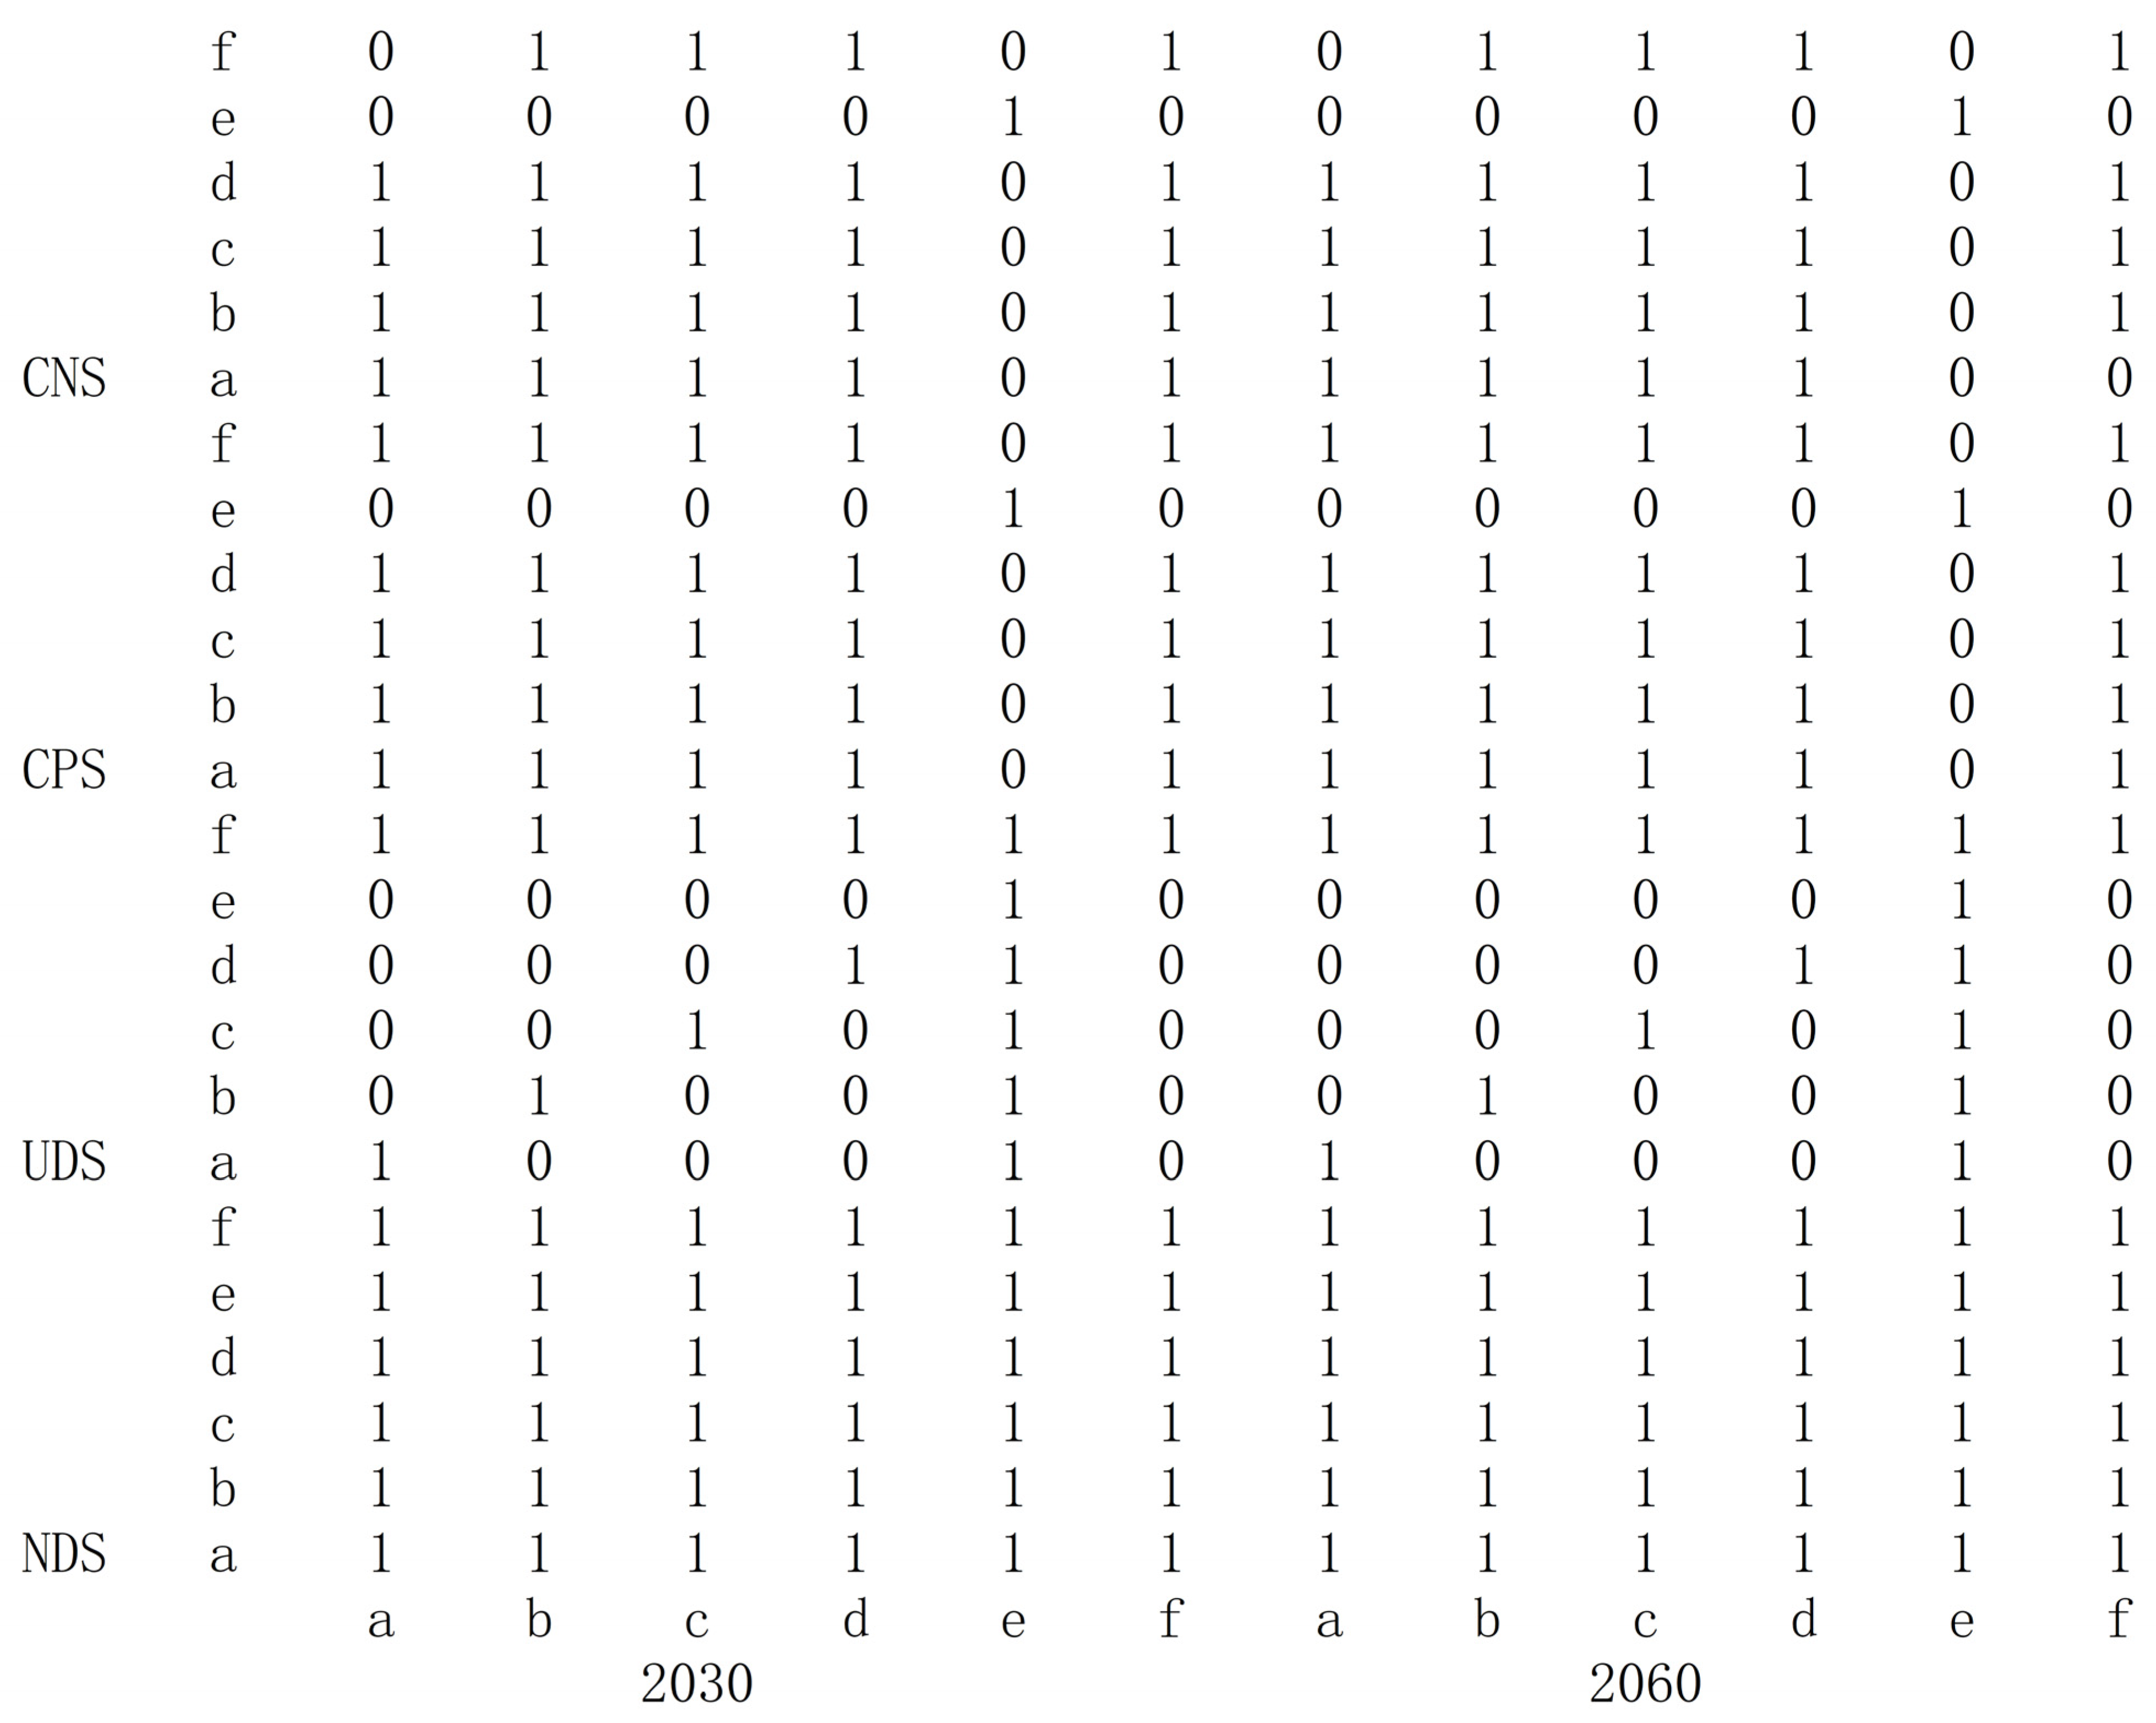
2.3.3. Scenario Design
2.3.4. InVEST Model
3. Results Analysis
3.1. Dynamics in Land Use from 2000 to 2060
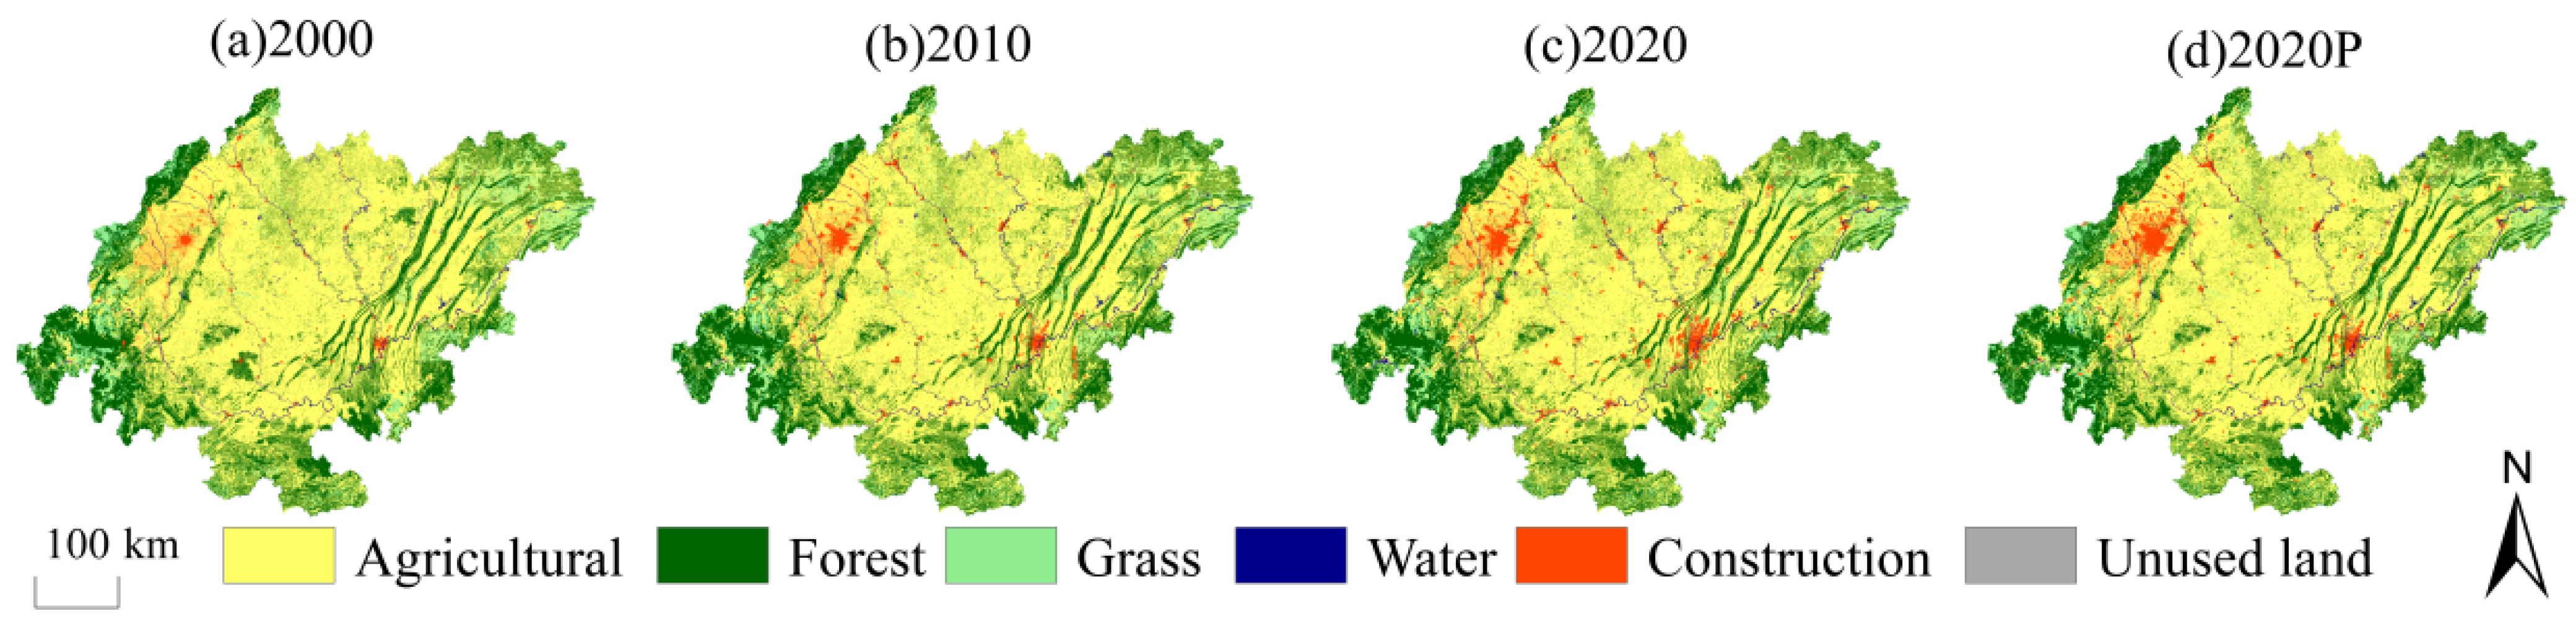
3.1.1. Spatiotemporal Characteristics of Land Use Dynamics
3.1.2. Dynamics in Land Use from 2000 to 2020
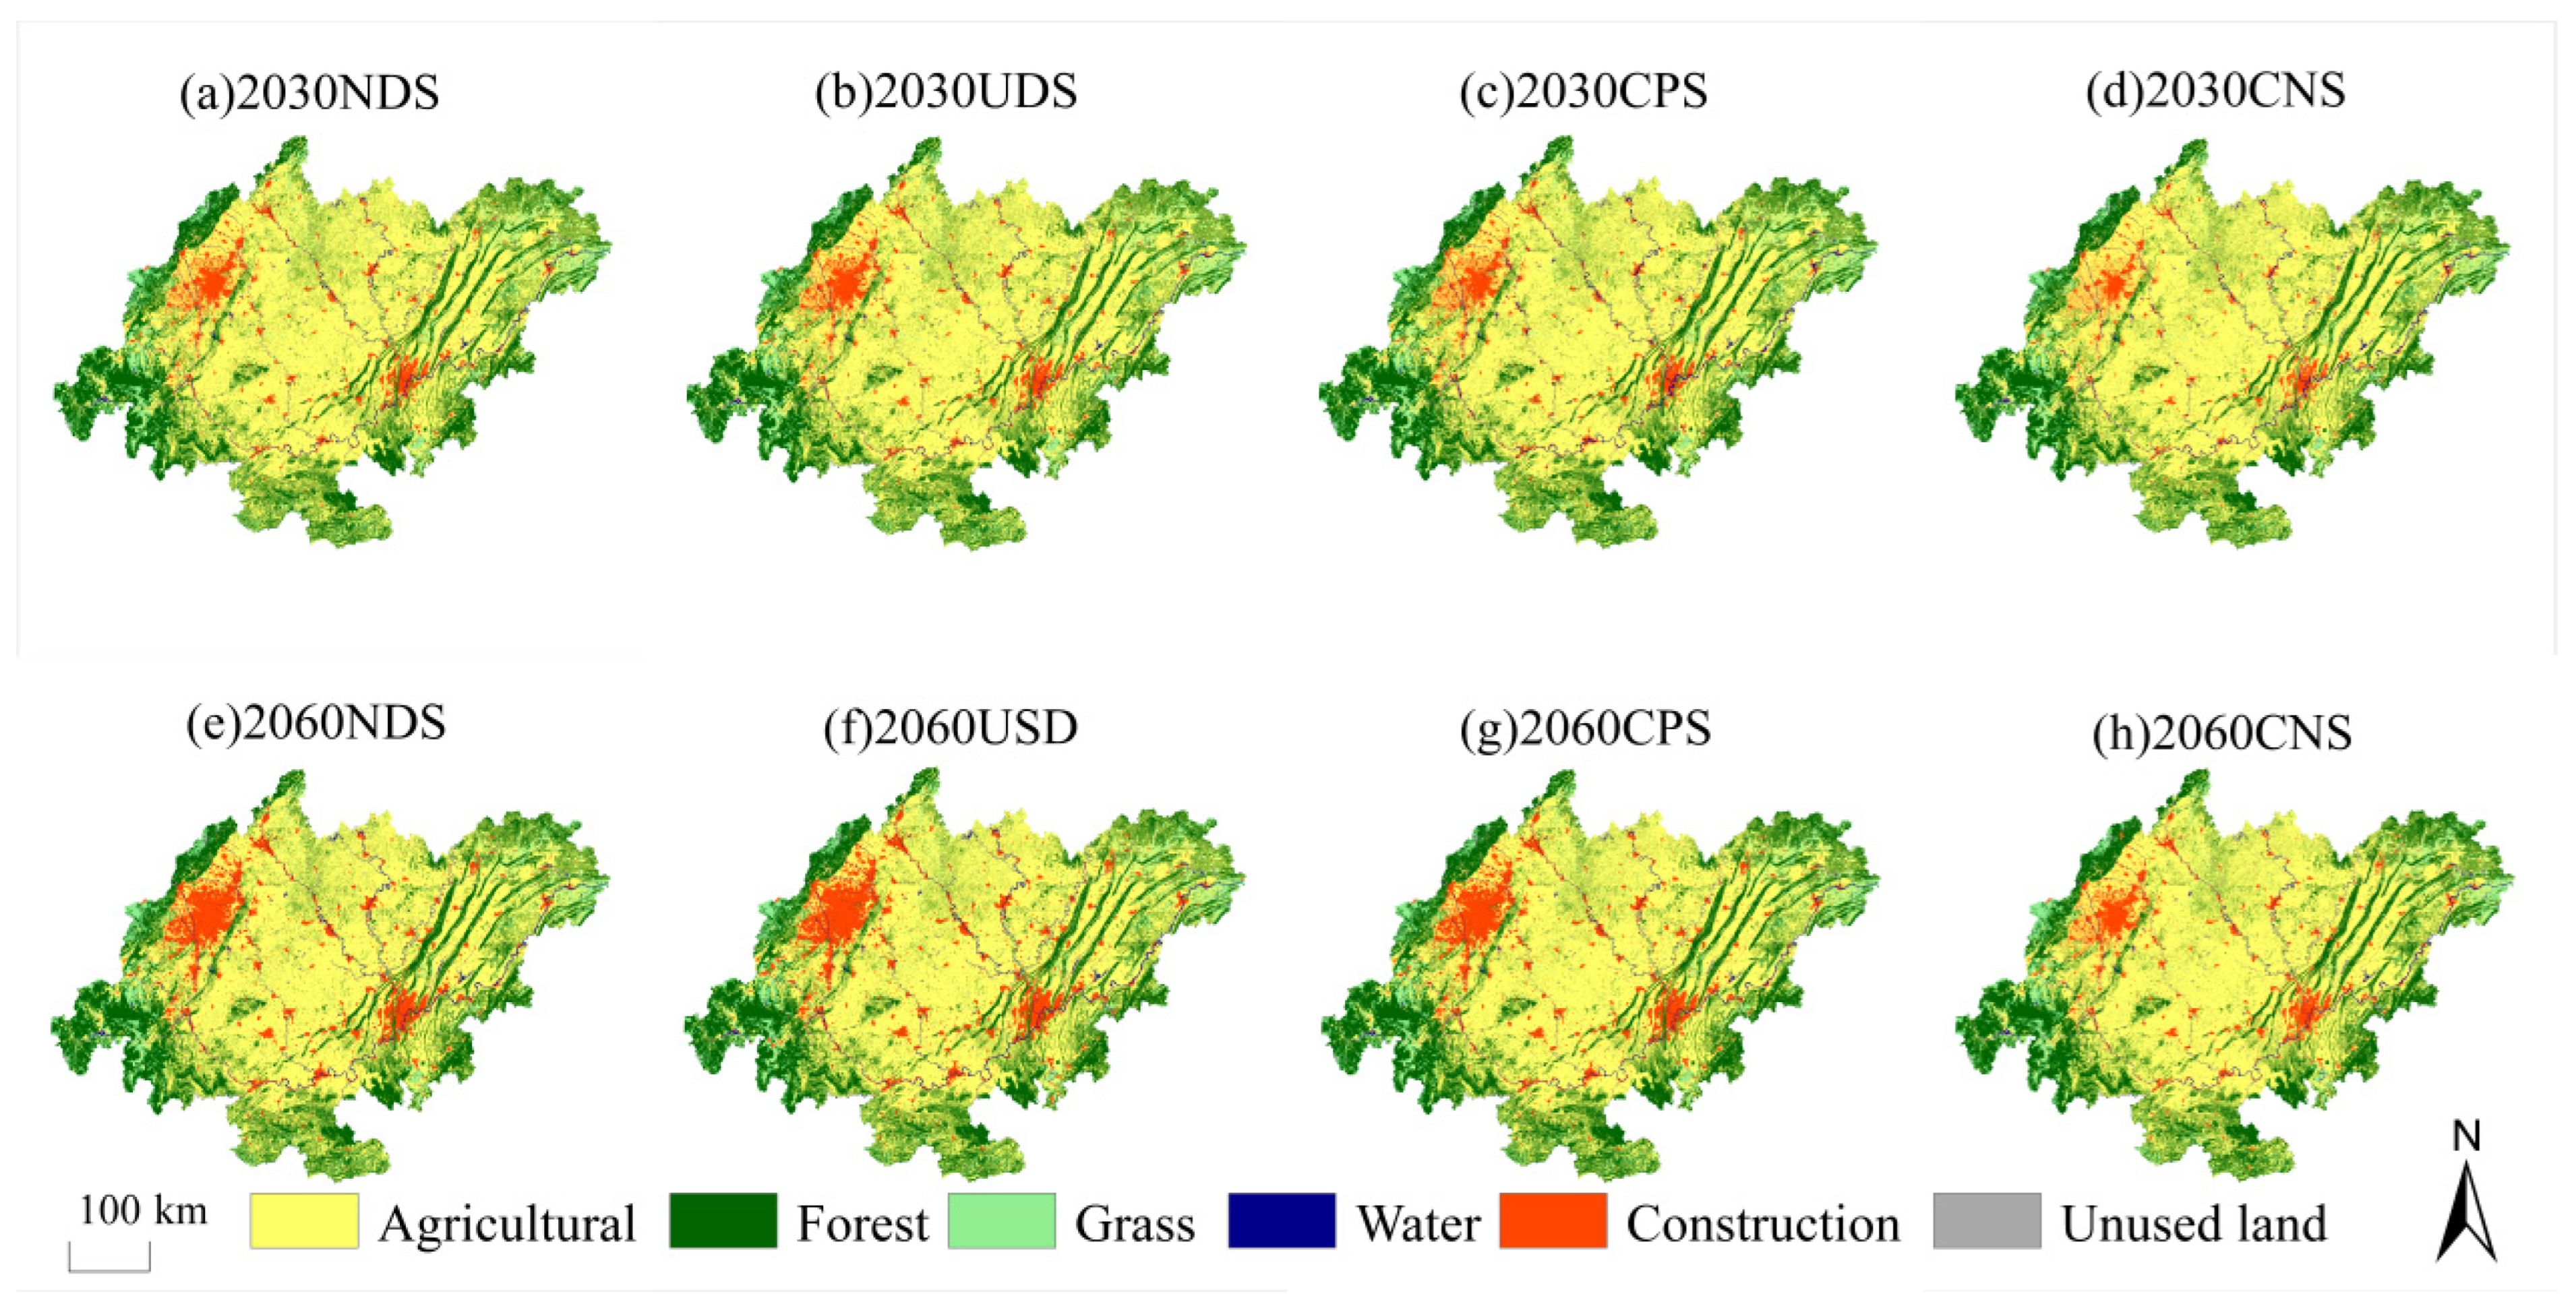
3.1.3. Multi-Scenario Prediction of Future Land Use
3.2. Dynamics in Carbon Storage from 2000 to 2060
3.2.1. Spatial and Temporal Characteristics of Carbon Storage
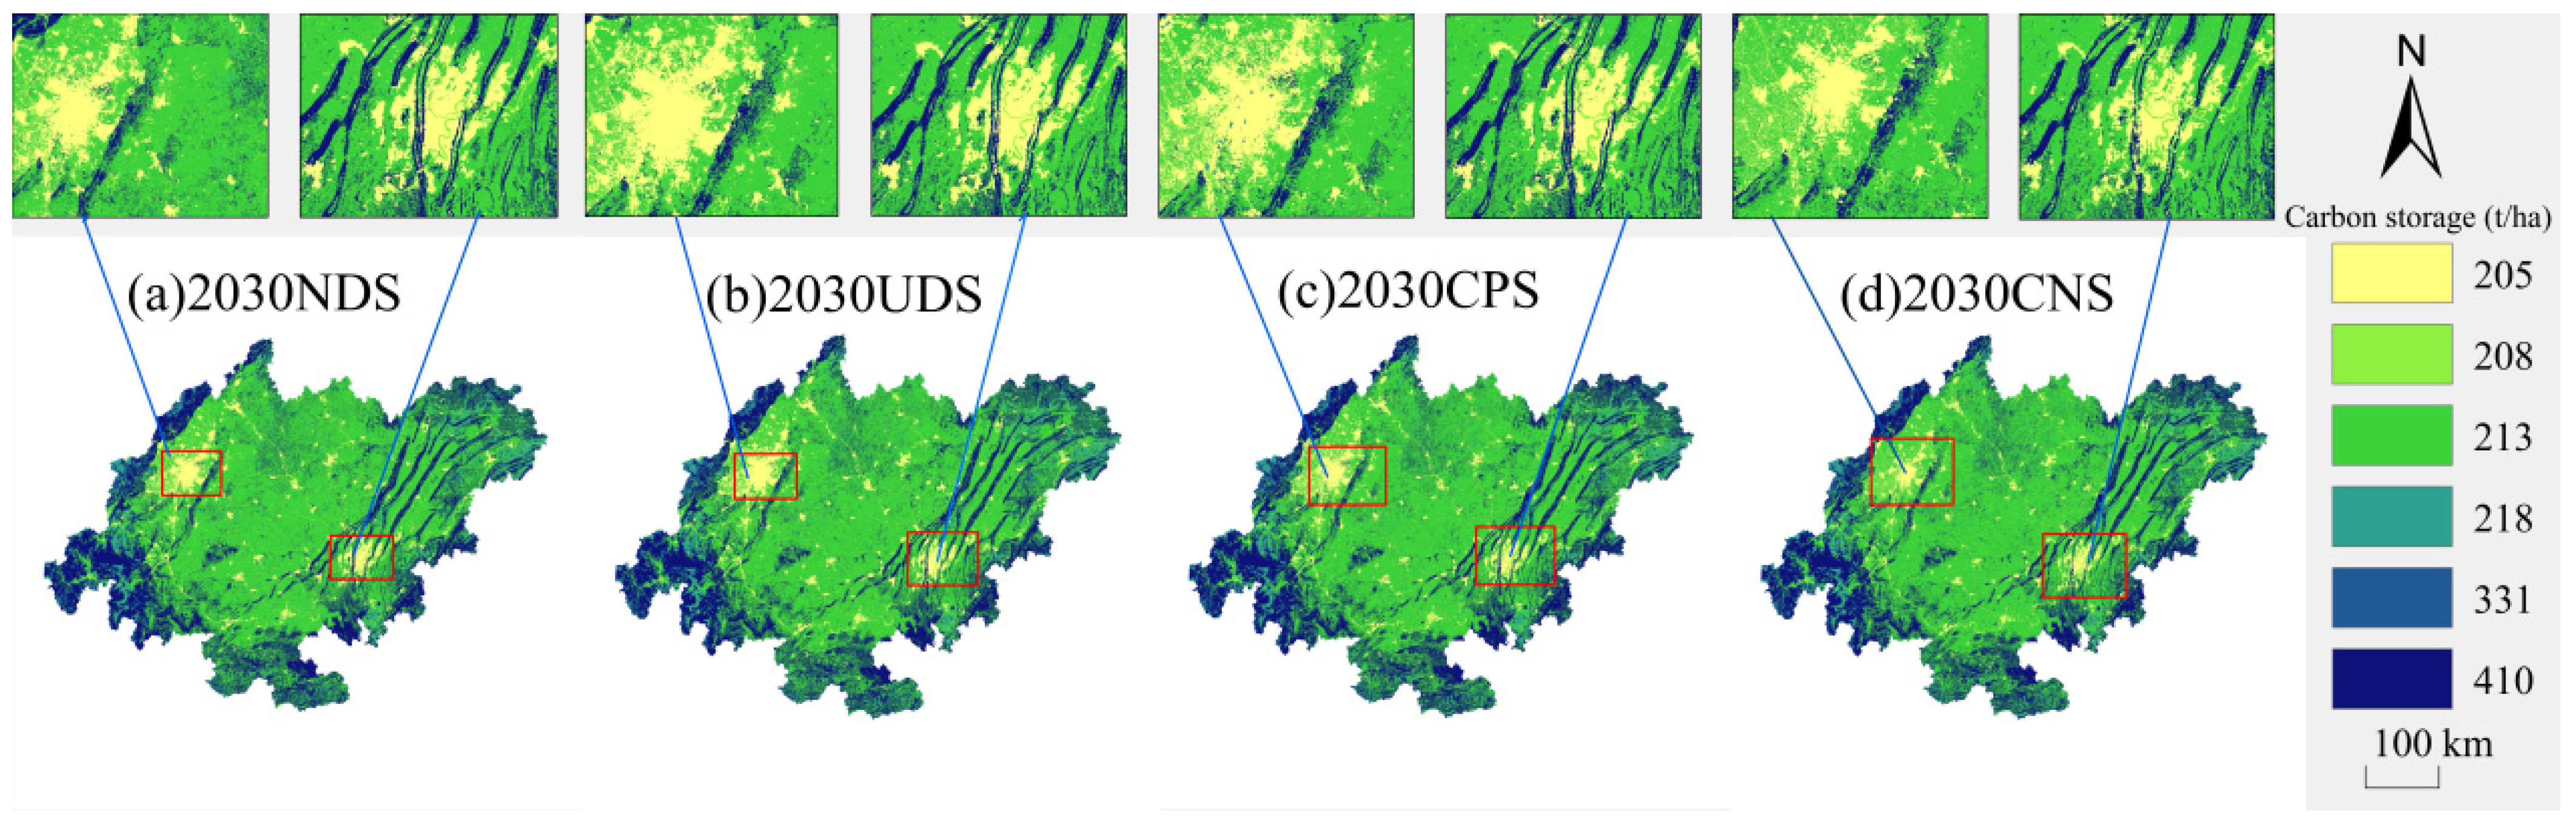
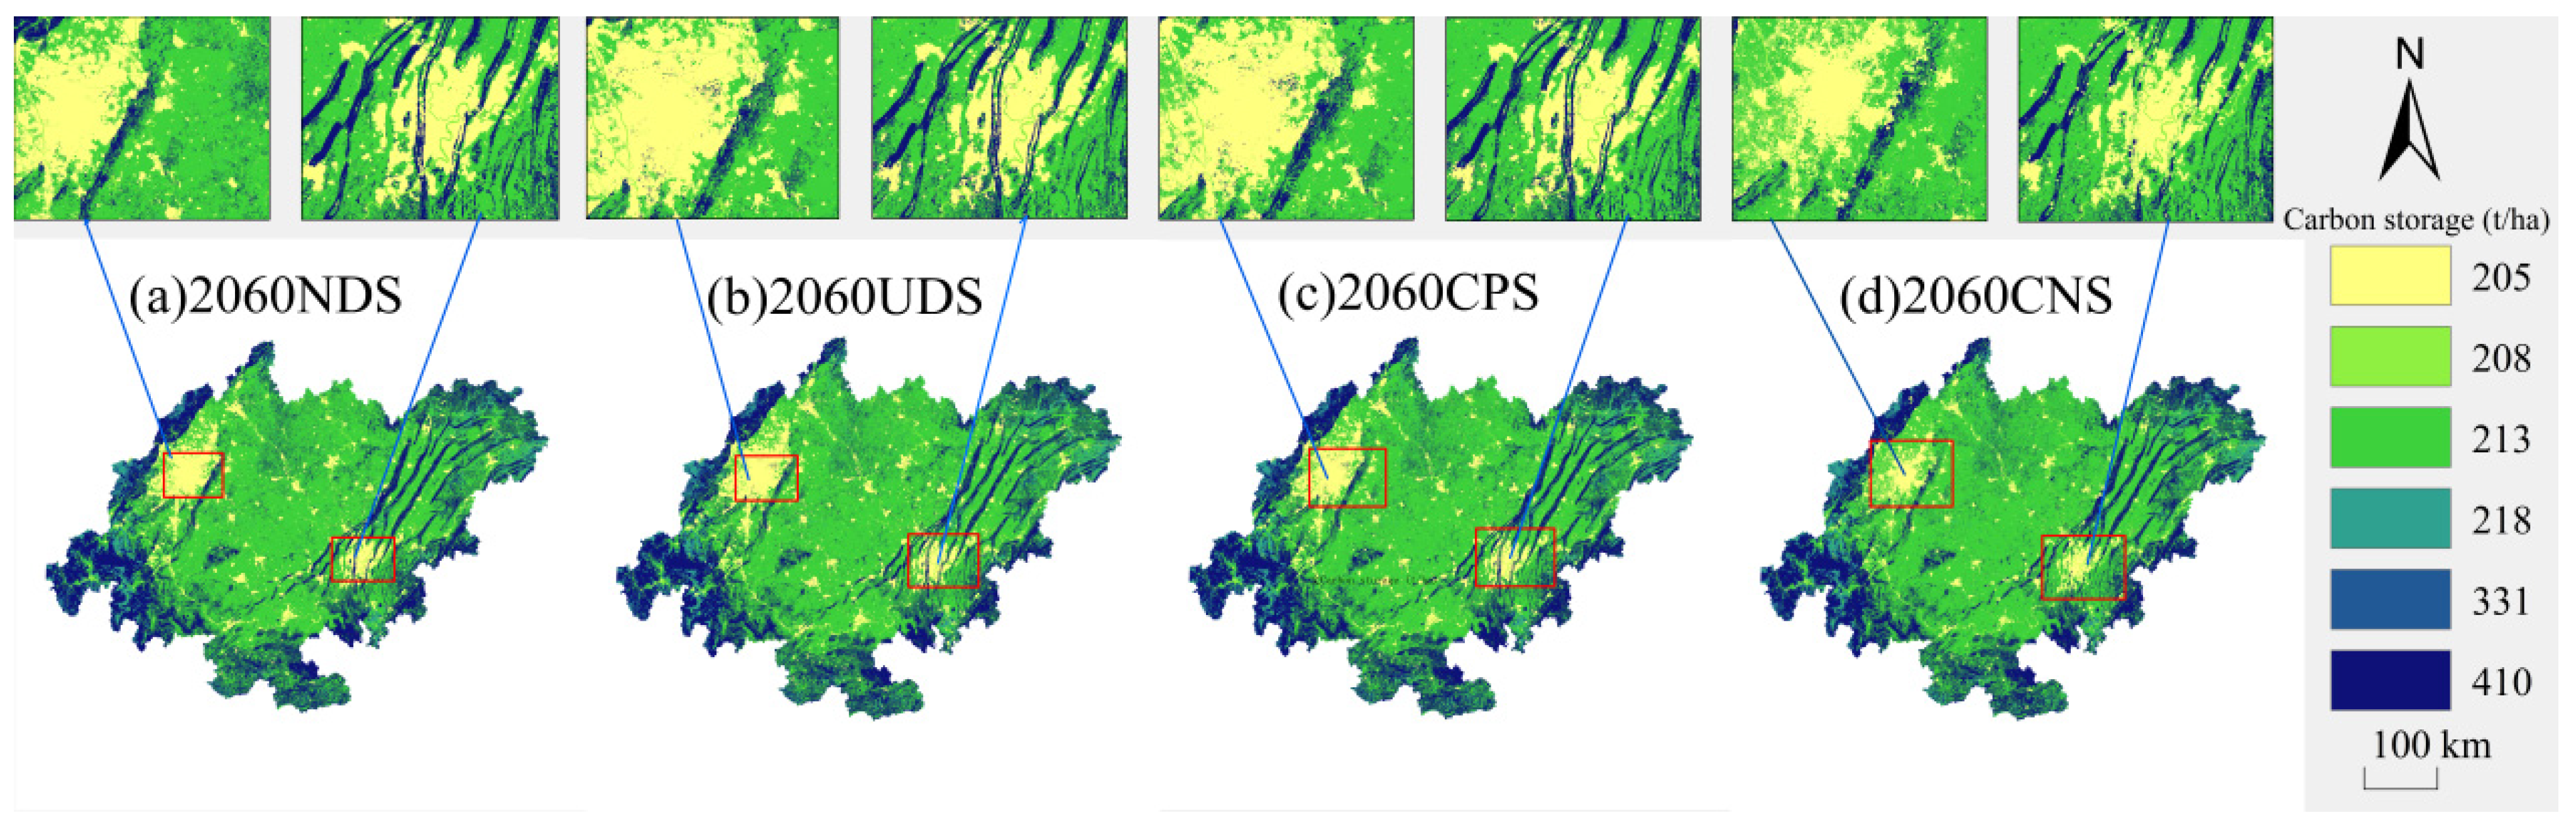
3.2.2. Dynamics in Carbon Storage Under Different Scenarios
4. Discussion
4.1. Similarities and Differences with Existing Studies
- (1)
- Policy-Driven Scenario Design for Carbon Neutrality Pathways
- (2)
- Refined Modeling and Carbon Pool Disaggregation
- (3)
- Integration of Policy Tools and Systemic Limitations
4.2. Generalizability and Limitations of the Research Results
4.3. Omissions of Cultural Dimensions and Policy Rigidities
5. Conclusions
- (1)
- Model application effect: Model verification shows that the PLUS model has high accuracy (Kappa > 0.8) in regional scale simulations, and the coupling application with the InVEST model can effectively predict the impact of land use dynamics on carbon storage. This result is consistent with the complex geographical environment characteristics of the region, verifying the applicability of the model in the study of large urban agglomerations.
- (2)
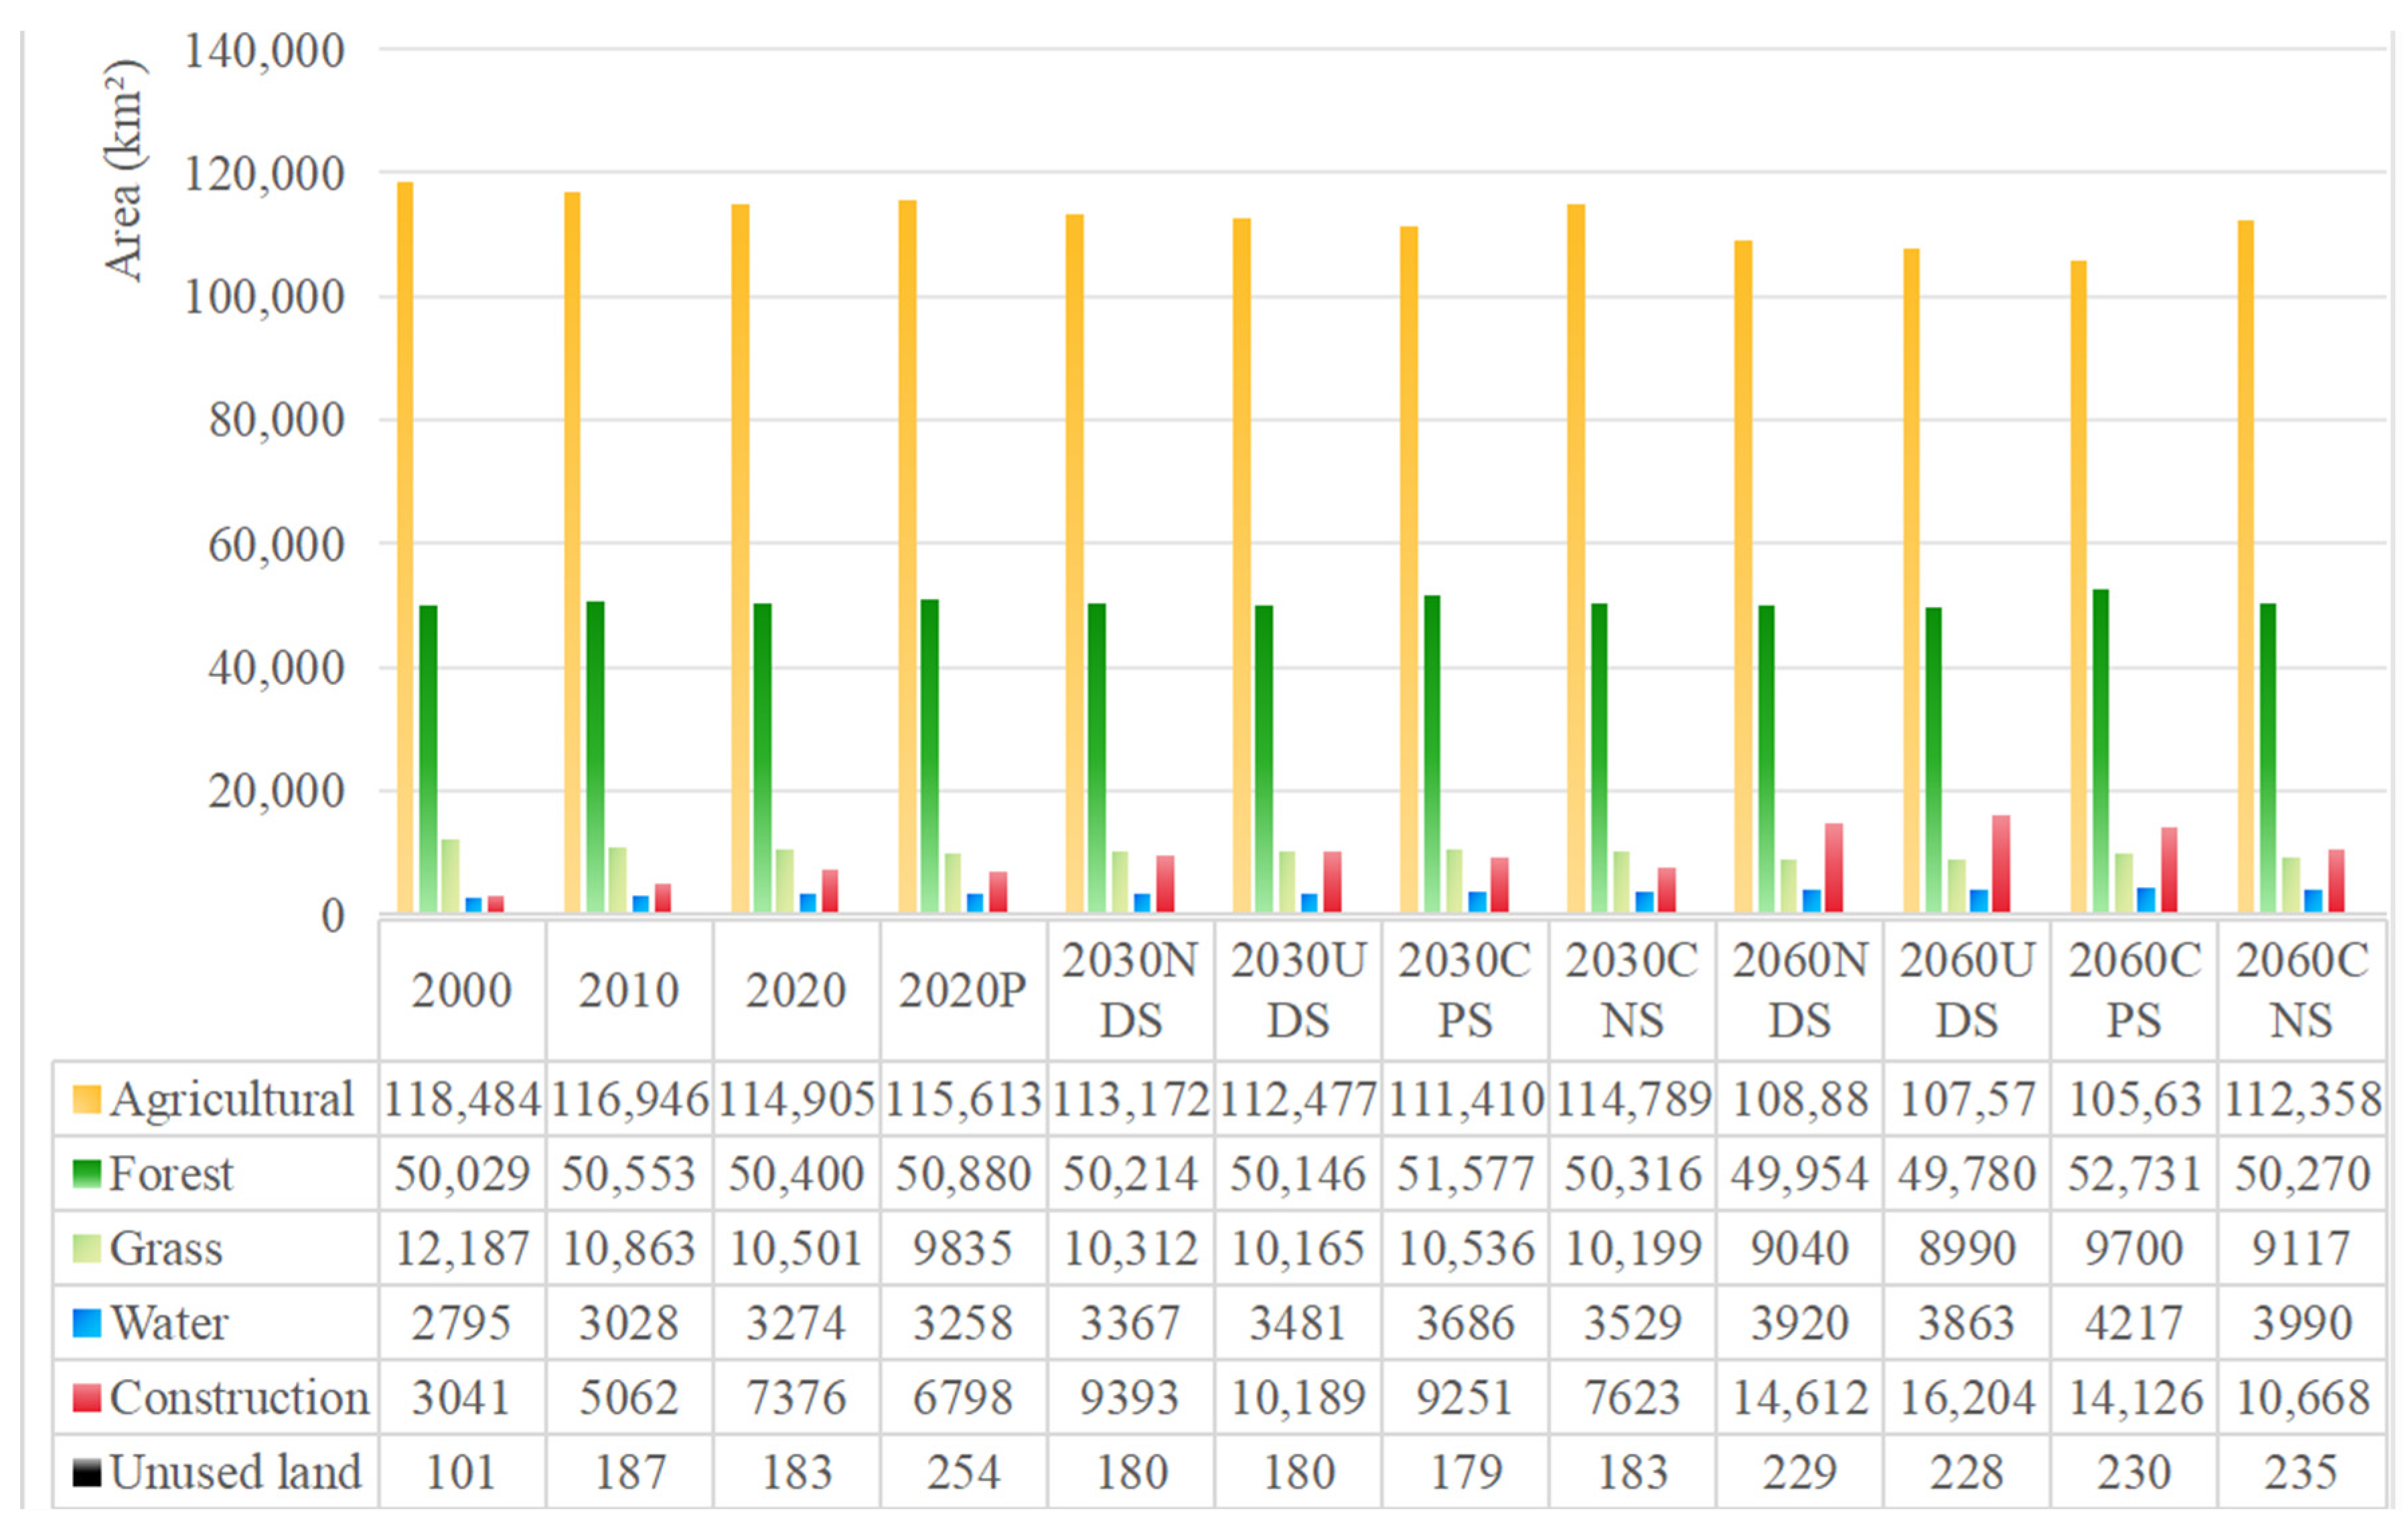
- Land use shows significant dynamics: Forest and cultivated land constitute over 90% of the land use in the Chengdu–Chongqing Twin Cities Economic Circle. Multi-scenario projections indicate that construction land will expand, while ecological land declines under all modeled conditions. Between 2000 and 2020, the area of cultivated land and grassland will decrease, while the area of forest land, water area, construction land, and unused land will increase. The rapid expansion of construction land is the main reason for the area change, increasing by 4400 km2 in 20 years, and the proportion has increased from 1.63% to 3.95%. The amount of cultivated land decreased the most, reaching 3600 km2. At the same time, the land use transfer matrix from 2000 to 2020 shows that the largest area of cultivated land was transferred out, which was 12,414.13 km2, and the largest area of grassland was transferred in, which was 9107.21 km2. The conversion between cultivated land and forest land was the main type of land use conversion.
- (3)
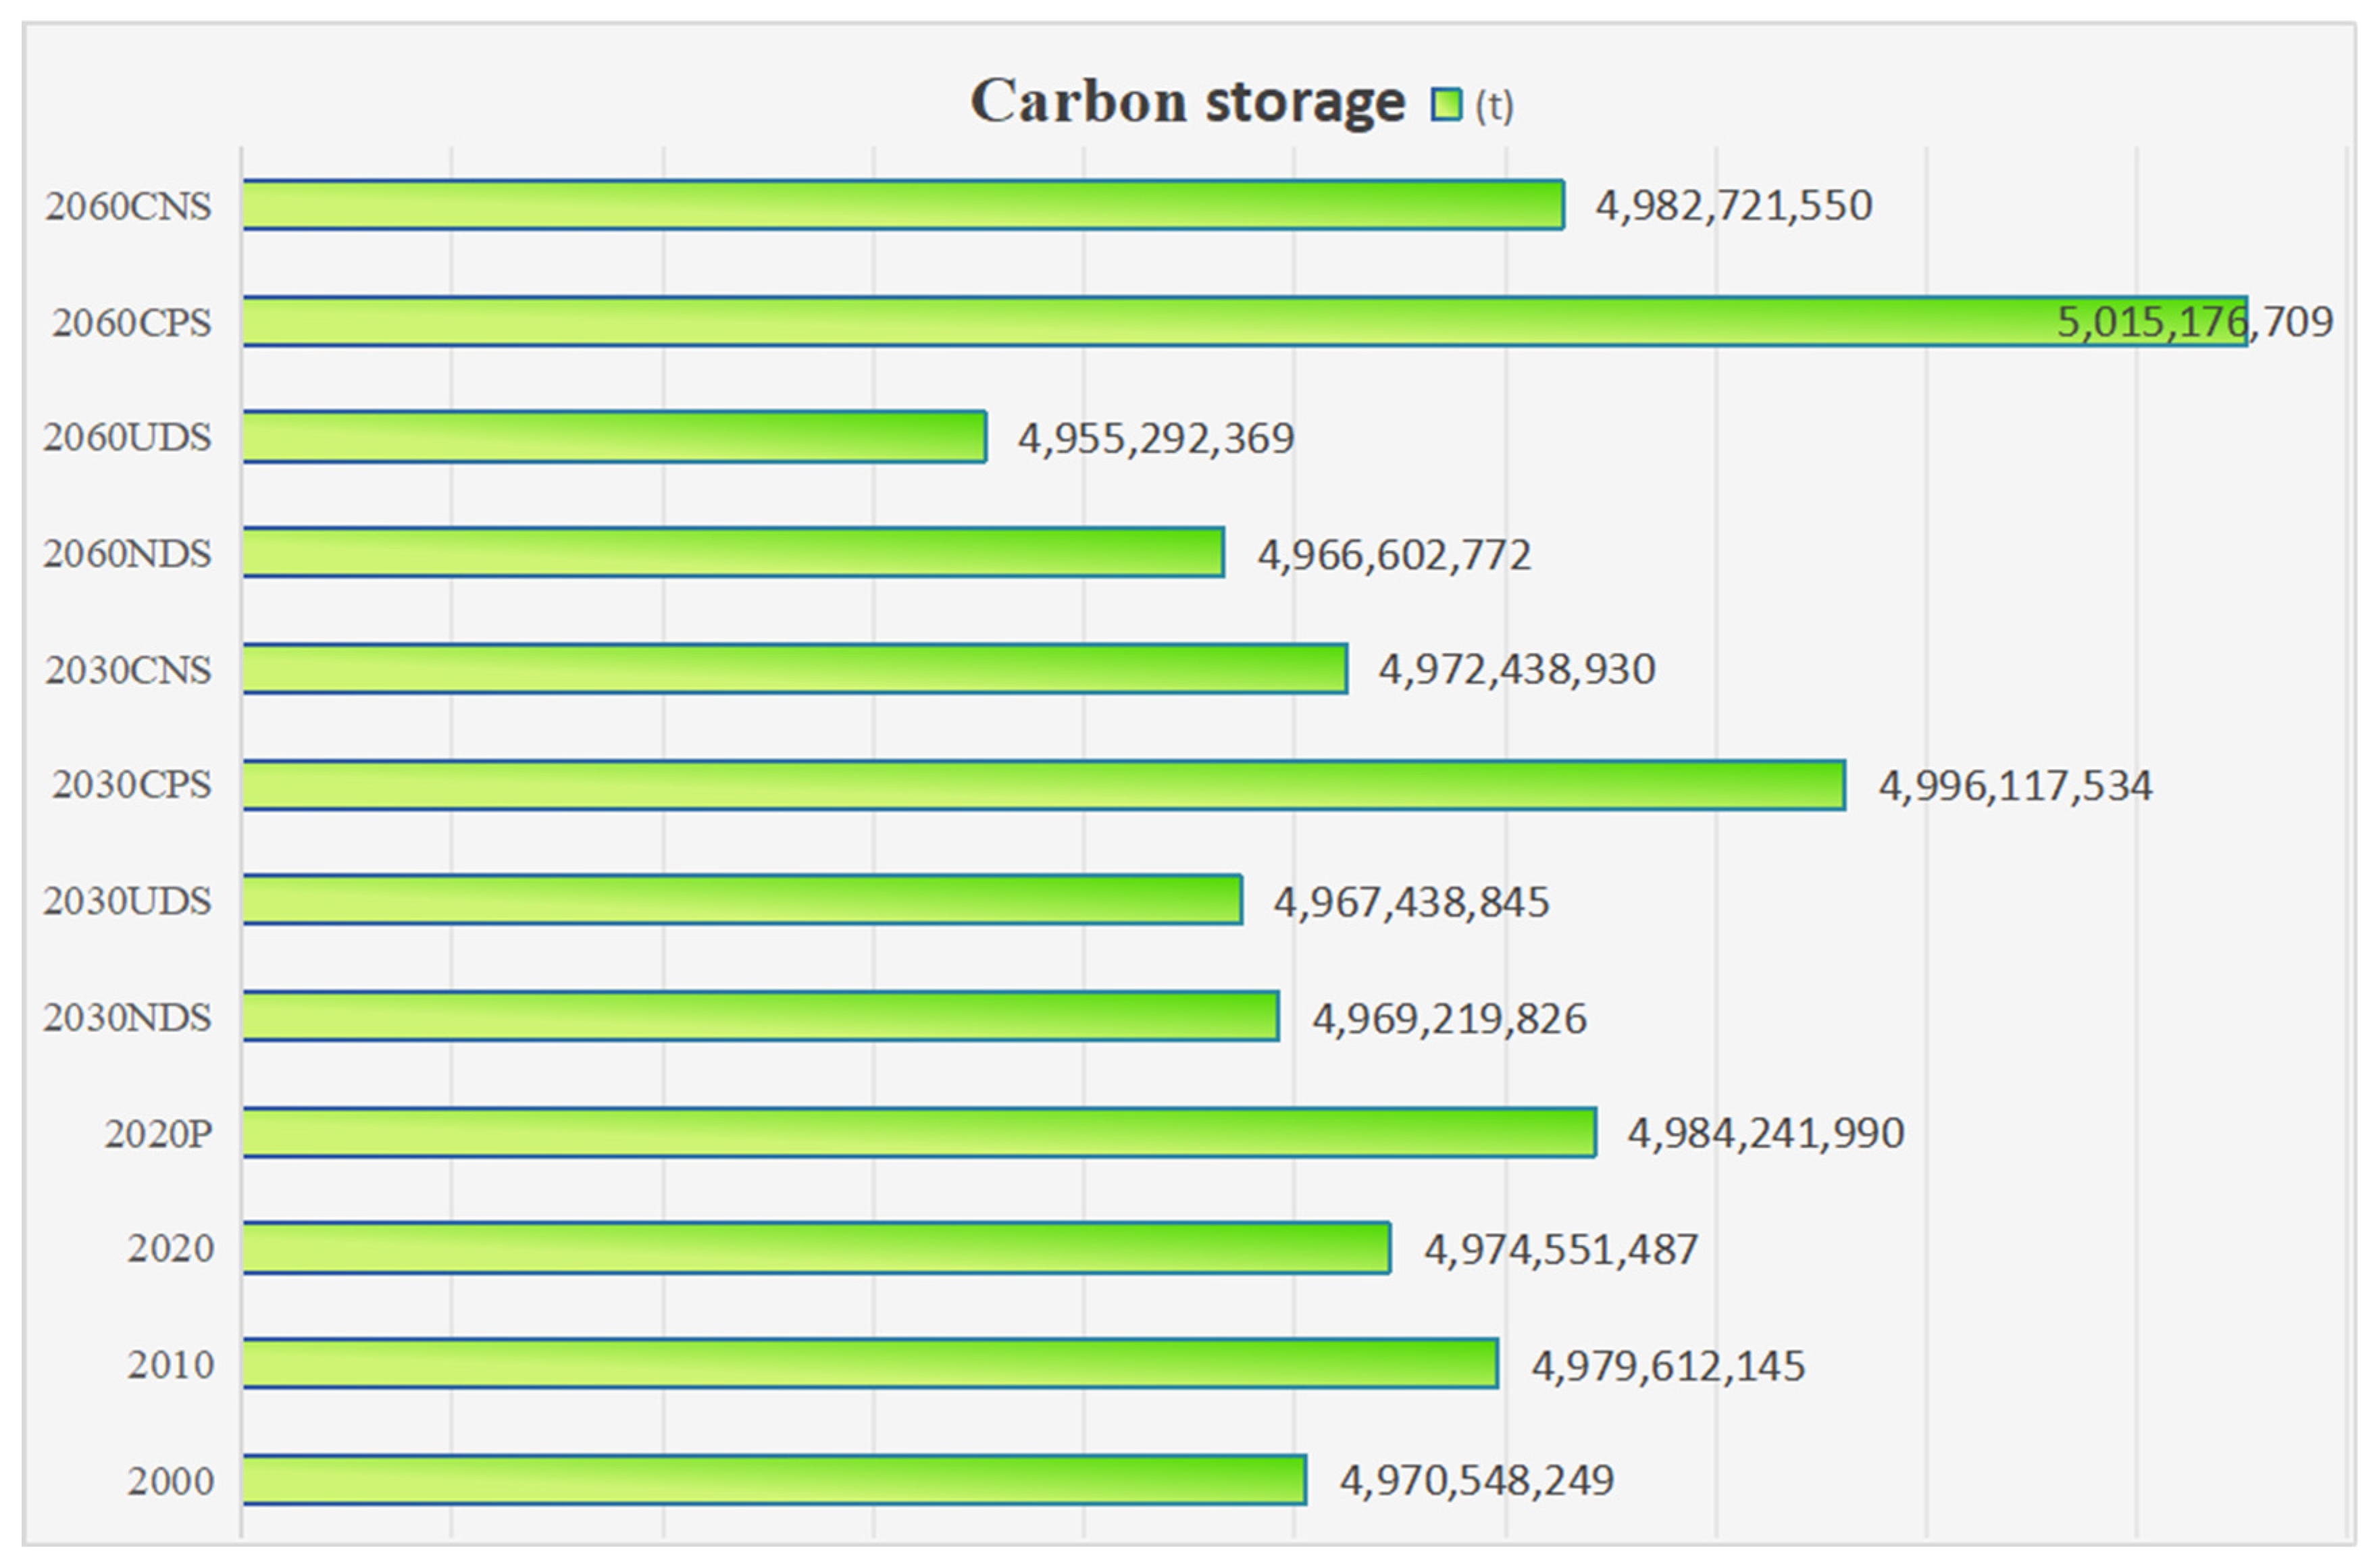
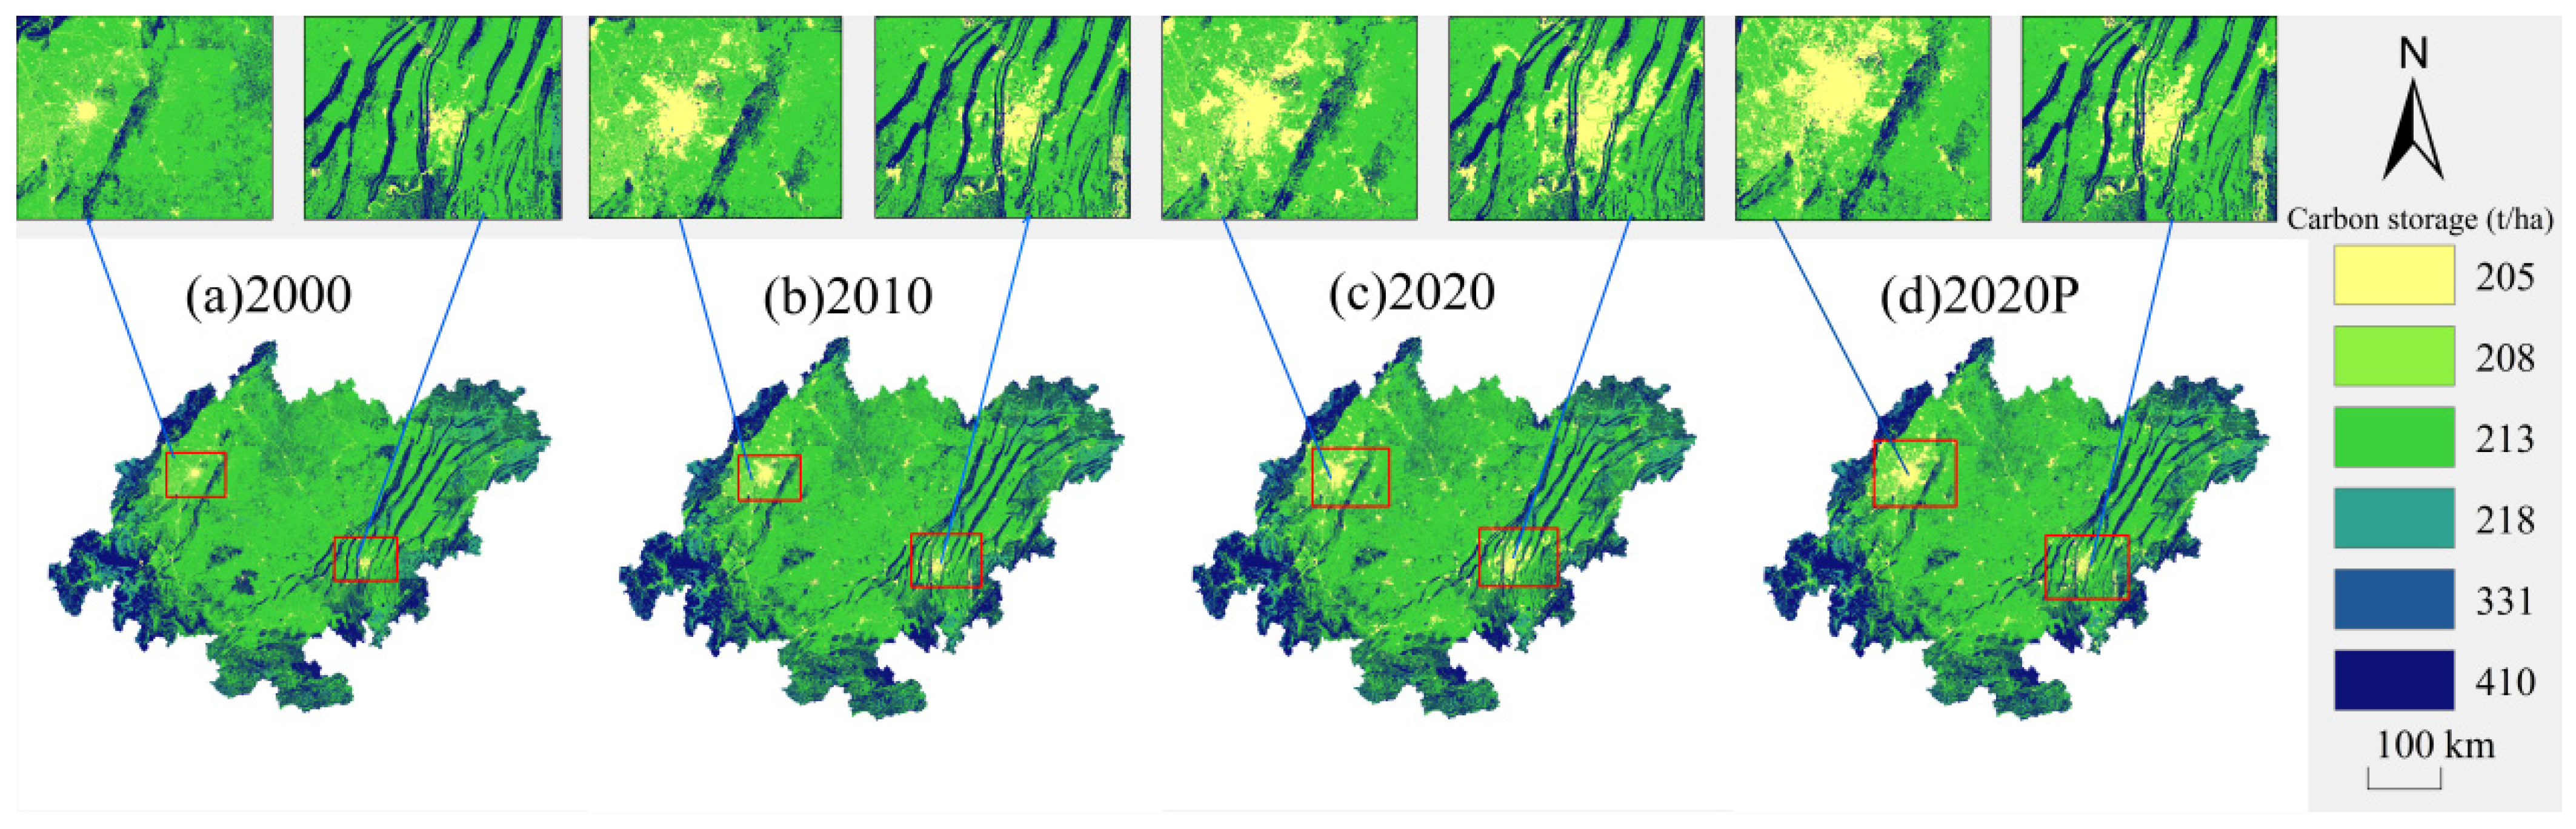
- The spatiotemporal evolution characteristics of carbon storage are obvious: the carbon storage in the Chengdu–Chongqing Economic Circle first increased and then decreased during 2000–2020, with an overall slight increase. Future forecasts show that carbon storage under different scenarios shows a trend of first decreasing, then increasing, and then decreasing. In the CPS scenario, carbon storage reaches the maximum value, and the carbon emission reduction effect is significant; in the CNS scenario, carbon storage remains at a high level, which helps to achieve the regional carbon neutrality goal. Spatially, carbon storage shows a distribution characteristic of “high around and low in the middle”, which is exhibit a strong correlation with factors such as the topography of the Chengdu–Chongqing Twin Cities Economic Circle (mostly mountains and forests around, with a plain urban dense area in the middle), land use type (mostly forests around, with most construction land in the middle), and human activity intensity (frequent human activities in the middle city and large carbon emissions).
Author Contributions
Funding
Institutional Review Board Statement
Informed Consent Statement
Data Availability Statement
Conflicts of Interest
References
- Wang, W.W.; Fu, T.L.; Chen, H. Spatio-temporal evolution and prediction of carbon storage in the Yangtze River Delta urban agglomeration based on the PLUS-InVEST model. Environ. Sci. 2025, 46, 1937–1950. [Google Scholar] [CrossRef]
- Zhu, Z.Q.; Ma, X.S.; Hu, H. Spatio-temporal evolution and prediction of carbon storage in Guangzhou ecosystem based on the coupled FLUS-InVEST model. Bull. Soil Water Conserv. 2021, 41, 222–229+239. [Google Scholar] [CrossRef]
- Huang, X.; Liu, X.; Wang, Y. Spatio-temporal variations and drivers of carbon storage in the tibetan plateau under SSP-RCP scenarios based on the PLUS-InVEST-GeoDetectormodel. Sustainability 2024, 16, 5711. [Google Scholar] [CrossRef]
- Liu, X.J.; Li, X.; Liang, X.; Shi, H.; Ou, J.P. Simulation of future land use change in China and its impact on carbon storage based on the FLUS-InVEST model. Trop. Geogr. 2019, 39, 397–409. [Google Scholar] [CrossRef]
- Imran, M.; Din, N.U. Geospatially mapping carbon stock for mountainous forest classes using InVEST model and Sentinel-2 data: A case of Bagrote valley in the Karakoram range. Arab. J. Geosci. 2021, 14, 1–12. [Google Scholar] [CrossRef]
- Liang, X.; Liu, X.P.; Chen, G.L.; Leng, L.; Wen, Y.Y.; Chen, G.Z. Coupling fuzzy clustering and cellular automata based on local maxima of development potential to model urban emergence and expansion in economic development zones. Int. J. Geogr. Inf. Sci. 2020, 34, 1930–1952. [Google Scholar] [CrossRef]
- Gong, S.X.; Zhan, Y.H.; Li, Y.H. Change and prediction of carbon storage in Beijing-Tianjin-Hebei region based on PLUS-InVEST model. Arid. Land Resour. Environ. 2023, 37, 20–28. [Google Scholar]
- Wu, D.; Zhu, K.W.; Zhang, S. Analysis of carbon storage evolution in Chengdu-Chongqing economic zone based on PLUS model and InVEST model. Three Gorges Ecol. Environ. Monit. 2022, 7, 85–96. [Google Scholar] [CrossRef]
- The CPC Central Committee and the State Council Issued the Outline of the Plan for the Construction of the Chengdu-Chongqing Twin Cities Economic Circle. Chinese Government Network. 30 January 2024. Available online: www.gov.cn/zhengce/2021-10/21/content_5643875.html (accessed on 1 April 2025).
- Zhang, Y.; Shi, X.Y.; Tang, Q. Carbon stock assessment in the upper reaches of the Fenhe River under different land use scenarios. Acta Ecol. Sin. 2021, 41, 360–373. [Google Scholar]
- Zhu, K.; He, J.; Tian, X.; Hou, P.; Wu, L.; Guan, D.; Wang, T.; Huang, S. Analysis of evolving carbon stock trends and influencing factors in Chongqing under future scenarios. Land 2024, 13, 421. [Google Scholar] [CrossRef]
- Yang, Y.; Liang, C.X. Analysis of spatiotemporal dynamics and driving forces of water resources ecosystem service value in the Yellow River Basin: A case study of Guanzhong Plain urban agglomeration. Technol. Econ. 2023, 42, 189–200. [Google Scholar]
- Li, Y. Chengdu-Chongqing “Dual Circle” to Achieve Regional GDP of 8719.3 Billion Yuan in 2024. Sichuan Economic Daily, 25 March 2025. Available online: https://www.scjjrb.com/2025/03/24/99429975.html (accessed on 1 April 2025).
- Zhang, D.C.; Liu, X.P.; Yao, Y.; Zhang, J.B. Simulating spatiotemporal change of multiple land use types in Dongguan by using random forest based on Cellular Automata. Geogr. Geoinf. Sci. 2016, 32, 29–36. [Google Scholar]
- Chen, K.; Liu, K.; Liu, L.; Zhu, Y. Urban expansion simulation by random-forest-based cellular automata: A case study of Foshan City. Prog. Geogr. 2015, 34, 937–946. [Google Scholar]
- Wu, L.N.; Yang, S.T.; Liu, X.Y.; Luo, Y.; Zhuo, X.; Zhao, H.G. Response of land use change to human activities in the Beiluo River Basin since 1976. Acta Geogr. Sin. 2014, 69, 54–63. [Google Scholar]
- Han, H.R.; Yang, C.F.; Song, J.P. Characteristics and driving mechanisms of land use change in Beijing. Econ. Geogr. 2015, 35, 148–154+197. [Google Scholar] [CrossRef]
- Liu, J.Y.; Liu, M.L.; Zhuang, D.F. Spatial pattern analysis of recent land use change in China. Chin. Sci. Ser. D Earth Sci. 2002, 32, 1031–1040+1058–1060. [Google Scholar]
- Zou, T.H.; Chen, P.; Liu, J.F.; Du, H.S. Spatio-temporal evolution of carbon storage in Siping ecosystem under different land use scenarios. China Environ. Sci. 2023, 43, 5508–5518. [Google Scholar] [CrossRef]
- Li, Y.F.; Cai, T.Y.; Wen, Q.; Han, J.; Wang, S.X.; Wang, J.H.; Yin, C.H. Scenario simulation of landusechange and carbon storage response in Henan Province, China: 1990–2050. Ecol. Indic. 2023, 154, 110660. [Google Scholar]
- He, J. Research on the Profit and Loss of Ecological Economy in the Process of Urbanization in Chongqing. Master’s Thesis, Chongqing Normal University, Chongqing, China, 2017. (In Chinese). [Google Scholar]
- Liu, Y.; Zhang, J.; Zhou, D.M.; Ma, J.; Dang, R.; Ma, J.J.; Zhu, X.Y. Study on spatiotemporal variation of carbon storage in Shule River Basin based on InVEST model. Acta Ecol. Sin. 2021, 41, 4052–4065. [Google Scholar]
- Huang, C.H. Research on Ecosystem Service Function Based on InVEST Model—A Case Study of Baoxing County, Sichuan and Mentougou District, Beijing. Master’s Thesis, Beijing Forestry University, Beijing, China, 2014. [Google Scholar]
- Zhu, W.B.; Zhang, J.J.; Cui, Y.P.; Zheng, H.; Zhu, L.Q. Ecosystem carbon storage assessment based on land use change scenario—A case study of Qihe River Basin in Taihang Mountains. Acta Geogr. Sin. 2019, 74, 446–459. [Google Scholar]
- Guo, J.J.; Xia, X.Q.; Yang, Z.F.; Zhu, T.; Guo, Q.Y. Dynamics in soil carbon pools and influencing factors in typical areas of the Yangtze River Basin. Earth Sci. Front. 2015, 22, 241–250. [Google Scholar]
- Chuai, X.W.; Huang, X.J.; Lai, L.; Zhang, H. GIS-based soil organic carbon storage accounting and its response to land use change. Trans. Chin. Soc. Agric. Eng. 2011, 27, 1–6. [Google Scholar]
- Li, K.R.; Wang, S.Q.; Cao, M.K. Vegetation and soil carbon storage in China. Sci. China Ser. D 2003, 33, 72–80. (In Chinese) [Google Scholar] [CrossRef]
- Fang, J.Y.; Guo, Z.D.; Pu, S.L.; Chen, A.P. Estimation of carbon sink of terrestrial vegetation in China from 1981 to 2000. Chin. Sci. Ser. D Earth Sci. 2007, 6, 804–812. [Google Scholar]
- Wang, S.Q.; Zhou, C.H.; Li, K.R.; Zhu, S.L.; Huang, F.H. Analysis of soil organic carbon pool and spatial distribution characteristics in China. Acta Geogr. Sin. 2000, 5, 533–544. [Google Scholar]
- Zhou, T.; Shi, P.J.; Wang, S.Q. Impact of climate change and human activities on soil organic carbon storage in China. Acta Geogr. Sin. 2003, 5, 727–734. [Google Scholar]
- Tang, L.; Wang, J.; Xu, L.; Lu, H. Exploring New Avenues in Sustainable Urban Development:Ecological Carbon Dynamics of Park City in Chengdu. Sustainability 2024, 16, 6471. [Google Scholar] [CrossRef]
- Wang, F.; Li, J.; Wang, J.; Xiang, S.Y.; Chen, X.T.; Yi, X.M.; Huang, X.Y.; Huang, T. Multi-scenario simulation of land use change in Chengdu-Chongqing economic zone and its impact on carbon storage. Environ. Sci. 2024, 1–17. [Google Scholar] [CrossRef]

| Land Use Drivers | Data Name | Data Source |
|---|---|---|
| Natural factors | Elevation | Geospatial Data Cloud (https://www.gscloud.cn) |
| Slope | Extraction based on DEM | |
| Slope aspect | ||
| NDVI | Geospatial Data Cloud (https://www.gscloud.cn) is based on Landsat series remote sensing data calculation | |
| Average annual temperature | Chinese Science Resources and Environmental Science Data Center (https://www.resdc.cn) | |
| Average annual precipitation | ||
| Social factors | GDP | Chinese Science Resources and Environmental Science Data Center (https://www.resdc.cn) |
| Population density | worldpop Global 100 m population grid data (https://www.worldpop.org/) | |
| Traffic factors | Distance from highway | National Geographic Information Resource Directory Service System (https://www.webmap.cn/); ArcGIS Euclidean distance analysis |
| Distance from main road | ||
| Distance to railway | ||
| Distance to the train station | ||
| Distance to secondary roads | ||
| Distance to third-level road | ||
| Distance to river |
| Agriculture | Forest | Grass | Water | Construction | Unused Land | |
|---|---|---|---|---|---|---|
| 2030NDS | 0.48 | 0.48 | 0.48 | 0.5 | 0.52 | 0.48 |
| 2030UDS | 0.25 | 0.25 | 0.25 | 0.3 | 0.75 | 0.25 |
| 2030CPS | 0.7 | 0.7 | 0.7 | 0.7 | 0.3 | 0.3 |
| 2030CNS | 0.75 | 0.75 | 0.75 | 0.75 | 0.25 | 0.3 |
| 2060NDS | 0.5 | 0.5 | 0.5 | 0.5 | 0.5 | 0.5 |
| 2060UDS | 0.2 | 0.2 | 0.2 | 0.2 | 0.8 | 0.2 |
| 2060CNS | 0.3 | 0.3 | 0.3 | 1 | 0.7 | 0.4 |
| 2060CNS | 0.7 | 0.7 | 0.7 | 1 | 0.4 | 0.45 |
| Scenario Type | Scenario Introduction |
|---|---|
| NDS | (1) NDS is a simulation of urban agglomeration land use change from 2000 to 2020, without mandatory constraints, and in accordance with the current urbanization development model. (2) It continues the historical trend, does not set restrictions on the conversion of various types of land use, and does not involve government and market intervention. It is the basis for the simulation of urban agglomeration land use change considering other constraints. |
| UDS | (1) UDS prioritizes construction. It is assumed that the probability of conversion of unused cultivated land, forest land, and grassland to construction land increases, and the probability of conversion of construction land to other land types decreases, so as to reflect the characteristics of land use change in the process of rapid urbanization. (2) The probability of converting unused cultivated land, forest land, and grassland to construction land increases by 20%, and the probability of artificial surface transfer to other landscape types except cultivated land decreases by 30%. |
| CPS | (1) CPS encompasses ecological red line control, strictly controlling the growth of construction land, promoting economical and intensive use, and reducing the encroachment on cultivated land and other ecological land. (2) It encourages the conversion of unused land to cultivated land and ecological land to improve the regional carbon sequestration capacity. The transfer ratio of cultivated land to forest land and grassland will increase by 20%; the transfer ratio of forest land and grassland to cultivated land will decrease by 20%, and the conversion ratio to construction land will decrease by 50%; the transfer ratio of water areas to cultivated land will decrease by 50%, and the transfer ratio to construction land will decrease by 70%; the transfer ratio of construction land to forest land, grassland, and water areas will increase by 30%; the transfer ratio of unused land to forest land and grassland will increase by 20%; and the transfer ratio to construction land will increase by 60%. |
| CNS | (1) This involves carbon tax + compensation. On the basis of CPS, this will further strengthen the protection of carbon sinks such as forest land, grassland, and water areas and strictly control the expansion of construction land and the encroachment of ecological land. (2) This will increase regional carbon sinks through measures such as returning farmland to forest and grassland and achieve the goal of carbon neutrality. The proportion of cultivated land transferred to construction land is reduced by 60%; the proportion of forest land, grassland, and water areas transferred to construction land is reduced by 30%; the proportion of construction land transferred to cultivated land is increased by 20%; the proportion of transfer to forest land, grassland, and water areas is increased by 15%; the proportion of unused land transferred to cultivated land is reduced by 15%; the proportion of transfer to forest land, grassland, and water areas is reduced by 10%; and the proportion of transfer to construction land is increased by 60%. |
| Aboveground Carbon Density | Underground Carbon Density | Soil Carbon Density | Death Carbon Density | |
|---|---|---|---|---|
| Agriculture | 38.7 | 80.7 | 92.9 | 1 |
| Forest | 55.56 | 144.87 | 206.45 | 3.5 |
| Grass | 29.3 | 52.9 | 135 | 1 |
| Water | 21.4 | 73.1 | 113 | 1 |
| Construction | 3.3 | 87.3 | 115.3 | 0 |
| Unused land | 22.6 | 136.9 | 171.8 | 0 |
| Land Use Type | 2000 | 2010 | 2020 | ||||||
|---|---|---|---|---|---|---|---|---|---|
| Area (km2) | Proportion% | 2000–2010 Dynamics | Area (km2) | Proportion% | 2010–2020 Dynamics | Area (km2) | Proportion% | 2000–2020 Dynamics | |
| Agriculture | 118,483.51 | 63.48% | −0.13% | 116,946.02 | 62.66% | −0.17% | 114,904.55 | 61.57% | −0.30% |
| Forest | 50,029.48 | 26.81% | 0.10% | 50,552.81 | 27.09% | −0.03% | 50,400.09 | 27.00% | 0.07% |
| Grass | 12,187.24 | 6.53% | −1.09% | 10,862.57 | 5.82% | −0.33% | 10,500.62 | 5.63% | −1.38% |
| Water | 2795.35 | 1.50% | 0.83% | 3028.10 | 1.62% | 0.81% | 3274.49 | 1.75% | 1.71% |
| Construction | 3041.36 | 1.63% | 6.64% | 5062.16 | 2.71% | 4.57% | 7375.53 | 3.95% | 14.25% |
| Unused land | 101.27 | 0.05% | 8.42% | 186.55 | 0.10% | −0.19% | 182.93 | 0.10% | 8.06% |
| Comprehensive dynamics and total | 186,638.21 | 100% | 0.15% | 186,638.21 | 100% | 0.14% | 186,638.21 | 100% | 0.14% |
| Land Type | Agriculture | Forest | Grass | Water | Construction | Unused Land | Total | Transfer Out |
|---|---|---|---|---|---|---|---|---|
| Agriculture | 107,681.65 | 4801.64 | 950.52 | 629.56 | 4427.26 | 13.71 | 118,504.34 | 10,822.69 |
| Forest | 4850.33 | 44,010.78 | 667.83 | 121.11 | 289.51 | 88.68 | 50,028.25 | 6017.47 |
| Grass | 1686.89 | 1477.87 | 8836.43 | 75.45 | 85.31 | 10.69 | 12,172.63 | 3336.20 |
| Water | 295.52 | 38.31 | 10.33 | 2384.43 | 63.27 | 4.48 | 2796.35 | 411.91 |
| Construction | 425.84 | 42.01 | 21.13 | 45.02 | 2494.11 | 0.23 | 3028.33 | 534.22 |
| Unused land | 7.16 | 7.45 | 2.29 | 18.02 | 1.39 | 64.60 | 100.90 | 36.30 |
| Total | 114,947.38 | 50,378.05 | 10,488.53 | 3273.59 | 7360.84 | 182.40 | 186,630.80 | 21,158.80 |
| Transfer in | 7265.73 | 6367.27 | 1652.10 | 889.15 | 4866.73 | 117.80 | 21,158.80 |
Disclaimer/Publisher’s Note: The statements, opinions and data contained in all publications are solely those of the individual author(s) and contributor(s) and not of MDPI and/or the editor(s). MDPI and/or the editor(s) disclaim responsibility for any injury to people or property resulting from any ideas, methods, instructions or products referred to in the content. |
© 2025 by the authors. Licensee MDPI, Basel, Switzerland. This article is an open access article distributed under the terms and conditions of the Creative Commons Attribution (CC BY) license (https://creativecommons.org/licenses/by/4.0/).
Share and Cite
Hu, L.; Wang, G.; Huang, Q.; Xie, J. Policy-Driven Land Use Optimization for Carbon Neutrality: A PLUS-InVEST Model Coupling Approach in the Chengdu–Chongqing Economic Circle. Sustainability 2025, 17, 5831. https://doi.org/10.3390/su17135831
Hu L, Wang G, Huang Q, Xie J. Policy-Driven Land Use Optimization for Carbon Neutrality: A PLUS-InVEST Model Coupling Approach in the Chengdu–Chongqing Economic Circle. Sustainability. 2025; 17(13):5831. https://doi.org/10.3390/su17135831
Chicago/Turabian StyleHu, Lei, Guangjie Wang, Qiang Huang, and Jiahui Xie. 2025. "Policy-Driven Land Use Optimization for Carbon Neutrality: A PLUS-InVEST Model Coupling Approach in the Chengdu–Chongqing Economic Circle" Sustainability 17, no. 13: 5831. https://doi.org/10.3390/su17135831
APA StyleHu, L., Wang, G., Huang, Q., & Xie, J. (2025). Policy-Driven Land Use Optimization for Carbon Neutrality: A PLUS-InVEST Model Coupling Approach in the Chengdu–Chongqing Economic Circle. Sustainability, 17(13), 5831. https://doi.org/10.3390/su17135831