1. Introduction
Civil aviation is an important industry for many countries, addressing challenges related to passenger and cargo transportation, responding to emergencies such as natural disasters and fires, the exploration of minerals, support for agricultural enterprises, and more [
1,
2]. Today, civil aviation is increasingly being supplemented by unmanned aircraft systems to carry out tasks such as surveillance, cargo delivery, environmental monitoring, and other operations [
3]. Overall, this industry is constantly becoming more complicated, incorporating new components and processes, and therefore can be considered as a system of systems [
4,
5].
The main requirement of civil aviation is to ensure the safety and regularity of aircraft operations while adhering to established constraints on costs and human and material resources [
6,
7]. The integrity and efficiency of civil aviation can be affected by possible random events that may occur during its operation. These events may be related to the condition of the aircraft; the qualifications, skills, and physiological state of personnel; the reliability of equipment for flight support; air navigation systems; and other factors [
8,
9].
The main civil aviation systems involved in ensuring flight safety and operational regularity include the flight operations system; aviation safety system; aviation equipment maintenance and operation system; air navigation service system; air traffic control system; aviation security system; occupational health and safety system; environment protection system; service quality management system; the system for the design, construction, and maintenance of airport infrastructure suitability; and the system of scientific and methodological support for civil aviation operations [
10,
11].
The mentioned systems are dependent on and interact with each other according to system and process principles and models. The large number of systems and the possibility of various random events occurring in them are a prerequisite for increasing entropy and uncertainty in the state of civil aviation. This leads to the need to develop new approaches and principles for monitoring and controlling the state of civil aviation components to form corrective and preventive measures based on the results of statistical data processing.
A characteristic feature of these systems is the presence of properties typical for queueing systems. Such systems are designed to process the flow of applications (requests), to control the quality of their execution, and to continuously improve their components [
12]. Each system is characterised by its organisational structure, resources, processes, personnel, regulatory documentation, and other elements [
13]. The components of these systems exist in complex interrelationships with each other.
It should be emphasised that civil aviation is a critical industry of any country; therefore, the strict implementation of regulatory documentation is a key factor in maintaining flight safety. In this context, international organisations such as ICAO, Eurocontrol, EASA, and FAA develop and maintain the relevance of these documents in accordance with the main challenges of today.
According to the current operational practice, a characteristic phenomenon in the above-mentioned systems is ageing, including the destruction of connections, deterioration, and other forms of degradation [
14]. This process occurs as a result of random events associated with failures, damages, malfunctions, faults, and inconsistencies within the equipment itself, the supporting systems, and the external environment [
15,
16]. In the context of the latter statement, it should be noted that flight operations are performed within the airspace.
Thus, the trends of all statistical data are non-stationary and are controlled by laws with the presence of changepoints. This is typical for all civil aviation systems. Therefore, adequate and effective solutions to the problems of statistical data processing under such conditions are directly related to the sustainable development of civil aviation. It is necessary to carefully collect statistical data on the functioning of all components of civil aviation, carry out processing, and take timely corrective and preventive actions.
If we do not take into account information about possible changepoints during processing, it can lead to increased operating costs, decreased equipment reliability, and risks of dangerous situations.
Considering Ukraine as a case study, several specific features should be highlighted in the field of its civil aviation. In 2014, the airspace of Ukraine was significantly reduced due to the loss of the Crimean regional structural unit. The consequences of this event also affected other countries in terms of replanning air routes. Furthermore, since 24 February 2022, Ukraine’s civil aviation sector has been suspended, and the country’s airspace has remained closed [
17]. As a result, the following developments can be observed:
Aviation equipment is currently not being used for its functional purpose and is disconnected from the constant power supply. At the same time, only a limited number of maintenance procedures are being carried out, which cannot fully guarantee the future reliability level of the equipment.
The staff number of air navigation service providers has decreased. This is due to various factors, including emigration, insufficient funding, and a shortage of young specialists.
The demand for aviation programs in higher educational institutions has significantly decreased, hindering the training of a sufficient number of specialists required for the post-war reconstruction of Ukraine.
The infrastructure of some airports has sustained varying degrees of damage and requires reconstruction and modernisation.
Tasks related to the extension of the service life of aviation equipment and audits of aviation enterprises are mainly being performed remotely. There is a pressing need for the deployment of specialists from state regulatory bodies to inspect, monitor, and control the technical condition of aviation equipment [
18,
19].
A positive feature is the fact of financial support provided by international organisations for the activities of air navigation service providers in Ukraine, which gives optimism in the further sustainable development of civil aviation in Ukraine after the end of the war.
Financial support for Ukrainian aviation is directed, among other purposes, towards the acquisition of new models of ground-based aviation equipment. On the one hand, this initiative facilitates the integration of Ukrainian aviation into the framework of sustainable global development, particularly in terms of enhancing the accuracy of measuring navigation coordinates, improving the quality and security of communications, and using highly reliable equipment. However, on the other hand, a number of challenges arise that need to be resolved by all aviation stakeholders.
Among these problems, the following should be highlighted:
The need to develop regulatory support concerning the commissioning of aviation equipment, flight inspections, and instructions for performing maintenance and repair procedures.
Addressing the challenges related to the logistical support of spare parts for aviation equipment during both warranty and post-warranty service.
Training personnel to acquire practical skills in the operation, maintenance, and repair of equipment for its intended functional purposes.
Establishing comprehensive collaboration between state regulatory bodies, aviation enterprises, and research and development organisations and groups.
The development and implementation of measures regarding the organisational structure, equipment, and technologies of repair centres.
The development of new technologies for collection, processing, and using statistical data.
A fundamental feature of the data to be processed is its stochastic nature [
20]. Therefore, data processing algorithms should be based on the tools of probability theory, mathematical statistics, statistical estimation theory, and related methodologies [
21,
22].
A characteristic feature of the data associated with processing tasks is the presence of changepoints. A changepoint represents the transition from one stationary observation phase to another, which, in the general case, is a non-stationary phase [
23]. In the theory of the reliability and operation of aviation systems, changepoint processes are associated with the deterioration of the technical condition of equipment [
24].
Analysis shows that insufficient attention has been paid to the processing of non-stationary datasets with changepoints. This, in turn, leads to a decrease in the level of decision-making efficiency and accuracy during the formulation and implementation of preventive and corrective measures. The failure to detect changepoints in a timely manner, as well as the absence of appropriate data processing procedures across all civil aviation systems, can result in a significant increase in operational costs and a decrease in aviation safety levels [
25].
In the theory of aviation systems operation, there has been an evolution in the implementation of maintenance strategies, which is reflected in the well-known MSG concept. However, these concepts also do not take into account the possibility of the changepoint. If we monitor the main trends of sustainable development in the world, it should be noted that today there is a transition to Industry 4.0 technologies. These technologies include the widespread use of digitalisation, data processing methods, intelligent decision-making tools, comprehensive monitoring and control of the condition of systems and equipment, elements of the Internet of Things, new-generation information transmission networks, and others. Thus, the introduction of data processing technologies, including in the case of the changepoint, into the activities of civil aviation corresponds to the trends of global sustainable development.
The data that are subject to collection and processing in civil aviation include
Equipment diagnostic variables.
Equipment reliability parameters.
Technical and economic indicators.
Indicators characterising the constituent elements of the technological processes within operation and maintenance systems.
Indicators of the efficiency of equipment utilisation for its functional purpose and the operation system as a whole [
26].
All of the above, along with other critical data and information, should be stored in appropriate repositories within Datahubs. Additional information may include modern scientific literature (articles, papers, conference proceedings, monographs, textbooks, reference books, training manuals, standards, patents, and more) covering the latest achievements in fields of artificial intelligence, machine learning, deep learning, decision theory, probability theory, mathematical statistics, reliability theory, etc. This information can be used to update and improve the algorithmic support of the Datahub, particularly in the processing and using statistical data.
The processes of collection, processing, and using statistical data are typically implemented within aviation equipment operation and maintenance systems [
27,
28]. In general, the main goal of the operation system is to ensure a specified level of efficiency in the utilisation of equipment for its intended functional purposes. To achieve this goal, the following processes are performed in the operation system:
Maintenance and repair.
Monitoring and control of all components of the operation system.
Service life extension.
Flight and ground inspections.
The optimisation of the spare parts stock and logistics of their replenishment.
Analysis and testing of methods for increasing reliability during the operation of equipment in related industries.
The implementation of research and development results.
The training and professional development of personnel.
Environmental protection.
Access control and the prevention of acts of unlawful interference [
29,
30].
Taking into account the mentioned information, the goal and objectives of this study can be formulated.
The aim of the study is to reduce the costs for aviation equipment operation by developing a new approach to data processing that takes into account the possibility of the changepoint in the trends of aviation equipment parameters.
To achieve this aim, the following research objectives are considered during this study:
An analysis of the features of the Datahub implementation for collecting, processing and using statistical data in the air navigation service system for sustainable development.
The determination of the structure and content of the Datahub for collecting, processing and using statistical data.
The development of methods for detecting the changepoint, estimating model parameters after the changepoint, and predicting future trends in changes in aviation equipment characteristics.
A comparative analysis of two data processing options (with and without taking into account possible changepoint).
The scientific novelty of this study is the combination of a set of different data processing methods in the case of objective presence of the changepoint, which includes detection of the changepoint, estimation of model parameters after the changepoint, and forecasting future trends in changes in the characteristics of aviation equipment. At the same time, an original statistical model is proposed that describes reliability indicators and diagnostic variables of aviation equipment. In general, the proposed model and a set of data processing methods for aviation applications have not been studied in the scientific literature. The obtained scientific results can be used to reduce operational costs in the context of the sustainable development of the aviation industry.
2. Literature Review and Problem Statement
The use of new technologies based on modern scientific and technological achievements is key to the development of the aviation industry. Currently, these technologies are being implemented to address a wide range of challenges within civil aviation systems [
31]. The collection, processing, and usage of statistical data can be considered within the framework of the data-driven decision-making concept and Industry 4.0 technologies [
32,
33].
The introduction of modern information technologies is one of the tasks supporting the sustainable development of civil aviation. According to [
34], the main ambitious challenges facing the aviation industry by 2050 are
The usage of the most advanced types of aviation equipment and the provision of effective services based on their operation.
Attracting talented industry professionals to address the urgent needs of the aviation industry.
Meeting market demands for sustainable, reliable, and safe transportation of passengers and their baggage at the required capacity.
Protecting the environment.
Ensuring the required levels of aviation safety.
Overall, there are a lot of studies devoted to the issue of the sustainable development of the aviation industry.
Article [
35] considers one of the key areas of sustainable development, which is the electrification of the aviation industry. The authors highlight the advantages of electric aircraft, including the reduction in carbon dioxide emissions, noise levels, and fuel costs. In the section devoted to sustainable development, the paper presents information on the possibility of carbon dioxide emission reductions by up to 80% when using alternative types of fuel. The authors also investigate the life cycle of hydrogen production and establish that even green hydrogen possesses a significant carbon footprint. Another aspect of the study involves assessing the impact of reduced take-off and landing times on lowering environmental emissions. Additionally, a number of infrastructure changes and the need for the development of new standards and regulatory documents are identified as critical steps towards the full transition to electrified aviation.
In light of the current global shortage of vital resources, particularly energy and clean air, several regulatory documents have been introduced in the field of civil aviation to regulate the reduction in pollutant emissions into the environment [
36]. The introduction of electric aircraft must also meet most existing safety requirements and regulatory standards, including the development of new supporting infrastructure.
The article [
37] examines approaches to sustainable aviation development based on the optimisation of technological operations. The author focuses on the optimisation of flight and ground operations in order to reduce the environmental impact of the aviation industry. The paper analyses key factors affecting sustainable development, including flight planning, maintenance, and fleet and crew distribution. One of the proposed solutions is the implementation of digital technologies and artificial intelligence to optimize these processes.
The author of the article [
38] analyses the problem of sustainable development in the general aviation sector. In the part of sustainable development, the article addresses environmental challenges such as the use of various types of fuel, noise pollution, and the operation of outdated aircraft. Considerable attention is paid to the human factor during the implementation of new technologies. The analysis identifies the need to integrate sustainable development issues into pilot training programmes.
Key aspects of sustainable development within the airport ecosystem are investigated in the study [
39]. The paper focuses on the analysis of sustainable development challenges and their impact on the transformation of the aviation industry. The authors examine aspects such as forecasting passenger flows and assessing the economic impact of new routes during the deployment of new low-cost airlines. The article also addresses the issue of human factors management in aviation, in particular the development of models that consider human behaviour and cultural influences. Overall, integrated and systemic approaches to sustainable development within the airport ecosystem are identified as important components for increasing the operational efficiency of airports and airlines [
40].
The article [
41] focuses on the methodology for assessing the environmental sustainability of airports. This research aims to develop an algorithmic assessment system based on the use of the rank sum method to compare airports according to various environmental indicators. Among the issues of sustainable aviation development, the authors focused their attention on energy management, issues of air pollution, possibilities of noise reduction, water drainage, and waste disposal. The study also establishes the importance of integrating sustainable practices into airport operations in order to mitigate negative environmental impacts.
The article [
42] explores the possibilities for reducing greenhouse gas emissions in the airspace of the Netherlands. The authors analyse different decarbonisation scenarios, with particular attention given to the introduction of sustainable aviation fuel, the electrification of ground operations, and the optimisation of aircraft routing. They conclude by emphasising the importance of investment in the research and development of new technologies to achieve sustainable development goals.
The authors of the article [
43] propose a new methodology for assessing the sustainable development of the aviation industry using a data efficiency network analysis model. The model takes into account the relationships between different civil aviation systems. Based on the application of this model, it is possible to assess the efficiency of resource usage, environmental impact, and economic performance.
Innovative approaches to increasing environmental sustainability in the transport sector through surface modification and the control of material morphology are discussed in the article [
44]. The authors study the influence of the microstructure and texture of vehicle surfaces on aerodynamic resistance, thermal conductivity, and energy consumption. The results of the study emphasise the need to integrate new technologies into the production and operation of vehicles to increase the efficiency of civil aviation in the context of sustainable development.
An important direction for the sustainable development of civil aviation is the saving of expendable resources and cost reduction [
45]. It is known that maintenance costs significantly exceed the initial cost of aviation equipment. Therefore, the introduction of new maintenance models based on data processing technologies is an important aspect of the civil aviation development.
The article [
46] examines the factors affecting the profitability of aviation enterprises that perform maintenance and repair procedures for aviation equipment. The authors analyse the statistical data of aviation enterprises to identify key variables that determine an enterprise’s profitability. The study emphasises the importance of using analytical and computational tools to support strategic decision-making aimed at improving the efficiency and competitiveness of enterprises operating aviation equipment. The results of the paper can be used to develop sustainable development policies in the aviation sector, particularly by optimising resource usage and implementing innovative approaches to profitability management.
The authors of the article [
47] analyse the possibilities of using simulation modeling to optimise the duration of winter maintenance at airports. The main focus of the paper is placed on studying the effectiveness of planning and resource utilisation during equipment maintenance and their impact on flight delays, flight safety, and energy consumption. The use of simulation models allows us to determine optimal approaches to the distribution of equipment, machinery, and personnel to ensure the integrity and continuity of airport services.
The article [
48] examines the features of implementing technical condition monitoring systems throughout the life cycle of aviation equipment in order to increase the economic efficiency of the aviation industry. The authors propose the integration of monitoring technologies with the Internet of Things, artificial intelligence, and blockchain technologies. This integration enables real-time monitoring, data processing, cybersecurity provision, and the secure storage of data and processing results. This approach helps to reduce maintenance costs, optimise certain maintenance and repair operations, and increase the reliability of aviation equipment.
The problems of the analysis of changepoints are widely considered in various spheres of society. According to the article [
49], the problems of the analysis of changepoints can be considered from the point of view of the expert approach of a person during the monitoring of various processes. However, such an approach is laborious and subjective. The automation of the process can consist of using algorithmic means of pre-processing to fix the fact of non-stationarity and to determine the changepoint in the model. The study conducted by the authors established that at least 16.4% of time series have a changepoint; that is, the relevance of taking into account the changepoint is justified and should be solved for practically significant industries.
The article [
50] considers the problems of synthesis of four methods of statistical classification for the detection of changepoints. The main attention of the authors is paid to the mathematical synthesis of detectors based on the use of the likelihood ratio, ordinary least squares, CUSUM technology, and the comparison method. However, the authors do not provide the calculation of performance indicators and do not perform a comparative analysis of the proposed algorithms. In general, the article emphasises the importance of applying the technology of changepoint detection in the financial sector.
The article [
51] is devoted to the synthesis and analysis of Bayesian methods for changepoint detection. The authors use real data described by a non-stationary random process. To compare the proposed detection procedures, the article presents the features of calculating the probability of correct detection, false alarms, and target misses. It should be noted that Bayesian methods have a significant drawback due to the need for a priori information on the probabilities of the hypothesis and the alternative, as well as the cost function.
The authors of article [
52] performed a comparative analysis of several methods for detecting the changepoint based on supervised learning by calculating the correlation coefficient and using built-in MatLAB functions. The obtained results showed that during the analysis of Lidar data, the probability of making the correct decision was approximately 83.7%.
The article [
53] focuses on the features of changepoint detection based on the authors’ assumption of different distributions of the data at intervals before and after the changepoint. Therefore, the feature of the changepoint was considered to be the distance between the two distributions, for which the scaled-Bregman divergence was used. This estimate was also integrated into the kernel regression model to improve the detection characteristics.
The authors of the article [
54] performed the synthesis of a changepoint detector using the Bayesian approach, the well-known changepoint model, and regression dependence. Despite the high efficiency of the method, the proposed approach has a number of limitations, including its application to time series with gaps and the need for a large amplitude of data variation.
The article [
55] is devoted to the features of the analysis of time series with one and several changepoints. In the case of a single changepoint, the authors performed a comparative analysis of methods based on the CUSUM statistic and improved them by using the squares of the decision statistics. In the case of multiple changepoints, a new distance measure was introduced. The results showed that the efficiency of different detection methods depends on the specific data being processed.
The authors of the article [
56] focused on the analysis of performance indicators after changepoint detection. Such an analysis allows for reducing the level of uncertainty after detection and using less information. The proposed approaches are illustrated by examples of a real dataset and generated data.
The articles [
57,
58] provide a detailed classification and comparative analysis of the efficiency of different methods for detecting changepoints. The authors noted the main challenges that need to be addressed in this area of scientific research.
In general, the theory of reliability, maintenance, and repair is well developed for the cases corresponding to the useful life stage of equipment [
59]. In such cases, general models of operating time between failures are used, and these models are extensively described in the scientific literature [
60,
61]. The trends in statistical data are typically characterised by stationary random processes [
62,
63].
However, in cases where the technical condition of equipment deteriorates, the stationarity of the nature of the data trends regarding reliability parameters and diagnostic variables is disrupted [
64]. In this case, the moment of deterioration of the technical condition is random with an unknown distribution and parameters. This, in turn, complicates the synthesis of data processing algorithms and increases the level of a priori uncertainty [
65].
Overall, the deterioration of the technical condition should be detected as early as possible, after which the parameters of the models describing changes in reliability indicators and diagnostic variables can be estimated [
66,
67]. Following the detection of deterioration, models describing changes in the trends of these indicators can be constructed. It is quite logical to apply a segmented regression with a single switching point to describe such a trend. To build an accurate model, the optimisation approach described in the article [
68] can be used.
The results of the assessment and the obtained mathematical models for describing trends in statistical data can be used to solve prediction problems. In this case, the remaining useful life of the equipment and the possible moment of failure can be determined. Information regarding the possible time of equipment failure is used to perform predictive and corrective maintenance activities [
69].
Let us perform a mathematical formulation of the research problem. As a generalised efficiency indicator, we choose costs , which are associated with the possible risks in the air navigation service system arising from failures, damage, and malfunctions during equipment operation, as well as inconsistencies within the supporting processes. Therefore, in the general case, the cost vector is a function of the risks, expressed as .
Typically, in accordance with the concept that civil aviation is a system of systems, we believe that there is a vector of systems . During the operation of the systems, there is a set of data and components for monitoring and control . Throughout these processes, corresponding processing algorithms are applied for monitoring and control . These processing algorithms are closely linked to statistical models and to existing or measured datasets . The functioning of the systems relies on the provision of resources within a specific operational environment considering any existing or potential limitations .
Taking the above into consideration, it is possible to formulate the generalised functional dependence for the components of the investigated industry.
To address the challenges of sustainable development in civil aviation, it is necessary to decompose the tasks and research activities at the level of each individual system. In general, this involves planning a set of studies that collectively represent a sophisticated system design problem.
Therefore, this study considers the synthesis and analysis of data processing algorithms within the corresponding Datahubs during the monitoring and control of reliability parameters and diagnostic variables in the air navigation service system for the further minimisation of operating costs. In this paper, the main focus will be paid to Datahub infrastructure for aviation radio equipment.
3. Materials and Methods
A generalised structural diagram of the components, illustrating the structure of the civil aviation air navigation service system, is presented in
Figure 1.
The air navigation service system is a complex and sophisticated system in both structure and content. It includes aviation radio equipment for communication, navigation, surveillance, and the air traffic controllers themselves. To ensure the efficient operation of aviation radio equipment, appropriate structural elements are used. The common feature of these elements is the existence of technological processes and personnel responsible for their execution. According to the functional purpose, the efficiency provision system comprises the following components: normative standards, manufacturing plants, repair centres, research and development institutes and groups, national regulatory documents, resources, and training centres. The initial information for decision-making is derived from monitoring and control results, which form part of the algorithmic support system. Based on the results of data processing, preventive and corrective measures of both current and strategic nature are formulated. At the same time, an analysis of efficiency is performed, taking into account the objectives of the aviation equipment operation system. Datahubs accumulate data from all components of the air navigation service system and form the foundation for the improvement and sustainable development of civil aviation.
Let us define the set of algorithmic support tools for solving the problems considered in this study. Algorithmic support is a set of data-collecting procedures, processing technologies, and data-driven decision-making approaches that can be integrated into the generalised structure of the Datahub.
According to [
70], a Datahub integrates a set of technical computing facilities for receiving, storing, processing, ensuring data confidentiality, supplying power, and managing software. A typical Datahub can include thousands of servers through various types of network infrastructure. The critical issue in this case is establishing reliable communication between all network components, saving electricity, automating processing, and supporting decision-making processes.
The architecture of a possible Datahub infrastructure is given in [
71]. This Datahub includes two types of datasets. The first type consists of artificially generated data, which is required for training models and analyzing the effectiveness of prospective data processing algorithms. The second comprises external datasets, created based on the observation of specific objects or phenomena. Such datasets may contain information presented in either digital or categorical form.
Information is transmitted to the Datahub via network equipment. The sources of this information include Internet of Things sensors, measuring equipment, data from open databases, knowledge repositories, and other sources. Therefore, in the context of aviation radio equipment, during the Datahub deployment, issues concerning the compatibility of the monitoring and control system with network equipment must be addressed.
During the operation of aviation radio equipment in civil aviation, algorithmic support is used to perform the following tasks:
The analysis of the processes of deterioration in technical conditions.
The assessment of reliability and forecasting of the remaining useful life of equipment and its components.
The optimisation of the spare parts inventory.
The determination of preventive thresholds within the framework of condition-based maintenance strategies.
The diagnostics and identification of faulty elements.
The determination of the number of maintenance staff required and the specification of their necessary skills.
The prediction of future trends in diagnostic variables and reliability parameters.
The determination of the location and scope of repair centres.
The analysis of the tactical and technical characteristics of aviation equipment during marketing research and the equipping of aviation enterprises in accordance with international and national regulatory requirements.
The analysis of information flows and decision-making schemes to ensure the optimal functioning of the organisational triad in civil aviation, namely state regulatory authorities, operating enterprises, and research and development organisations.
The creation of an algorithmic support system involves the solution of problems related to the synthesis and analysis of data processing algorithms. Synthesis problems are usually solved analytically through the application of methods from probability theory, mathematical statistics, machine learning, artificial intelligence, and other fields. Analysis problems involve identifying key performance indicators and studying the suitability of the algorithm for solving a specific problem.
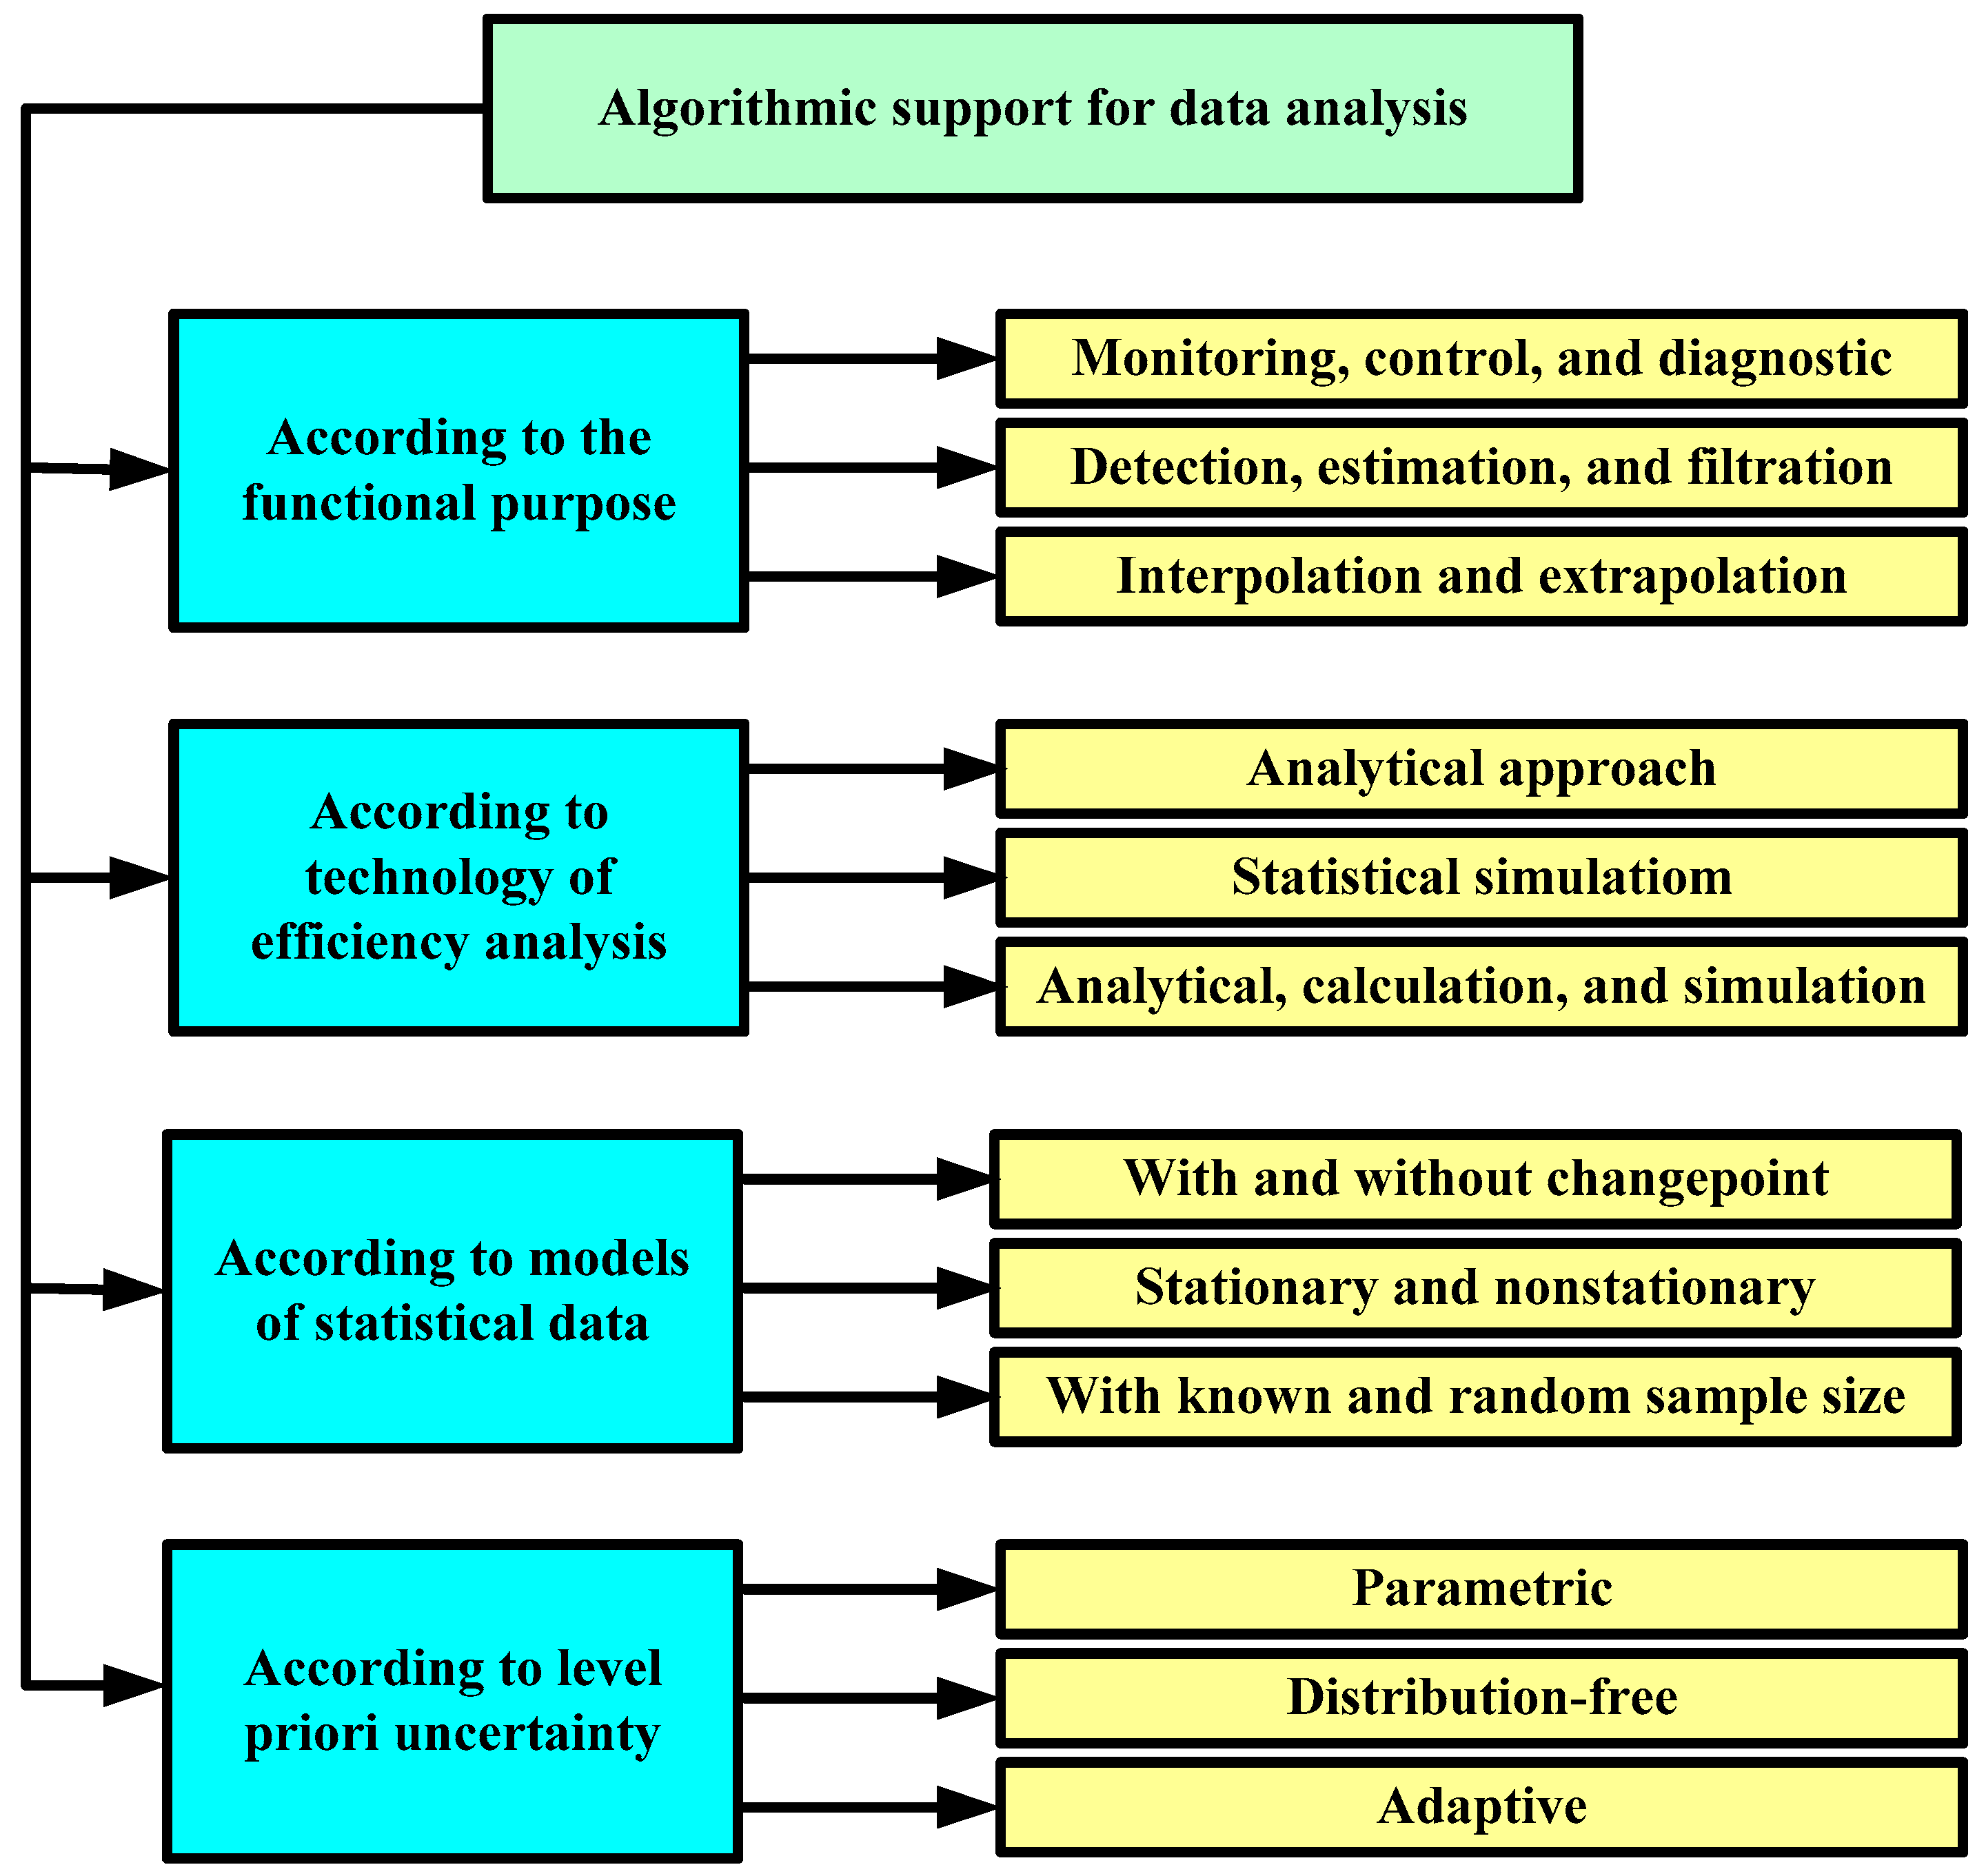
Algorithmic support can be classified according to four characteristics, namely functional purpose, efficiency analysis, statistical data model, and the level of a priori uncertainty.
The structure of the Datahub’s algorithmic support system is presented in
Figure 2.
Thus, the air navigation service system includes several areas that require attention and improvement. The Datahub addresses all these tasks by implementing the appropriate data processing algorithms.
In other words, the Datahub is a complex environment for data and information collection, data processing, and the formulation of preventive and corrective measures, followed by the assessment of the effectiveness of their implementation. Physically, the Datahub must be hosted on server equipment, incorporate a set of hard drives, provide computing capabilities, and ensure the protection and confidentiality of data and information in the face of potential cyber threats and cyber incidents. It should be noted that cyber threats and cyber incidents represent the negative consequences associated with the development, use, and implementation of information technologies. Therefore, the issues of detecting and preventing cyber threats must be systematically addressed.
When creating and deploying Datahubs, it is necessary to rely on appropriate methodological support. This support can include methods, concepts, principles, standards, theorems, statements, approaches, models, etc.
Methods include approaches to the synthesis of data processing procedures (for example, based on maximum likelihood estimation, sequential Wald analysis, the Bayesian approach, and others), their analysis (for example, using analytical, statistical simulation, and computational modeling), the use of a priori data models (in particular, Gaussian, exponential, uniform distributions, a mixture of deterministic and stochastic processes, and others), and the establishment of desired quantitative values for performance indicators (for example, requirements for the probability of correct detection during classification, minimum bias and variance during evaluation, etc.). In the general case, methods should be adaptive, considering varying levels of uncertainty.
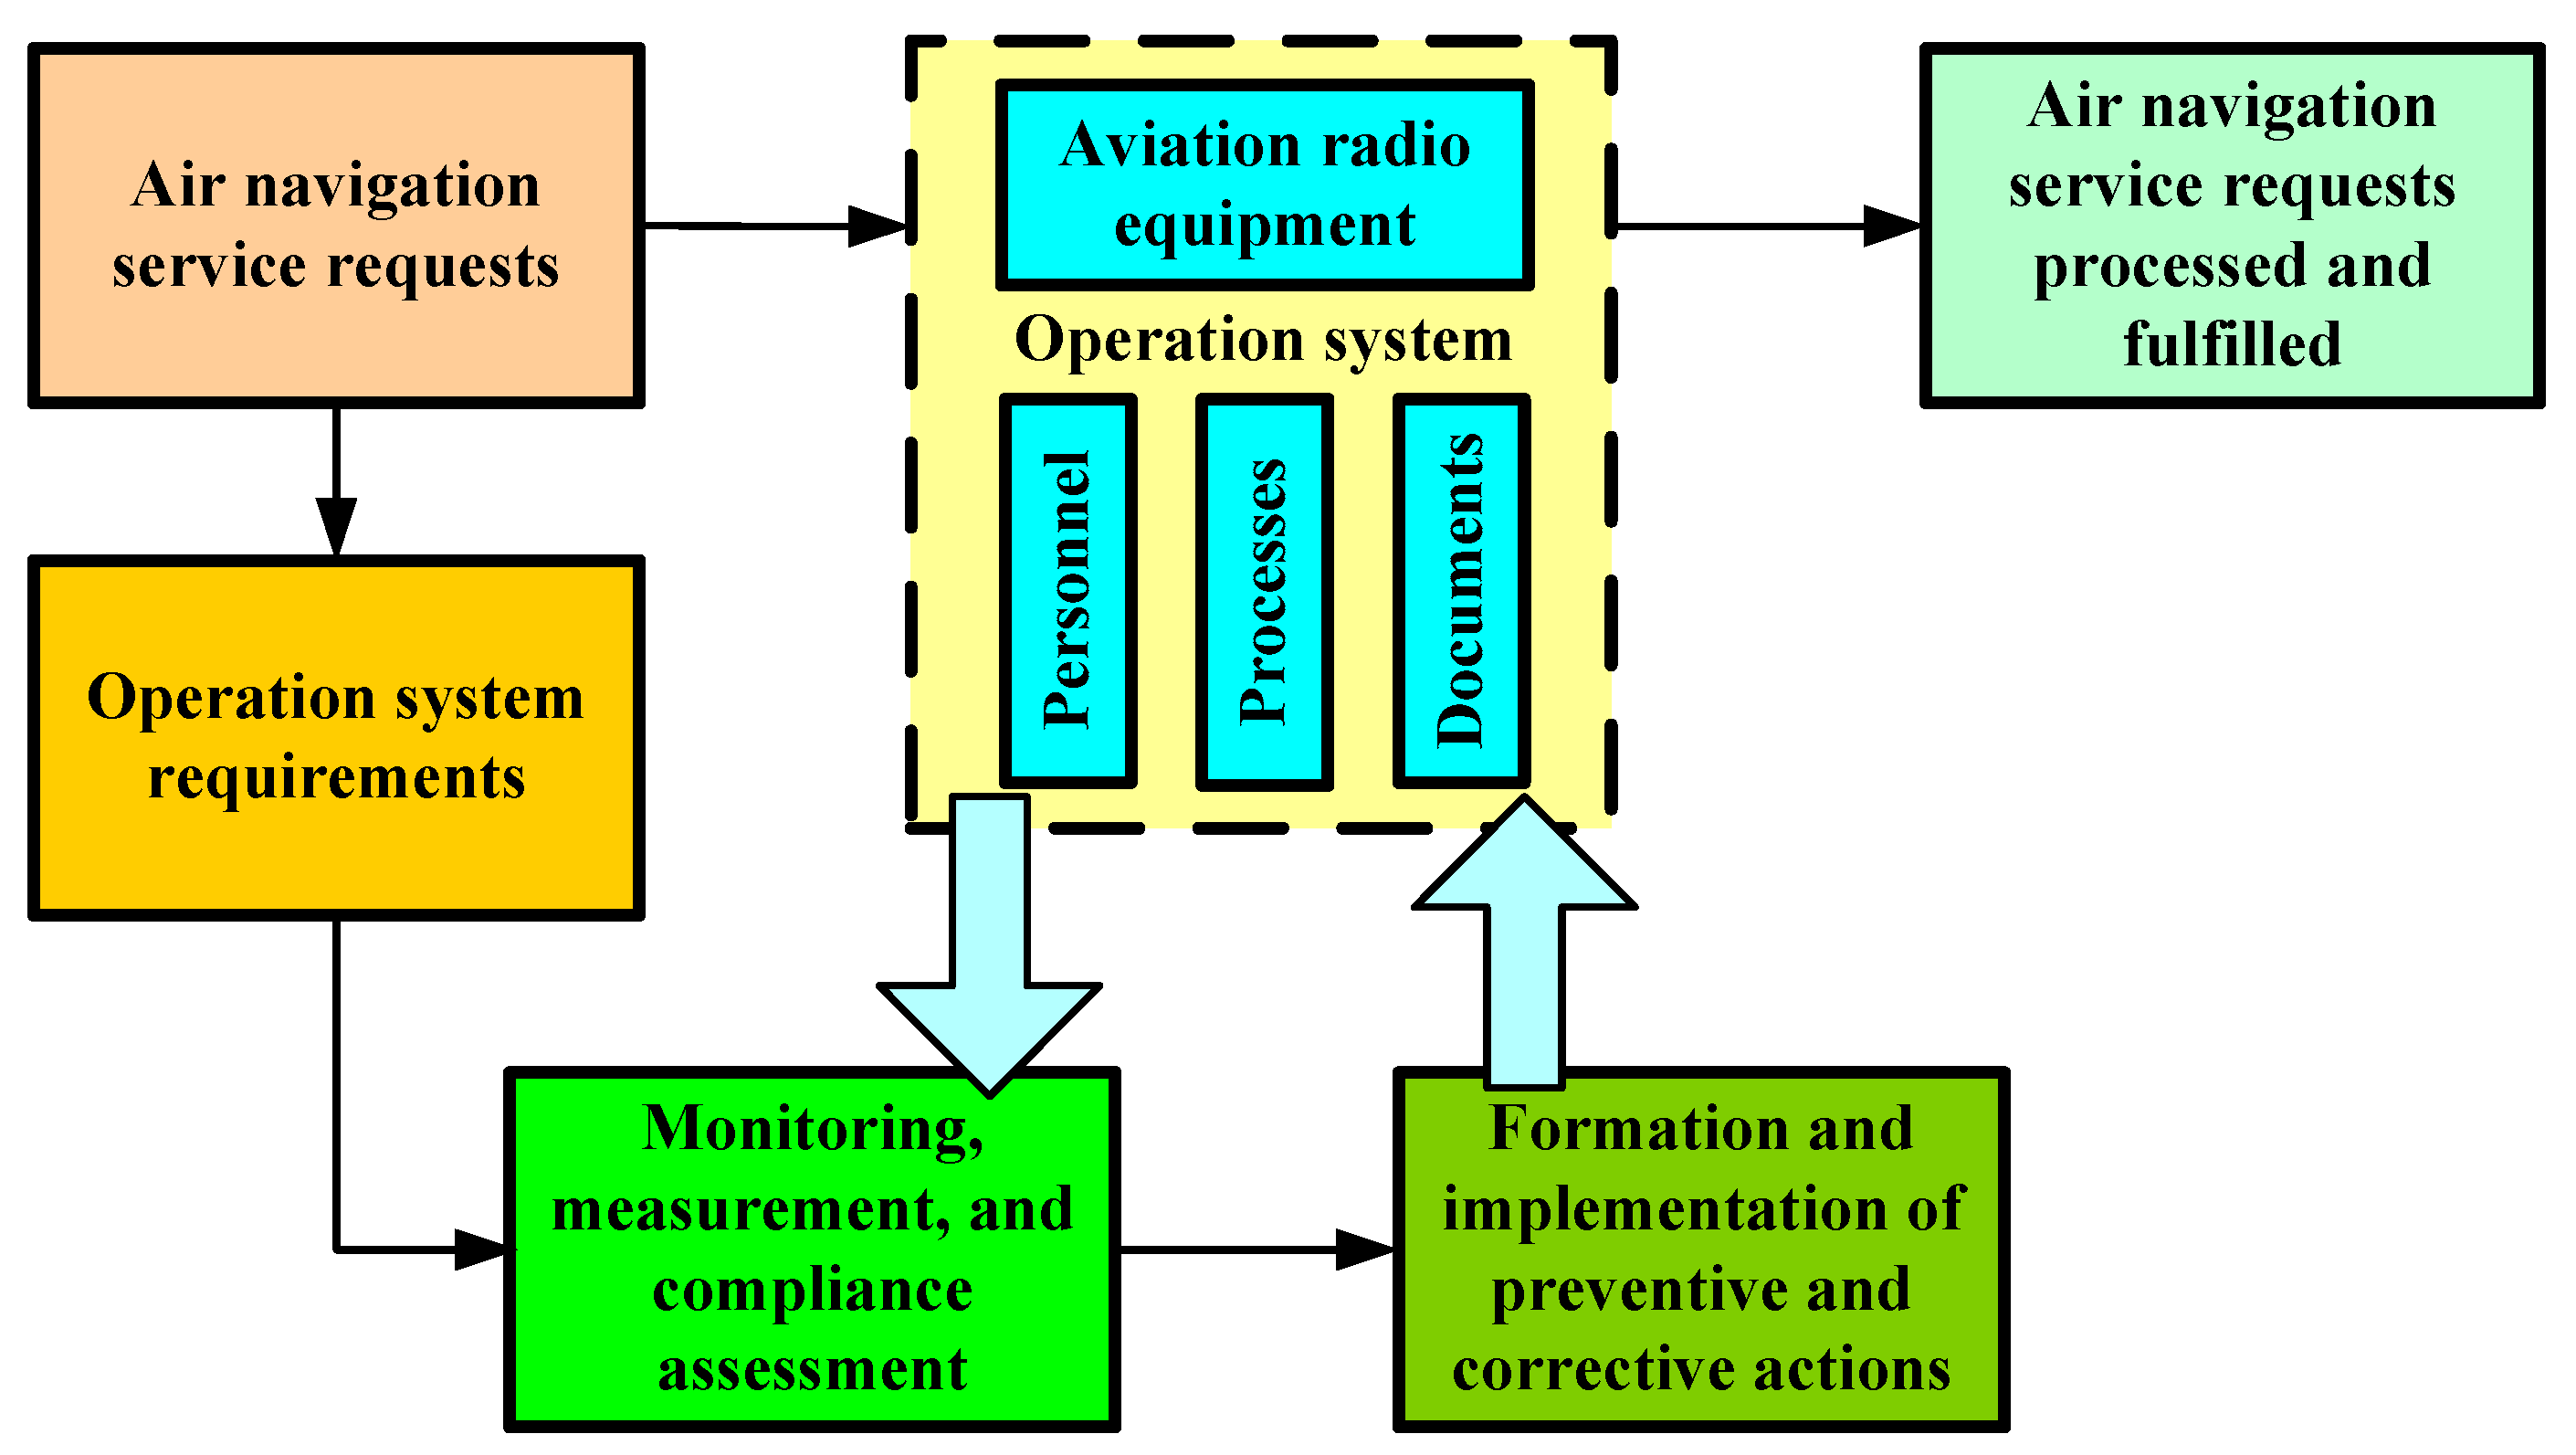
To develop the structure of the Datahub, we will represent the operation system in the form shown in
Figure 3.
The operation system of aviation radio equipment as a service-type system is aimed at ensuring the efficient execution of the flow of requests for air navigation services. This is achieved by monitoring the condition of the constituent elements. Using the results of monitoring, we can make preventive and corrective actions based on data processing.
The Datahub architecture for the aviation radio equipment and system governing their operation can be represented as a set of interacting, distinct units. Operational practice allows nine units to be identified:
- -
Unit for monitoring the parameters of the flow of incoming requests for air navigation services and their associated requirements (U1);
- -
Unit for monitoring the level of satisfaction among consumers and stakeholders (U2);
- -
Unit for monitoring the objectives of the aviation enterprise (U3);
- -
Unit for monitoring the skills and number of maintenance staff (U4);
- -
Unit for monitoring the consumption of resources (U5);
- -
Unit for assessing the conformity of documentation (U6);
- -
Unit for assessing the conformity of technological processes (U7);
- -
Unit for monitoring the quality of functioning of ground aviation radio equipment (U8);
- -
Unit for monitoring the implementation of efficiency measures (U9).
Let us consider the interaction between procedures and algorithms for data processing and decision-making within individual units based on the examination of their respective functions.
The unit for monitoring the parameters of the flow of incoming requests for air navigation services and their associated requirements (U1) processes input information relating to the needs for the intended use of ground-based aviation radio equipment. This unit implements the procedures for assessing compliance, forming appropriate databases, conducting primary data processing, and presenting the results in a form convenient for making preventive and management decisions. The input information for Unit U1 is data regarding the needs of consumers of air navigation services, state regulatory bodies, and international organisations in the field of aviation industry. At the initial stage, this information is compared to the established requirements, defined by normative standards and regulatory documents. During the initial data processing phase, the number of potential discrepancies is determined and compared against a predetermined threshold. If the threshold is exceeded, signals are generated to initiate preventive and managerial actions.
The unit for monitoring the level of satisfaction among consumers and stakeholders (U2) is designed to assess the accuracy and appropriateness of the flow of incoming requests. This unit implements the procedures for measuring diagnostic variables, assessing compliance, evaluating parameters, and forming databases. The input information for Unit U2 comprises data on the needs of consumers and stakeholders, the requirements of normative standards and regulatory documents in the field of the operation of aviation radio equipment, and statistical data on diagnostic variables of equipment and the operation system. The assessment results form the basis for the formation and implementation of preventive and managerial decisions.
The unit for monitoring the objectives of the aviation enterprise (U3) has a structure identical to Unit U1. However, the input information for this unit also includes data from various structural divisions of the aviation enterprise concerning the implementation of individual technological processes and procedures. The monitoring and control of these indicators, alongside the assessment of the compliance of tasks, policies, vision, and technological processes, are carried out to ensure their consistency with the overall objectives of the aviation enterprise.
The unit for monitoring the skills and number of maintenance staff (U4) is designed to determine quantitative indicators for personnel, considering the total amount of equipment in operation, and the associated maintenance and repair work. The functioning of Unit U4 is closely connected with the activities of educational institutions, research and development laboratories, and manufacturing plants, where training and qualification enhancement programmes are conducted.
The unit for monitoring consumable resources (U5) collects and processes information on available operational assets, including buildings, the condition of premises, workplaces for the repair of equipment components, spare parts for aviation radio equipment elements, measuring instruments, personal computers with installed software, and other resources. During information and data processing, this unit also solves the problems of the logistical support of equipment components in the event of failure, including the management of spare part inventories.
The documentation conformity assessment unit (U6) processes information derived from normative standards and regulatory documents in the field of civil aviation. Unit U6 also accumulates a knowledge base from open scientific sources, including articles, conference papers, presentations, and other relevant materials.
The technological process conformity assessment unit (U7) collects information on key performance indicators of technological processes and specific procedures related to maintenance, repair, diagnostics, technical condition monitoring, and other processes of the operation system. The purpose of this unit is to process relevant data for the constant search for ways to improve aviation infrastructure. Unit U7 interacts with all preceding units and consolidates the information received from them.
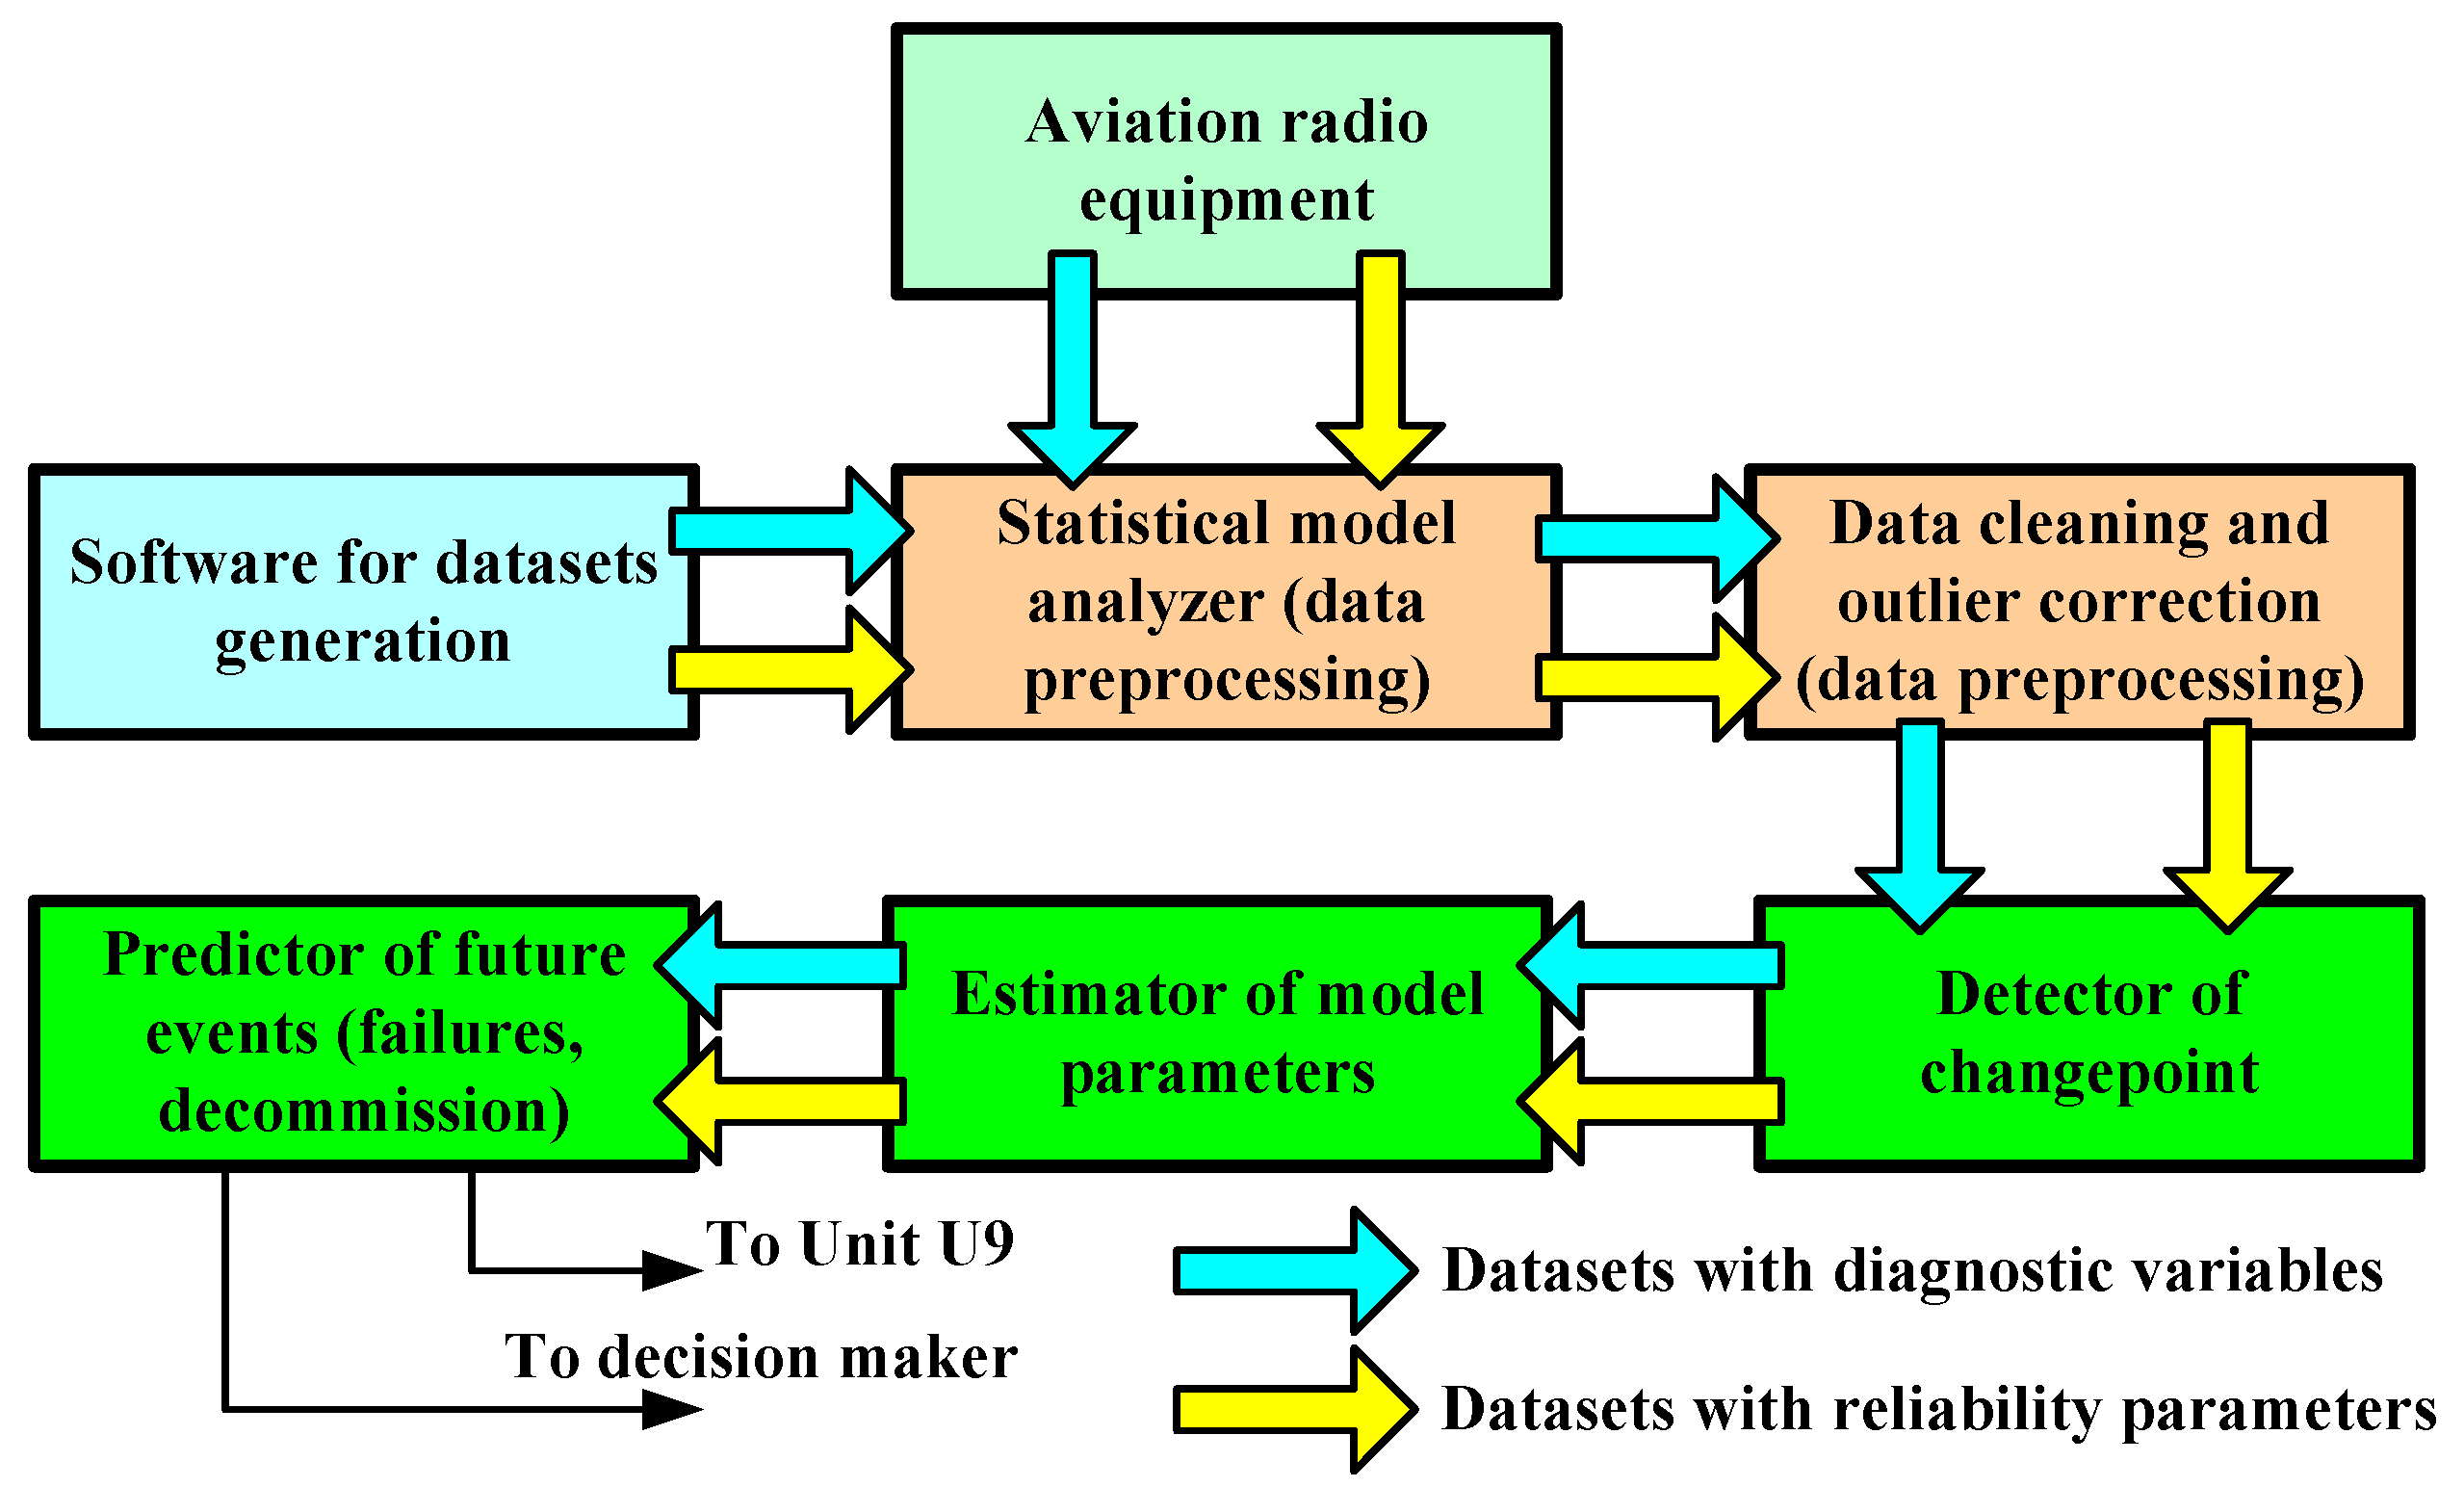
The unit for monitoring the quality of functioning of ground-based aviation radio equipment (U8) collects and processes data obtained during the operation of aviation radio equipment, including diagnostic variables and reliability parameters. This unit is the most complex, incorporating the full set of algorithms presented in
Figure 2. Based on the data processing results within Unit U8, decisions are made regarding preventive maintenance, the remaining useful life of equipment, equipment decommission, the presence of deterioration in technical condition, and other related aspects.
The efficiency monitoring unit (U9) collects processed information from Units U7 and U8 (relating to technological processes and aviation radio equipment operation) and determines generalised efficiency indicators, including average operating costs, operational costs per observation interval, air navigation service risks, aviation system integrity, safety levels, and other relevant measures.
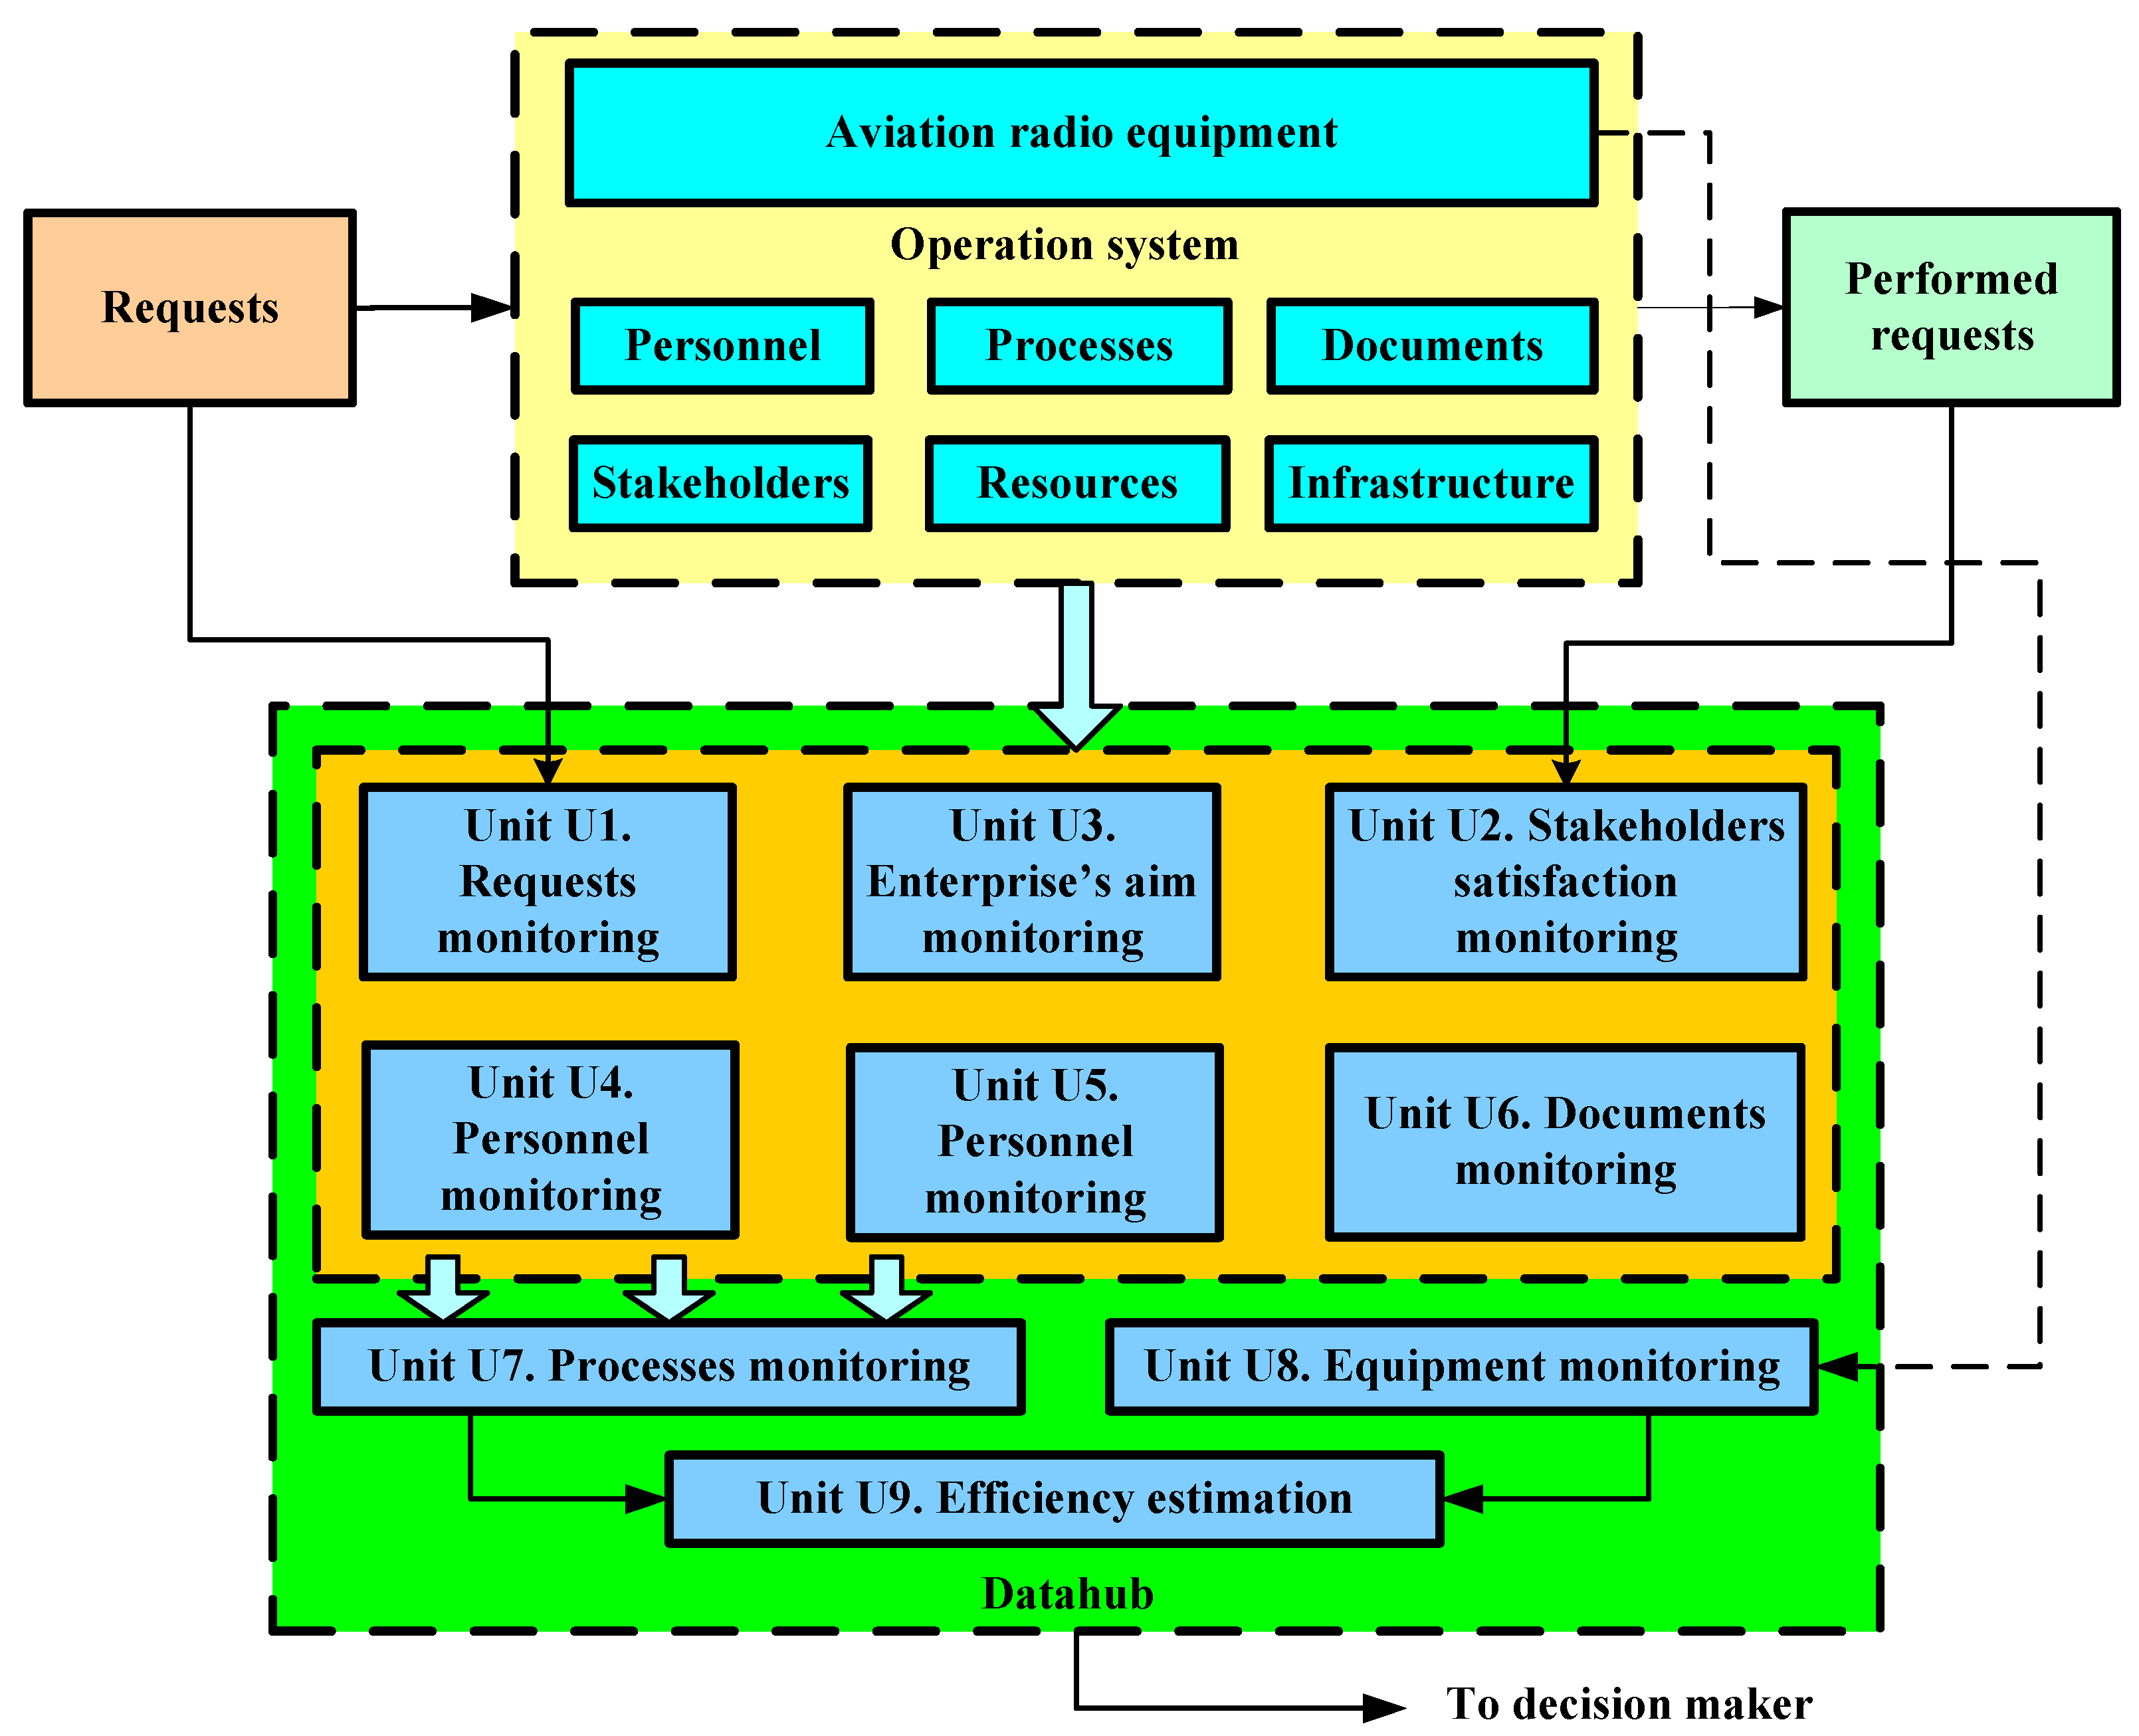
The structural diagram of the Datahub units is presented in
Figure 4.
Aviation radio equipment is the main element of the operation system. The reliability and efficiency of this equipment largely determine the overall effectiveness and quality of air navigation services. Therefore, particular attention must be paid to Unit U8 during the implementation of the Datahub, specifically in relation to the collection and processing of data on reliability and diagnostic variables.
As radio equipment is subject to the influence of random external factors, its technical condition may change over time. Under such circumstances, data trends become non-stationary with different probability density functions or variations in their statistical characteristics (such as expected value, variance, and standard deviation). This feature significantly complicates the tasks of synthesis and analysis of the algorithmic support necessary for informed decision-making within Unit U8.
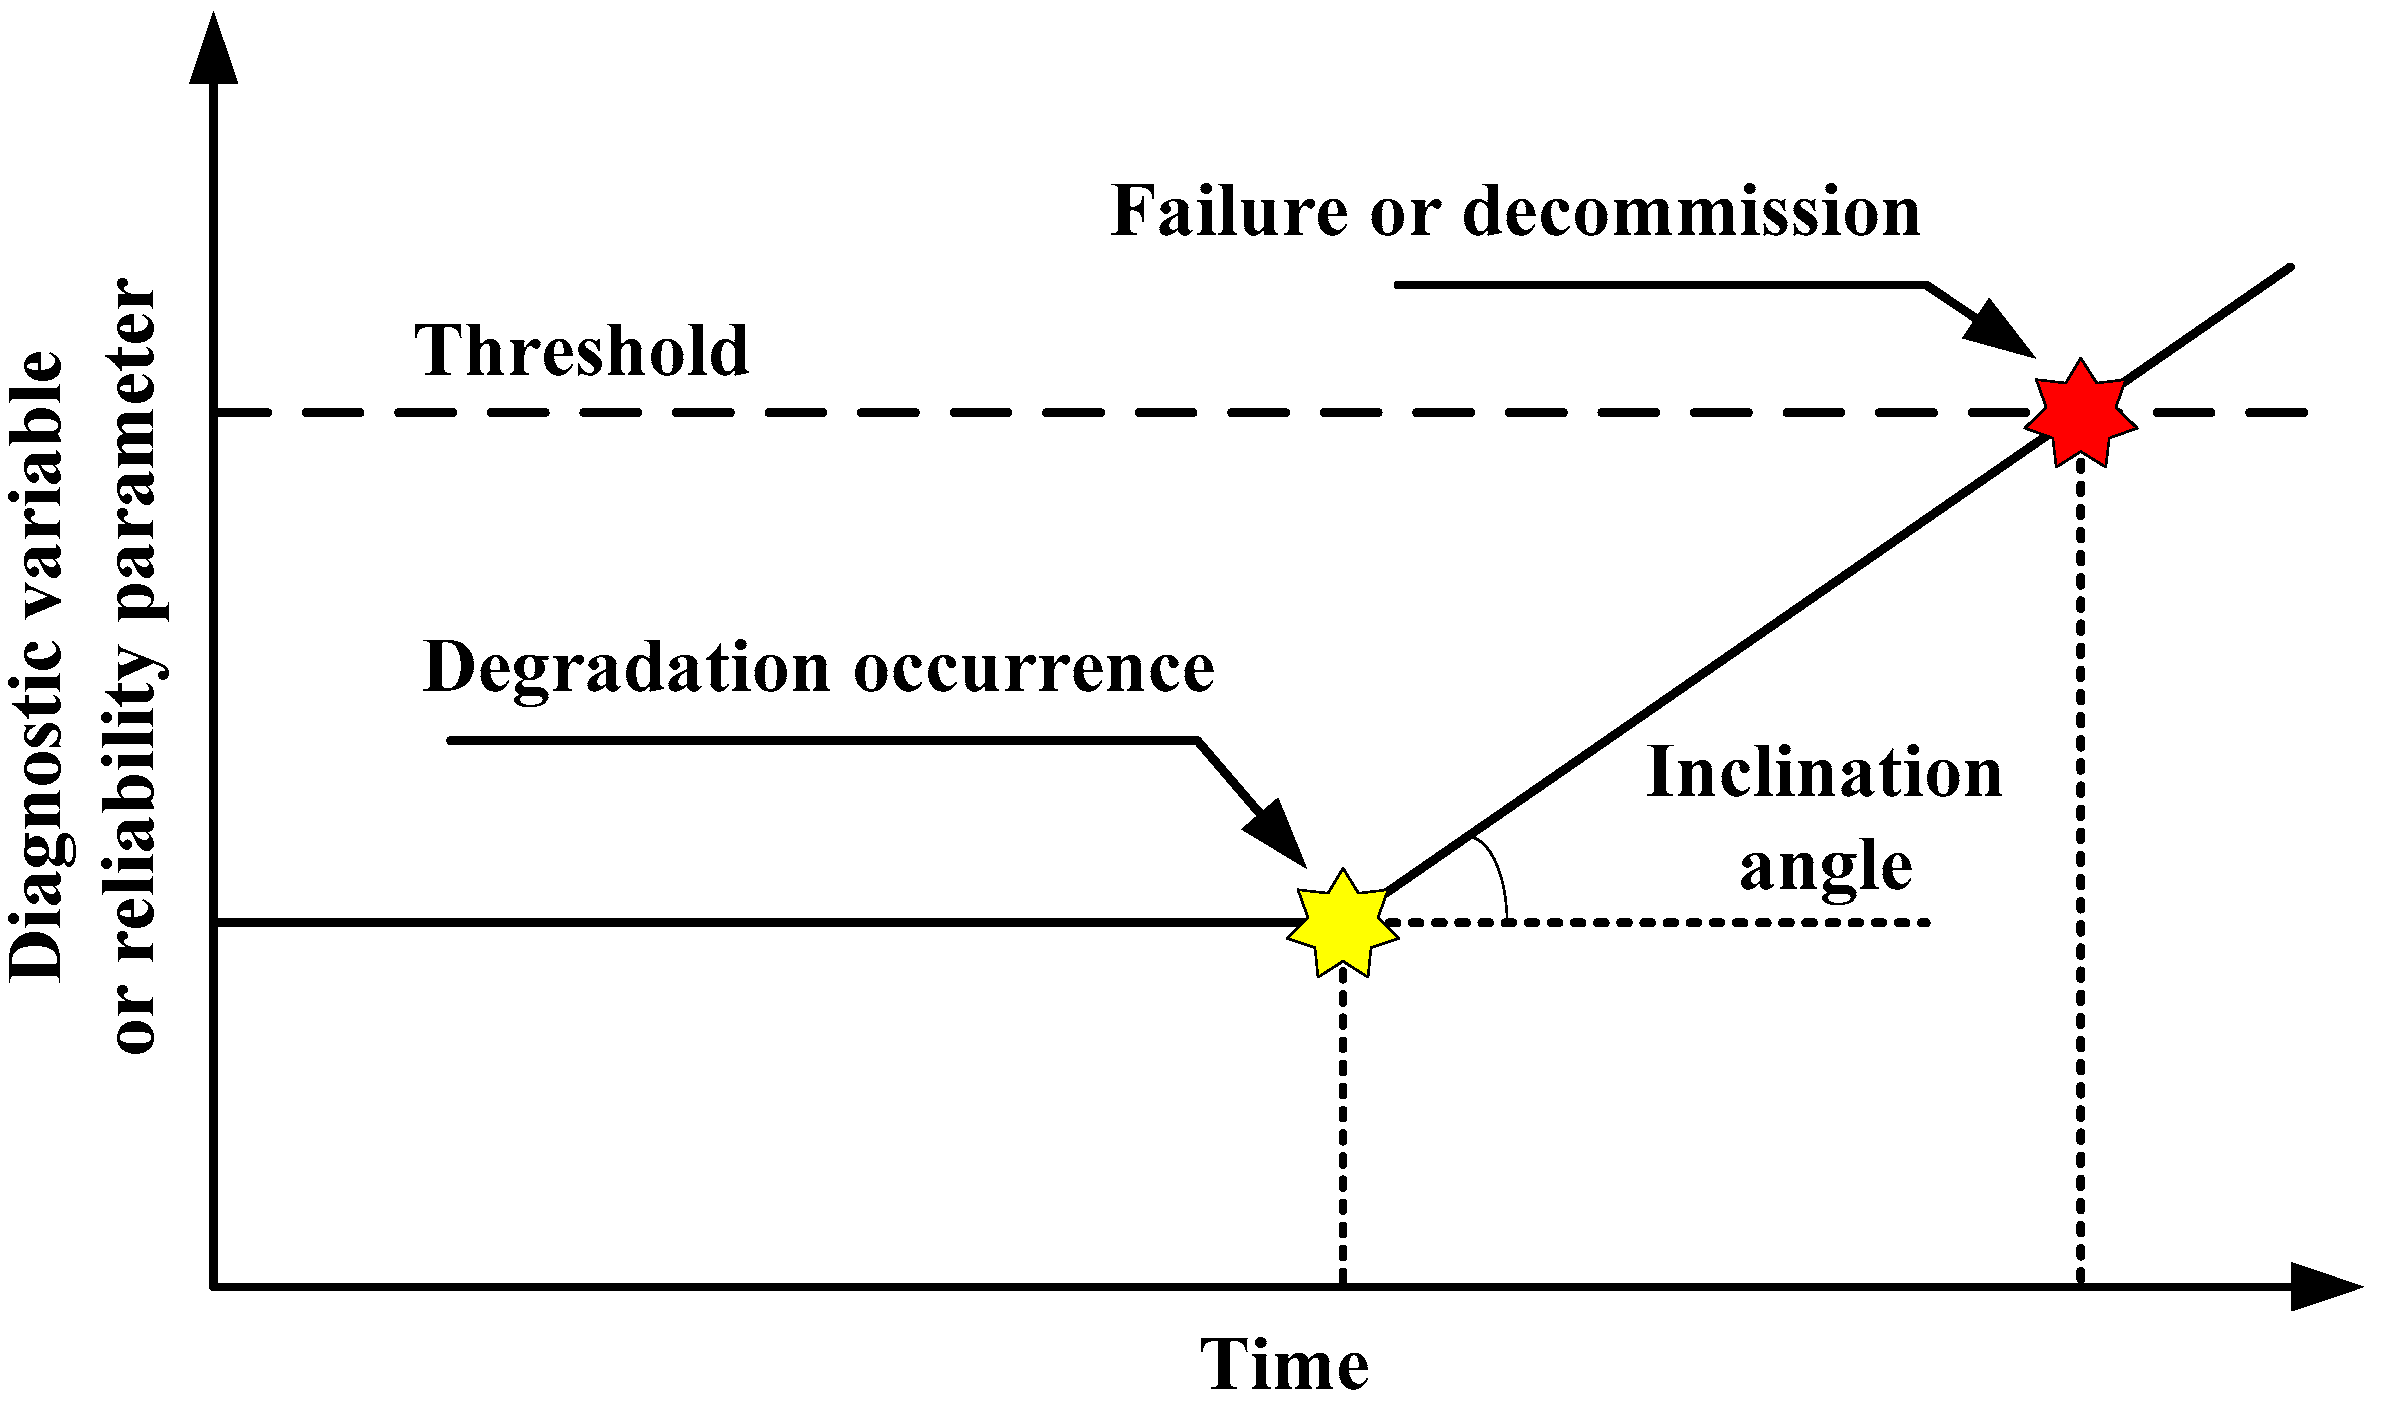
The degradation processes of aviation radio equipment can occur at random moments in time. Usually, the probability density function of the moment at which the deterioration of the technical condition occurs is unknown. Analysis has shown that, in most recorded cases of equipment operation, the deterioration of the technical condition can be described by a linear model (
Figure 5).
Figure 5 illustrates two possible options for the deterioration of the technical condition: one observed through reliability parameters (typically the failure rate) and the other one through a diagnostic variable. In both cases, it is necessary to apply three data processing algorithms: detection, estimation, and prediction. In the case of failure rate monitoring, it can be assumed that the failure rate remains constant during the period of useful life and is equal to
. If a degradation process occurs after the
-th observed failure of equipment, then the failure rate trend begins to grow according to a linear model with an unknown tangent of inclination angle
. When the failure rate reaches a certain threshold level, a decision is made regarding the potential decommissioning of the equipment.
In general, statistical data processing methods can be considered for solving the problems of detection, estimation, filtering, forecasting, heteroscedasticity analysis, and others. Depending on the amount of a priori information, data processing methods are divided into parametric and distribution-free. The development of data processing methods can be performed within the framework of the classical approach with a fixed sample size and a sequential approach with a random sample size. Depending on the studied problem, data processing methods can have a complex nested structure and include various interconnected components.
Usually, the problems of the synthesis and analysis of data processing methods are considered. The synthesis problem is aimed at finding the structure of the algorithm of actions to achieve the desired result. The analysis problem is associated with the calculation of numerical values of efficiency indicators. Usually, a synthesis of several data processing methods is performed, and during the analysis, the best of them is selected.
For complex data models, including those with the presence of changepoints, heuristic approaches can be applied. Heuristic methods are based on the use of classical mathematical calculations during statistical data processing, the experience of the researcher, his successful ideas, etc.
During the synthesis of data processing methods, the following assumptions were made:
Statistical data are independent random variables.
For one dataset, there can be only one changepoint.
For one sample of aviation radio equipment, either one reliability parameter or one diagnostic variable is monitored.
Processing is performed in a sliding window with a fixed sample size.
When the diagnostic variable crosses the operational tolerance, processing is stopped (and a decision is made about the equipment failure).
The problem of detecting a change point belongs to the class of testing a simple versus a simple alternative.
During the reliability parameters processing, the distributions of operating time between failures are known for the interval before and after the changepoint.
The technical condition depends on only one parameter.
During the synthesis of detection algorithms, the decisive statistic is usually found by the functional transformation of the original statistical data. The decisive statistic is then compared with the decision threshold to form a final conclusion.
The problem of detecting the deterioration of the technical condition, based on this degradation model, can be solved using the Neyman–Pearson criterion. The choice of this criterion is due to the fact that, unlike the Bayesian approach, it does not require knowledge of a priori information about the probabilities of the hypothesis and alternatives, cost functions, etc. For this criterion, it is assumed that the distribution of operating times between failures
during the useful life period follows an exponential distribution, while during the wear-out phase, it follows a truncated Weibull distribution. Such distributions (exponential and Weibull) can be determined using the basic reliability equation for the cases of constant failure rate and changed failure rate according to the linear model. The decisive statistics in this algorithm are determined from the equation of the likelihood ratio. However, all possible moments of failure should be taken into account. Then, the decisive statistics can be represented as follows:
where
is the sample size.
The decision regarding the presence of a degradation process in the failure rate trend is made by comparing the decisive statistics (2) with the decision-making threshold . If , then the presence of a degradation process is confirmed. Otherwise, the radio equipment continues to be operated during its useful life period.
Detailed mathematical calculations regarding the synthesis of the changepoint detection procedure are given in the papers [
24,
64]. The validation and analysis of the effectiveness of the specified procedure were carried out both theoretically (verification of the conditions for the normalisation of the probability density function, dimensions, etc.) and by statistical simulation.
To determine the possible moment for the decommissioning of aviation radio equipment, it is necessary to solve the problem of model parameter estimation. The simplest method in this case is the maximum likelihood method, when the likelihood function and its partial derivatives with respect to the unknown parameters should be found. By solving the resulting equations, an estimate of the moment of occurrence of the changepoint is obtained in the following form:
After that, based on the same likelihood function, the model parameters—namely the failure rate during the useful life period and the tangent of the inclination angle of the linear trend of the changepoint—can be refined, which will take the form
In the case of the processing of diagnostic variables, this study used the method of constructing segmented regression models described in [
68]. The use of this model allowed the simultaneous solution of the problems of changepoint detection and model parameter estimation. The regression model is built within a sliding window of size
. Within each such window, the data are approximated using an equation of the following form:
where
,
, and
are model parameters estimated by the least squares method,
is Heaviside function, and
is a possible moment of changepoint occurrence.
The estimation of the moment of changepoint occurrence is carried out using the optimisation paraboloid method, as described in [
68]. To establish the occurrence of a failure, Fisher’s test was used to check the significance of the model parameters
and
. Following the identification and estimation of these parameters, it becomes possible to predict the moment of equipment failure using the following equation:
where
is the time corresponding to the start of the sliding window;
is the operational tolerance, the crossing of which by a diagnostic variable indicates the occurrence of a failure; and
is the sampling interval.
Therefore, in this article, a heuristic approach was used to solve the problem of the synthesis of the data processing procedure. This approach included the following set of data processing methods: detecting the fact of a possible changepoint, estimating the parameters of the process model after the changepoint, and predicting the future trend of the reliability parameters or diagnostic variable. In this case, the processing procedures were performed in a sliding window to reduce inertia during decision-making.
So the overall structure of the algorithmic support for Unit U8 is presented in
Figure 6.
4. Results and Discussions
In this section, we will analyse the effectiveness of the Datahub. To carry this out, we will use statistical simulation. One of the tasks of this article is a theoretical study of the efficiency of the proposed approach to data processing in the case of the changepoint. Due to the war in Ukraine, it is difficult to access real datasets today. This is explained by the fact that some of the aviation radio equipment is destroyed, some of the equipment is in a state of downtime with the power sources turned off, and some is used for military purposes. That is, the data is either unavailable or confidential. Therefore, this study uses synthetically generated data (
Table A1 and
Table A2) that can be used during theoretical analysis. The statistical distributions of reliability parameters and diagnostic variables in the case of changepoint absence correspond to generally accepted reliability models. In the case of changepoint presence, the authors used newly proposed models.
As was previously mentioned, the main element of the operation and maintenance system is aviation radio equipment; therefore, our focus is directed towards the operation of Unit U8, responsible for equipment condition monitoring.
During the simulation, we wanted to confirm the hypothesis that the efficiency of the aviation radio equipment operation system increases when modern methods of operational data processing are applied. At the same time, the statistical simulation was limited to the level of the operational unit within the aviation enterprise, where the main operation process—the utilisation of equipment for its functional purpose—is performed.
The structure of the initial data and the efficiency measures used for the statistical simulation are presented in
Figure 7.
The initial parameters of the simulation model are structured according to seven features. These include data on the number of equipment units, cost and time parameters, failure model parameters, diagnostic variable model parameters, and simulation process parameters.
The operational cost per observation interval and the efficiency improvement coefficient were selected as the efficiency indicators. The operational cost per observation interval can be calculated using the following equation:
where
is the average specific operational cost for aviation radio equipment with reliability parameter monitoring,
is the average specific operational cost for aviation radio equipment with diagnostic variable monitoring, and
and
are the probabilities of choosing aviation radio equipment reliability parameter monitoring and diagnostic variable monitoring, respectively:
The efficiency improvement coefficient indicates the extent to which the average operational costs per observation interval can be reduced through the use of the algorithmic support provided by Unit U8 within the Datahub. This coefficient can be expressed by the following ratio:
where
represents the average operational cost per observation interval in the case of the absence of statistical data processing by Unit 8 within the Datahub.
In the case of Formula (10) usage, two aspects of reliability models’ utilisation are considered.
- 1.
Diagnostic variables processing.
The case of calculation corresponds to the traditional reliability model during maintenance and repair. Such a model is considered in the context of a known scheduled maintenance approach. In this case, there is an operational tolerance, whose intersection with the diagnostic variable leads to the occurrence of a failure. After a certain time interval, scheduled maintenance is performed. In the event of failure, current repair procedures are carried out. In Formula (10), the parameter determines the average operational cost according to the traditional reliability and maintenance model.
For the proposed approach to data processing, an improved model of preventive maintenance is implemented. At the same time, using Formula (7), we can predict the moment of occurrence of a possible failure. To eliminate it, preventive maintenance (adjustment, regulation, replacement of the unit, etc.) is carried out at the time immediately before the predicted failure time.
- 2.
Reliability parameters processing.
The case of
calculation corresponds to the traditional reliability model for determining the remaining useful life, which is regulated by normative documents in the field of civil aviation [
72]. This model has significant inertia and does not optimally take into account the real resources of the equipment in the event of the deterioration of the technical condition.
For the proposed approach to data processing, the detection, evaluation, and prediction procedures are performed in a sliding window taking into account the changepoint model and a possible trend. This approach allows for a timely assessment of the residual resource and decommission of equipment that is not suitable for performing its functions.
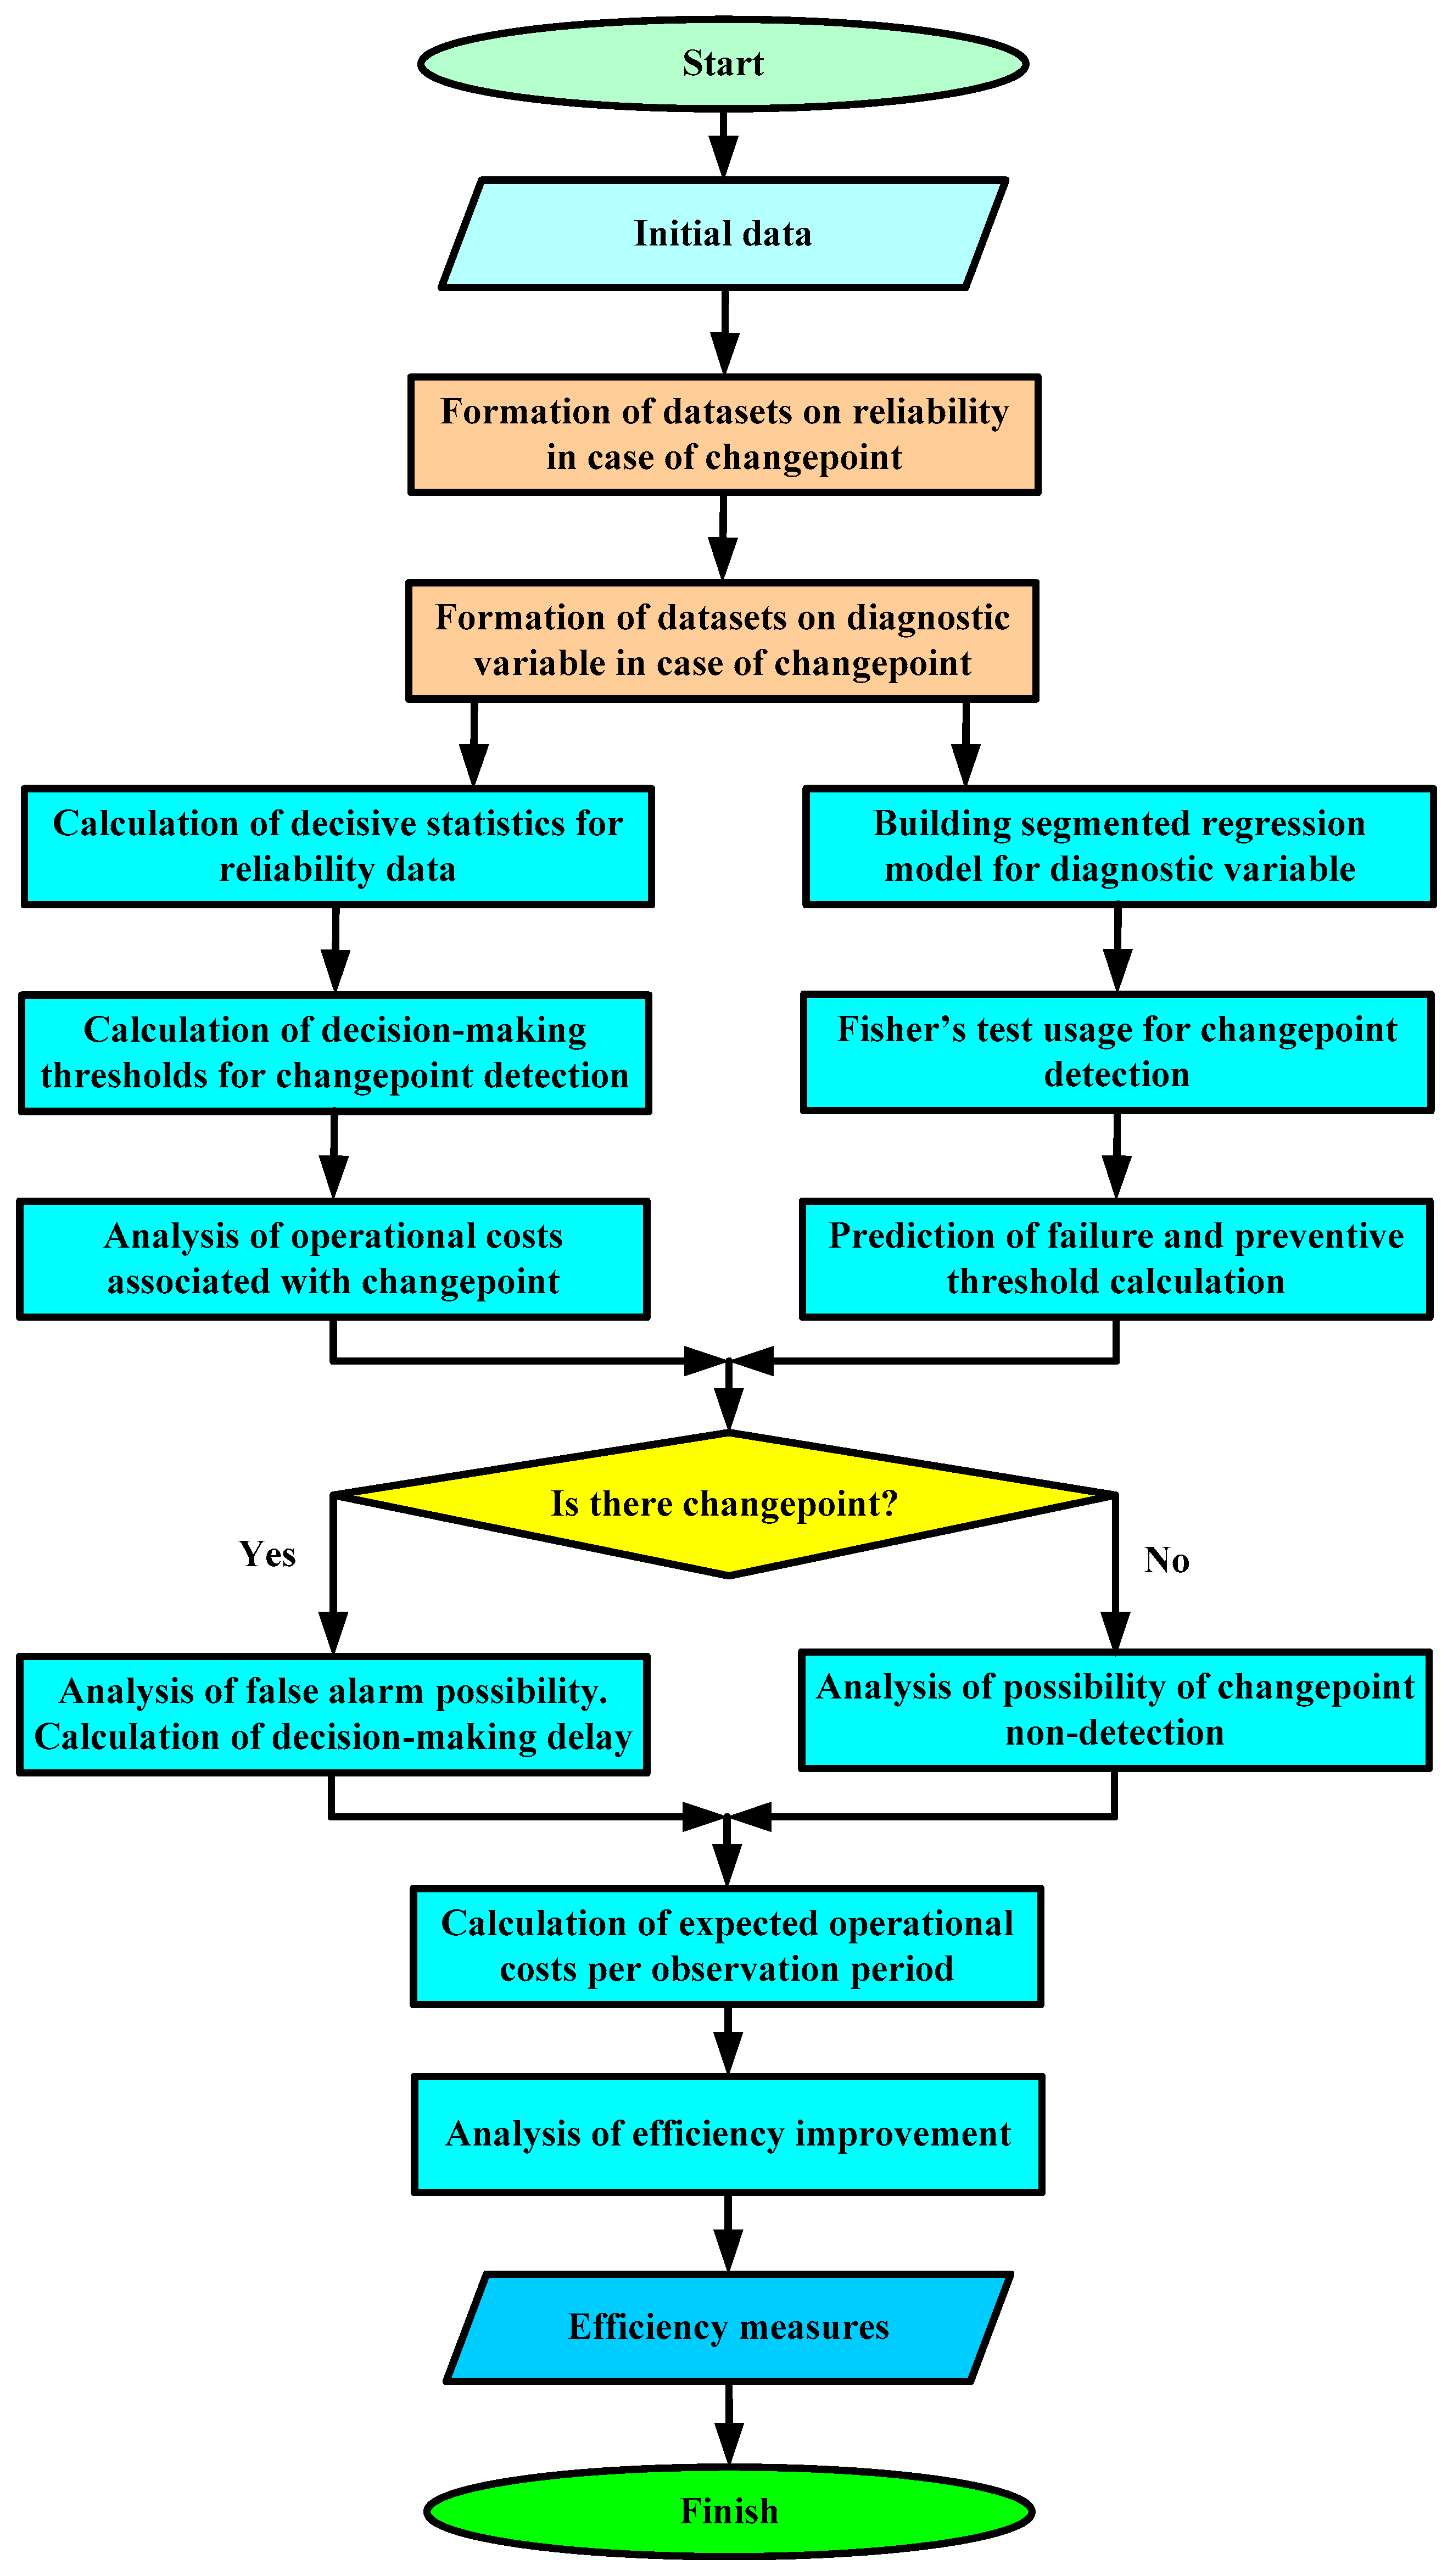
The flowchart of the statistical simulation procedure is shown in
Figure 8. The software was developed according to this scheme. This program enables the rapid modification of all initial parameters shown in
Figure 7.
Let us consider the key features of statistical simulation. In the case of studying data processing procedures for reliability parameters, we generated datasets consisting of two parts. The first part contains information about the operating time between failures, following the exponential distribution. The failure rate parameter remains constant for the entire population but varies in value for different types of aviation radio equipment. The specific failure rate value for each type of radio equipment is determined by operational documentation. The second part of the dataset contains either identically distributed random variables (for the case where no degradation process occurs) or variables following a different distribution according to the linear model of failure rate change during the deterioration of the technical condition of the equipment. The moment marking the start of the degradation process is a random variable. In the programme, this random moment of degradation process initiation is generated by producing a uniformly or normally distributed random number, which is then rounded to the integer part.
In the case of studying data processing procedures for diagnostic variables, the process is carried out by forming a mixture of a deterministic component (a constant signal level or piecewise linear signal form) and noise with an expected value of zero. A normal distribution with a specified standard deviation was chosen as the noise component. Trends in changes in diagnostic variables are presented in discrete observations with a defined sampling interval.
For the generated datasets on operating time between failures, the calculation of the decisive statistics is performed according to Formula (2). During the processing of diagnostic variables, the segmented regression model (6) is constructed within a sliding window. After that, Fisher’s test parameter is calculated. The next stage of the simulation involves the calculation of decision thresholds for changepoint detection in the trend of the reliability parameter and determination of the optimal preventive threshold during the analysis of the diagnostic variable.
In the case of the correct detection of the deterioration of technical conditions during reliability parameters monitoring, the decision-making time moment is calculated for each radio equipment sample.
In the final step of the statistical simulation, estimates of the average operational costs (8) per observation interval and the efficiency improvement coefficient (10) were determined. To enable visual analysis, the results of statistical simulation are presented graphically.
Let us consider an example of statistical simulation using specific numerical values of the initial parameters, as presented in
Figure 7:
- -
Parameters that characterise the number of aviation radio equipment: , ;
- -
Operational costs parameters: USD, USD, USD, USD;
- -
time parameters that characterise duration of operational processes: h, h, h;
- -
Failure rates for five different types of aviation radio equipment: , , , , ;
- -
Parameters of the model for diagnostic variable: V, V, V, V;
- -
Parameters of the degradation model: and are uniformly distributed random variables, is normal distributed random variable;
- -
Parameters of the simulation model: , ,
It should be noted that
Figure 7 shows more than 20 input parameters, which are classified into seven groups. The choice of the numerical values of these parameters refers to the technologies of experiment planning. In this case, the range of parameter variation can be quite wide. For example, the distribution of the moment of changepoint occurrence can be arbitrary. This feature does not in any way affect the data processing procedure or the final result, since the decisive statistics do not depend on the model of this distribution (Formulas (2)–(5) during the reliability data processing and the formula of the model (6) during the diagnostic variable processing). In this study, the authors chose uniform and normal distribution laws of the corresponding model, although in fact there are no restrictions on the types of distribution.
The choice of specific numerical values of parameters during statistical simulation was carried out by taking into account logical conclusions, experience in equipment operation, and the inertia of processing and decision-making. For example, the size of the sliding window for processing should not be too small so that the processed sample is sufficient to form a reliable decision. On the other hand, a large sample size will lead to a delay in forming a decision. Therefore, the size of the sliding window was determined from this compromise.
An example of the generated dataset is shown in
Appendix A.
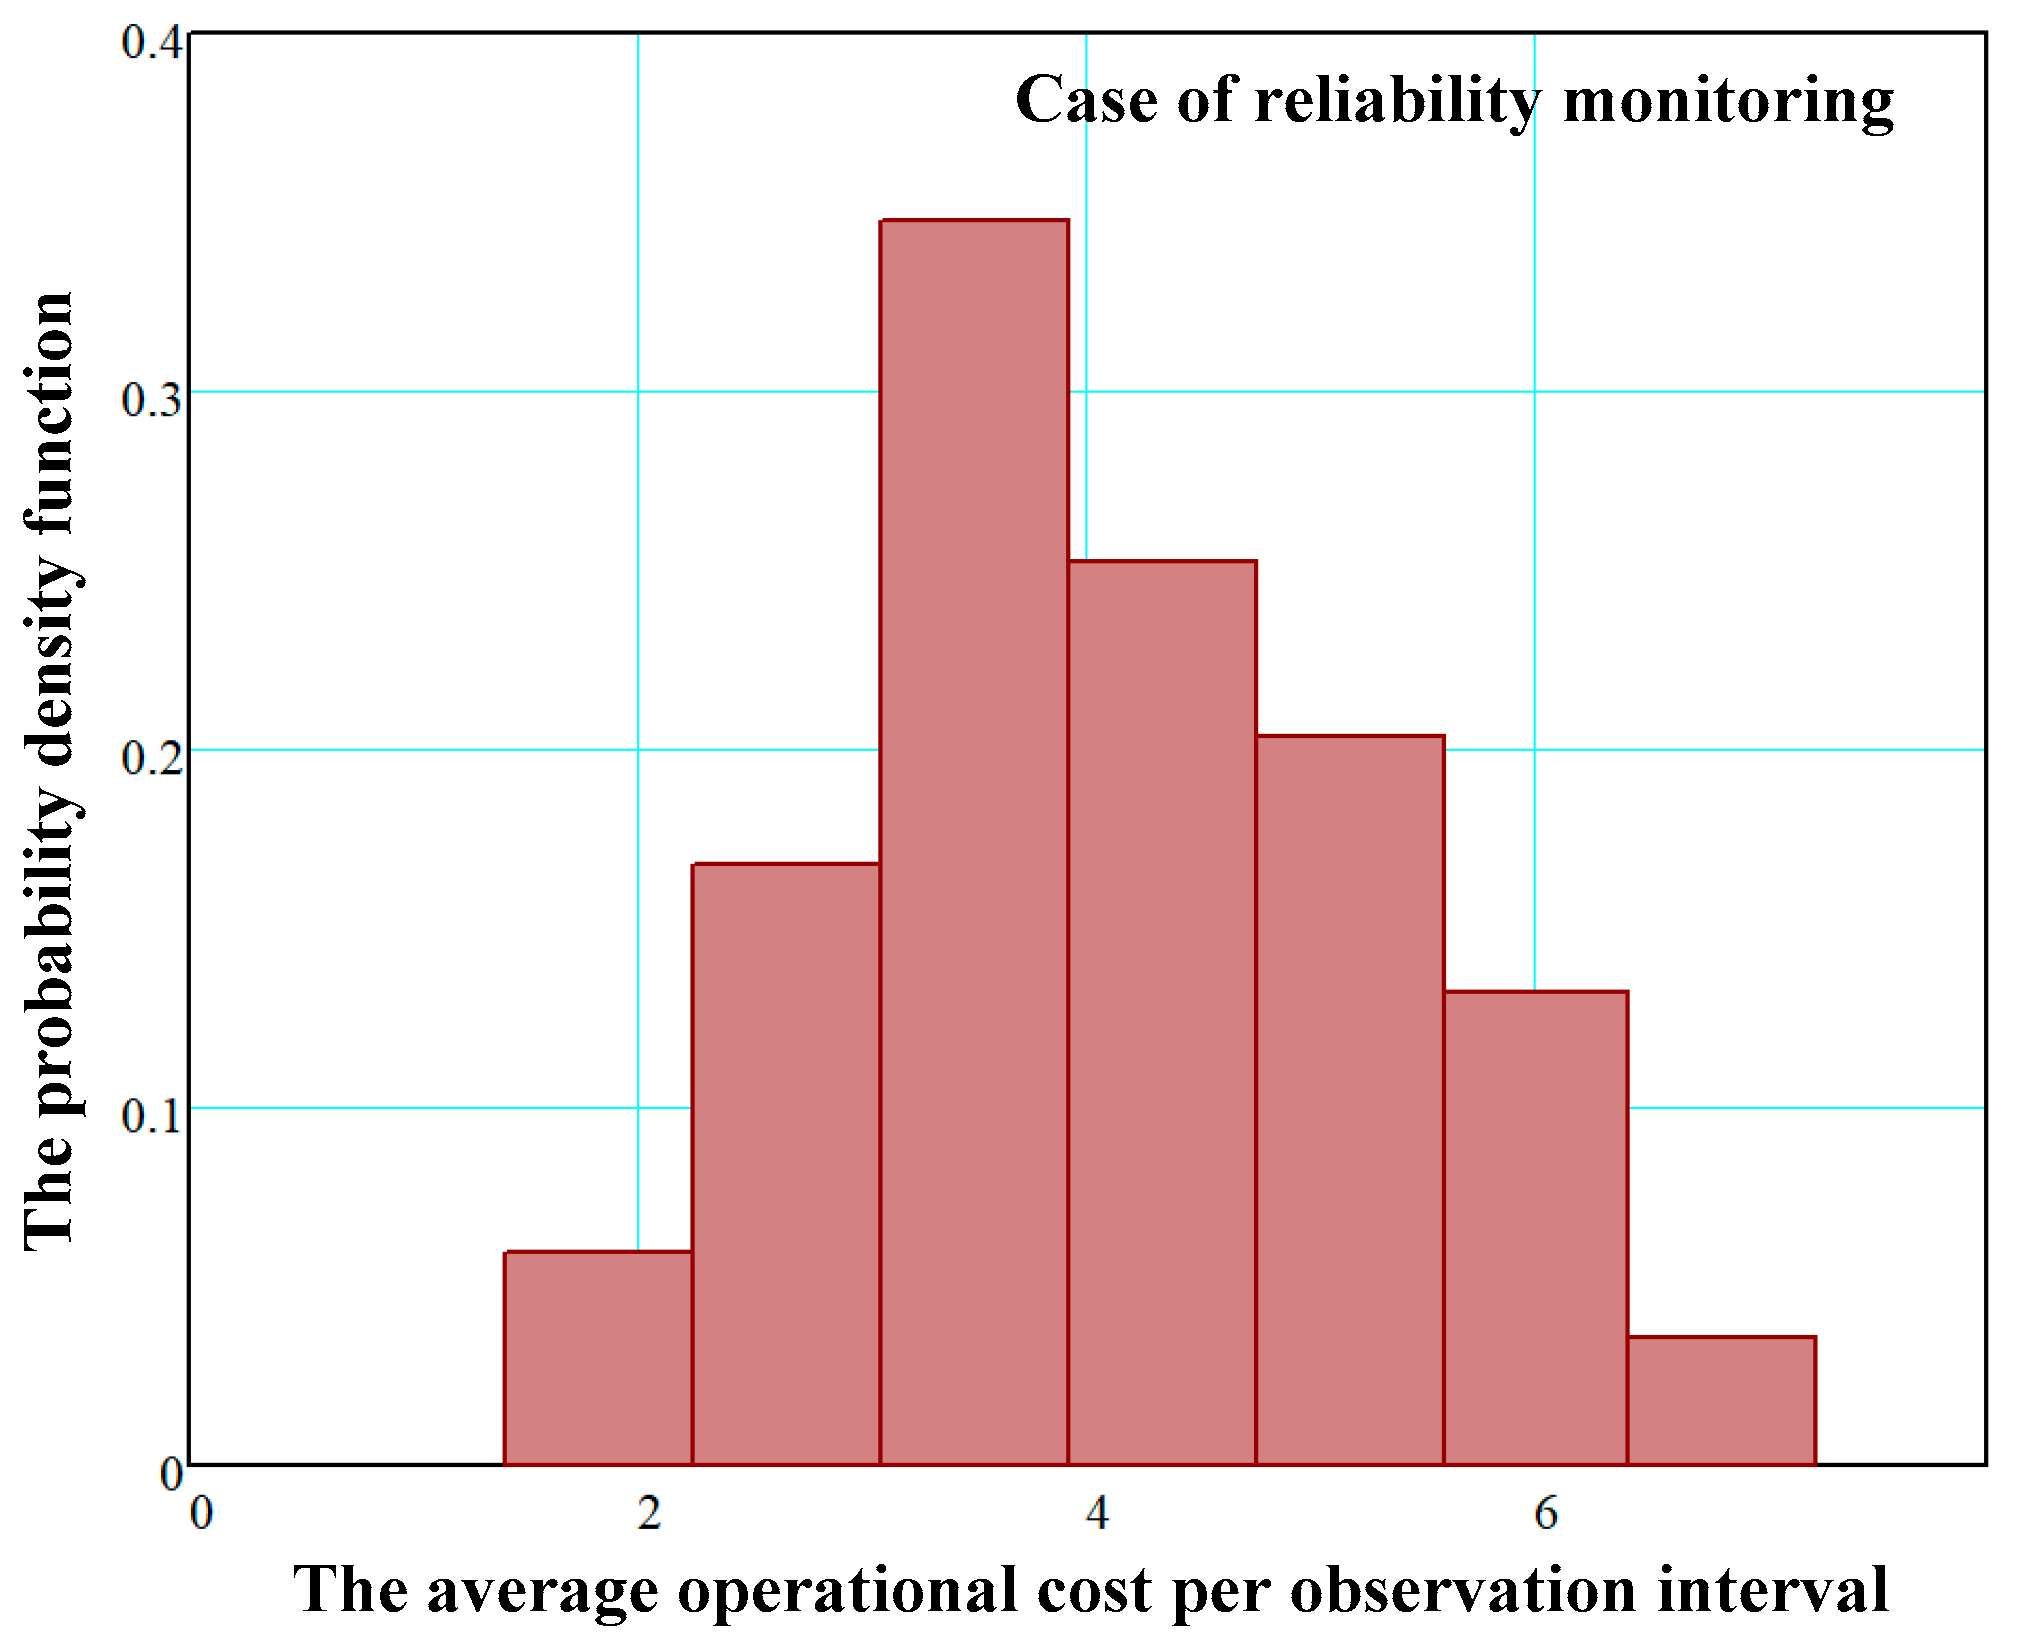
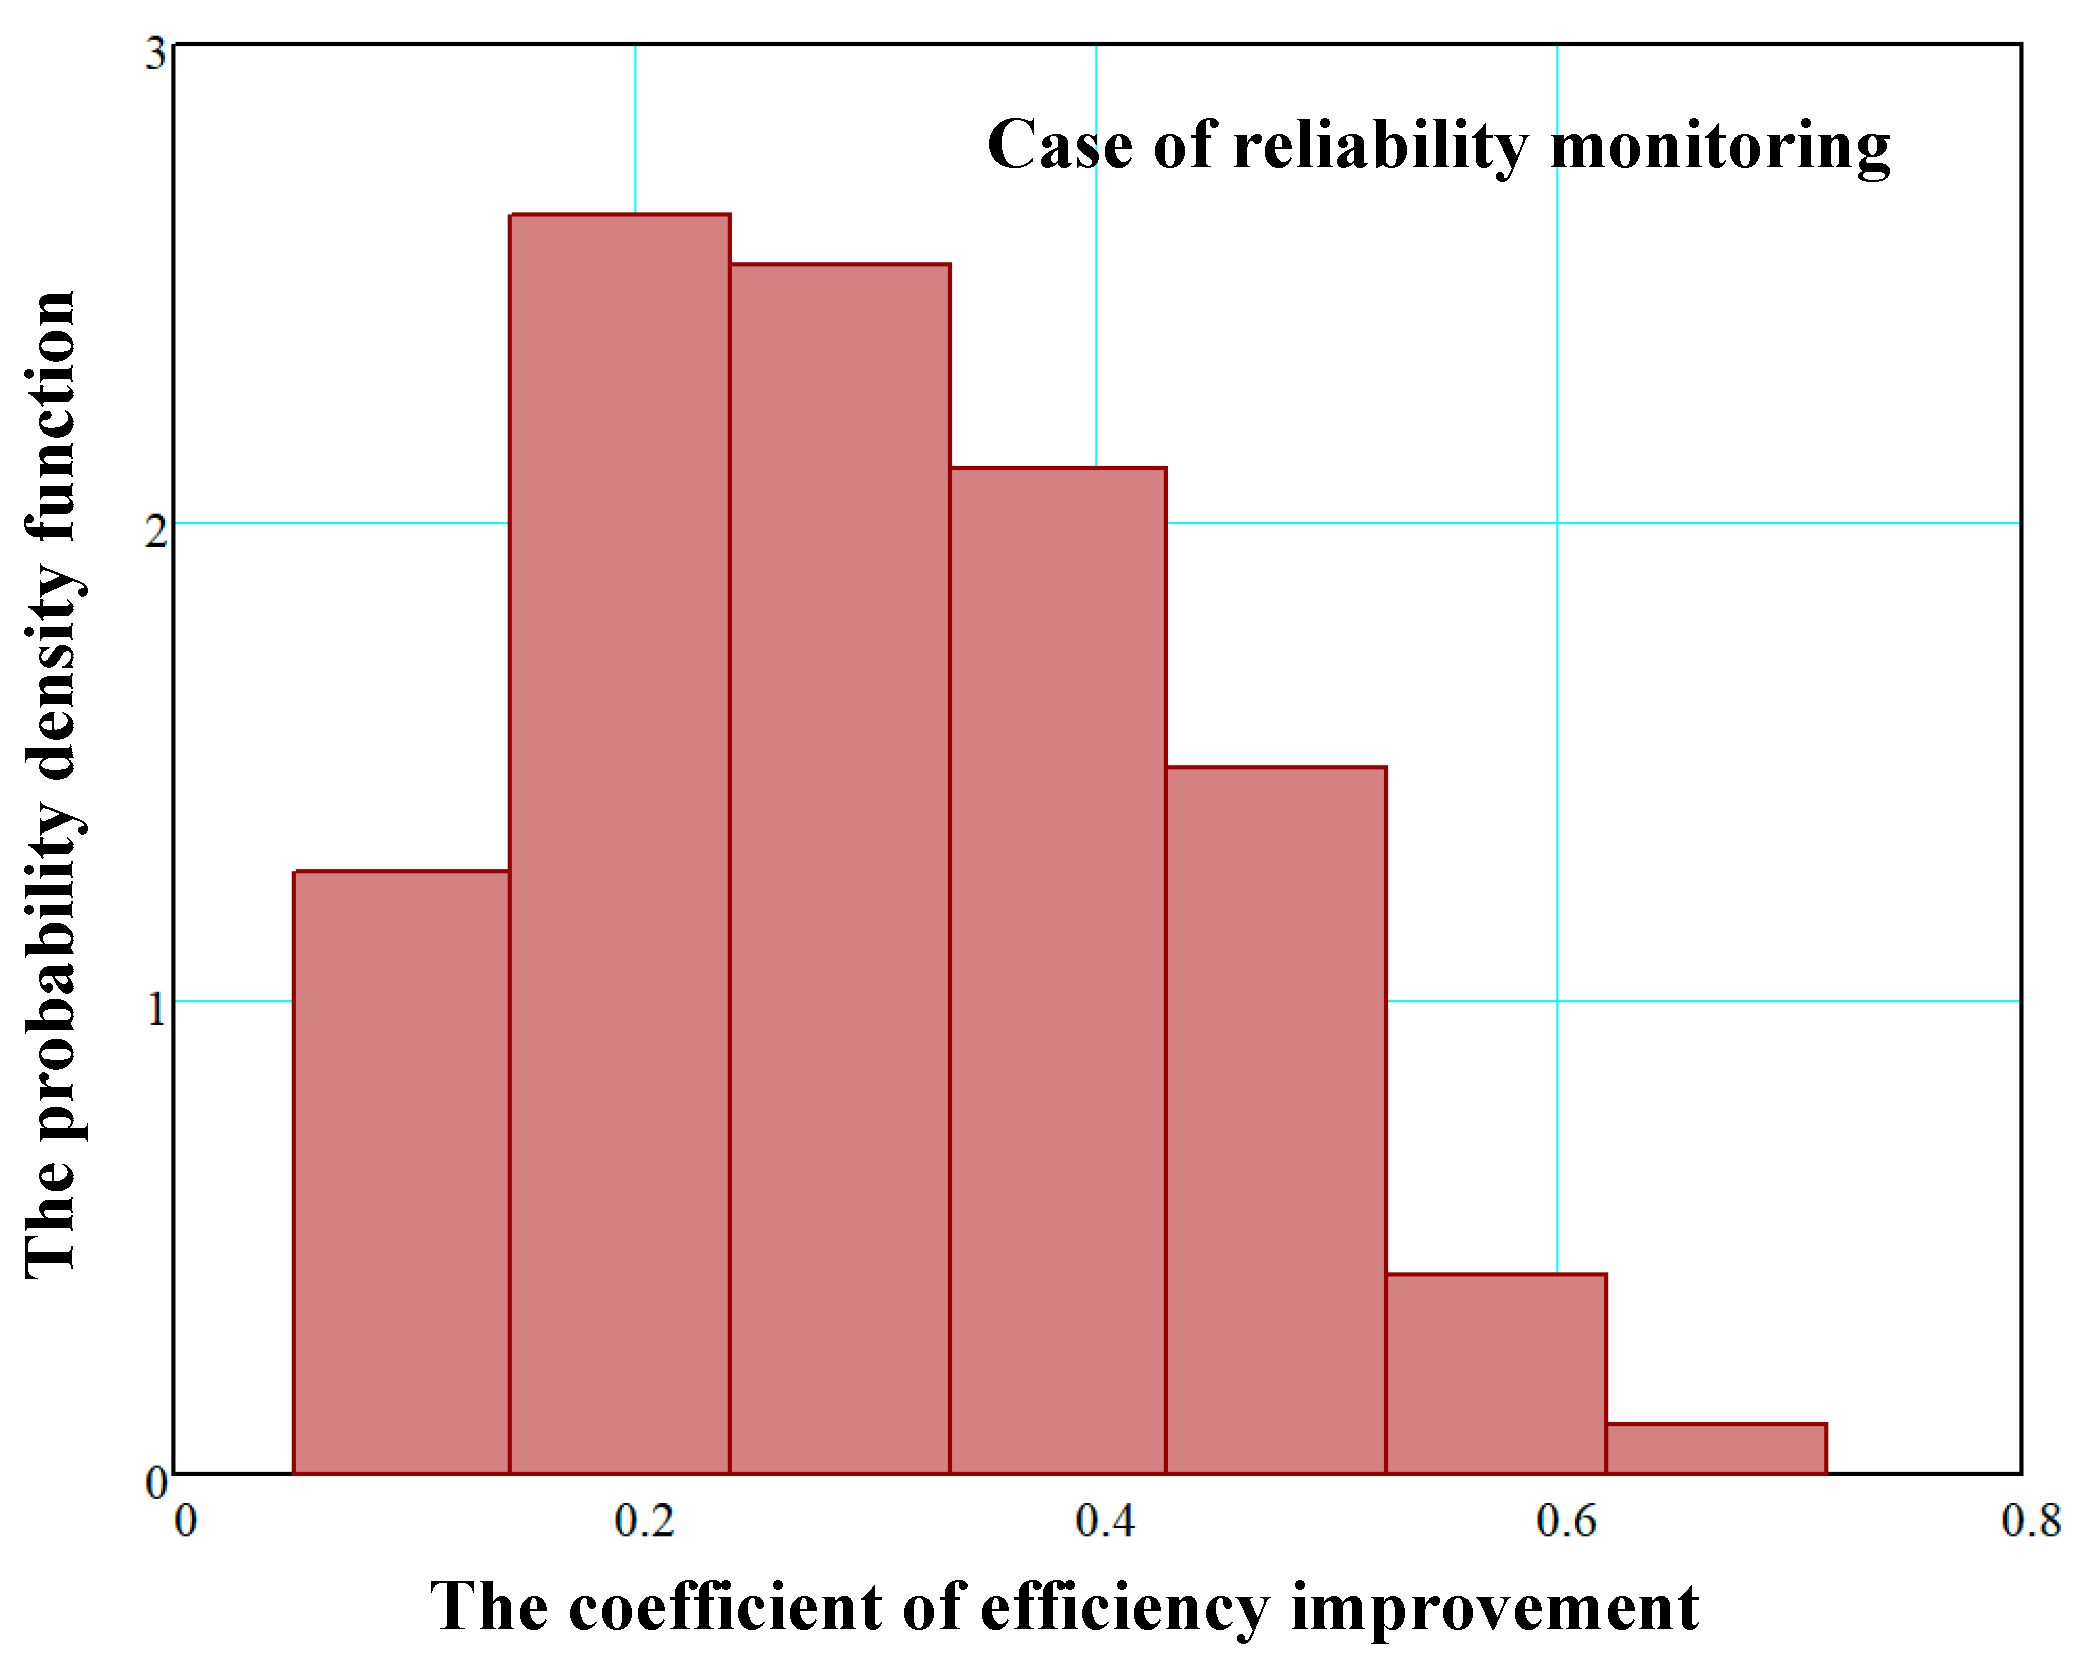
The probability density functions of the average operational cost per observation interval and the efficiency improvement coefficient for the case of reliability monitoring are shown in
Figure 9 and
Figure 10, respectively. The corresponding functions have asymmetry and cannot be described using normal distribution.
The range of variations for the efficiency improvement coefficient is . Thus, the advantage gained from reliability data processing in the Unit U8 lies between 5.1% and 71.4%. The expected value of the efficiency improvement coefficient is 30.4% with a standard deviation of 14%.
The correlation between the average operational cost per observation interval and the efficiency improvement coefficient (in the case of reliability monitoring) is shown in
Figure 11. A negative correlation is observed, with a corresponding correlation coefficient
This dependence can be approximated by a second-order parabola, taking heteroscedasticity into account.
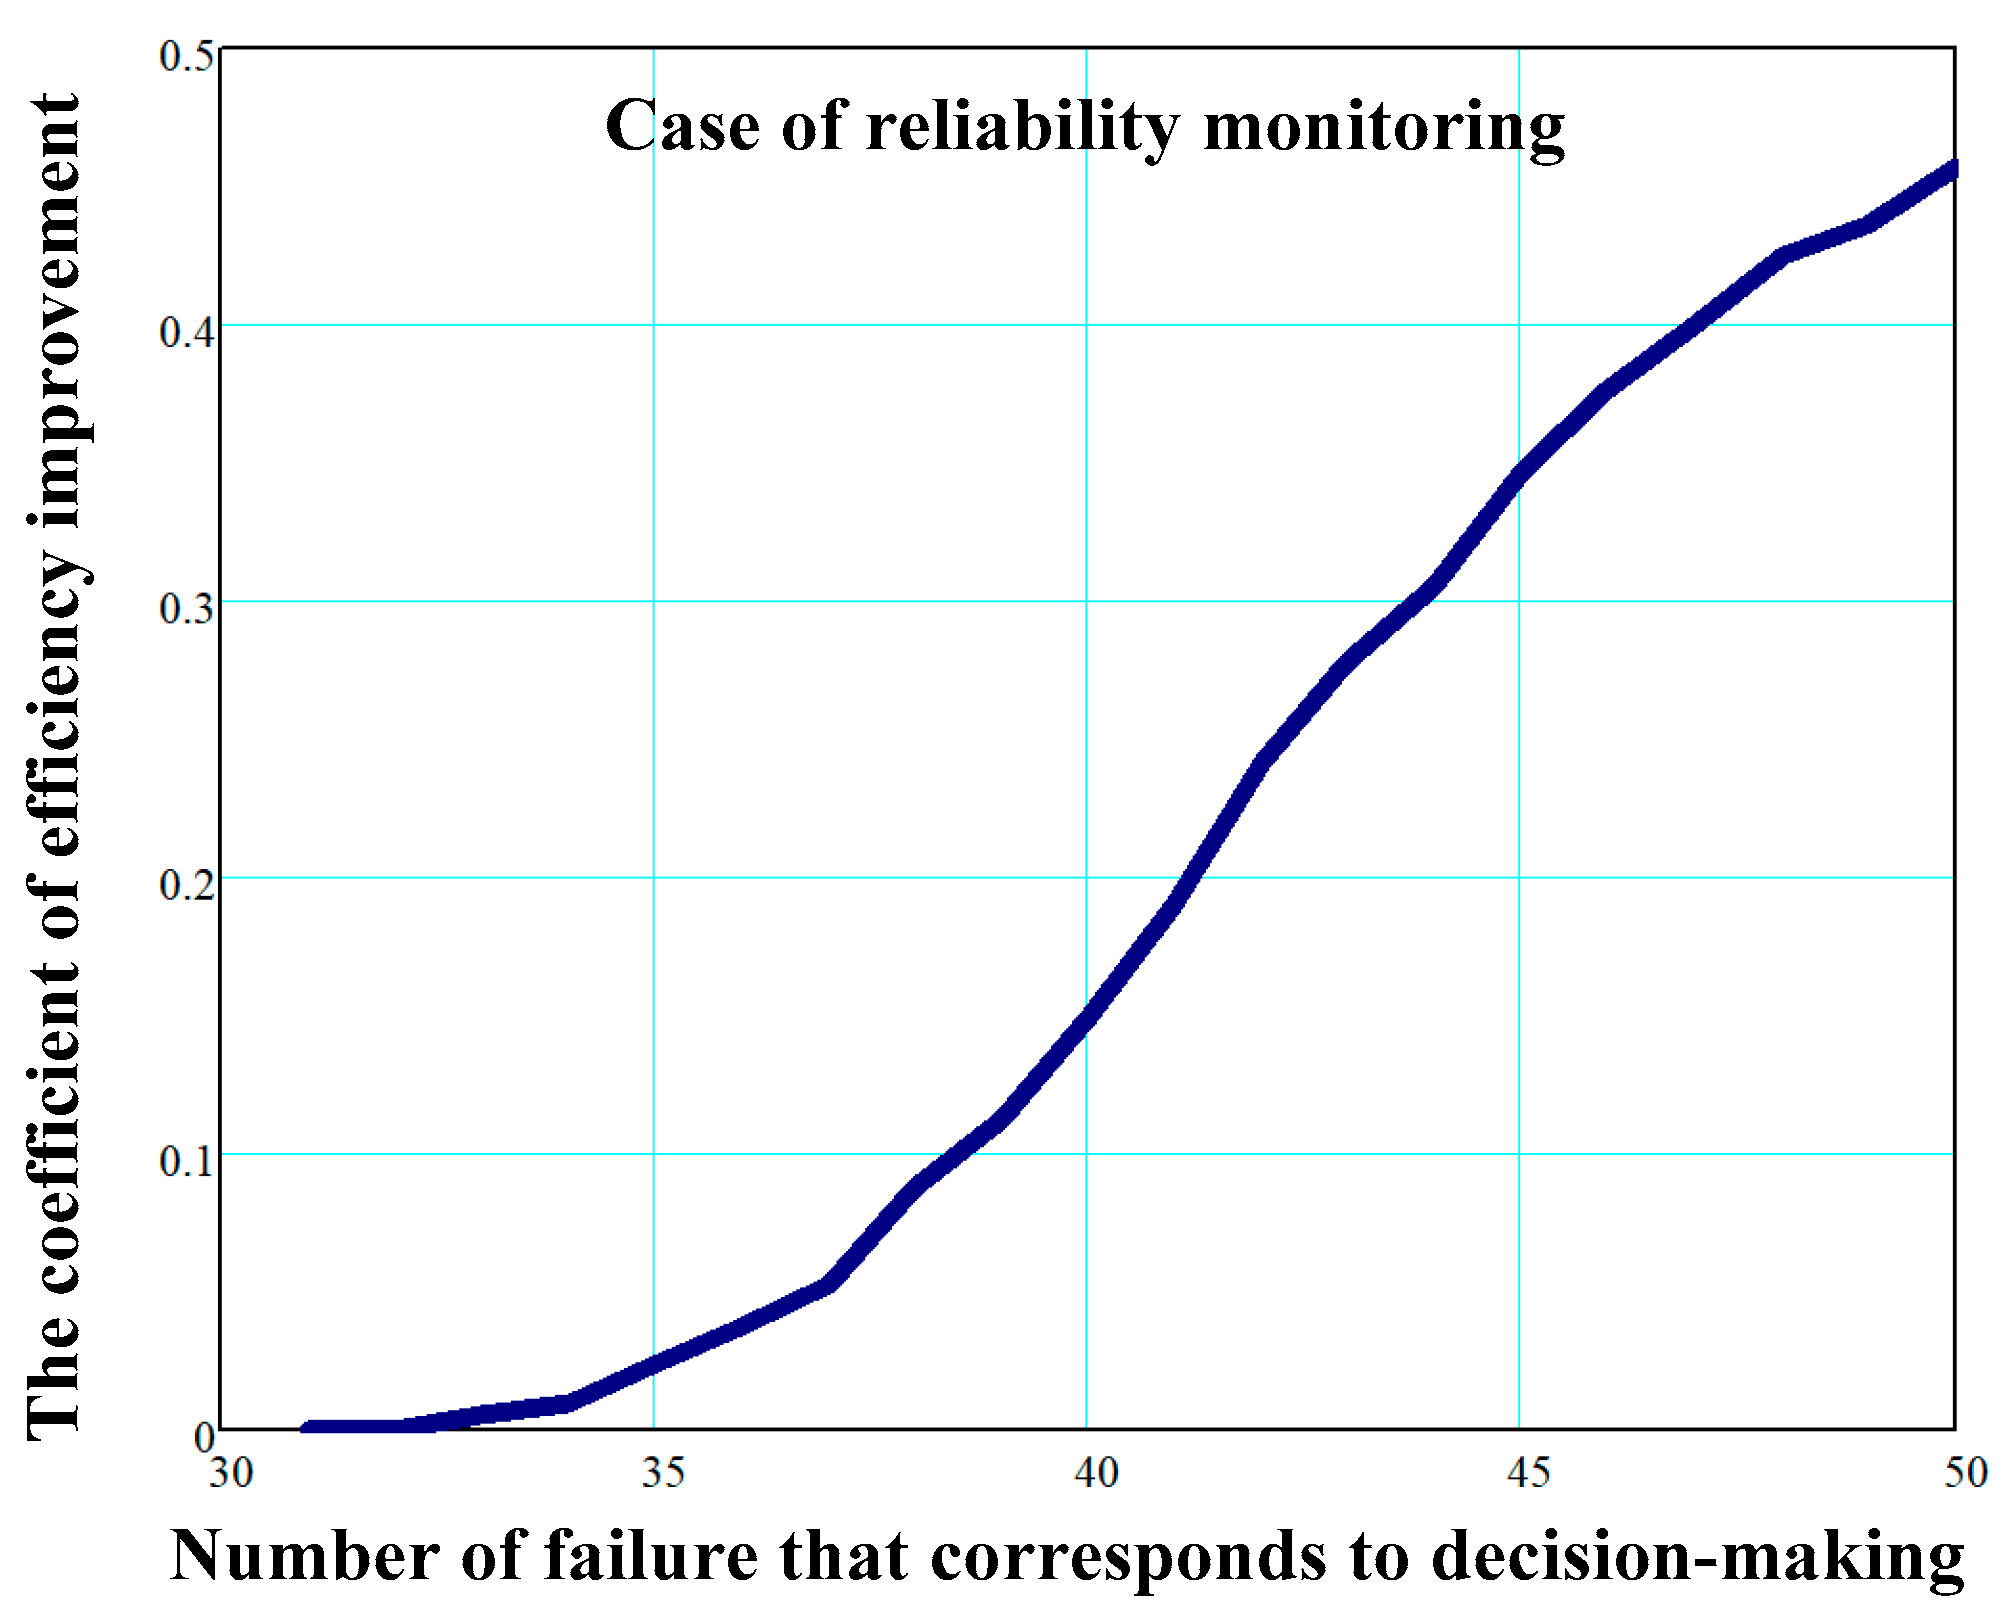
Figure 12 shows the dependence of the efficiency improvement coefficient from the failure number corresponding to the decision-making point regarding the presence of degradation. The delay in decision-making concerning the detection of the degradation process is approximately equal to eight failures. In this case, it is also assumed that the moment of the deterioration of technical conditions is within the range of 20 to 40 observed failures. As illustrated in
Figure 12, the advantage of data-driven decision-making increases over time following the occurrence of degradation.
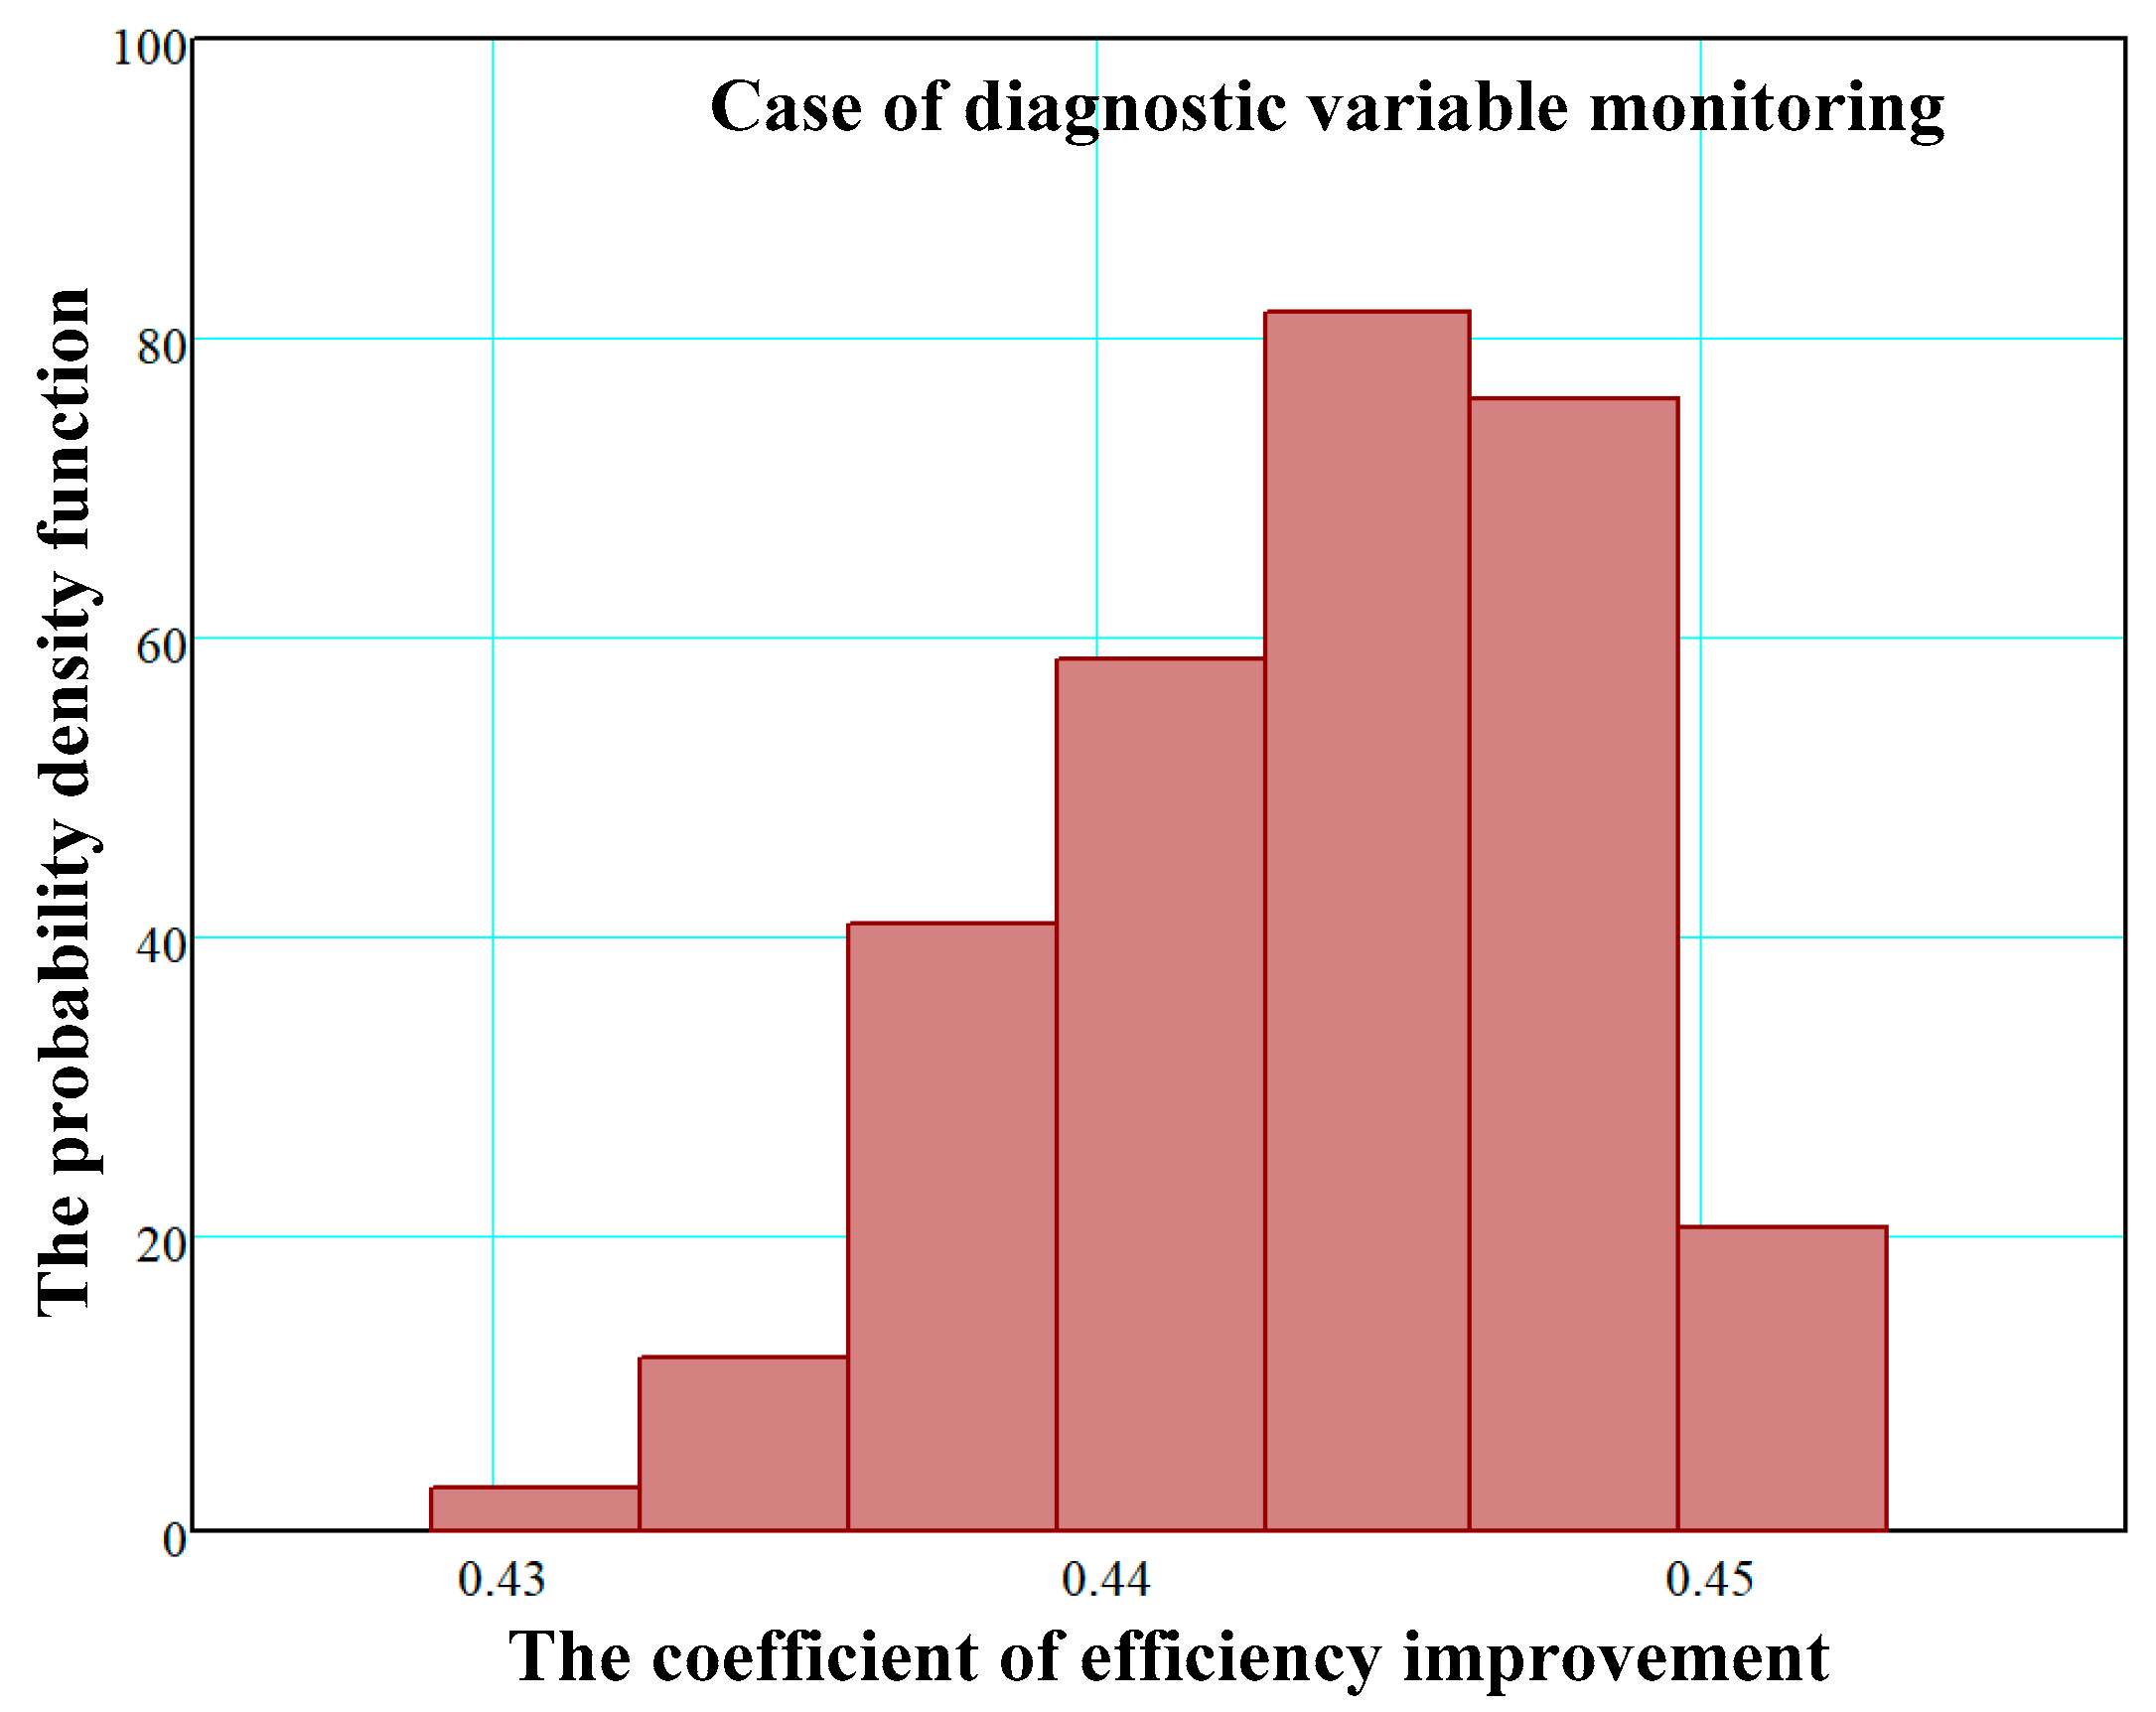
The probability density functions of the average operational cost per observation interval and the efficiency improvement coefficient for the case of diagnostic variable monitoring are shown in
Figure 13 and
Figure 14, correspondingly.
For this case of processing, the variation range for the efficiency improvement coefficient is . Thus, the advantage gained from diagnostic variable processing in Unit U8 lies between 42.9% and 45.3%. The expected value of the efficiency improvement coefficient is 44.4%, with a standard deviation of 0.452%. It can be observed that the range of variation of the efficiency improvement coefficient in the case of diagnostic variable processing is significantly smaller than in the previous processing option.
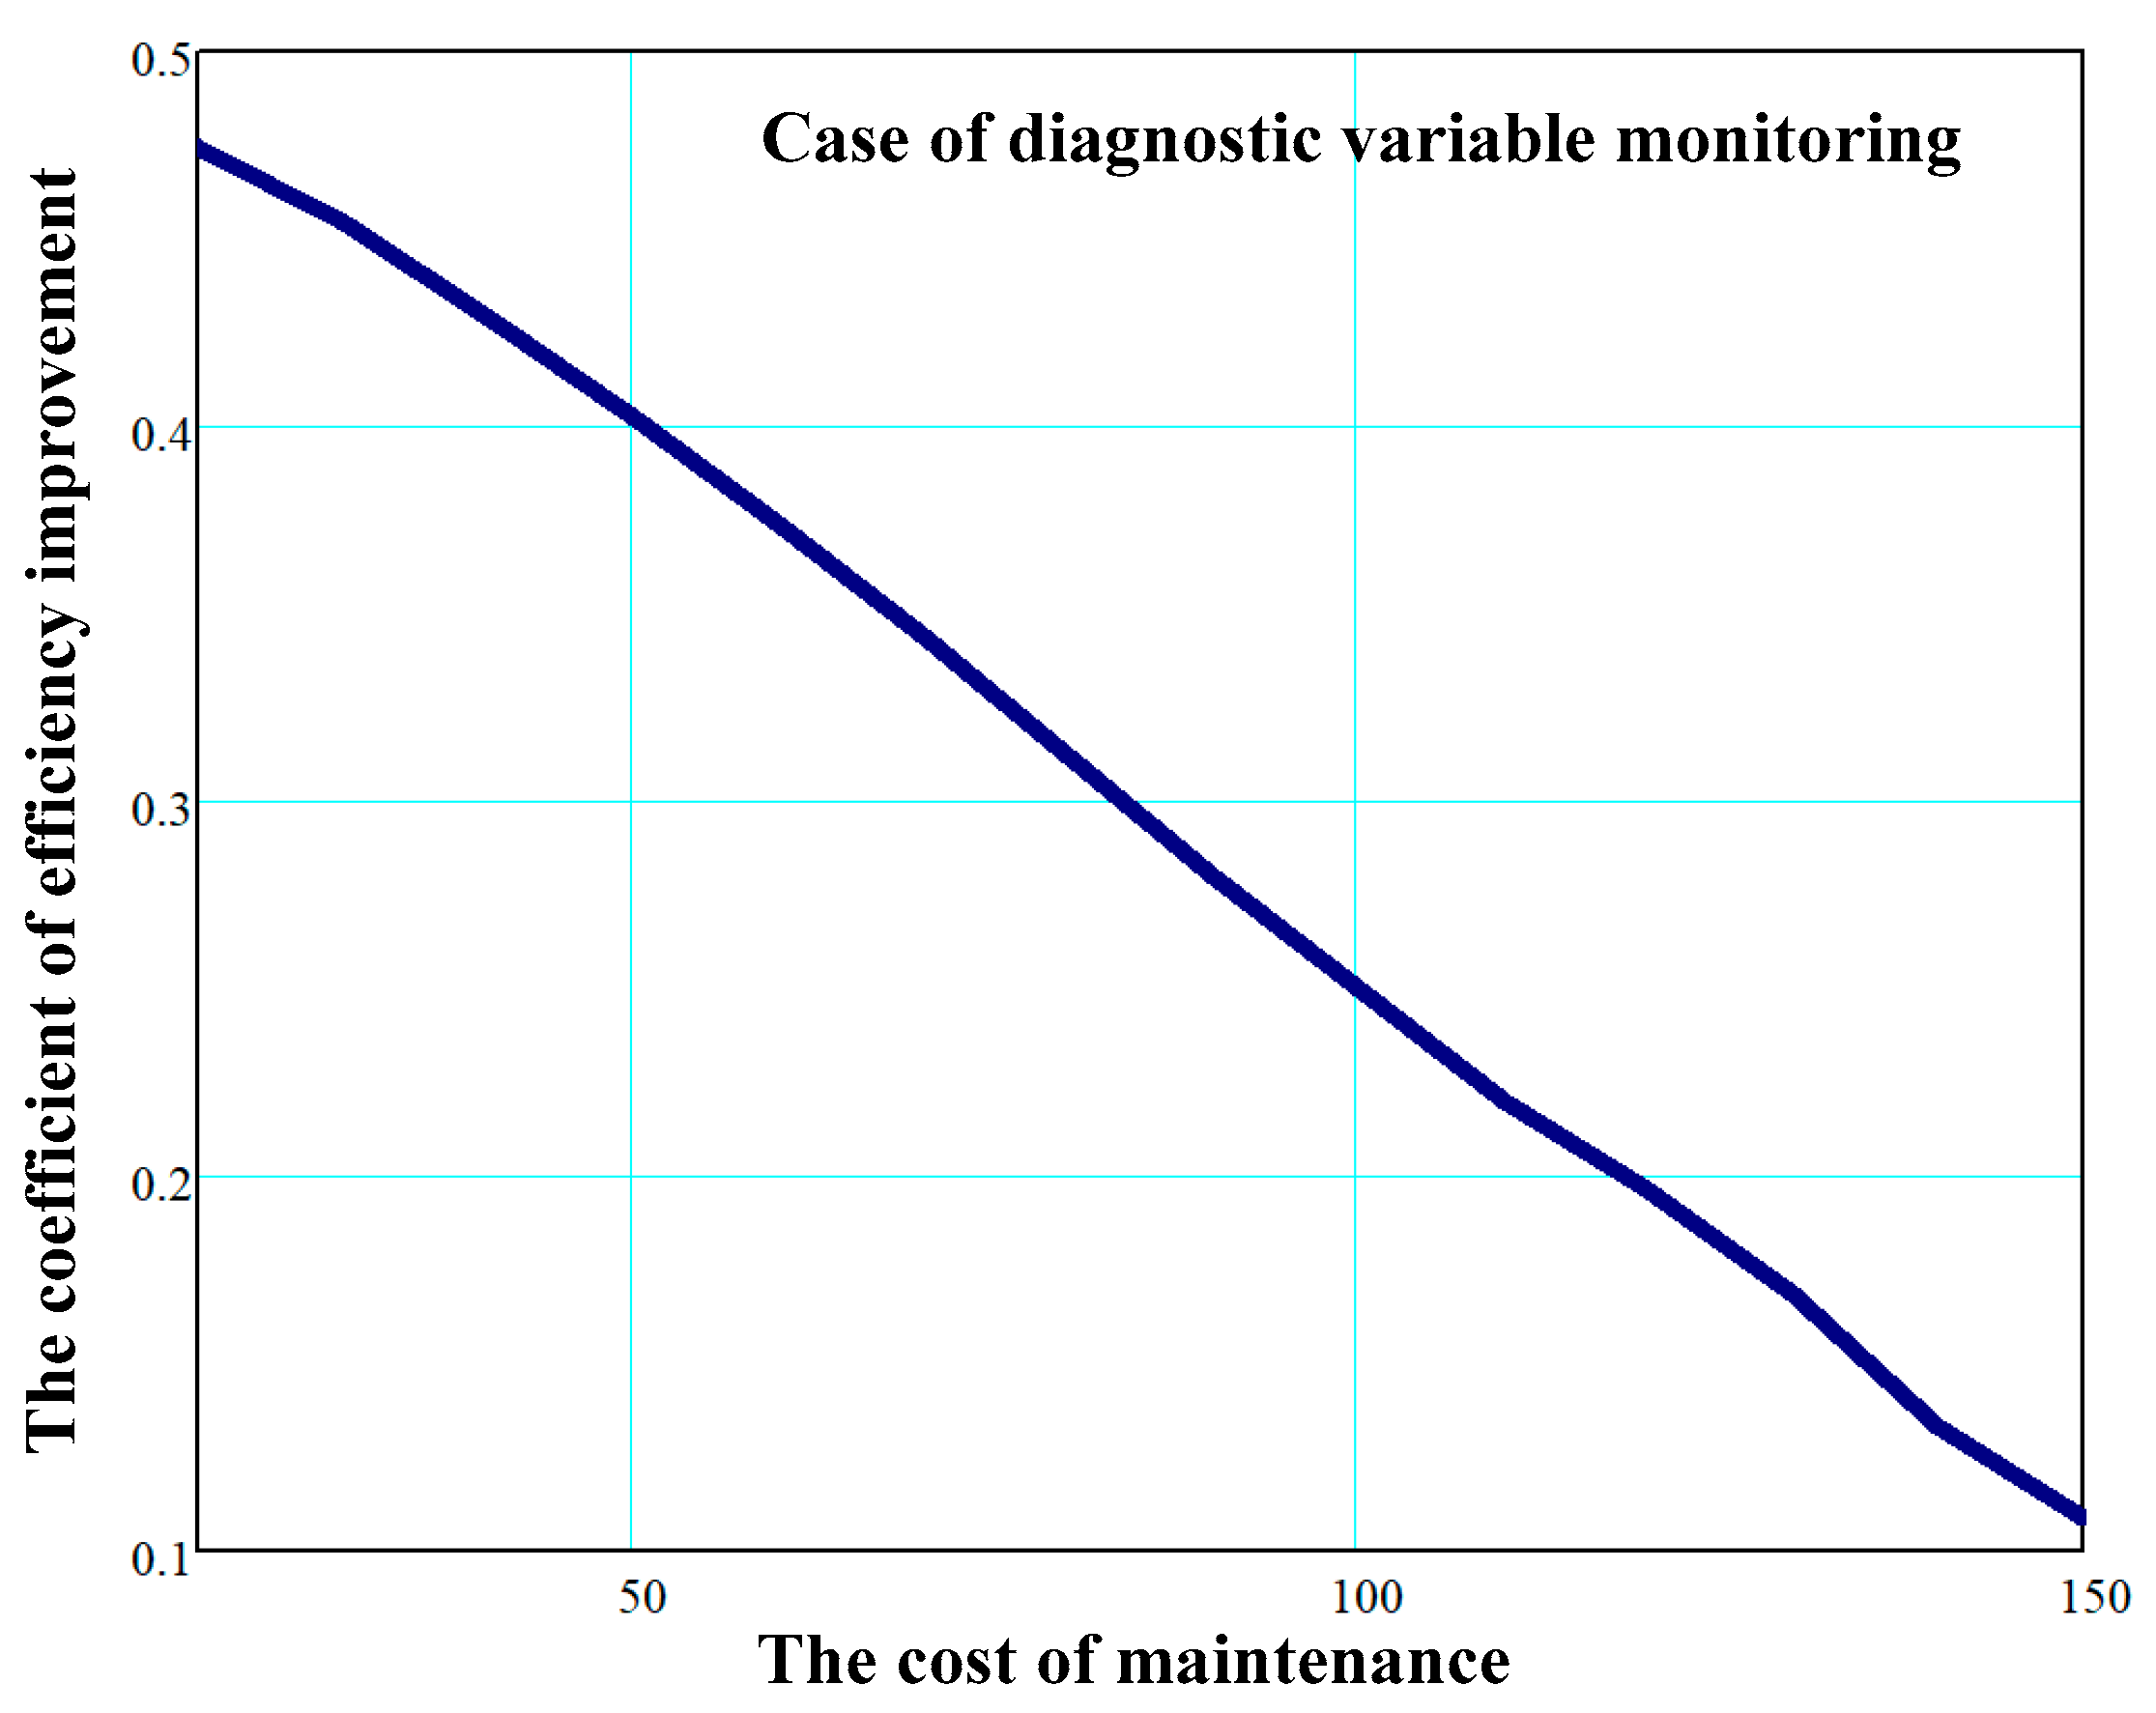
Figure 15 shows the dependence between the efficiency improvement coefficient and maintenance cost in the case of diagnostic variable monitoring. It can be observed that there is an inverse proportional relationship: higher maintenance costs correspond to smaller efficiency improvements. In the case where the cost of maintenance is approximately equal to the cost of repairs, the efficiency improvement coefficient will be zero.
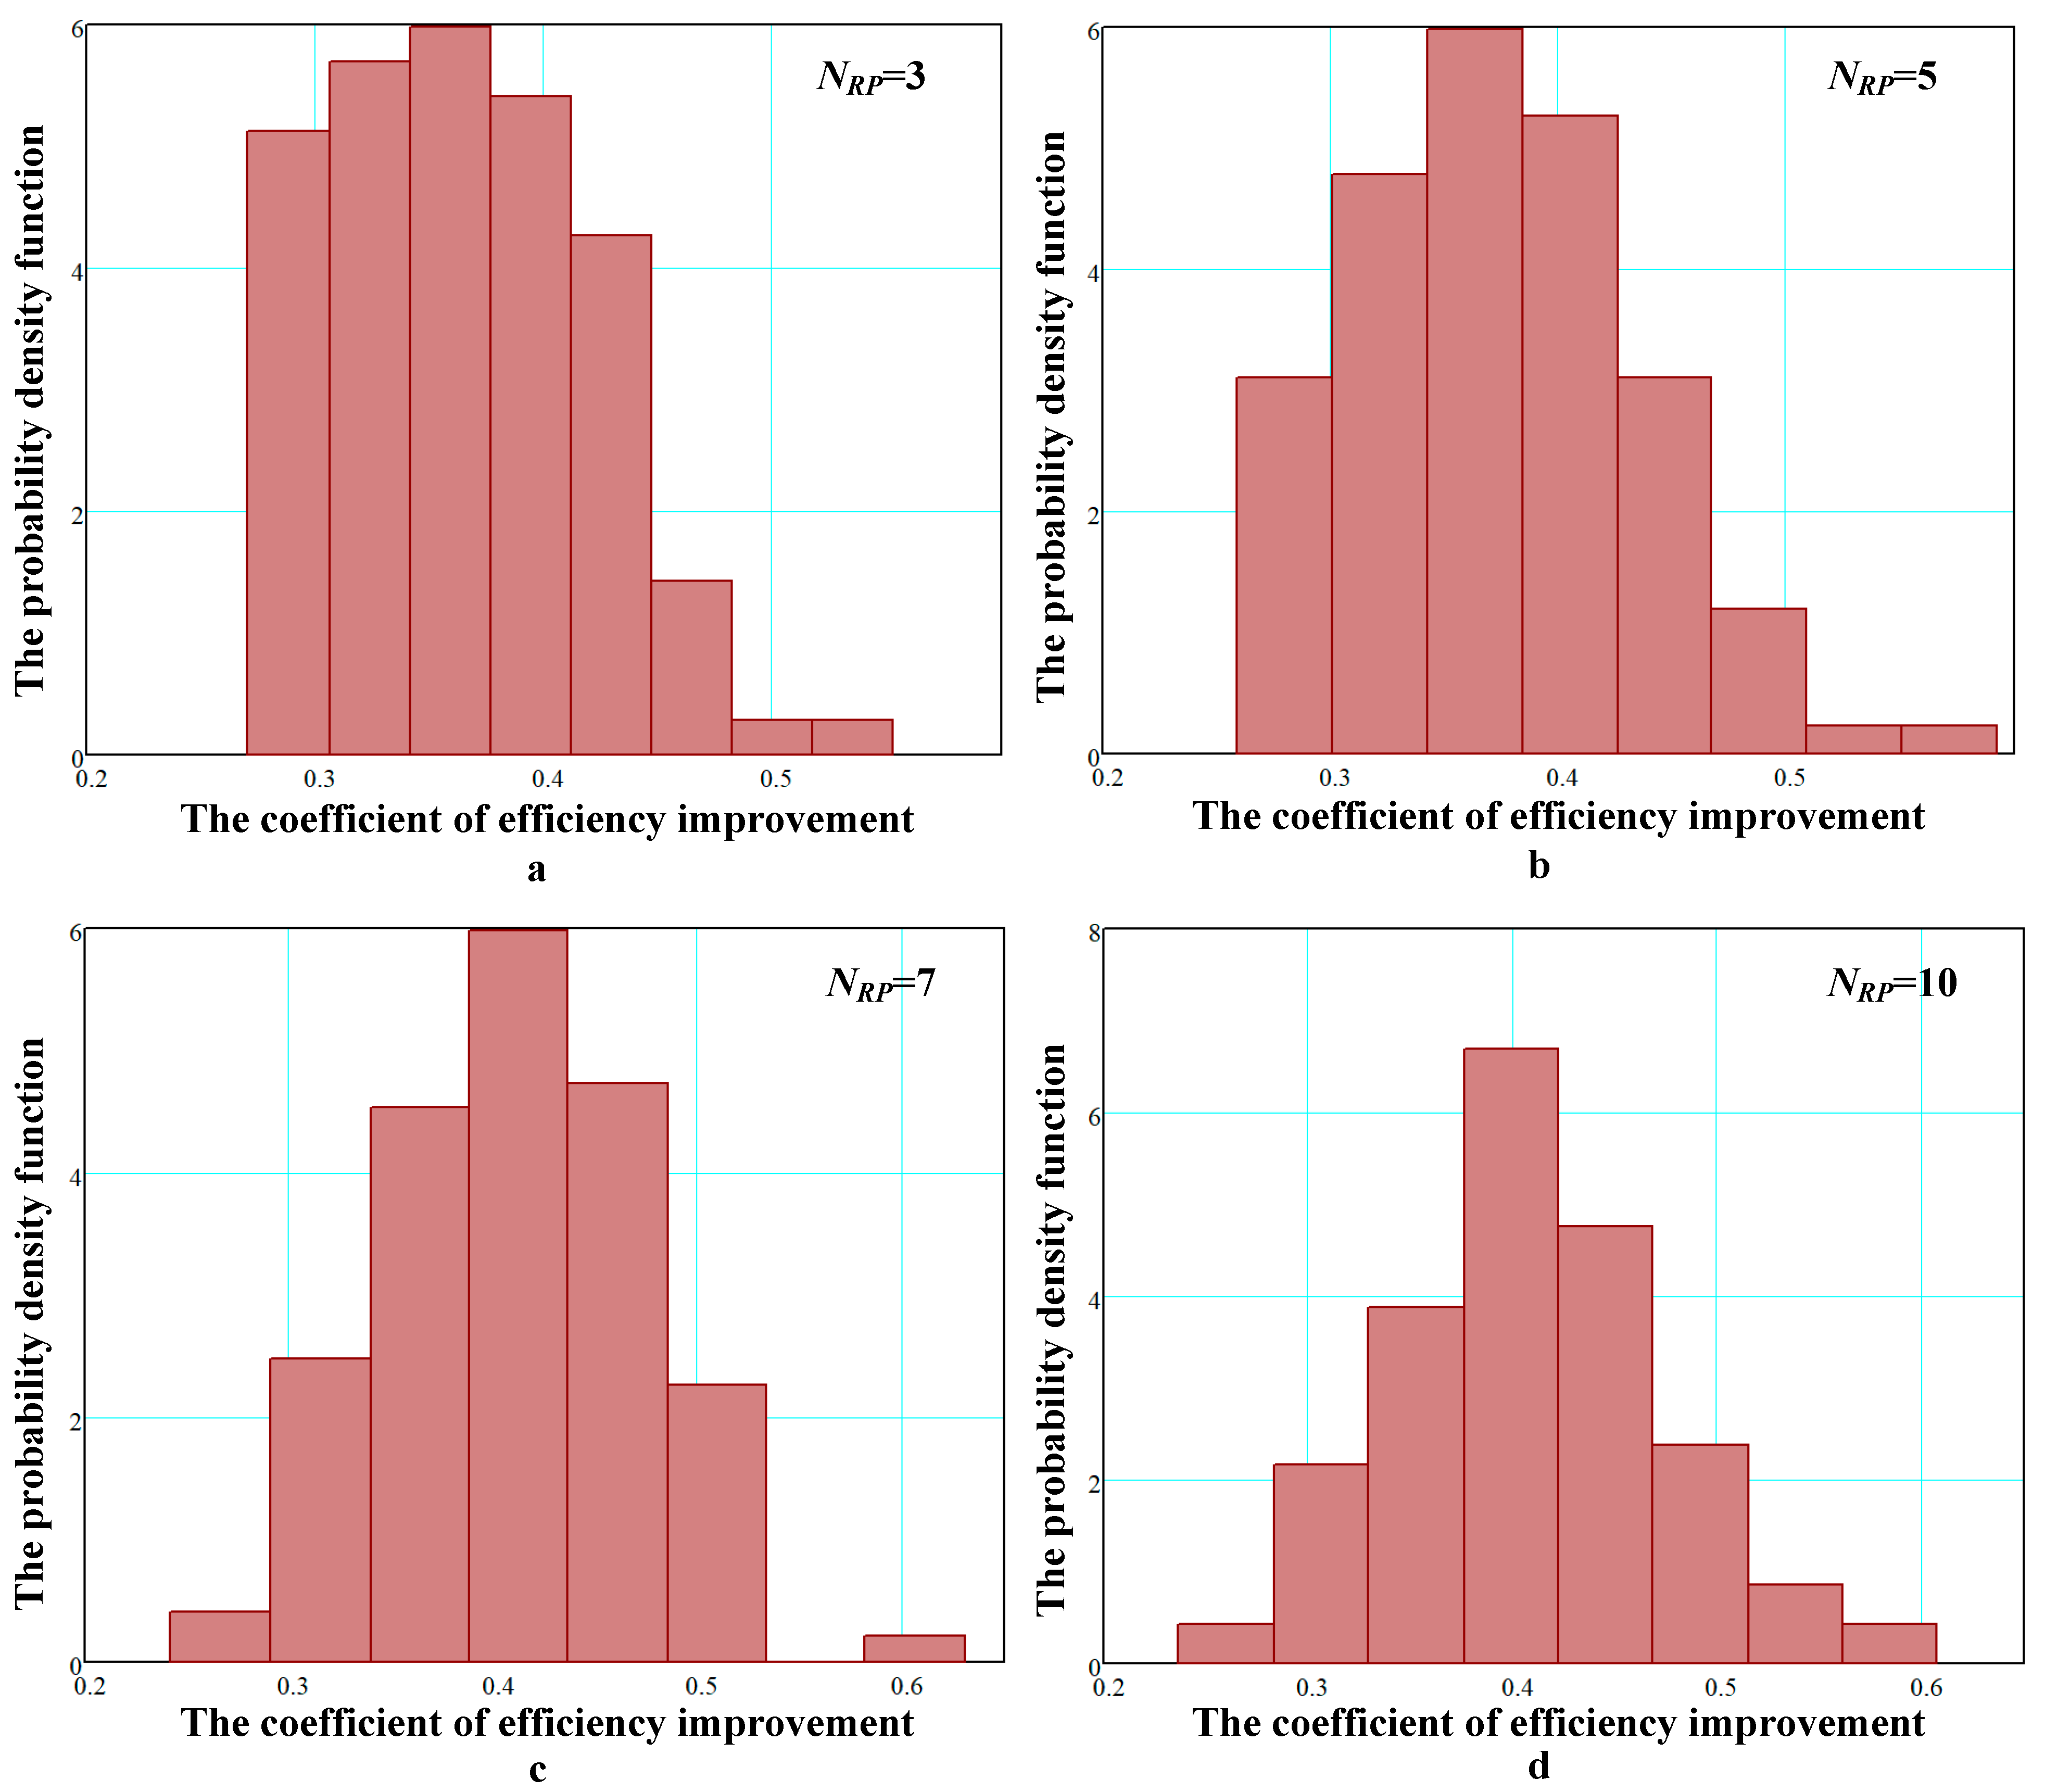
The probability density functions of the efficiency improvement coefficient for different numbers of aviation radio equipment units are shown in
Figure 16. It can be observed that, as the amount of equipment with reliability monitoring increases, the form of the distribution tends toward normality.
The results of the calculation of statistical characteristics of the efficiency improvement coefficient for different numbers of aviation radio equipment units with reliability monitoring are shown in
Table 1.
According to the data in
Table 1, the average improvement in efficiency ranges from 36.5% to 41.2%. The efficiency improvement coefficient increases as the number of aviation radio equipment units with reliability data processing increases. This is explained by the fact that the contribution of the partial efficiency indicator
also increases, which, for the established numerical values of the initial parameters, turned out to be greater than
.
To validate the results of statistical simulation, the simulation procedure was generally carried out for different numbers of iterations, namely 100, 1000, 10,000, 50,000, 100,000 and other constant initial parameters. At the same time, the simulation results differed within the permissible deviations. In particular, for the expected value of the efficiency improvement coefficient, the deviation was at the level of 0.673%.
As it can be seen, the introduction of Unit U8 provides a significant improvement in efficiency (in terms of operational costs per observation interval) and is therefore justified for use in the operational practice.
Overall, it should be mentioned that the process of the simulation of the Datahub functioning with all nine units can be considered as the object of separate research.


 ,
, 
