1. Introduction
With the deepening of industrialization and urbanization in China, water resource scarcity and water environmental pollution have become significant constraints on high-quality development and are prominent bottlenecks to sustainable development in China [
1,
2]. China’s water resources are notable in terms of their total abundance, but the country’s per capita availability is limited. The total volume of water resources in China ranks sixth in the world, yet the country’s per capita availability is less than 25% of the global average [
3]. Since the implementation of the “Ten Measures for Water” in 2015, China has entered an era of stringent water resource management [
4,
5].
The electricity sector in China is heavily impacted by water resource shortages, while simultaneously contributing to the problem [
6]. Water consumption for power generation accounts for the largest share of the energy sector’s water use, of approximately 40%, with water withdrawal for thermal power generation alone constituting more than 12% of the total national water consumption [
7]. The State Grid, the largest public utility company in the world, has increasingly taken water management issues into account when considering China’s energy conservation and emission reduction efforts [
8,
9]. Achieving “zero discharge” operations has become inevitable [
10,
11]. The normal operation of the power grid is highly dependent on water resources, and water re-source scarcity impacts the stable development of the system [
12]. To ensure a reliable power supply, by the end of 2022, China had built 36 ultra-high voltage transmission projects, including 40 UHV converter stations and more than 40 high-voltage converter stations. The total installed capacity of storage power stations had reached 32.49 GW, with 53.13 GW under construction, both ranking first globally [
13]. The main types of wastewater generated during the operation and maintenance of the power grid include construction-phase sewage, domestic wastewater, and cooling water produced during the operational phase. However, the converter stations and pumped storage power stations are widely distributed, many of which are in remote areas, far from cities, where there is often no drainage network or suitable receiving water body [
14,
15]. Discharging large quantities of high-salinity wastewater and domestic sewage could lead to soil and water salinization, causing ecological damage [
16,
17]. This not only causes potential environmental pollution and disputes, but also leads to a significant amount of wasted water resources [
18,
19].
Water resources management is a systematic project that involves multiple considerations across economic, environmental, and social dimensions. Therefore, comprehensive benefit evaluation methods are required to conduct relevant assessments. Grey Relational Analysis (GRA) assesses factor correlations based on trend similarity, requiring minimal sample sizes and simple implementation [
20,
21]. However, it is sensitive to optimal values. Fuzzy comprehensive evaluation quantifies nonlinear assessments through fuzzy mathematics, delivering intuitive results, while being susceptible to subjective influences, which renders it ideal for complex multi-factor systems [
22]. The Analytic Hierarchy Process (AHP) systematically decomposes complex problems into hierarchical criteria, offering methodological rigor at the cost of computational intensity, and is well-adapted to layered decision making involving non-quantitative factors [
23]. Therefore, this method has been applied in the evaluation of wastewater treatment technologies for towns [
24], communities [
25], and certain industrial sectors [
26,
27,
28]. The entropy weight method prioritizes data objectivity with high precision, although it is vulnerable to data anomalies; it is frequently combined with expert scoring and is commonly applied in fine-grained index weighting applications [
29,
30]. A summary of the methodologies used, their characteristics, and the applicable conditions is presented in
Supplementary Materials Table S1.
The main content of this study consists of two parts. First, the entropy weight method is used to conduct a comprehensive evaluation of the status of water management in various provinces in China (evaluation indicators include hydrological, cost, environmental, ecological, and other metrics, as shown in
Table 1). The provinces are then analyzed and categorized regionally to reveal the heterogeneity and importance of zonal management (
Section 3). Subsequently, the Analytic Hierarchy Process (AHP) is applied to evaluate the domestic sewage treatment facilities in converter stations (including both manned and unmanned stations) and hydropower plants to provide insights and references for water management within power grid operations (
Section 4).
2. Materials and Methods
We select several primary evaluation indicators and secondary evaluation indicators to quantitatively assess the typicality and corresponding characteristics of each region. The main primary evaluation indicators are as follows: hydrological index, cost index, environmental index, and ecological index. The selected indicators encompass four dimensions: hydrological, environmental, ecological, and economic. These indicators are comprehensive, quantifiable, and possess strong discriminatory power. Hydrological indicators reflect the natural endowment of water resources in a region, environmental indicators reveal the status of water pollution, ecological indicators capture the ecological support capacity of the water system, and economic indicators measure the efficiency and management of water resource utilization. There are close interrelationships among these indicators, for instance, water scarcity often coincides with increased pollution risks, favorable ecological conditions can effectively improve water quality, higher water prices can promote conservation and reuse, and enhanced ecosystems can increase the economic value of water resources. This integrated indicator system is designed to capture the complex characteristics and sustainable management potential of regional water resources, providing a scientific basis for informed decision making.
The research area excludes Hainan, Taiwan, Hong Kong, and Macau. Among them, the total regional water resources and total water usage are sourced from the “China Water Resources Bulletin” and the “China Water Resources Statistical Yearbook”; the population and regional GDP data are from the “China Statistical Yearbook”; the data on the water quality over the past three years is sourced from the National Water Quality Automatic Comprehensive Supervision Platform (
https://szzdjc.cnemc.cn:8070/GJZ/Business/Publish/Main.html, accessed on 27 December 2024) and the Ministry of Ecology and Environment’s national surface water environmental quality status; and the water price data are from the China Water Network (
https://www.h2o-china.com/price/index, accessed on 27 December 2024). The corresponding secondary indicators are detailed in
Table 1.
Table 1.
Evaluation indicators.
Table 1.
Evaluation indicators.
| Primary Evaluation Indicators | Secondary Evaluation Indicators | Indicators | Positive/Negative |
|---|
| Hydrological Index | Per capita water resources | Ratio of total regional water resources to total regional population (m3/person) | + |
| Annual precipitation | Average precipitation over the last 3 years (mm) | + |
| Environmental Index | Dissolved oxygen | Average dissolved oxygen concentration over the last 3 years (mg/L) | + |
| Electrical conductivity | Average electrical conductivity over the last 3 years (μS/cm) | − |
| Turbidity | Average turbidity over the last 3 years (NTU) | − |
| Permanganate | Average permanganate index over the last 3 years (mg/L) | − |
| Ammonia nitrogen | Average ammonia nitrogen concentration over the last 3 years (mg/L) | − |
| Total phosphorus | Average total phosphorus concentration over the last 3 years (mg/L) | − |
| Total nitrogen | Average total nitrogen concentration over the last 3 years (mg/L) | − |
| Ecological Index | Forest and grassland ratio | Proportion of forest and grassland area in the region | + |
| Water body ratio | Proportion of water body area in the region | + |
| Economic Index | Economic value | Comprehensive value of water resources per unit | + |
| Water fees | Average water price in the region | − |
2.1. Entropy Weight Method
The evaluation of water management areas is a typical multi-attribute evaluation problem, where contradictions exist among the relevant attribute indicators. Therefore, it is necessary to introduce weights for the calculation and evaluation. The amount of information contained in each criterion value varies within the evaluation scheme. In regard to information science, entropy holds significant importance; generally, the higher the degree of disorder, the less information it contains, and the greater the entropy; conversely, the lower the degree of disorder, the more information it contains, and the smaller the entropy. The American mathematician, Shannon, in his paper “A Mathematical Theory of Communication”, applied probability theory and related logical deductions to derive the formula for information entropy [
31,
32]:
where
xi is the
i-th state value and
P(xi) is the probability of the occurrence of the
i-th state value. Based on information entropy
H(x), it is used to evaluate the amount of information contained in the relevant indicators and assign corresponding weights
w. Since information entropy is related to the probability distribution of events, it serves as an objective weighting method that can avoid errors caused by human factors. The relevant calculation steps are as follows:
2.1.1. Construction of the Evaluation Index Matrix
The evaluation indicators typically consist of n indicators and m evaluated objects, forming a relevant matrix X = (Xij)m × n, which is referred to as the evaluation index matrix. In this study, a comprehensive evaluation is conducted based on multiple factors, including ecology, hydrology, environment, and economy. Considering the specificity of the research topic and the related environmental and economic benefits, the selected indicators mainly include the per capita water resources, annual precipitation, dissolved oxygen, conductivity, turbidity, permanganate index, ammonia nitrogen, total phosphorus, total nitrogen, forest and grassland ratio, water body ratio, economic value, and water fees.
2.1.2. Normalization
Considering that the indicators should primarily ensure economic and environmental benefits, the normalization process must account for the positive and negative orientations of the relevant indicators. In this study, the per capita water resources, annual precipitation, dissolved oxygen, forest and grassland coverage, water body proportion, and economic value are defined as positive indicators, while conductivity, turbidity, permanganate index, ammonia nitrogen, total phosphorus, total nitrogen, and water fees are defined as negative indicators. For the negative indicators, the formula is as follows:
In the formula, f (i,j) represents the score of the j-th indicator for the i-th industry, f(i,j) is the corresponding value of the j-th indicator for the i-th industry, f (j, max) is the maximum value of the indicator, and f (j, min) is the minimum value of the indicator.
For the positive indicators, the formula is as follows:
In the formula, f (i,j) represents the score of the j-th indicator for the i-th industry, f (i,j) is the corresponding value of the j-th indicator for the i-th industry, f (j, max) is the maximum value of the indicator, and f (j, min) is the minimum value of the indicator.
2.1.3. Matrix Translation
Considering that logarithmic operations are required in subsequent formulas, a translation is generally applied after normalizing the indicators. To ensure accuracy, a translation value of +0.00001 is chosen.
2.1.4. Calculation of Indicator Probability and Entropy
The formula for calculating the probability of indicator
j:
The formula for calculating the entropy of indicator
j:
where
, and, at this point, 0 ≤
Ej ≤ 1.
2.1.5. Calculation of Information Entropy Weight
Hence, the calculation formula for the weight,
wj, is as follows:
From this, the relevant indicator weights can be obtained. The final evaluation result can be derived by performing a linear weighting of the relevant indicators.
2.2. AHP Model
The Analytic Hierarchy Process (AHP) is a structured decision-making technique, designed to systematically organize and analyze complex decisions. First developed by Thomas L. Saaty in the 1970s, the AHP enables decision makers to prioritize alternatives and make optimal choices by evaluating multiple criteria simultaneously. The AHP begins with the definition of the problem and hierarchical structuring. A typical hierarchy consists of three primary levels [
33,
34,
35]:
Objective: The overarching goal is positioned at the top level;
Criteria and Sub-criteria: The evaluation parameters are organized at intermediate levels;
Alternatives: Potential solutions or options are featured at the base level.
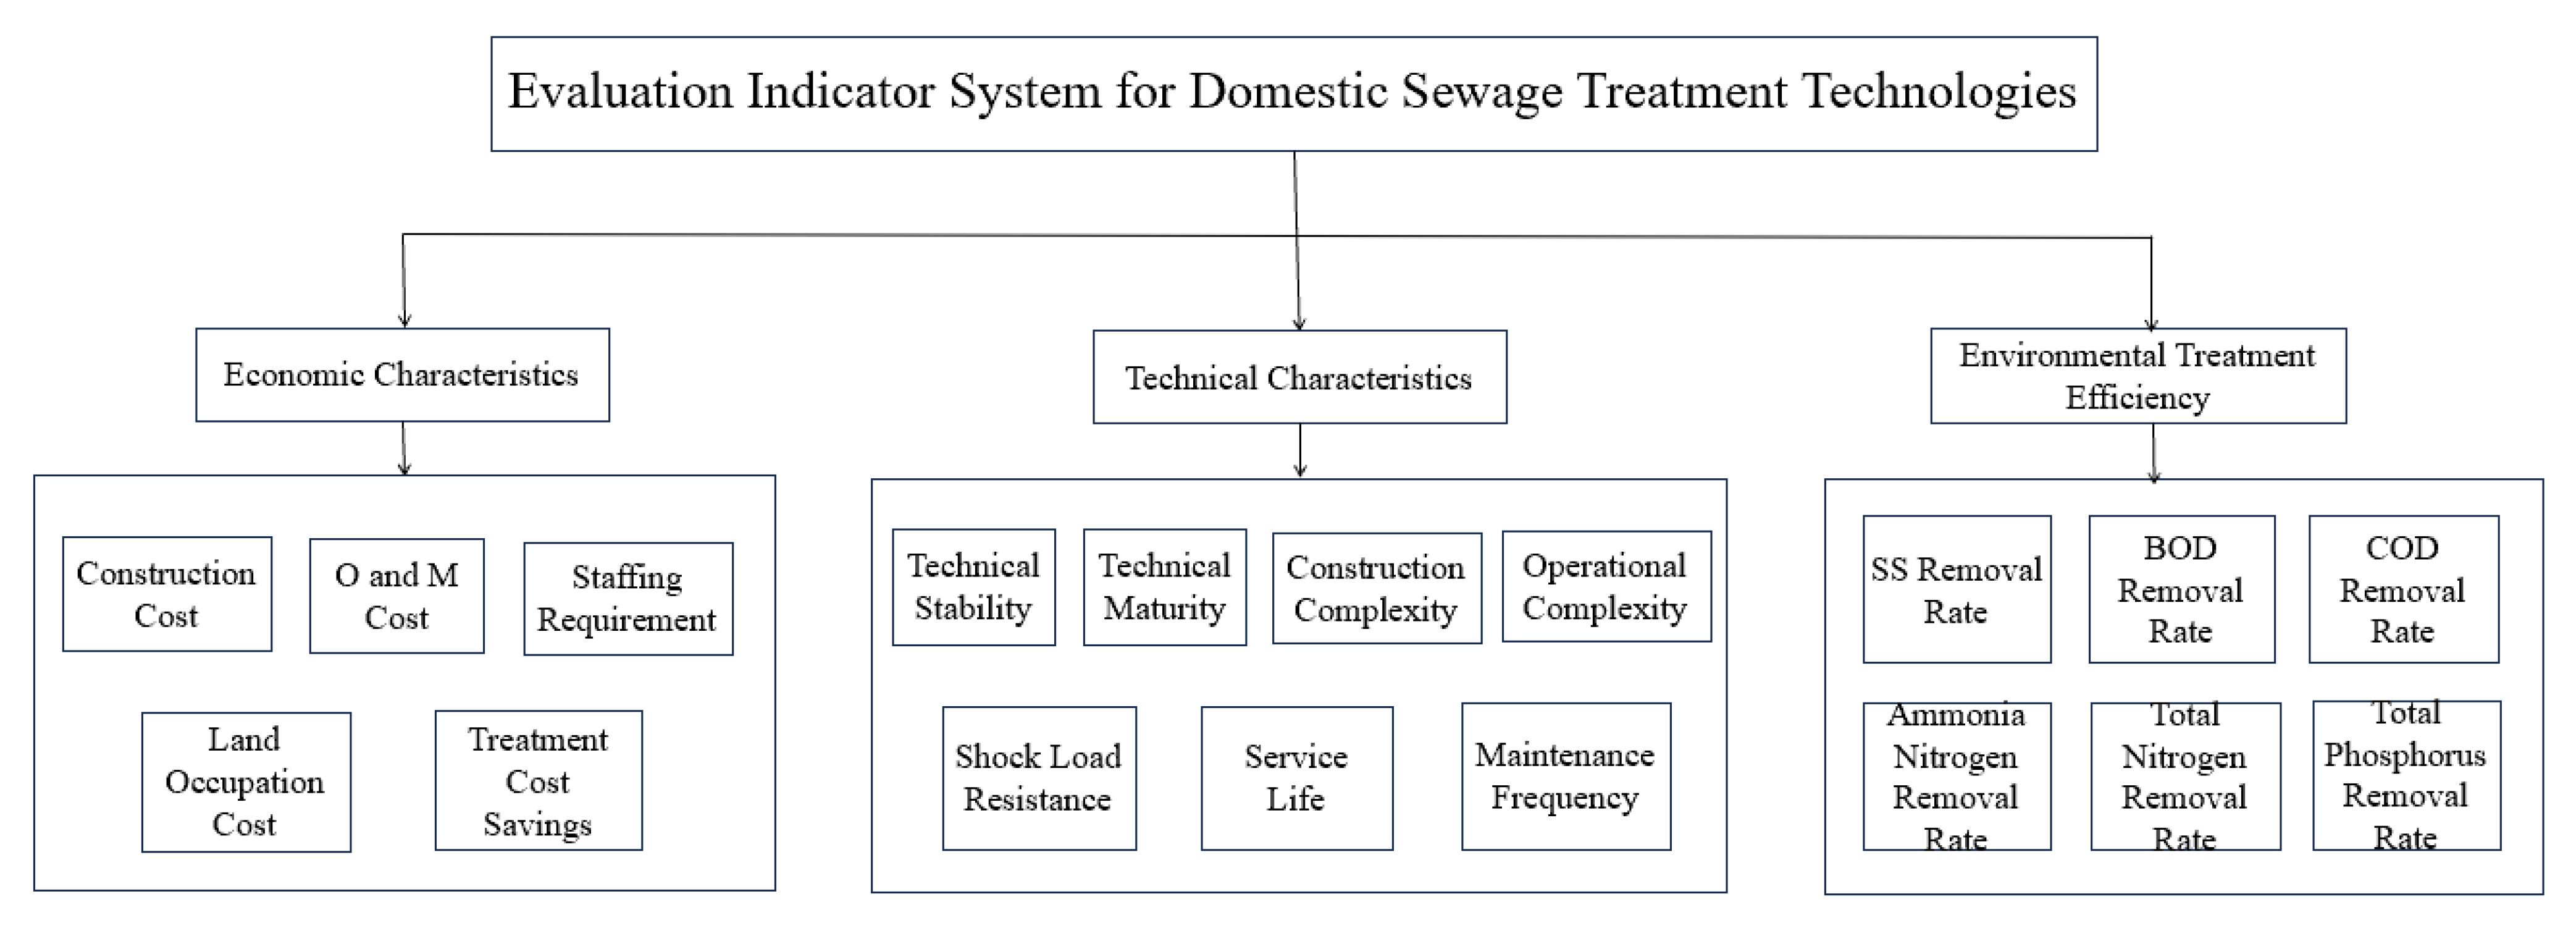
The design of the AHP model in this study features three primary characteristics (As shown in
Figure 1).
Firstly, three first-level evaluation indicators for wastewater treatment technologies, namely economic characteristics, technical characteristics, and environmental treatment efficiency, were determined through an extensive literature review and field research.
Secondly, the selection of subordinate second-level indicators (such as suspended solids [SS], biochemical oxygen demand [BOD], and chemical oxygen demand [COD]) was based on comprehensive field measurements of discharged water samples. These indicators were specifically chosen according to on-site investigations on effluent quality from converter stations and substations.
Finally, expert scoring was employed to determine the weight values of each evaluation indicator for wastewater treatment technologies. The experts participating in this survey primarily specialize in environmental engineering and project management, all holding a bachelor’s degree or higher, with over five years of industry experience. This approach effectively ensures the authority of the model’s results.
Establishment of Membership Functions
Considering that technical evaluation criteria include not only quantitative indicators but also qualitative ones, and that the evaluation standards for these indicators vary, it is not feasible to directly integrate all the indicator parameters of a given technology into a single meaningful evaluation value. Therefore, a membership function is employed to calculate the degree of membership for each indicator, enabling the unification and quantification of both qualitative and quantitative indicators.
For quantitative indicators, when a quantitative evaluation indicator is “the larger, the better” (e.g., SS removal rate), an ascending semi-trapezoidal membership function is used:
Conversely, when a quantitative evaluation indicator is “the smaller, the better” (e.g., investment cost), a descending semi-trapezoidal membership function is adopted:
where
a and
b represent the lower and upper bounds of the quantitative evaluation indicator, respectively.
For the qualitative indicators, the expert scoring method is applied. First, a comment set
V and a standard membership degree set
X are established. The membership function expression is:
where
n is the number of levels used in the qualitative evaluation scale.
3. Comparative Analysis of Regional Water Management Metrics
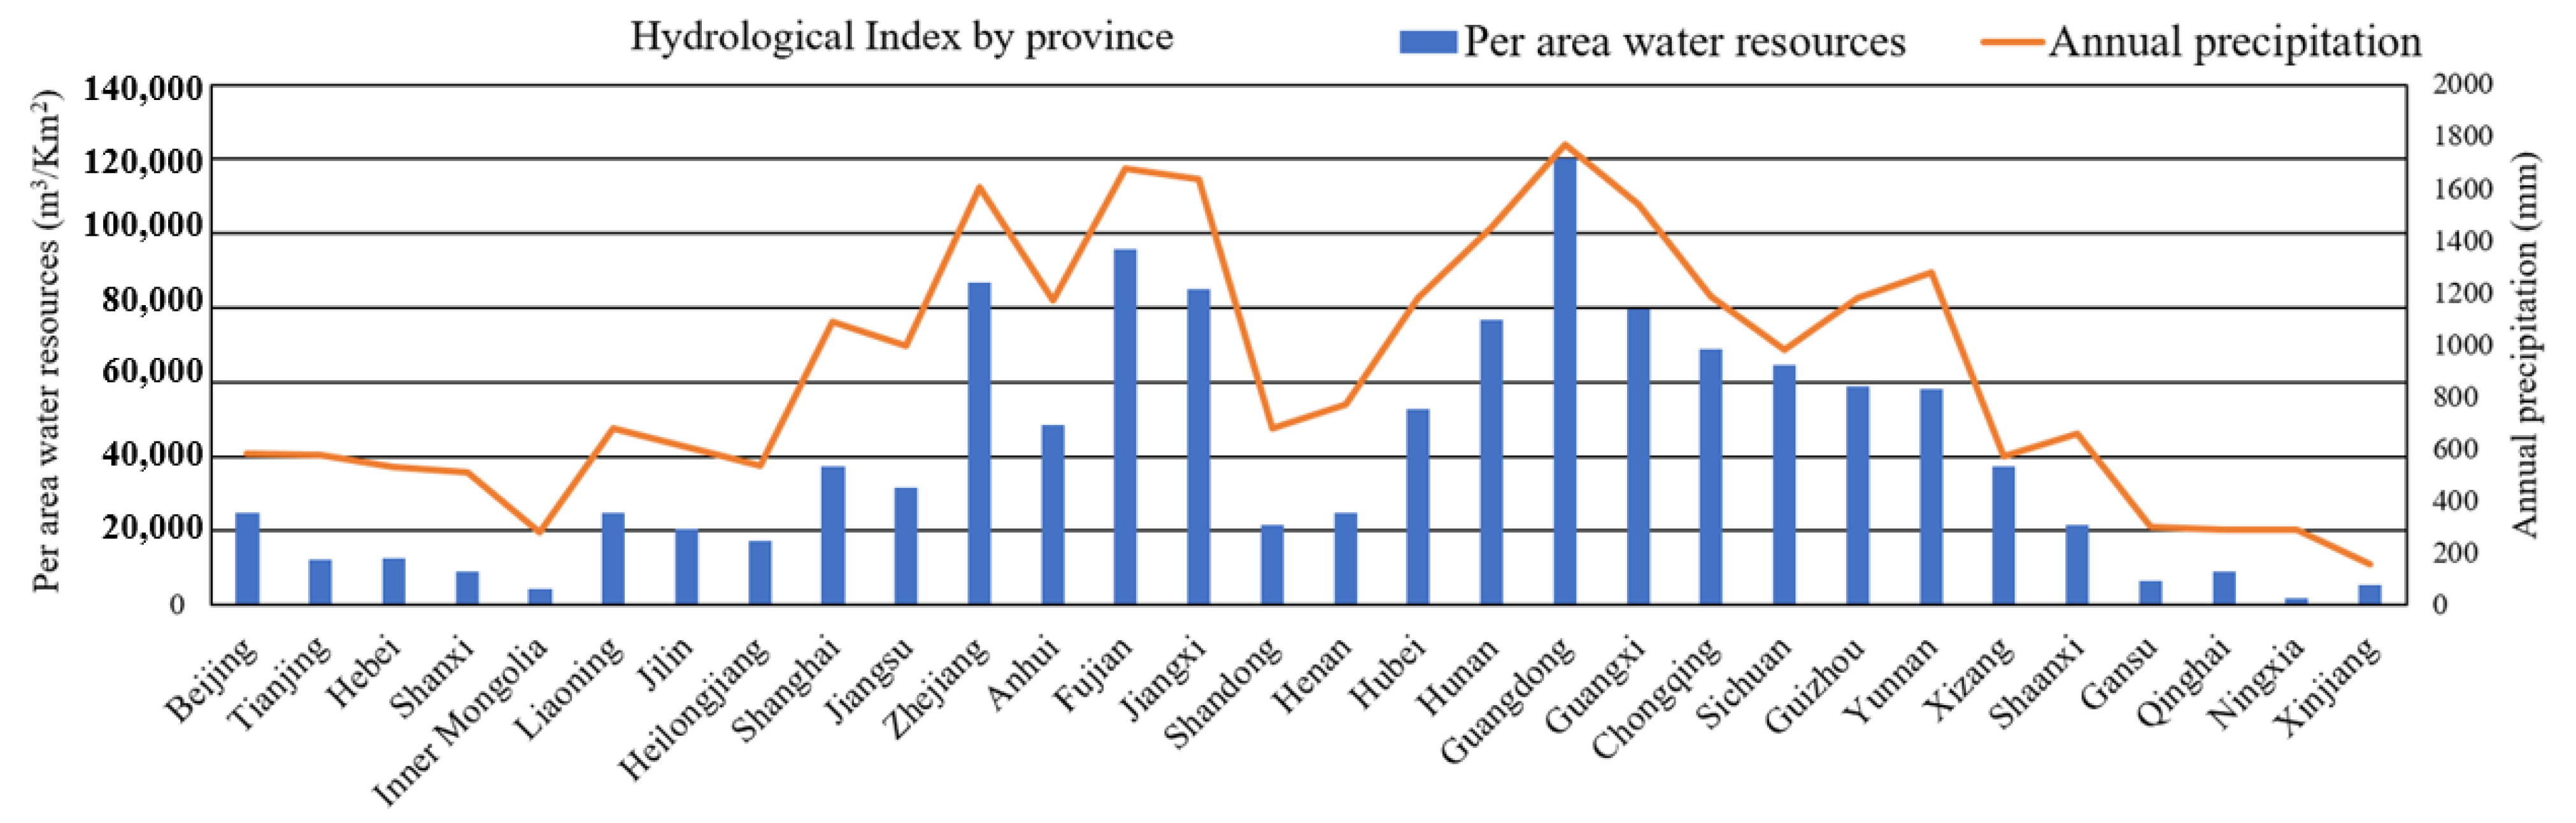
Figure 2 presents the hydrological indicators for the Chinese provinces, including per area water resources and annual precipitation. Coastal and southern provinces, such as Guangdong (1,200,470.27 m
3/km
2, 1770.64 mm) and Fujian (956,813.62 m
3/km
2, 1677.27 mm), exhibit the highest values, due to their abundant rainfall and river systems. In contrast, arid regions like Xinjiang (54,162.57 m
3/km
2, 154.69 mm) and Ningxia (19,046.15 m
3/km
2, 288.63 mm) have significantly lower water availability. Northern and inland provinces, including Inner Mongolia and Gansu, have limited resources due to lower precipitation and high evaporation rates. The data highlights China’s stark regional disparities in terms of water distribution, emphasizing the challenges faced in regard to water resource management and allocation.
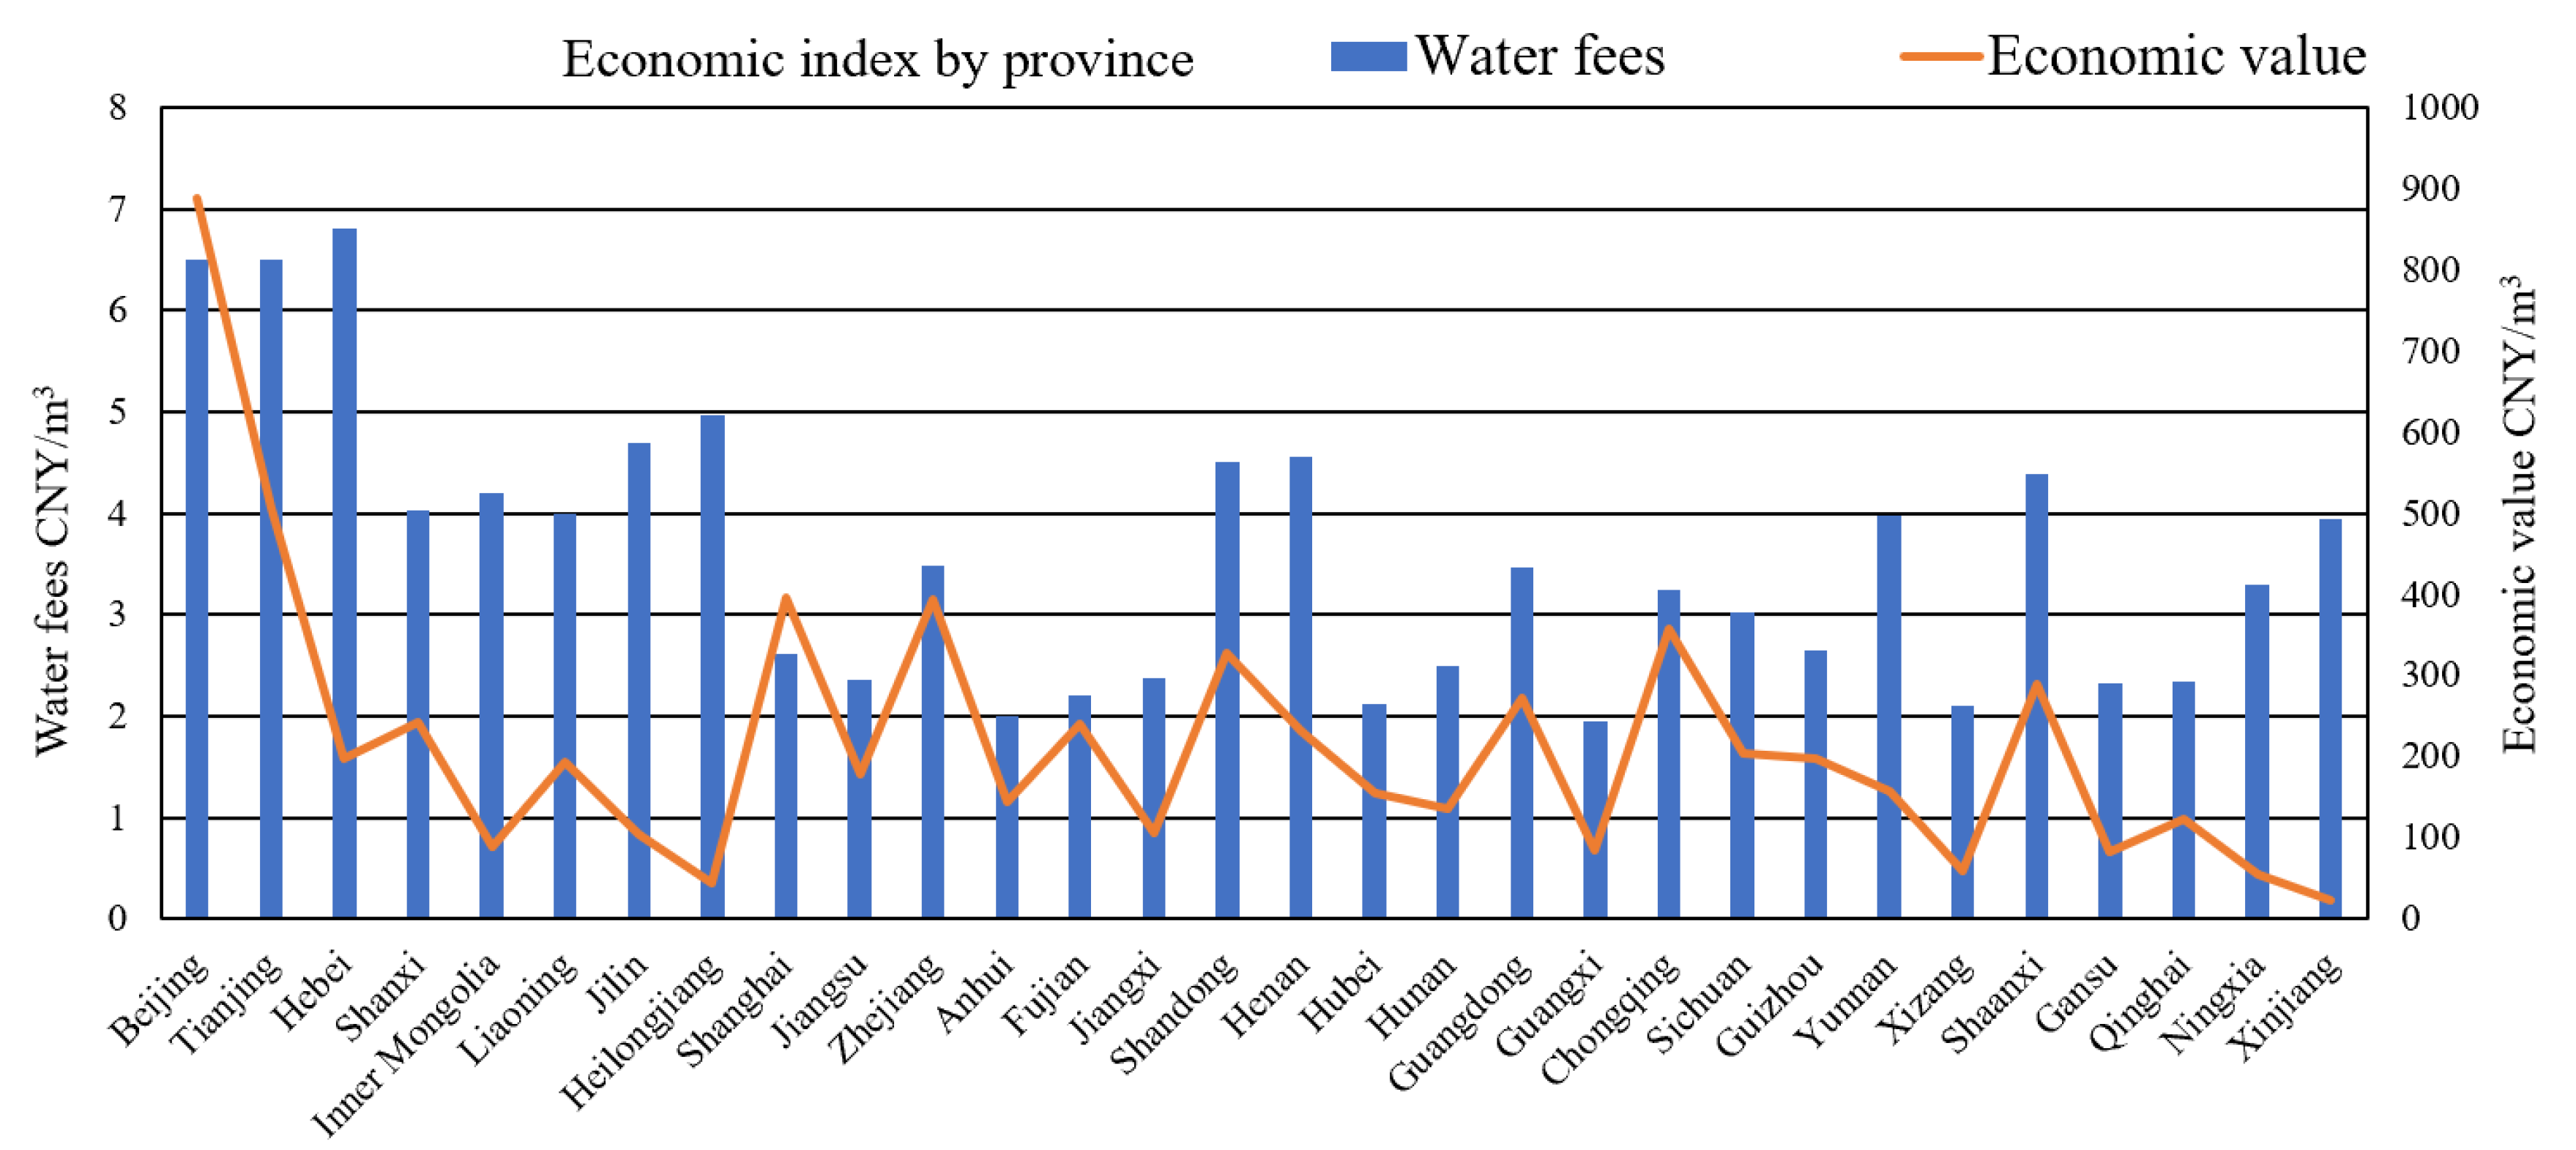
As shown in
Figure 3, the economic index across the provinces, including water fees and the economic value per unit of water usage, demonstrate significant regional disparities, driven by resource availability, industrial structure, and economic development levels. Provinces with high water fees and high economic value, such as Beijing (6.5 CNY/m
3, 889.23 CNY/m
3) and Tianjin (6.5 CNY/m
3, 506.61 CNY/m
3), indicate efficient water use in high-value industries, particularly in the service and technology sectors. Conversely, agriculture-dominated provinces like Xinjiang (3.95 CNY/m
3, 24.19 CNY/m
3) and Heilongjiang (4.96 CNY/m
3, 43.61 CNY/m
3) exhibit low economic output per unit of water, reflecting water-intensive, low-productivity sectors. Provinces with low water fees and moderate economic value, such as Hubei (2.12 CNY/m
3, 155.77 CNY/m
3) and Guangxi (1.95 CNY/m
3, 84.86 CNY/m
3), benefit from greater water availability. Industrialized coastal regions, including Shanghai (2.62 CNY/m
3, 396.93 CNY/m
3) and Zhejiang (3.49 CNY/m
3, 394.22 CNY/m
3), maintain relatively low water costs, while achieving high economic returns, emphasizing their advanced economic structure.
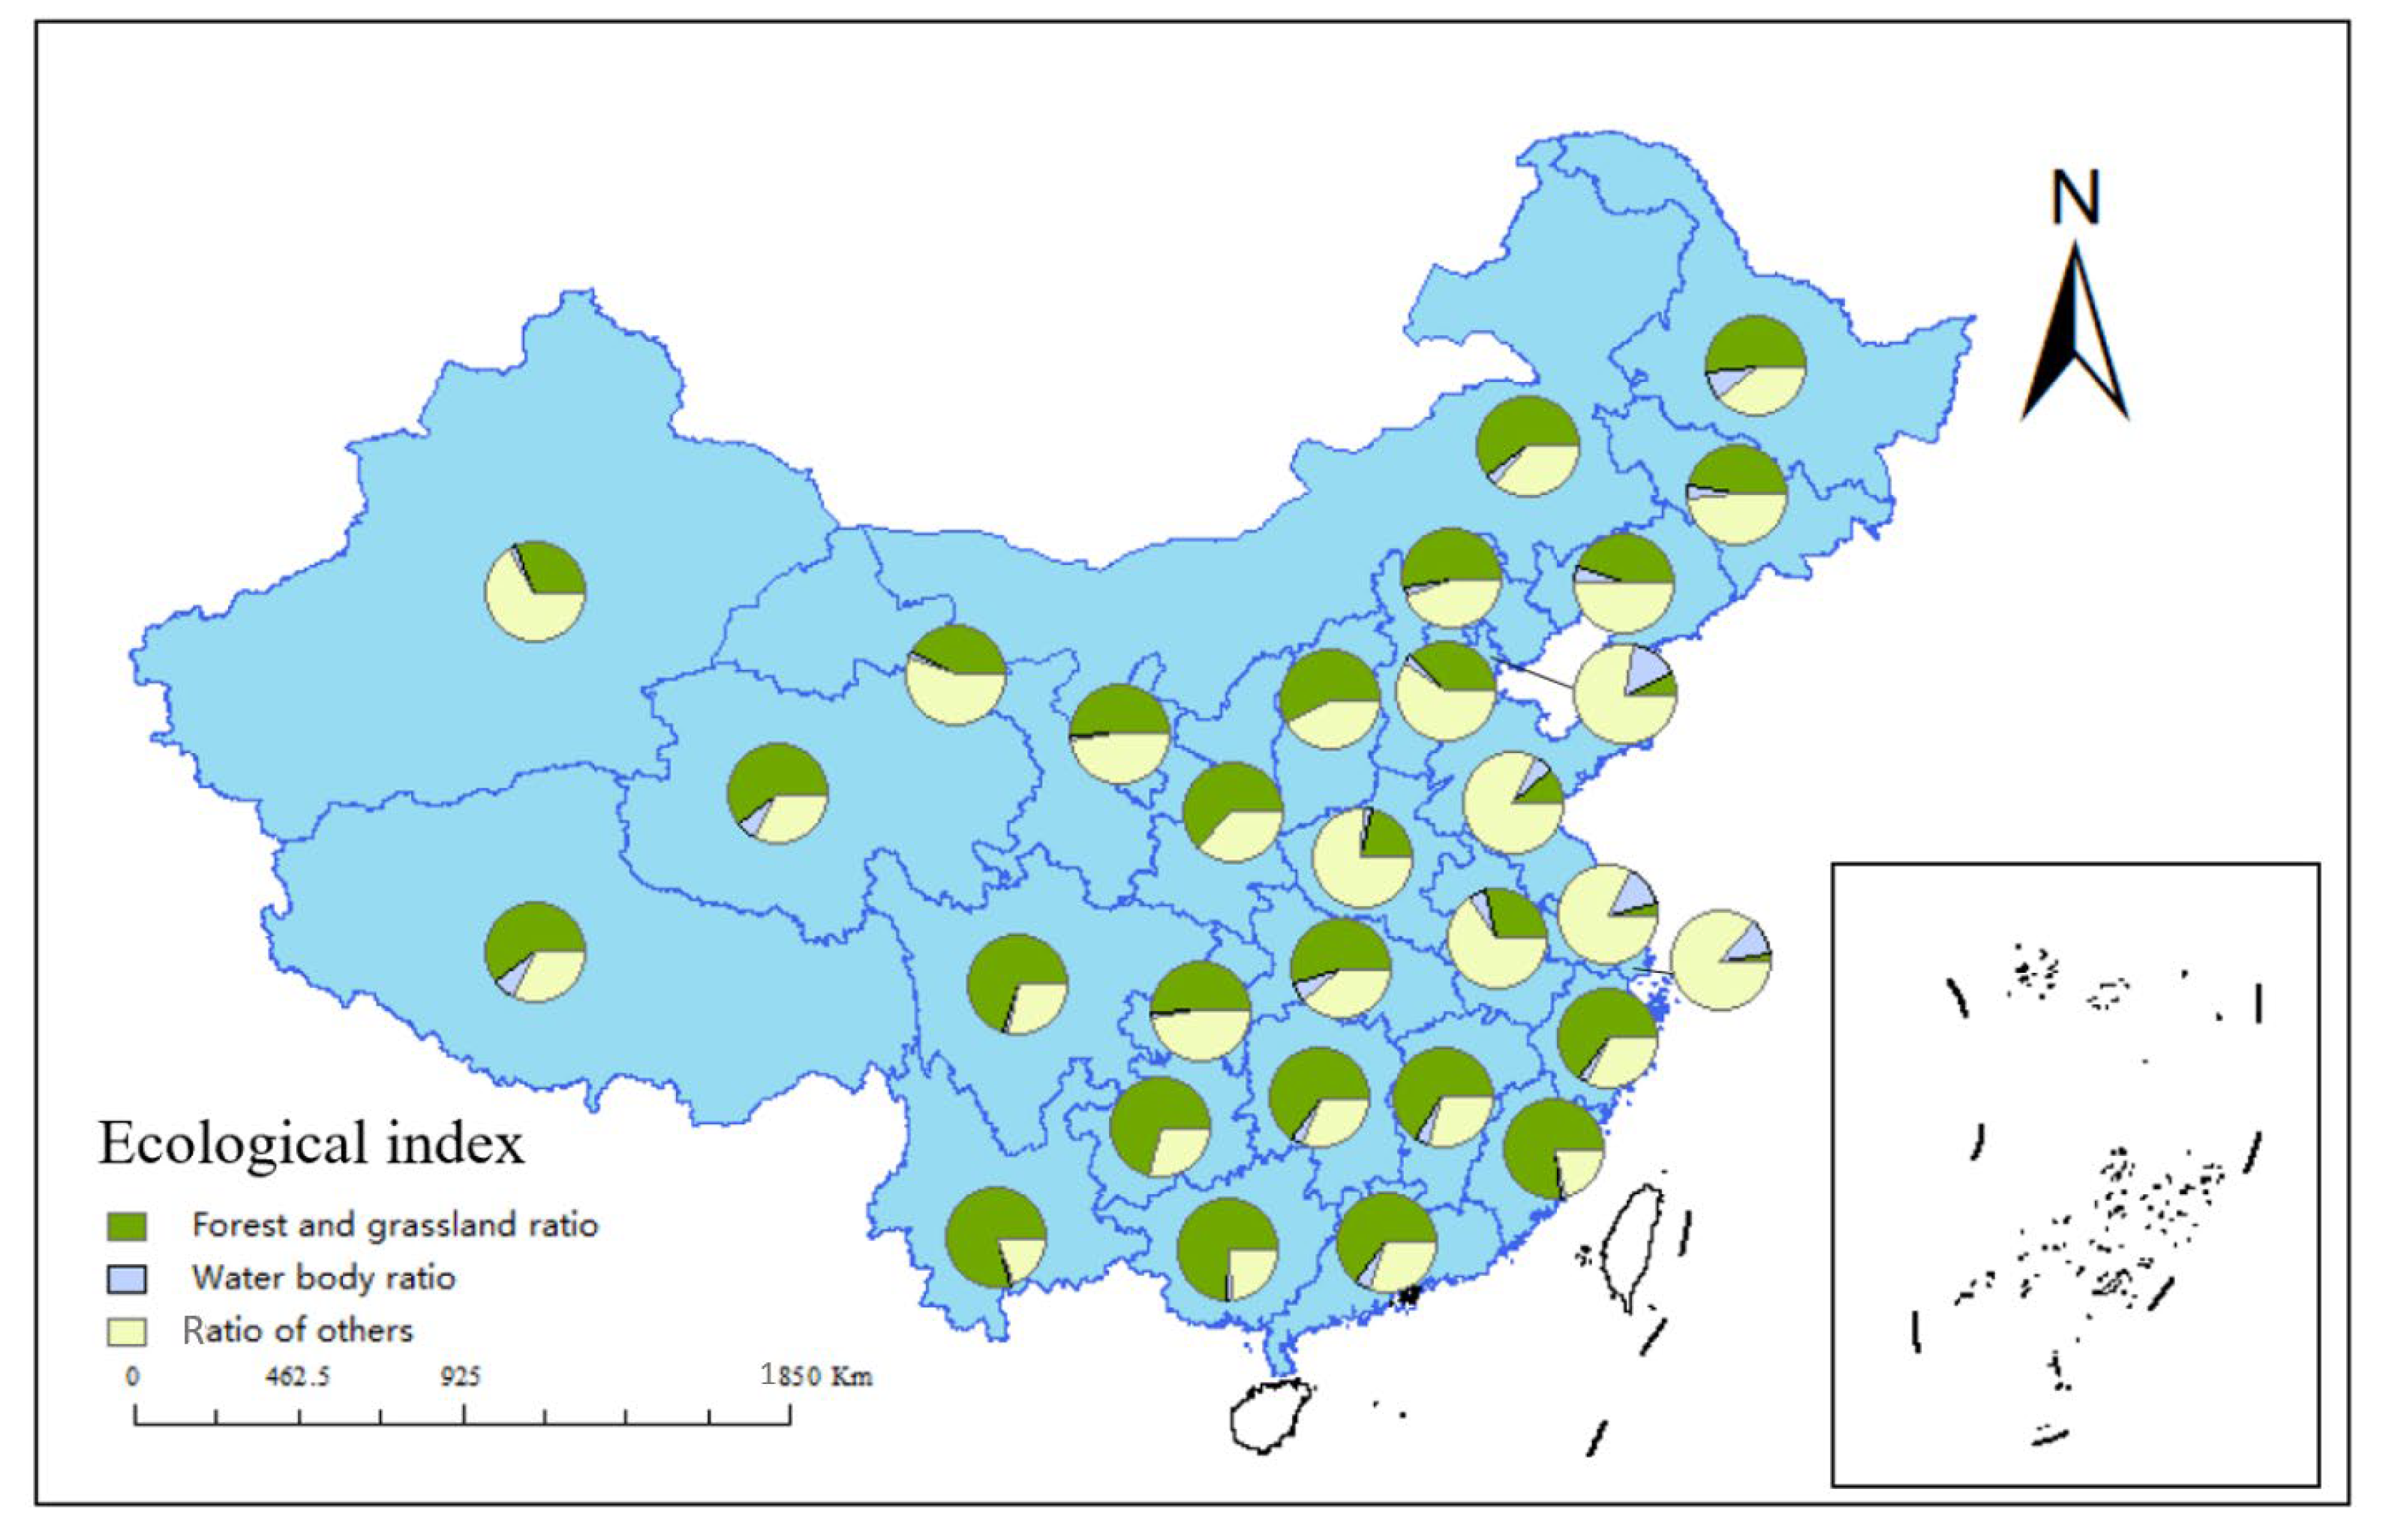
The ecological characteristics of the Chinese provinces (
Figure 4), represented by the forest and grassland ratio and water body ratio, show significant regional disparities, influenced by climate, topography, and land use patterns. Provinces with the highest forest and grassland coverage, such as Yunnan (0.797), Fujian (0.771), and Guangxi (0.745), are characterized by mountainous terrain, subtropical climates, and dense vegetation, contributing to high biodiversity and carbon sequestration potential. Conversely, industrialized and urbanized provinces like Shanghai (0.024) and Jiangsu (0.038) exhibit minimal natural land coverage, primarily due to their dense population and intensive land use. The water body ratio varies across the regions, with Tianjin (0.161), Jiangsu (0.142), and Shanghai (0.113) showing the highest values, reflecting their coastal geography and extensive water networks. In contrast, inland provinces, such as Shanxi (0.009) and Guizhou (0.007), have minimal water bodies, often relying on river systems for their water resources. Qinghai (0.069) and Xizang (0.077) maintain a relatively higher water body ratio due to their large freshwater lakes and glacier-fed rivers.
Supplementary Materials Table S2 details the environmental characteristics of the Chinese provinces, revealing significant regional variations. Northern provinces generally have higher dissolved oxygen (DO) levels, such as Hebei (10.73 mg/L), while Tibet (6.83 mg/L) has the lowest, indicating better self-purification in northern waters. Electrical conductivity (EC) is the highest in Tianjin (3136.36 μS/cm), followed by Hebei (2147.78 μS/cm), suggesting the presence of a higher amount of dissolved inorganic salts, whereas Jiangxi (190.87 μS/cm) and Heilongjiang (208.15 μS/cm) have the lowest values. Turbidity is the highest in Gansu (243.51 NTU), Ningxia (240.98 NTU), and Qinghai (226.69 NTU), likely due to soil erosion, whereas Tianjin (24.18 NTU) and Guizhou (23.26 NTU) have lower values. The permanganate index is high in Inner Mongolia (6.09 mg/L) and Heilongjiang (5.95 mg/L), possibly due to organic pollution, while Tibet (1.14 mg/L) has the lowest value. Ammonia nitrogen levels are higher in Shanxi (0.36 mg/L) and Shanghai (0.26 mg/L), with the lowest level in Chongqing (0.06 mg/L). Total phosphorus is higher in Jilin, Shanghai, and Jiangsu, while total nitrogen peaks in Shandong (5.66 mg/L) and Beijing (5.52 mg/L). Overall, northern waters have higher oxygen content, and western regions show better water quality.
The final composite value of each province is shown in
Figure 5. There are significant differences in the water management index values across China’s six major power grid regions. The Southern Power Grid (Guangdong, Guangxi, Yunnan, Guizhou) has a relatively high level of water management, with Guangdong (0.5653) leading nationwide, reflecting strong investments in water governance in economically developed areas. However, the absence of data for Hainan suggests the need for further supplementation. The Central China Power Grid (Hubei, Hunan, Jiangxi, Henan) exhibits significant regional disparities. Jiangxi (0.5355) and Hunan (0.5271) have relatively high scores, whereas Henan (0.3214) has a much lower score, indicating substantial room for improvement in regard to water management. The North China Power Grid (Beijing, Tianjin, Hebei, Shanxi, Shandong, Inner Mongolia) has low water management performance overall. Beijing (0.4391) and Tianjin (0.4660) perform relatively well, but Hebei (0.3057), Shanxi (0.2356), and Inner Mongolia (0.2327) are among the lowest performers in regard to water management, possibly due to water scarcity and ecological pressures. The Northwest Power Grid (Shaanxi, Gansu, Qinghai, Ningxia, Xinjiang) also performs poorly, with all of the provinces scoring below the national average. This highlights the region’s water resource scarcity and governance challenges. Qinghai (0.3402) and Xinjiang (0.3042), in particular, may require stronger policy support and management strategies. The East China Power Grid (Shanghai, Jiangsu, Zhejiang, Anhui, Fujian, Shandong) has relatively good water management performance. Zhejiang (0.5124) and Fujian (0.4998) perform well, whereas Shandong (0.3169) performs significantly less well, likely due to water shortages. The Northeast Power Grid (Liaoning, Jilin, Heilongjiang) has low water management scores, with Heilongjiang (0.3547), Jilin (0.3153), and Liaoning (0.3378) all performing below the national average. This could be attributed to the industrial structure, economic development, and water management challenges caused by harsh winters in these areas.
Overall, the southern and eastern power grids have higher water management levels, while the north, northwest, and northeast power grids generally score lower, indicating a need for improved water governance.
4. Evaluation of Domestic Sewage Treatment Technology for Converter Stations and Pumped Storage Power Stations
Based on the different power grids in China detailed in the previous section, we comprehensively evaluated the sewage treatment equipment used by pumped storage power stations and converter stations (both manned and unmanned) in each region. Specifically, we first established a database of process equipment in regard to the water treatment technology industry. We conducted a comprehensive investigation of water treatment-related processes and equipment, and determined the weights of various indicators for each process by combining the Delphi method [
36,
37] with the AHP; the experts participating in this questionnaire survey are primarily from environmental engineering and project management disciplines, all with over 5 years of professional experience and holding a bachelor’s degree or higher. In terms of professional titles, all the participants have intermediate level qualifications or above. This demonstrates that the experts involved possess strong professional representativeness and authority. Finally, we conducted a fuzzy comprehensive evaluation to obtain the final assessment results. The characteristics of various sewage treatment technologies are detailed in
Supplementary Materials Table S3.
As shown in
Figure 6, for pimped storage power stations, the AAO+MBR scores were the highest in the northwest (0.588), southern (0.588), north (0.595), and central (0.583) region, suggesting these types of power stations are best suited for the region’s semi-arid climate and stricter reuse demands. The Multi-stage A/O led in regard to scores in the east (0.596) and northeast (0.665), reflecting the region’s strong industrial base and advanced infrastructure, supporting higher-end technologies. Across all the regions, the Septic Tank method consistently had the lowest scores, confirming its unsuitability for modern, large-scale treatment scenarios.
As for unmanned sewage treatment technologies, Powered Eco-type Sewage Treatment Units scored the highest across most of the regions, particularly in east China (0.659), north China (0.652), and northeast China (0.653). These systems are highly suitable for regions with advanced infrastructure and robust treatment demands, where automation is critical and minimal human oversight is required. Powered Underground Sewage Treatment Units also performed well, with top scores in east China (0.649) and central China (0.649), reflecting the region’s ability to support automated systems in urban and industrialized environments. These systems are effective in remote areas with good automation infrastructure, but limited human presence. Septic Tanks consistently scored the lowest across all the regions, indicating their unsuitability for modern sewage treatment. For example, the scores in northeast (0.596) and north China (0.572) highlight their underperformance in comparison to other technologies, particularly for large-scale operations.
In summary, for manned sewage treatment technologies, Powered Eco-type Sewage Treatment Units led in regard to scores across most of the regions, especially in east China (0.663), north China (0.652), and northeast China (0.663). These technologies are best suited to regions with robust industrial infrastructure and where a high level of performance is essential. They benefit greatly from human oversight for ongoing system maintenance and monitoring. Powered Underground Sewage Treatment Units also performed well, with top scores in south China (0.652) and east China (0.651), reflecting their suitability for regions that require automated systems with additional human presence for maintenance, ensuring optimal operation. Septic Tanks remained the lowest performing technology across all the regions.
5. Conclusions
This study evaluates sewage treatment technologies at manned and unmanned converter stations and pumped storage power stations across China, using a multi-criteria approach. The findings show significant regional variations in performance, driven by local infrastructure, water availability, and ecological conditions.
In regard to manned converter stations, Powered Eco-type Sewage Treatment Units and Powered Underground Units perform best in southern and eastern China due to their advanced infrastructure and higher treatment demands. In contrast, Septic Tanks remain the least effective solution, particularly in northwest and northeast regions, where water scarcity and extreme climates pose challenges to efficient wastewater treatment.
In regard to unmanned converter stations, Powered Eco-type Units (score: 0.659) dominate in east and south China, where automation and minimal human oversight are crucial. Similarly, Powered Underground Units also perform well in regions with moderate infrastructure, but Septic Tanks underperform across all the regions, particularly in remote areas.
In regard to pumped storage power stations, the AAO+MBR and Multi-stage A/O processes are most suitable in southern and eastern China, with high scores due to their efficiency in terms of nutrient removal and their adaptability. Septic Tanks consistently have the lowest scores, confirming their inadequacy for modern sewage treatment needs.
In conclusion, advanced treatment technologies like AAO+MBR and Multi-stage A/O processes are optimal for regions with a high level of industrialization and high water reuse demand, while Septic Tanks should be replaced with more effective systems, especially in remote and water-scarce regions.


