
Scoring and Ranking Methods for Evaluating the Techno-Economic Competitiveness of Hydrogen Production Technologies


Abstract
1. Introduction
1.1. Literature Review
- Knowledge gaps identified from the literature and addressed in this research
- (1)
- Lack of use of multi-criteria decision analysis (MCDA) tools—The reviewed literature primarily focuses on the TEA, LCA, and LCIA of various H2 production technologies. However, it lacks discussion on the use of structured MCDA tools like the MACBETH and Pugh methods, which are essential for comprehensive evaluations of H2 production technologies.
- (2)
- Absence of a robust and comparative framework—Most published studies focused on specific H2 production technologies or comparisons among a few alternatives. Accordingly, there is a lack clear of a robust framework for evaluating and comparing multiple H2 production pathways using a consistent set of decision criteria.
- (3)
- Combining qualitative judgments with quantitative approaches—The published studies primarily relied on quantitative metrics and overlooked the importance of integrating qualitative judgments of subject matter experts (SMEs) in the evaluation process.
- (4)
- Simultaneous evaluation of a comprehensive set of decision criteria—While various criteria like CAPEX, OPEX, environmental impacts (EIs), and operating efficiency are discussed in the literature, they are often evaluated in isolation rather than simultaneously.
- Research novelty
- Bridging knowledge gaps—This research addresses existing gaps in the published literature by uniquely employing both the MACBETH and Pugh methods, offering a structured and innovative approach to scoring and ranking H2 production technologies while considering multiple decision criteria simultaneously.
- Establishing a robust technology evaluation framework—By simultaneously utilizing the MACBETH and Pugh methods, this research establishes a robust framework for the comparative evaluation of various H2 production technologies, which are all based on a comprehensive set of decision criteria.
- Nuanced insights with MACBETH—The MACBETH method provides nuanced insights that purely quantitative methods might miss, involving pairwise comparisons among H2 production technologies. It employs a mix of qualitative judgments and quantitative scores. Additionally, the MACBETH tool includes internal functions for consistency checks, ensuring the robustness of the scoring and ranking results.
- Leveraging the Pugh method’s strengths—This research harnesses the unique strengths of the Pugh method, using the same decision criteria as in the MACBETH method. Instead of pairwise technology comparisons, the Pugh method benchmarks each technology against a baseline technology (SMR with CCS). By incorporating the Pugh matrix, this research evaluates the competitive positioning of emerging H2 technologies.
- Holistic approach—This research evaluates each H2 production technology using a comprehensive set of nine decision criteria, ensuring a holistic approach that takes into account various dimensions of performance and sustainability.
- By integrating the unique features of both the MACBETH and Pugh methods, this research produces more robust and reliable evaluations of H2 production technologies, thereby making a meaningful contribution to the knowledge base of this field.
1.2. Research Objectives
2. Research Method
2.1. MACBETH Scoring and Ranking Method
- Decision criteria identification and definitions relevant to the intended evaluation.
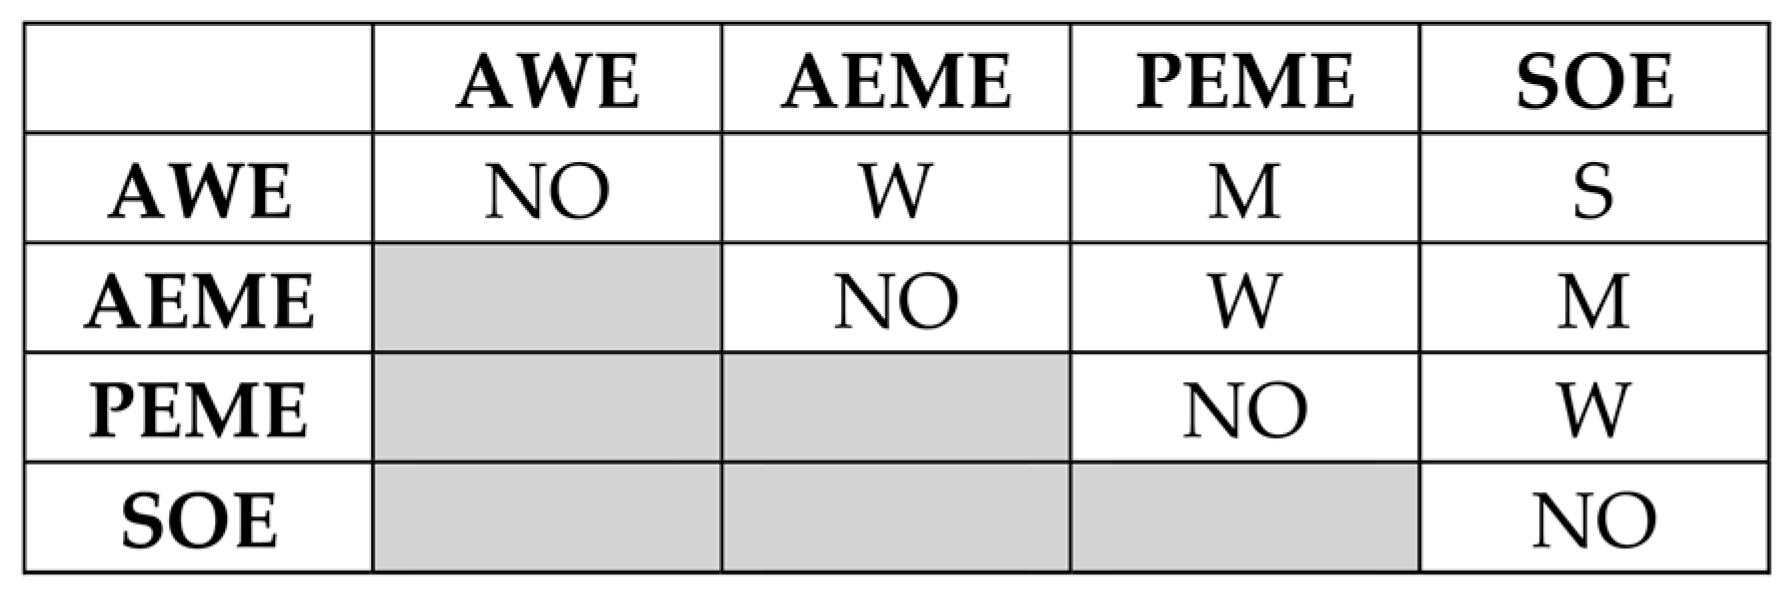
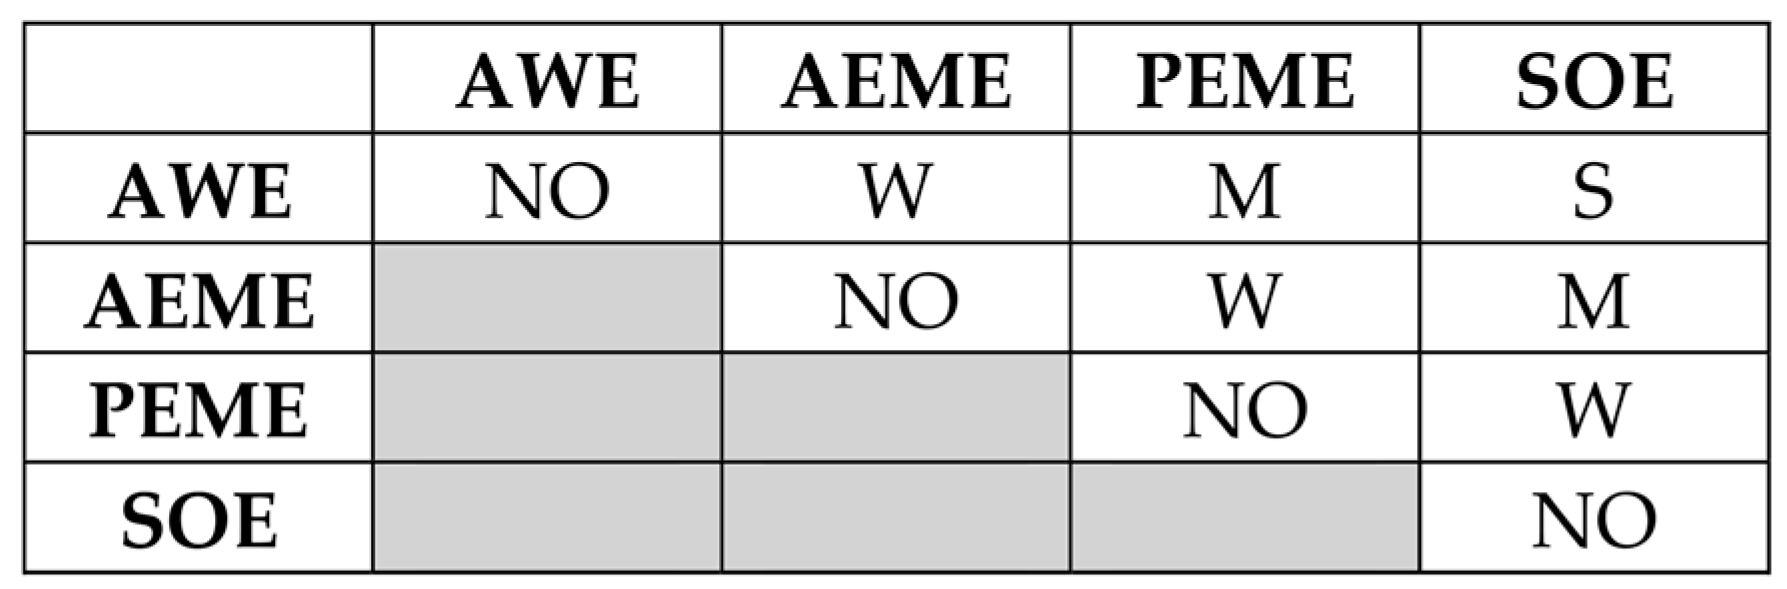
- Pairwise comparisons of the alternatives with respect to each criterion to determine the relative attractiveness (no, very weak, weak, moderate, strong, very strong, and extreme).
- Consistency checking to ensure that the qualitative judgments are consistent across all pairwise comparisons. This feature is internal in M-MACBETH software.
- Scores calculations which convert the qualitative judgments into a numerical scale to rank the alternatives. This feature is internal in M-MACBETH software.
2.2. The Pugh Decision Matrix Scoring and Ranking Method
- Selection of baseline technology: choosing a reference technology against which all other alternatives will be compared.
- Decision criteria definition: identifying and defining decision criteria relevant to the evaluation.
- Scoring: evaluating each alternative against the baseline for each criterion using a three-point scoring scale: −1 for worse than baseline, 0 for same as baseline, +1 for better than the baseline.
- Summation: algebraically summing the scores to determine and rank the overall performance of each alternative relative to the baseline.
2.3. MACBETH Method vs. Pugh Decision Matrix
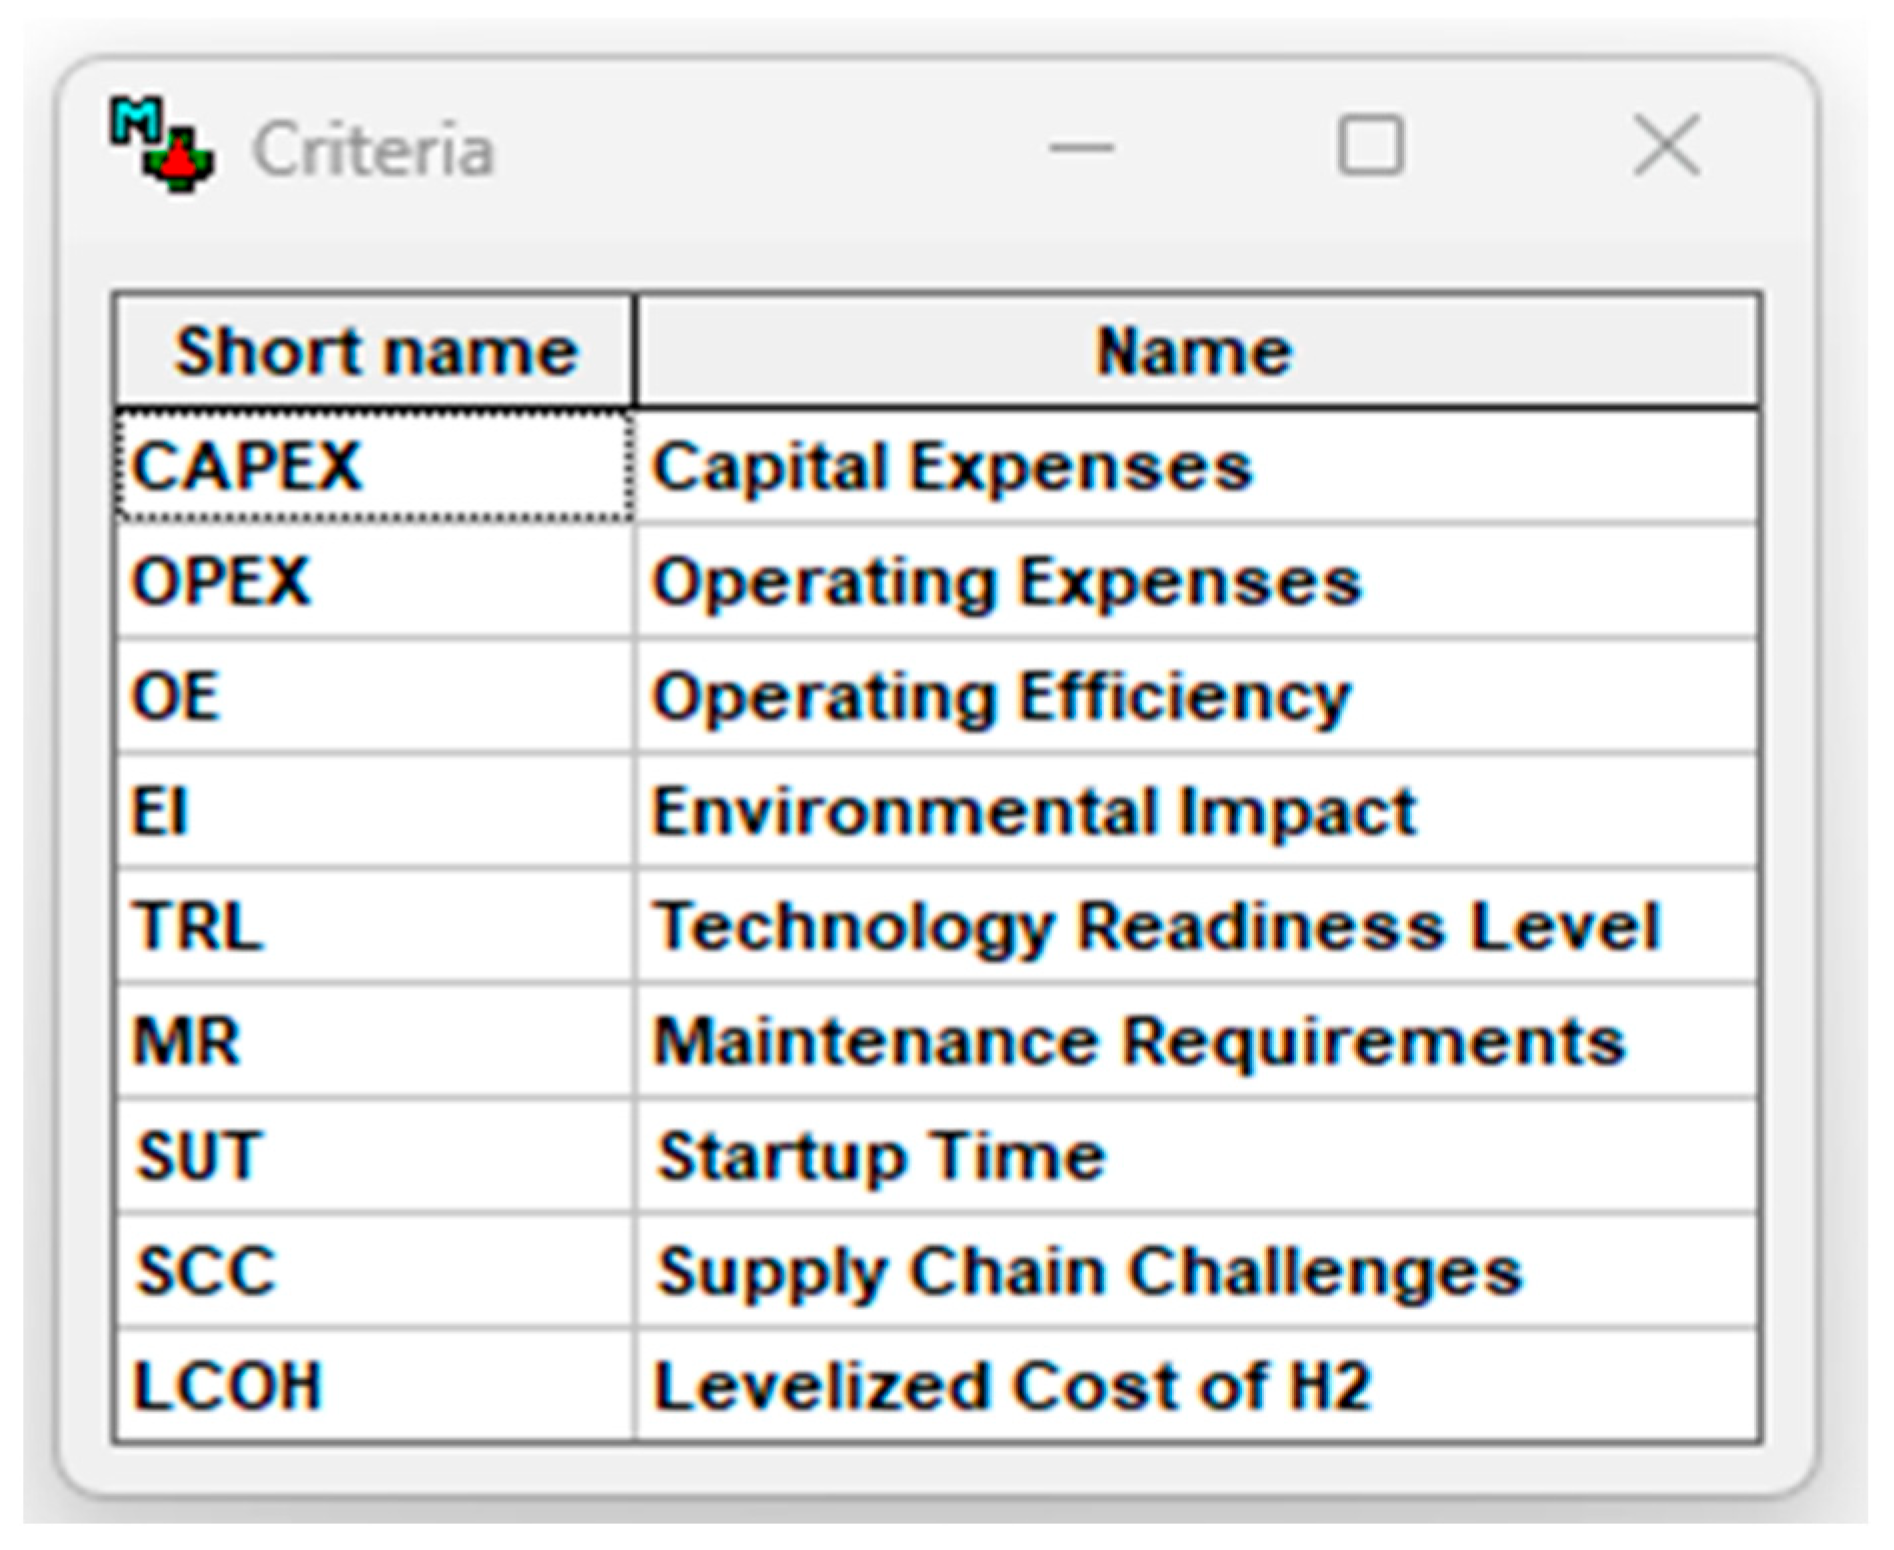
2.4. Multidimensional Decision Criteria
- Capital expenditure (CAPEX);
- Operating expenditure (OPEX);
- System operating efficiency (OE);
- System startup time (SuT);
- Environmental impact (EI);
- Technology readiness level (TRL);
- Maintenance requirements (MRs);
- Supply chain challenges (SCCs);
- Levelized cost of hydrogen (LCOH).
2.5. Rationale for Baseline Technology (SMR + CCS) Selection in Pugh Method
- Technology Readiness Level—(TRL)—SME with CCS is a well-established and widely used technology for H2 production. Additionally, it has been extensively studied, thus providing a reliable reference point for comparing other H2 production technologies [39].
- Performance metrics—SMR with CCS is considered a conventional technology with well-documented performance metrics, including capital expenditure (CAPEX), operating expenditure (OPEX), carbon footprint, and overall efficiency. These characteristics make it an appropriate choice benchmarking purpose [39].
2.6. Renewable Electricity (RE) Sources
3. Results
3.1. MACBETH Scoring and Ranking of H2 Production Technology Alternatives
3.2. Pugh’s Decision Matrix for Scoring and Ranking H2 Production Technology Alternatives
- 0: Baseline (namely SMR with CCS);
- +1: Better than the baseline;
- −1: Worse than the baseline.
- Capital expenditure (CAPEX):
- AWE: +1 (lower capital costs);
- AEME: +1 (lower capital costs);
- PEME: −1 (higher capital costs);
- SOE: −1 (highest capital costs);
- SMR with CCS: 0 (baseline technology).
- Operating expenditure (OPEX):
- AWE: +1 (moderate operating costs);
- AEME: +1 (moderate operating costs);
- PEME: −1 (higher operating costs);
- SOE: −1 (highest operating costs);
- SMR with CCS: 0 (baseline technology).
- Operating Efficiency (OE):
- AWE: 0 (comparable to baseline);
- AEME: +1 (potentially better as a new technology);
- PEME: +1 (higher efficiency);
- SOE: +1 (highest efficiency);
- SMR with CCS: 0 (baseline technology).
- Environmental Impact (EI):
- AWE: +1 (lower environmental impact particularly when driven by renewable electricity);
- AEME: +1 (lower environmental impact with renewables);
- PEME: +1 (lower environmental impact with renewables);
- SOE: +1 (lowest environmental impact with renewables);
- SMR with CCS: 0 (baseline technology).
- Technology Readiness Level (TRL):
- AWE: +1 (high TRL);
- AEME: 0 (moderate TRL, emerging technology);
- PEME: +1 (high TRL);
- SOE: −1 (lower TRL, developing technology);
- SMR with CCS: 0 (baseline technology).
- Maintenance Requirements (MRs):
- AWE: 0 (moderate);
- AEME: 0 (moderate but evolving);
- PEME: −1 (higher maintenance);
- SOE: −1 (highest maintenance);
- SMR with CCS: 0 (baseline technology).
- Startup Time (SuT):
- AWE: −1 (longer startup);
- AEME: −1 (longer startup);
- PEME: +1 (fast startup);
- SOE: −1 (long startup);
- SMR with CCS: 0 (baseline technology).
- Supply Chain Challenges (SCCs):
- AWE: +1 (non-previous metals, fewer challenges);
- AEME: 0 (moderate challenges, evolving);
- PEME: −1 (precious metals, higher challenges);
- SOE: −1 (advanced ceramics, highest challenges);
- SMR with CCS: 0 (baseline technology).
- Levelized Cost of H2 (LCOH) Production:
- AWE: +1 (lower LCOH);
- AEME: +1 (lower LCOH);
- PEME: −1 (higher LCOH);
- SOE: −1 (highest LCOH);
- SMR with CCS: 0 (baseline technology).
- Insights from Pugh’s decision matrix results:
- AWE:
- Total score: +5
- Conclusion: AWE emerges as the most promising technology compared to the baseline technology (viz., SMR with CCS) with distinguished advantages in CAPEX, OPEX, EI, TRL, SCC, and LCOH production. The stack SuT is less favorable for this technology.
- AEME:
- Total score: +4
- Conclusion: AEME shows favorable performance, especially in CAPEX, OPEX, EI, and LCOH production, but it has some emerging challenges in TRL, SuT, and SCC.
- PEME:
- Total score: −1
- Conclusion: PEME has strengths in OE, EI, and SuT but faces high costs, maintenance requirements issues, and supply chain challenges.
- SOE:
- Total score: −5
- Conclusion: SOE has high operating efficiency (OE) and low environmental impact (EI) but is currently disadvantaged by high CAPEX, OPEX, TRL, maintenance requirements (MRs), and supply chain challenges (SCCs).
4. Discussion
- Additional key insights
- Alignment and divergence of MACBETH and Pugh scoring and ranking methods
- Alignment:
- Multi-criteria decision analysis (MCDA):
- -
- Both the MACBETH and Pugh methods utilize multi-criteria decision analysis to evaluate alternative H2 production pathways. They systematically compare multiple alternatives against a set of decision criteria, facilitating a holistic evaluation process.
- -
- Decision criteria in both methods can include aspects such as operating efficiency, cost, environmental impact, and scalability, ensuring comprehensive assessments of the technologies.
- Structured comparison framework:
- -
- Both methods provide structured and transparent frameworks for decision making. They enable the careful documentation of judgments and preferences, making it easier to understand and justify the final selection of technologies.
- -
- This structured approach helps with identifying the strengths and weaknesses of each technology, guiding stakeholders in making informed decisions.
- Divergence:
- Qualitative vs. quantitative judgments:
- -
- MACBETH Method: Primarily relies on qualitative pairwise comparisons that are converted into numerical values via the MACBETH software. This method emphasizes the relative attractiveness of alternatives based on subjective judgments, which are then validated and quantified.
- -
- Pugh Method: Uses a different ranking and scoring system where alternatives are compared to a baseline technology. The scoring system typically involves assigning values such as +1, 0, or −1 based on whether the alternative is better, the same, or worse than the baseline, respectively.
- Weighting of criteria and sensitivity analysis:
- -
- MACBETH Method: Involves detailed analysis of weights for each decision criterion. To eliminate this source of subjectivity on the final rankings, we used equal weights for the different decision criteria. In our future research, we plan to perform sensitivity analysis to understand the impact of varying weights on the final rankings.
- -
- Pugh Method: The use of weighting factors is optional, and the primary focus is on direct comparisons to the baseline technology.
- Implications for selecting hydrogen production pathways
5. Conclusions
- Influence on policy, investment, and technology adoption:
- Policy influence:
- -
- Guiding strategic initiatives: The insights garnered from the evaluations of this research can inform government policies aimed at promoting sustainable H2 production. By identifying and validating the most promising technologies, policymakers can allocate resources and incentives more effectively.
- -
- Setting standards and regulations: The detailed analysis of this research can help set standards and regulations for H2 production technologies, ensuring that they meet desired efficiency, cost, and environmental benchmarks. This aligns with global decarbonization goals, such as those outlined in the Paris Agreement.
- Investment decisions:
- -
- Prioritizing funding: Investors can use our research findings to prioritize funding for technologies that show the highest potential for scalability as well as reassurance about long-term viability and returns on investment.
- -
- Risk management: Investors can better manage risks associated with funding new and emerging H2 production techniques.
- Technology adoption at scale:
- -
- Commercialization strategies: The evaluative methods employed in this research can highlight pathways for reducing costs and improving operational efficiencies, aiding in the development of commercialization strategies for promising H2 production technologies. This is crucial for achieving economies of scale.
- -
- Meeting quantitative targets: Incorporating specific trends and targets, such as those set by the International Energy Agency (IEA) and the U.S. Department of Energy (DOE), can provide quantifiable goals for technology adoption. For example, the IEA’s Hydrogen Technology Roadmap aims to reduce the cost of clean hydrogen to USD 2/kg by 2030. These targets can guide focus areas for R&D and deployment efforts. Also, the U.S. DOE aims for H2 production cost of USD 1/kg by 2030.
- Future Outlook:
- Specific trends:
- -
- Increasing emphasis on decarbonization and integration with renewable energy sources is expected.
- -
- Innovations in materials used for electrolysis, such as catalysts and membrane technologies, will drive efficiency improvement and cost reduction.
- Projected cost evolution:
- -
- The cost trajectory for various H2 production pathways including water electrolysis is expected to see significant cost reductions and performance improvements as these technologies scale and mature. For more detailed strategies on reducing electrolyzer costs at both the stack and system levels, as well as the pathway to scaling up green H2 technologies, interested readers are referred to the IRENA 2020 report [9].
- For electrolyzers cost trajectories:
- In its 2024 hydrogen shot water electrolysis technology assessment report, the DOE discussed the cost trajectory of each electrolyzer type as follows:
- For AWE
- Current Costs: The CAPEX for AWE electrolyzers ranges from USD 500/kW to USD 750/kW.
- Cost reduction strategies: Potential reductions can be achieved by enhancing system performance and efficiency while maintaining durability.
- For PEME
- Current Costs: The CAPEX of PEM electrolyzer systems is estimated to be USD 700 to USD 1100/kW based on current manufacturing volumes. Achieving the DOE target of USD 1/kg-H2 requires capital cost reductions to ≈USD 150/kW.
- Cost Reduction Opportunities: Key approaches include reducing precious metal catalyst loading, developing thinner membranes, manufacturing at scale, and optimizing BOP components, particularly power electronics.
- For AEME
- Though still at a lower technology readiness level (TRL), AEME electrolyzers show potential for low-cost H2 production due to the use of non-precious-metal catalysts and inexpensive components. Preliminary estimates suggest that AEME stacks could achieve costs as low as USD 200/kW with higher manufacturing volumes.
- R&D Needs: Focus on developing durable membranes and ionomers, optimizing electrolyte feed configurations, and improving the overall stability and performance of the stacks.
- For SOE
- Current CAPEX is estimated at USD 2000 to USD 2500/kW, which could be reduced to about USD 950/kW when achieving manufacturing scales of 1 GW per year.
- These electrolyzers benefit from high efficiencies enabled by high operating temperatures, but improvements in stack durability, integration with heat sources, and system designs are needed for cost reduction.
- EU hydrogen strategy
- Similar to the U.S. DOE goals for clean H2 production via water electrolysis, the EU’s H2 strategy lays out the European Commission’s vision vis-à-vis H2 and its role as an energy carrier in a European-integrated energy system.
- Under this EU strategy, (a) renewable H2 technologies should reach maturity and be deployed at large scales to reach all hard-to-decarbonize sectors where other alternatives might not be feasible or have higher costs, and (b) about 25% of the EU’s renewable electricity production will be used for H2 production, which in turn would account for about 23% of the EU’s 2050 energy mix.
- Other insights
- As renewable electricity (RE) costs continue to decrease and electrolyzer technologies become more operationally efficient and cost-effective, renewable H2 production via water electrolysis (WE) is expected to become economically competitive with steam methane reforming (SMR) integrated with carbon capture and storage (CCS).
- Hydrogen production from sustainable sources, such as water electrolysis powered by renewable electricity, offers significant environmental benefits and aligns with global decarbonization and net-zero goals.
Funding
Institutional Review Board Statement
Informed Consent Statement
Data Availability Statement
Acknowledgments
Conflicts of Interest
Abbreviations
| AEME | anion exchange membrane electrolyzer |
| APR | aqueous-phase reforming |
| ATR | autothermal reforming |
| AWE | alkaline water electrolyzer |
| BoP | balance of plant |
| CAPEX | capital expenditure |
| CCS | carbon capture and storage |
| CCUS | carbon capture, utilization, and storage |
| Cu-Cl | copper–chlorine |
| GWP | global warming potential |
| LCA | life cycle assessment |
| LCOH | levelized cost of hydrogen |
| NG | natural gas |
| O&M | operating and maintenance |
| OPEX | operating expenditure |
| PEME | proton exchange membrane electrolyzer |
| PGMs | platinum group metals |
| PV | photovoltaic |
| SCWR | super-critical water reforming |
| SMR | steam-methane reforming |
| SOE | solid oxide electrolyzer |
| TEA | techno-economic analysis |
| TRL | technology readiness level |
| WE | water electrolysis |
References
- Ivy, J. Summary of Electrolytic Hydrogen Production; NREL Report NREL/MP-560-36734; NREL: Golden, CO, USA, 2004; pp. 1–27. [Google Scholar]
- Zeng, K.; Zhang, D. Recent progress in alkaline water electrolysis for hydrogen production and applications. Prog. Energy Combust. Sci. 2010, 36, 307–326. [Google Scholar] [CrossRef]
- Dufour, J.; Serrano, D.P.; Gálvez, J.L.; Moreno, J.; González, A. Hydrogen production from fossil fuels: Life cycle assessment of technologies with low greenhouse gas emissions. Energy Fuels 2011, 25, 2194–2202. [Google Scholar] [CrossRef]
- Braga, L.B.; Silveira, J.L.; da Silva, M.E.; Tuna, C.E.; Machin, E.B.; Pedroso, D.T. Hydrogen production by biogas steam reforming: A technical, economic, and, ecological analysis. Renew. Sustain. Energy Rev. 2013, 28, 166–173. [Google Scholar] [CrossRef]
- Khalil, Y.F. Strengths, Weaknesses, Opportunities, and Threats (SWOT) Analysis of Fission Nuclear Power for Electricity Generation; Distinguished Scholar Seminar Series Koç University: Istanbul, Turkey, 2016. [Google Scholar] [CrossRef]
- Hinkley, J.; Hayward, J.; McNaughton, R.; Gillespie, R.; Matsumoto, A.; Watt, M.; Lovegrove, K. Cost Assessment of Hydrogen Production from PV and Electrolysis; Report to ARENA as part of Solar Fuels Roadmap, Project A-3018; Commonwealth Scientific and Industrial Research Organization, CSIRO: Canberra, Australia, 2016; pp. 1–44. Available online: https://arena.gov.au/assets/2016/05/Assessment-of-the-cost-of-hydrogen-from-PV.pdf (accessed on 6 June 2025).
- Kuchshinrichs, W.; Ketelaer, T.; Koj, J.C. Economic analysis of improved alkaline water electrolysis. Front. Energy Res. 2017, 5, 1. [Google Scholar] [CrossRef]
- Parkinson, B.; Tabatabaei, M.; Upham, D.C.; Ballinger, B.; Greig, C.; Smart, S.; McFarland, E. Hydrogen production using methane: Techno-economics of decarbonizing fuels and chemicals. Int. J. Hydrogen Energy 2018, 43, 2540–2555. [Google Scholar] [CrossRef]
- IRENA. Green Hydrogen Cost Reduction; IRENA Report; International Renewable Energy Agency: Abu Dhabi, United Arab Emirates, 2020; pp. 1–126. ISBN 978-92-9260-295-6. Available online: https://www.irena.org/-/media/Files/IRENA/Agency/Publication/2020/Dec/IRENA_Green_hydrogen_cost_2020.pdf (accessed on 10 March 2025).
- Khalil, Y.F. Simulation-based environmental-impact assessment of glycerol-to-hydrogen conversion technologies. Clean Energy 2021, 5, 387–402. [Google Scholar] [CrossRef]
- James, B.D.; Huya-Kouadio, J.; Acevedo, Y.; McNamara, K. Liquid Alkaline Electrolysis Techno-Economic Review; Presentation to: US DOE “Experts Meeting on Advanced Liquid Alkaline Water Electrolysis”; Strategic Analysis Inc.: Arlington, VA, USA, 2021; pp. 1–33. Available online: https://www.energy.gov/sites/default/files/2022-02/7-TEA-Liquid%20Alkaline%20Workshop.pdf (accessed on 3 February 2025).
- Badgett, A.; Ruth, M.; James, B.; Pivovar, B. Methods identifying cost reduction potential for water electrolysis systems. Curr. Opin. Chem. Eng. 2021, 33, 100714. [Google Scholar] [CrossRef]
- Nasser, M.; Megahed, T.F.; Ookawara, S.; Hassan, H. A review of water electrolysis–based systems for hydrogen production using hybrid/solar/wind energy systems. Environ. Sci. Pollut. Res. 2022, 29, 86994–87018. [Google Scholar] [CrossRef]
- Kumar, S.S.; Lim, H. An overview of water electrolysis technologies for green hydrogen production. Energy Rep. 2022, 8, 13793–13813. [Google Scholar] [CrossRef]
- Reksten, A.H.; Thomassen, M.S.; Møller-Holst, S.; Sundseth, K. Projecting the future cost of PEM and alkaline water electrolyzers; a CAPEX model including electrolyzer plant size and technology development. Int. J. Hydrogen Energy 2022, 47, 38106–38113. [Google Scholar] [CrossRef]
- Sharma, M.; Pramanik, A.; Bhowmick, G.D.; Tripathi, A.; Ghangrekar, M.M.; Pandey, C.; Kim, B.-S. Premier, progress and prospects in renewable hydrogen generation: A review. Fermentation 2023, 9, 537. [Google Scholar] [CrossRef]
- Acevedo, Y.M.; Prosser, J.H.; Huya-Kouadio, J.M.; McNamara, K.R.; James, B.D. Hydrogen Production Cost with Alkaline Electrolysis; Strategic Analysis, Inc.: Arlington, VA, USA, 2023; pp. 1–34. [Google Scholar] [CrossRef]
- Krishnan, S.; Koning, V.; de Groot, M.T.; de Groot, A.; Mendoza, P.G.; Junginger, M.; Kramer, G.J. Present and future cost of alkaline and PEM electrolyzer stacks. Int. J. Hydrogen Energy 2023, 48, 32313–32330. [Google Scholar] [CrossRef]
- Ajeeb, W.; Baptista, P.; Neto, R.C. Life cycle analysis of hydrogen production by different alkaline electrolyzer technologies sourced with renewable energy. Energy Convers. Manag. 2024, 316, 118840. [Google Scholar] [CrossRef]
- Cammann, L.; Perera, A.; Alstad, V.; Jäschke, J. Design and operational analysis of an alkaline water electrolysis plant powered by wind energy. Int. J. Hydrogen Energy 2024, 93, 963–974. [Google Scholar] [CrossRef]
- Song, H.; Kim, Y.; Yang, H. Design and optimization of an alkaline electrolysis system for small-scale hydropower integration. Energies 2024, 17, 20. [Google Scholar] [CrossRef]
- Dannappel, L.M.; Cammann, L.; Zong, Y.; Jaschke, J. Efficient green hydrogen production from wind power: A system design perspective regarding optimal operating pressure for alkaline electrolyzers. In Proceedings of the 13th International Conference on Renewable Energy Research and Applications (ICRERA), Nagasaki, Japan, 9–13 November 2024; IEEE: Piscataway, NJ, USA, 2024; pp. 124–129. [Google Scholar] [CrossRef]
- Emam, A.; Hamdan, M.O.; Abu-Nabah, B.; Elnajjar, E. Electrolyzers parameters impacting alkaline water electrolysis hydrogen production. In Proceedings of the 2024 7th International Conference on Electrical Engineering and Green Energy, Los Angeles, CA, USA, 28 June–1 July 2024; IEEE: Piscataway, NJ, USA, 2024; pp. 1–5. [Google Scholar]
- Krishnan, S.; Corona, B.; Kramer, G.J.; Junginger, M.; Koning, V. Prospective LCA of alkaline and PEM electrolyzer systems. Int. J. Hydrogen Energy 2024, 55, 26–41. [Google Scholar] [CrossRef]
- Khalil, Y.F. A comparative science-based viability assessment among current and emerging hydrogen production technologies. Appl. Sci. 2025, 15, 497. [Google Scholar] [CrossRef]
- Sukur, F.A.; Akgun, K.; Ozkaya, B. AHP-driven analysis of hydrogen production technologies and their role in Türkiye’s energy trilemma index. Int. J. Hydrogen Energy 2025, 144, 773–781. [Google Scholar] [CrossRef]
- Kadam, R.S.; Sutar, P.R.; Yadav, G.D. Energy and environmental assessment of industrial-scale hydrogen production: Comparison of steam methane reforming, electrolysis, and Cu–Cl cycles. Int. J. Hydrogen Energy 2025, 106, 994–1005. [Google Scholar] [CrossRef]
- Nemeth, P.; Zseni, A.; Torma, A. Multidimensional comparison of life cycle footprint of hydrogen production technologies. Clean. Eng. Technol. 2025, 24, 100902. [Google Scholar] [CrossRef]
- Hoppe, A.C.; Minke, C. Reducing environmental impacts of water electrolysis systems by reuse and recycling: Life cycle assessment of a 5 MW alkaline water electrolysis plant. Energies 2025, 18, 796. [Google Scholar] [CrossRef]
- Kafle, S.; Sapkota, S.; Higgins, B.T.; Adhikari, S. Research trends in life cycle assessment of hydrogen production: Methodological review on thermochemical conversion processes. Int. J. Hydrogen Energy 2025, 106, 432–443. [Google Scholar] [CrossRef]
- Qureshi, F.; Asif, M.; Khan, A.; Husain, A.; Aldawsari, H.; Yusuf, M.; Verma, S.K.; Khan, M.Y. Sustainable energy prospects: Advancements in green hydrogen production through proton exchange membrane water electrolysis. Int. J. Hydrogen Energy 2025, 141, 954–978. [Google Scholar] [CrossRef]
- Reznicek, E.P.; Koleva, M.N.; King, J.; Kotarbinski, M.; Grant, E.; Vijayshankar, S.; Brunik, K.; Thomas, J.; Gupta, A.; Hammond, S.; et al. Techno-economic analysis of low-carbon hydrogen production pathways for decarbonizing steel and ammonia production. Cell Rep. Sustain. 2025, 2, 100338. [Google Scholar] [CrossRef]
- Zhua, Y.; Keoleian, G.A.; Cooper, D.R. The role of hydrogen in decarbonizing U.S. industry: A review. Renew. Sustain. Energy Rev. 2025, 214, 115392. [Google Scholar] [CrossRef]
- Waiyaki, P.; Thekkethil, R.; Ananthakumar, M.; Seshadri, S. How Green Is Green Hydrogen? A Life-Cycle and Critical Raw Material Analysis of Green Hydrogen Production via PEMW Electrolyzers in India; Energy & Fuels; ACS Publications: Washington, DC, USA, 2025; pp. 1–16. [Google Scholar] [CrossRef]
- Ajeeb, W.; Costa Neto, R.; Patrícia Baptista, P. Comparative Life Cycle Analysis of Electrolysis Hydrogen Production from Diverse Green Energy Sources; Technological Advancements and Future Directions in Green Energy, Selected Papers from ICGET 2024; Springer: Cham, Switzerland, 2025; pp. 49–62. [Google Scholar] [CrossRef]
- Yang, J.; Lam, T.Y.; Luo, Z.; Cheng, Q.; Wang, G.; Yao, H. Renewable energy driven electrolysis of water for hydrogen production, storage, and transportation. Renew. Sustain. Energy Rev. 2025, 218, 115804. [Google Scholar] [CrossRef]
- Bana e Costa, C.A.; de Corte, J.M.; Vansnick, J.C. MACBETH (Measuring Attractiveness by a Categorical Based Evaluation Technique) Scoring Method is a Multi-Criteria Decision Analysis (MCDA) Tool. M-MACBETH-User’s Guide. 2017. Available online: https://m-MACBETH.com/ (accessed on 6 June 2025).
- Khalil, Y.F. Systematic Evaluation of Technology Pathways: Scoring and Ranking Using Pugh’s Decision Matrix; Chemical & Environmental Engineering, Yale University: New Haven, CT, USA, 2004; Available online: https://zenodo.org/records/15380303 (accessed on 6 June 2025).
- Zang, G.; Graham, E.J.; Mallapragada, D. H2 production through natural gas reforming and carbon capture: A techno-economic and life cycle analysis comparison. Int. J. Hydrogen Energy 2024, 49 Pt A, 1288–1303. [Google Scholar] [CrossRef]


| Water Electrolysis (WE) Technology | Description |
|---|---|
| Alkaline water electrolysis (AWE) | AWE is one of the most established and widely researched technologies for H2 production. It operates using a liquid alkaline electrolyte, typically potassium hydroxide (KOH) or sodium hydroxide (NaOH). Studies highlight its advantages, including mature technology, robustness, and relatively low capital costs. However, challenges persist with regard to operating efficiency and the need for pressure control to prevent gas crossover. |
| Anion exchange membrane electrolysis (AEME) | AEME represents a newer approach, combining elements of both AWE and PEME. It utilizes an anion exchange membrane to transfer hydroxide ions. Research suggests that AEME has the potential to offer cost benefits and simpler materials handling compared to PEME. However, the technology is less mature, and further development is needed to enhance its stability, efficiency, and long-term reliability. |
| Proton exchange membrane electrolysis (PEME) | PEME, another well-studied WE technology, employs a solid polymer electrolyte (SPE) that conducts protons from the anode to the cathode. The literature notes PEME’s higher efficiency and quicker startup compared to AWE. Nevertheless, PEME systems face challenges related to high capital costs and the use of rare earth metals such as platinum group metals (PGMs) * for catalysts. |
| Solid oxide electrolysis (SOE) | SOE operates at high temperatures (typically 700–1000 °C), using a solid ceramic electrolyte to conduct oxygen ions. This high-temperature operation enables SOE to achieve higher efficiencies particularly when integrated with waste heat recovery systems. The literature points out that SOE is still in the developmental stage with significant research required to address material degradation and long-term operational reliability concerns. |
| Attribute | MACBETH Method | Pugh Decision Matrix |
|---|---|---|
| Methodology | Uses qualitative judgments of differences in attractiveness (namely: no; very weak; weak; moderate; strong; very strong; and extreme) of the pairwise alternatives comparisons. |
|
| Decision-Making Basis | Determines global attractiveness values to rank each of the technology alternatives. | Evaluates relative merit of alternatives compared to a baseline technology. |
| Scoring | Pairwise comparisons of attractiveness without the need for a baseline technology for benchmarking. | Direct comparison to a baseline for each decision criterion and alternative technology. |
| Weighting Factors |
| Optional weighting factors for the decision criteria to reflect their importance. |
| Ranking | Ranking is about ordering the evaluated technologies based on their calculated scores. | |
| CAPEX | OPEX | OE | EI | TRL | MR | SUT | SCC | LCOH |
|---|---|---|---|---|---|---|---|---|
| AWE | AWE | AWE | AWE | AWE | AWE | AWE | AWE | AWE |
| AEME | AEME | AEME | AEME | AEME | AEME | AEME | AEME | AEME |
| PEME | PEME | PEME | PEME | PEME | PEME | PEME | PEME | PEME |
| SOE | SOE | SOE | SOE | SOE | SOE | SOE | SOE | SOE |
| Criteria | AWE | AEME | PEME | SOE | Baseline (SMR with CCS) |
|---|---|---|---|---|---|
| Capital expenditure (CAPEX) | +1 | +1 | −1 | −1 | 0 |
| Operating expenditure (OPEX) | +1 | +1 | −1 | −1 | 0 |
| Operating efficiency (OE) | 0 | +1 | +1 | +1 | 0 |
| Environmental impact (EI) | +1 | +1 | +1 | +1 | 0 |
| Technology readiness level (TRL) | +1 | 0 | +1 | −1 | 0 |
| Maintenance requirements (MRs) | 0 | 0 | −1 | −1 | 0 |
| Startup Time (SuT) | −1 | −1 | +1 | −1 | 0 |
| Supply chain challenges (SCCs) | +1 | 0 | −1 | −1 | 0 |
| Levelized cost of H2 (LCOH) | +1 | +1 | −1 | −1 | 0 |
| Total score | +5 | +4 | −1 | −5 | 0 |
| Technology ranking | 1st (Most favorable) | 2nd | 3rd | 4th (Least favorable) | Baseline |
| Water Electrolysis (WE) Technology | CAPEX | Comments |
|---|---|---|
| Alkaline water electrolysis (AWE) | USD 400–900 per kW | Lower capital costs due to technology maturity and use of non-precious metal catalysts. |
| Anion exchange membrane electrolysis (AEME) | USD 500–1000 per kW | Higher capital costs than AWE, emerging technology with potential cost benefits as it matures. |
| Proton exchange membrane electrolysis (PEME) | USD 1000–2500 per kW | Higher capital costs due to use of expensive materials (e.g., platinum catalysts) and advanced membranes. |
| Solid oxide electrolysis (SOE) | USD 2000–4500 per kW | Highest capital costs, requires high-temperature materials and complex designs to accommodate stack heat removal and recovery. |
| Water Electrolysis (WE) Technology | OPEX | Comments |
|---|---|---|
| Alkaline water electrolysis (AWE) | Moderate | Low to moderate energy consumption, regular maintenance of electrodes and moderate O&M costs. |
| Anion exchange membrane electrolysis (AEME) | Moderate | Moderate energy consumption, membrane maintenance, moderate O&M costs, and potential for future costs reduction. |
| Proton exchange membrane electrolysis (PEME) | High | Low energy consumption due to higher operating efficiency, high costs of catalysts (previous metals) and membranes, frequent maintenance. |
| Solid oxide electrolysis (SOE) | Moderate to High | Low energy consumption due to higher operating efficiency, high-temperature material costs, frequent maintenance of high-temperature components. |
| Water Electrolysis (WE) Technology | OE | Comments |
|---|---|---|
| Alkaline water electrolysis (AWE) | 60–78% | Moderate OE limited by higher electrical/ohmic resistance and slower ion migration though the electrolyte (KOH solution). |
| Anion exchange membrane electrolysis (AEME) | 60–70% | Comparable to AWE, needs improvement in membrane stability. |
| Proton exchange membrane electrolysis (PEME) | 70–80% | Higher OE than AWE and AEME due to lower internal resistance and effective proton conductivity. |
| Solid oxide electrolysis (SOE) | 80–90% | Very high OE and faster reaction kinetics at high temperatures (700–1000 °C) but come with challenging material stability and shorter long-term reliability. |
| Water Electrolysis (WE) Technology | SuT | Comments |
|---|---|---|
| Alkaline water electrolysis (AWE) | Moderate (several minutes to an hour) | Requires time to reach the operating temperature (60–85 °C) and establish steady-state conditions. |
| Anion exchange membrane electrolysis (AEME) | Moderate to fast (a few minutes) | Quicker startup than AWE, benefiting from efficient anion exchange membranes. |
| Proton exchange membrane electrolysis (PEME) | Fast (less than a minute) | Rapid response due to the solid polymer electrolyte membrane; suitable for quick on-demand H2 production. |
| Solid oxide electrolysis (SOE) | Slow (several hours) | Requires time to reach high operating temperatures (700–1000 °C) to stabilize the solid oxide electrolyte. |
| Water Electrolysis (WE) Technology | EI | Comments |
|---|---|---|
| Alkaline water electrolysis (AWE) | Low to moderate | Moderate GHG emissions (but lower with renewable electricity), moderate resource depletion, significant water usage. |
| Anion exchange membrane electrolysis (AEME) | Low to moderate | Low to moderate GHG emissions, lower resource depletion, similar water usage to AWE. |
| Proton exchange membrane electrolysis (PEME) | Low (with renewables electricity), High with respect to extraction of rare-earth metals | Low GHG emissions (with renewables), high resource depletion (precious metals), moderate to low water usage. |
| Solid oxide electrolysis (SOE) | Very low (with renewable electricity), high with respect to resources | Very low GHG emissions (with renewable electricity), high resource depletion (advanced ceramics), lower water usage. |
| Water Electrolysis (WE) Technology | TRL | Comments |
|---|---|---|
| Alkaline water electrolysis (AWE) | 9 | Fully mature technology with widespread industrial application and continuous operation capabilities. |
| Anion exchange membrane electrolysis (AEME) | 4–6 | Emerging technology with ongoing development and demonstration projects, aiming for commercial readiness sometime in the future. |
| Proton exchange membrane electrolysis (PEME) | 7–8 | Advanced technology with potential for commercial applications, and ongoing cost reduction efforts. |
| Solid oxide electrolysis (SOE) | 4–6 | Early-stage technology with active R&D and initial pilot projects, requiring further validation and optimization for commercialization. |
| Water Electrolysis (WE) Technology | MR | Comments |
|---|---|---|
| Alkaline water electrolysis (AWE) | Low to moderate | Routine maintenance involves electrodes cleaning and or replacing electrodes if damaged. |
| Anion exchange membrane electrolysis (AEME) | Moderate | Regular checks and membrane replacements. Maintenance is moderate and improving with technology improvements. |
| Proton exchange membrane electrolysis (PEME) | High | Frequent monitoring and replacement of sensitive materials like membranes and catalysts. High MR due to material cost and sensitivity. |
| Solid oxide electrolysis (SOE) | High | Maintenance is critical due to high-temperature operation, frequent checks, and replacements of ceramic electrolytes and heating elements. |
| Electrolysis Technology | Supply Chain Challenges | Comments |
|---|---|---|
| Alkaline water electrolysis (AWE) | Low to moderate | Uses common and non-precious materials (such as nickel and stainless steel) and, hence, fewer supply chain challenges. |
| Anion exchange membrane electrolysis (AEME) | Moderate | Emerging technology with specialized membrane requirements; limited production volumes; moderate risk. |
| Proton exchange membrane electrolysis (PEME) | High | Highly reliant on precious metals such as platinum (Pt) and iridium (Ir); significant supply chain risks and cost volatility. |
| Solid oxide electrolysis (SOE) | High | Requires advanced ceramics * and precision manufacturing; expensive and challenging supply chain. |
| Water Electrolysis (WE) Technology | LCOH ** (USD/kg H2) | Comments |
|---|---|---|
| Alkaline water electrolysis (AWE) | USD 2.50–6.00 | Lower due to being a mature technology and less expensive non-precious materials such as nickel (Ni), steel, and aluminum (Al). |
| Anion exchange membrane electrolysis (AEME) | USD 3.00–7.50 | Higher due to being an emerging technology with specialized membranes, expected to decrease with scaling and maturity. |
| Proton exchange membrane electrolysis (PEME) | USD 3.50–8.50 | Higher due to use of expensive rare-earth metals like platinum (Pt) and Iridium (Ir) catalysts, improvements are ongoing for cost reduction. |
| Solid oxide electrolysis (SOE) | USD 4.00–9.50 | Highest due to high initial investment and complex ceramic materials. However, there is a potential for cost reductions with advancements in R&D. |
Disclaimer/Publisher’s Note: The statements, opinions and data contained in all publications are solely those of the individual author(s) and contributor(s) and not of MDPI and/or the editor(s). MDPI and/or the editor(s) disclaim responsibility for any injury to people or property resulting from any ideas, methods, instructions or products referred to in the content. |
© 2025 by the author. Licensee MDPI, Basel, Switzerland. This article is an open access article distributed under the terms and conditions of the Creative Commons Attribution (CC BY) license (https://creativecommons.org/licenses/by/4.0/).
Share and Cite
Khalil, Y.F. Scoring and Ranking Methods for Evaluating the Techno-Economic Competitiveness of Hydrogen Production Technologies. Sustainability 2025, 17, 5770. https://doi.org/10.3390/su17135770
Khalil YF. Scoring and Ranking Methods for Evaluating the Techno-Economic Competitiveness of Hydrogen Production Technologies. Sustainability. 2025; 17(13):5770. https://doi.org/10.3390/su17135770
Chicago/Turabian StyleKhalil, Yehia F. 2025. "Scoring and Ranking Methods for Evaluating the Techno-Economic Competitiveness of Hydrogen Production Technologies" Sustainability 17, no. 13: 5770. https://doi.org/10.3390/su17135770
APA StyleKhalil, Y. F. (2025). Scoring and Ranking Methods for Evaluating the Techno-Economic Competitiveness of Hydrogen Production Technologies. Sustainability, 17(13), 5770. https://doi.org/10.3390/su17135770