
Environmental Footprints of Red Wine Production in Piedmont, Italy


Abstract
1. Introduction
2. Materials and Methods
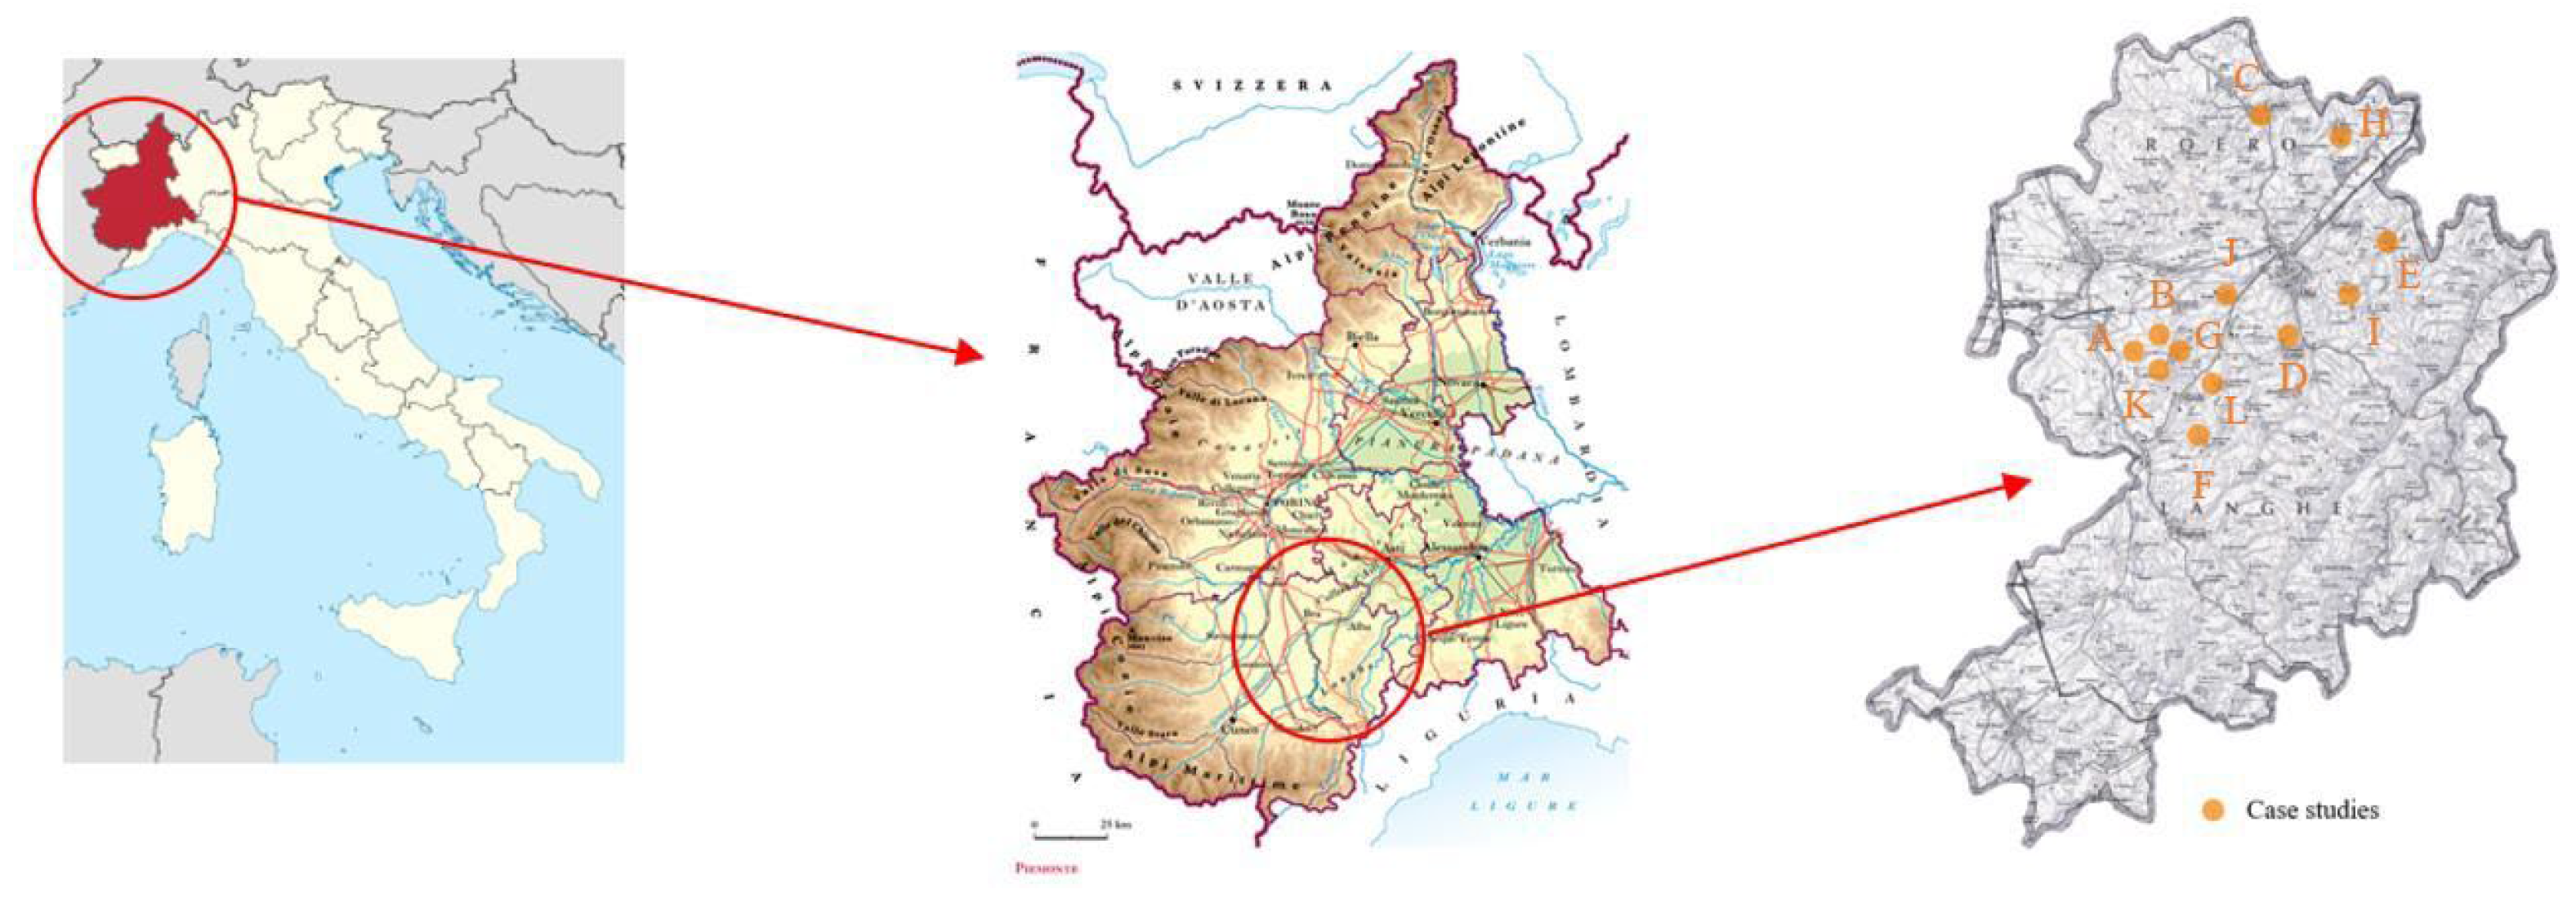
2.1. Description of Case Studies
2.2. Methodologies Applied
2.3. Sensitivity Analysis
3. Results
4. Discussions
Sensitivity Analysis
5. Conclusions
Author Contributions
Funding
Institutional Review Board Statement
Informed Consent Statement
Data Availability Statement
Conflicts of Interest
Abbreviations
| CAP | Common Agricultural Policy |
| UE | European Union |
| CF | Carbon Footprint |
| WF | Water Footprint |
| EF | Ecological Footprint |
| FU | Functional Unit |
| SQNPI | System of National Integrated Quality Production |
| OIV | International Organization of Vine and Wine |
| ISTAT | Italian Institute for Statistics |
| DOC | Controlled Designation of Origin |
| DOCG | Controlled and Guaranteed Designation of Origin |
| R | Review paper |
| SA | Scientific article |
Appendix A

| Case Study A | Quantity | Unit |
|---|---|---|
| Hectares cultivated | 22 | ha |
| Quantity of grapes harvested | 135,000 | kg |
| Number of bottles produced annually | 110,000 | - |
| Applied agricultural practice (organic/conventional) | organic | - |
| Quantity of copper oxide | 3.5 | kg/ha |
| Quantity of sulphides | 110 | kg/ha |
| Quantity of sulphur dioxide | 25 | kg |
| Quantity of nitrogen fertilisers applied | 8000 | kg |
| Weight of the glass bottle | 0.55 | kg |
| Weight of the bottle cap | 4.4 | g |
| Weight of the PVC capsule | na | g |
| Weight of the aluminum capsule | 3.3 | g |
| Weight of the label | 2 | g |
| Fuel used | 7281.2 | L |
| Electricity consumption | 44,100 | kWh |
| Number of pesticide applications | 9 | - |
| Average volume of water used for pesticide dilution | 36 | m3 |
| Water consumption in the cellar | 323.1 | m3 |
| Case Study B | Quantity | Unit |
| Hectares cultivated | 16 | ha |
| Quantity of grapes harvested | 128,500 | kg |
| Number of bottles produced annually | 120,000 | - |
| Applied agricultural practice (organic/conventional) | conventional | - |
| Quantity of copper oxide | 4.6 | kg/ha |
| Quantity of sulphides | 30.7 | kg/ha |
| Quantity of sulphur dioxide | 71 | kg |
| Quantity of nitrogen fertilisers applied | 0.48 | kg |
| Weight of the glass bottle | 0.45 | kg |
| Weight of the bottle cap | 4.4 | g |
| Weight of the PVC capsule | na | g |
| Weight of the aluminum capsule | 3.3 | g |
| Weight of the label | 2 | g |
| Fuel used | 5100 | L |
| Electricity consumption | 28,594 | kWh |
| Number of pesticide applications | 14 | - |
| Average volume of water used for pesticide dilution | 1.9 | m3 |
| Water consumption in the cellar | 28.4 | m3 |
| Case Study C | Quantity | Unit |
| Hectares cultivated | 16 | ha |
| Quantity of grapes harvested | 128,500 | kg |
| Number of bottles produced annually | 120,000 | - |
| Applied agricultural practice (organic/conventional) | conventional | - |
| Quantity of copper oxide | 4.6 | kg/ha |
| Quantity of sulphides | 30.7 | kg/ha |
| Quantity of sulphur dioxide | 71 | kg |
| Quantity of nitrogen fertilisers applied | 0.48 | kg |
| Weight of the glass bottle | 0.45 | kg |
| Weight of the bottle cap | 4.4 | g |
| Weight of the PVC capsule | na | g |
| Weight of the aluminum capsule | 3.3 | g |
| Weight of the label | 2 | g |
| Fuel used | 5100 | L |
| Electricity consumption | 28,594 | kWh |
| Number of pesticide applications | na | - |
| Average volume of water used for pesticide dilution | 105 | m3 |
| Water consumption in the cellar | 1100 | m3 |
| Case Study D | Quantity | Unit |
| Hectares cultivated | 5 | ha |
| Quantity of grapes harvested | 30,000 | kg |
| Number of bottles produced annually | 28,000 | - |
| Applied agricultural practice (organic/conventional) | conventional | - |
| Quantity of copper oxide | 5 | kg/ha |
| Quantity of sulphides | 50 | kg/ha |
| Quantity of sulphur dioxide | 15 | kg |
| Quantity of nitrogen fertilisers applied | 1.25 | kg |
| Weight of the glass bottle | 0.45 | kg |
| Weight of the bottle cap | 4.4 | g |
| Weight of the PVC capsule | 3.3 | g |
| Weight of the aluminum capsule | no | g |
| Weight of the label | 2 | g |
| Fuel used | 1600 | L |
| Electricity consumption | 9000 | kWh |
| Number of pesticide applications | 2 | - |
| Average volume of water used for pesticide dilution | 0.4 | m3 |
| Water consumption in the cellar | 8 | m3 |
| Case Study E | Quantity | Unit |
| Hectares cultivated | 26 | ha |
| Quantity of grapes harvested | 193,000 | kg |
| Number of bottles produced annually | 180,000 | - |
| Applied agricultural practice (organic/conventional) | conventional | - |
| Quantity of copper oxide | 3 | kg/ha |
| Quantity of sulphides | 90 | kg/ha |
| Quantity of sulphur dioxide | 15 | kg |
| Quantity of nitrogen fertilisers applied | 0.78 | kg |
| Weight of the glass bottle | 0.6 | kg |
| Weight of the bottle cap | 4.4 | g |
| Weight of the PVC capsule | 3.3 | g |
| Weight of the aluminum capsule | no | g |
| Weight of the label | 2 | g |
| Fuel used | 5000 | L |
| Electricity consumption | 63,831 | kWh |
| Number of pesticide applications | 8 | - |
| Average volume of water used for pesticide dilution | 0.2 | m3 |
| Water consumption in the cellar | 1900 | m3 |
| Case Study F | Quantity | Unit |
| Hectares cultivated | 20 | ha |
| Quantity of grapes harvested | 128,000 | kg |
| Number of bottles produced annually | 120,000 | - |
| Applied agricultural practice (organic/conventional) | organic | - |
| Quantity of copper oxide | 3.8 | kg/ha |
| Quantity of sulphides | 4 | kg/ha |
| Quantity of sulphur dioxide | 0.15 | kg |
| Quantity of nitrogen fertilisers applied | 15,000 | kg |
| Weight of the glass bottle | 0.58 | kg |
| Weight of the bottle cap | 4.4 | g |
| Weight of the PVC capsule | 3.3 | g |
| Weight of the aluminum capsule | no | g |
| Weight of the label | 2 | g |
| Fuel used | 9000 | L |
| Electricity consumption | 60,616 | kWh |
| Number of pesticide applications | 14 | - |
| Average volume of water used for pesticide dilution | 5.6 | m3 |
| Water consumption in the cellar | 1049 | m3 |
| Case Study G | Quantity | Unit |
| Hectares cultivated | 9 | ha |
| Quantity of grapes harvested | 81,000 | kg |
| Number of bottles produced annually | 76,000 | - |
| Applied agricultural practice (organic/conventional) | conventional | - |
| Quantity of copper oxide | 3.6 | kg/ha |
| Quantity of sulphides | 4.2 | kg/ha |
| Quantity of sulphur dioxide | na | kg |
| Quantity of nitrogen fertilisers applied | 7000 | kg |
| Weight of the glass bottle | 0.54 | kg |
| Weight of the bottle cap | 4.4 | g |
| Weight of the PVC capsule | 3.3 | g |
| Weight of the aluminum capsule | no | g |
| Weight of the label | 2 | g |
| Fuel used | 3500 | L |
| Electricity consumption | 35,000 | kWh |
| Number of pesticide applications | 6 | - |
| Average volume of water used for pesticide dilution | 6.4 | m3 |
| Water consumption in the cellar | 500 | m3 |
| Case Study H | Quantity | Unit |
| Hectares cultivated | 8 | ha |
| Quantity of grapes harvested | 27,000 | kg |
| Number of bottles produced annually | 25,000 | - |
| Applied agricultural practice (organic/conventional) | organic | - |
| Quantity of copper oxide | 1.5 | kg/ha |
| Quantity of sulphides | 36 | kg/ha |
| Quantity of sulphur dioxide | na | kg |
| Quantity of nitrogen fertilisers applied | 3210 | kg |
| Weight of the glass bottle | 0.4 | kg |
| Weight of the bottle cap | 4.4 | g |
| Weight of the PVC capsule | 3.3 | g |
| Weight of the aluminum capsule | no | g |
| Weight of the label | 2 | g |
| Fuel used | 3000 | L |
| Electricity consumption | 37,899 | kWh |
| Number of pesticide applications | 2 | - |
| Average volume of water used for pesticide dilution | 1 | m3 |
| Water consumption in the cellar | 486 | m3 |
| Case Study I | Quantity | Unit |
| Hectares cultivated | 10 | ha |
| Quantity of grapes harvested | 64,000 | kg |
| Number of bottles produced annually | 60,000 | - |
| Applied agricultural practice (organic/conventional) | organic | - |
| Quantity of copper oxide | 3.8 | kg/ha |
| Quantity of sulphides | 39 | kg/ha |
| Quantity of sulphur dioxide | na | kg |
| Quantity of nitrogen fertilisers applied | 2000 | kg |
| Weight of the glass bottle | 0.57 | kg |
| Weight of the bottle cap | 4.4 | g |
| Weight of the PVC capsule | 3.3 | g |
| Weight of the aluminum capsule | no | g |
| Weight of the label | 2 | g |
| Fuel used | 3000 | L |
| Electricity consumption | 30,000 | kWh |
| Number of pesticide applications | 2 | - |
| Average volume of water used for pesticide dilution | 1 | m3 |
| Water consumption in the cellar | 200 | m3 |
| Case Study J | Quantity | Unit |
| Hectares cultivated | 12 | ha |
| Quantity of grapes harvested | 91,000 | kg |
| Number of bottles produced annually | 85,000 | - |
| Applied agricultural practice (organic/conventional) | conventional | - |
| Quantity of copper oxide | 354 | kg/ha |
| Quantity of sulphides | na | kg/ha |
| Quantity of sulphur dioxide | na | kg |
| Quantity of nitrogen fertilisers applied | 520 | kg |
| Weight of the glass bottle | 0.55 | kg |
| Weight of the bottle cap | 4.4 | g |
| Weight of the PVC capsule | no | g |
| Weight of the aluminum capsule | 3.3 | g |
| Weight of the label | 2 | g |
| Fuel used | 2600 | L |
| Electricity consumption | 34,000 | kWh |
| Number of pesticide applications | 2 | - |
| Average volume of water used for pesticide dilution | na | m3 |
| Water consumption in the cellar | 400 | m3 |
| Case Study K | Quantity | Unit |
| Hectares cultivated | 2 | ha |
| Quantity of grapes harvested | 13,000 | kg |
| Number of bottles produced annually | 12,000 | - |
| Applied agricultural practice (organic/conventional) | organic | - |
| Quantity of copper oxide | 3.5 | kg/ha |
| Quantity of sulphides | 2.4 | kg/ha |
| Quantity of sulphur dioxide | na | kg |
| Quantity of nitrogen fertilisers applied | na | kg |
| Weight of the glass bottle | 0.54 | kg |
| Weight of the bottle cap | 4.4 | g |
| Weight of the PVC capsule | 3.3 | g |
| Weight of the aluminum capsule | no | g |
| Weight of the label | 2 | g |
| Fuel used | 500 | L |
| Electricity consumption | 3000 | kWh |
| Number of pesticide applications | 2 | - |
| Average volume of water used for pesticide dilution | 0 | m3 |
| Water consumption in the cellar | 0.05 | m3 |
| Case Study L | Quantity | Unit |
| Hectares cultivated | 20 | ha |
| Quantity of grapes harvested | 90,000 | kg |
| Number of bottles produced annually | 84,000 | - |
| Applied agricultural practice (organic/conventional) | conventional | - |
| Quantity of copper oxide | 2.5 | kg/ha |
| Quantity of sulphides | 50 | kg/ha |
| Quantity of sulphur dioxide | 0.5 | kg |
| Quantity of nitrogen fertilisers applied | na | kg |
| Weight of the glass bottle | 0.58 | kg |
| Weight of the bottle cap | 4.4 | g |
| Weight of the PVC capsule | 3.3 | g |
| Weight of the aluminum capsule | no | g |
| Weight of the label | 2 | g |
| Fuel used | 6500 | L |
| Electricity consumption | 75,000 | kWh |
| Number of pesticide applications | 11 | - |
| Average volume of water used for pesticide dilution | 22 | m3 |
| Water consumption in the cellar | 190 | m3 |
References
- Kuo, T.C.; Chen, H.Y.; Chong, B.; Lin, M. Cost benefit analysis and carbon footprint of biogas energy through life cycle assessment. Clean. Environ. Syst. 2024, 15, 100240. [Google Scholar] [CrossRef]
- European Commission. Common Agricultural Policy: 2023-27. 2023. Available online: http://agriculture.ec.europa.eu/common-agricultural-policy/cap-overview/cap-2023-27_en (accessed on 16 February 2025).
- Gasso, V.; Barber, A.; Moller, H.; Bayonne, E.; Oudshoorn, F.W.; Sørensen, C.G. Benchmarking for locally tuned sustainability: The case of energy and water use in New Zealand vineyards. Environ. Sustain. Indic. 2025, 25, 100536. [Google Scholar] [CrossRef]
- Grigoroudis, E.; Kouikoglou, V.S.; Phillis, Y.A. Agricultural sustainability assessment and national policy-making using an axiomatic mathematical model. Environ. Sustain. Indic. 2024, 22, 100401. [Google Scholar] [CrossRef]
- CREA. 2022. Available online: https://www.csqa.it/en-us/certificazioni/agroalimentare/sqnpi-produzione-integrata (accessed on 16 February 2025).
- GAZZETTA UFFICIALE. Data about Agricultural Policy Laws. 2023. Available online: https://www.gazzettaufficiale.it/atto/serie_generale/caricaDettaglioAtto/originario?atto.dataPubblicazioneGazzetta=2025-06-13&atto.codiceRedazionale=25A03350&elenco30giorni=false (accessed on 16 February 2025).
- OIV. World Wine Production Outlook OIV First Estimates. International Organization of Vine and Wine. 2022. Available online: https://www.oiv.int/sites/default/files/documents/OIV_World_Wine_Production_Outlook_2023_2.pdf (accessed on 16 February 2025).
- ISTAT. Data about Statics on Wine Production. 2022. Available online: http://dati.istat.it/index.aspx?queryid=33706 (accessed on 16 February 2025).
- Ministero Della Giustizia. 2023. Available online: https://www.gazzettaufficiale.it/eli/id/2023/06/06/23A03238/SG (accessed on 16 February 2025).
- FEDERDOC. Data About High-Quality Italian Wine. 2023. Available online: https://www.federdoc.com (accessed on 16 February 2025).
- MASAF Data About High-Quality Italian Wine Regulation. Available online: https://www.masaf.gov.it/flex/cm/pages/ServeBLOB.php/L/IT/IDPagina/4625 (accessed on 16 May 2025).
- Casolani, N.; D’EUsanio, M.; Liberatore, L.; Raggi, A.; Petti, L. Life Cycle Assessment in the wine sector: A review on inventory phase. J. Clean. Prod. 2022, 379, 134404. [Google Scholar] [CrossRef]
- Iannone, R.; Miranda, S.; Riemma, S.; De Marco, I. Life cycle assessment of red and white wines production in southern Italy. Chem. Eng. Trans. 2014, 39, 595–600. [Google Scholar] [CrossRef]
- Salomé, C.; Coll, P.; Lardo, E.; Metay, A.; Villenave, C.; Marsden, C.; Blanchart, E.; Hinsinger, P.; Le Cadre, E. The soil quality concept as a framework to assess management practices in vulnerable agroecosystems: A case study in Mediterranean vineyards. Ecol. Indic. 2016, 61, 456–465. [Google Scholar] [CrossRef]
- Tsarouhas, P.; Papachristos, I. Environmental assessment of ouzo production in Greece: A Life Cycle Assessment approach. Clean. Environ. Syst. 2021, 3, 100044. [Google Scholar] [CrossRef]
- Vinci, G.; Prencipe, S.A.; Abbafati, A.; Filippi, M. Environmental Impact Assessment of an Organic Wine Production in Central Italy: Case Study from Lazio. Sustainability 2022, 14, 15483. [Google Scholar] [CrossRef]
- Chiriacò, M.V.; Belli, C.; Chiti, T.; Trotta, C.; Sabbatini, S. The potential carbon neutrality of sustainable viticulture showed through a comprehensive assessment of the greenhouse gas (GHG) budget of wine production. J. Clean. Prod. 2019, 225, 435–450. [Google Scholar] [CrossRef]
- Mura, R.; Vicentini, F.; Botti, L.M.; Chiriacò, M.V. Achieving the circular economy through environmental policies: Packaging strategies for more sustainable business models in the wine industry. Bus. Strat. Environ. 2024, 33, 1497–1514. [Google Scholar] [CrossRef]
- Massaglia, S.; Verduna, T.; Varchetta, V.; Brun, F.; Blanc, S. The impact of alternative packaging on the life cycle of wine on tap. Wine Econ. Policy 2023, 12, 51–62. [Google Scholar] [CrossRef]
- Letamendi, J.; Sevigne-Itoiz, E.; Mwabonje, O. Environmental impact analysis of a Chilean organic wine through a life cycle assessment. J. Clean. Prod. 2022, 371, 133368. [Google Scholar] [CrossRef]
- Tsalidis, G.A.; Kryona, Z.P.; Tsirliganis, N. Selecting south European wine based on carbon footprint. Resour. Environ. Sustain. 2022, 9, 100066. [Google Scholar] [CrossRef]
- Pattara, C.; Russo, C.; Antrodicchia, V.; Cichelli, A. Carbon footprint as an instrument for enhancing food quality: Overview of the wine, olive oil and cereals sectors. J. Sci. Food Agric. 2017, 97, 396–410. [Google Scholar] [CrossRef]
- Aivazidou, E.; Tsolakis, N. A water footprint review of Italian wine: Drivers, barriers, and practices for sustainable stewardship. Water 2020, 12, 369. [Google Scholar] [CrossRef]
- Miglietta, P.P.; Morrone, D. Managing water sustainability: Virtual water flows and economic water productivity assessment of the wine trade between Italy and the Balkans. Sustainability 2018, 10, 543. [Google Scholar] [CrossRef]
- Aivazidou, E.; Tsolakis, N.; Vlachos, D.; Iakovou, E. A water footprint management framework for supply chains under green market behaviour. J. Clean. Prod. 2018, 197, 592–606. [Google Scholar] [CrossRef]
- Ayuda, M.I.; Esteban, E.; Martín-Retortillo, M.; Pinilla, V. The blue water footprint of the Spanish wine industry: 1935–2015. Water 2020, 12, 1872. [Google Scholar] [CrossRef]
- Baiano, A. An overview on sustainability in the wine production chain. Beverages 2021, 7, 15. [Google Scholar] [CrossRef]
- Galletto, L.; Barisan, L. Carbon Footprint as a Lever for Sustained Competitive Strategy in Developing a Smart Oenology: Evidence from an Exploratory Study in Italy. Sustainability 2019, 11, 1483. [Google Scholar] [CrossRef]
- Bonamente, E.; Scrucca, F.; Asdrubali, F.; Cotana, F.; Presciutti, A. The water footprint of the wine industry: Implementation of an assessment methodology and application to a case study. Sustainability 2015, 7, 12190–12208. [Google Scholar] [CrossRef]
- Rinaldi, S.; Bonamente, E.; Scrucca, F.; Merico, M.C.; Asdrubali, F.; Cotana, F. Water and carbon footprint of wine: Methodology review and application to a case study. Sustainability 2016, 8, 621. [Google Scholar] [CrossRef]
- Borsato, E.; Giubilato, E.; Zabeo, A.; Lamastra, L.; Criscione, P.; Tarolli, P.; Marinello, F.; Pizzol, L. Comparison of Water-focused Life Cycle Assessment and Water Footprint Assessment: The case of an Italian wine. Sci. Total Environ. 2019, 666, 1220–1231. [Google Scholar] [CrossRef] [PubMed]
- Borsato, E.; Zucchinelli, M.; D’AMmaro, D.; Giubilato, E.; Zabeo, A.; Criscione, P.; Pizzol, L.; Cohen, Y.; Tarolli, P.; Lamastra, L.; et al. Use of multiple indicators to compare sustainability performance of organic vs conventional vineyard management. Sci. Total Environ. 2020, 711, 135081. [Google Scholar] [CrossRef]
- D’Ammaro, D.; Capri, E.; Valentino, F.; Grillo, S.; Fiorini, E.; Lamastra, L. A multi-criteria approach to evaluate the sustainability performances of wines: The Italian red wine case study. Sci. Total Environ. 2021, 799, 149446. [Google Scholar] [CrossRef]
- D’Ammaro, D.; Capri, E.; Valentino, F.; Grillo, S.; Fiorini, E.; Lamastra, L. Benchmarking of carbon footprint data from the Italian wine sector: A comprehensive and extended analysis. Sci. Total Environ. 2021, 779, 146416. [Google Scholar] [CrossRef]
- Ene, S.A.; Teodosiu, C.; Robu, B.; Volf, I. Water footprint assessment in the winemaking industry: A case study for a Romanian medium size production plant. J. Clean. Prod. 2013, 43, 122–135. [Google Scholar] [CrossRef]
- Frasnetti, E.; Ravaglia, P.; D’AMmaro, D.; Capri, E.; Lamastra, L. Can Italian wines outperform European benchmarks in environmental impact? An examination through the product environmental footprint method. Sci. Total Environ. 2024, 919, 170630. [Google Scholar] [CrossRef]
- García, J.G.; Castellanos, B.G.; García, B.G. Economic and Environmental Assessment of the Wine Chain in Southeastern Spain. Agronomy 2023, 13, 1478. [Google Scholar] [CrossRef]
- Gueddari-Aourir, A.; García-Alaminos, A.; García-Yuste, S.; Alonso-Moreno, C.; Canales-Vázquez, J.; Zafrilla, J. The carbon footprint balance of a real-case wine fermentation CO2 capture and utilization strategy. Renew. Sustain. Energy Rev. 2022, 157, 112058. [Google Scholar] [CrossRef]
- Guerra, M.; Ferreira, F.; Oliveira, A.A.; Pinto, T.; Teixeira, C.A. Drivers of Environmental Sustainability in the Wine Industry: A Life Cycle Assessment Approach. Sustainability 2024, 16, 5613. [Google Scholar] [CrossRef]
- Herath, I.; Green, S.; Horne, D.; Singh, R.; McLaren, S.; Clothier, B. Water footprinting of agricultural products: Evaluation of different protocols using a case study of New Zealand wine. J. Clean. Prod. 2013, 44, 159–167. [Google Scholar] [CrossRef]
- Iannone, R.; Miranda, S.; Riemma, S.; De Marco, I. Improving environmental performances in wine production by a life cycle assessment analysis. J. Clean. Prod. 2016, 111, 172–180. [Google Scholar] [CrossRef]
- Jradi, S.; Chameeva, T.B.; Delhomme, B.; Jaegler, A. Tracking carbon footprint in French vineyards: A DEA performance assessment. J. Clean. Prod. 2018, 192, 43–54. [Google Scholar] [CrossRef]
- Karalis, D.; Kanakoudis, V. Carbon footprint of products and services: The case of a winery in Greece. Sci. Total Environ. 2023, 878, 162317. [Google Scholar] [CrossRef]
- Lamastra, L.; Suciu, N.A.; Novelli, E.; Trevisan, M. A new approach to assessing the water footprint of wine: An Italian case study. Sci. Total Environ. 2014, 490, 748–756. [Google Scholar] [CrossRef]
- Litskas, V.D.; Tzortzakis, N.; Stavrinides, M.C. Determining the carbon footprint and emission hotspots for the wine produced in cyprus. Atmosphere 2020, 11, 463. [Google Scholar] [CrossRef]
- Manzardo, A.; Marson, A.; Zuliani, F.; Bacenetti, J.; Scipioni, A. Combination of product environmental footprint method and eco-design process according to ISO 14006: The case of an Italian vinery. Sci. Total Environ. 2021, 799, 149507. [Google Scholar] [CrossRef]
- Marchi, M.; Neri, E.; Pulselli, F.M.; Bastianoni, S. CO2 recovery from wine production: Possible implications on the carbon balance at territorial level. J. CO2 Util. 2018, 28, 137–144. [Google Scholar] [CrossRef]
- Marras, S.; Masia, S.; Duce, P.; Spano, D.; Sirca, C. Carbon footprint assessment on a mature vineyard. Agric. For. Meteorol. 2015, 214–215, 350–356. [Google Scholar] [CrossRef]
- Masotti, P.; Zattera, A.; Malagoli, M.; Bogoni, P. Environmental Impacts of Organic and Biodynamic Wine Produced in Northeast Italy. Sustainability 2022, 14, 6281. [Google Scholar] [CrossRef]
- Miglietta, P.P.; Morrone, D.; Lamastra, L. Water footprint and economic water productivity of Italian wines with appellation of origin: Managing sustainability through an integrated approach. Sci. Total Environ. 2018, 633, 1280–1286. [Google Scholar] [CrossRef] [PubMed]
- TPanizzon, T.; Salton, G.B.; Schneider, V.E.; Poletto, M. Identifying Hotspots and Most Relevant Flows for Red and White Wine Production in Brazil through Life Cycle Assessment: A Case Study. Resources 2024, 13, 88. [Google Scholar] [CrossRef]
- Ridoutt, B.; Sanguansri, P.; Bonney, L.; Crimp, S.; Lewis, G.; Lim-Camacho, L. Climate change adaptation strategy in the food industry-Insights from product carbon and water footprints. Climate 2016, 4, 26. [Google Scholar] [CrossRef]
- Bonamente, E.; Scrucca, F.; Rinaldi, S.; Merico, M.C.; Asdrubali, F.; Lamastra, L. Environmental impact of an Italian wine bottle: Carbon and water footprint assessment. Sci. Total. Environ. 2016, 560–561, 274–283. [Google Scholar] [CrossRef]
- Rugani, B.; Vázquez-Rowe, I.; Benedetto, G.; Benetto, E. A comprehensive review of carbon footprint analysis as an extended environmental indicator in the wine sector. J. Clean. Prod. 2013, 54, 61–77. [Google Scholar] [CrossRef]
- Saraiva, A.; Presumido, P.; Silvestre, J.; Feliciano, M.; Rodrigues, G.; e Silva, P.O.; Damásio, M.; Ribeiro, A.; Ramôa, S.; Ferreira, L.; et al. Water footprint sustainability as a tool to address climate change in the wine sector: A methodological approach applied to a Portuguese case study. Atmosphere 2020, 11, 934. [Google Scholar] [CrossRef]
- Soregaroli, C.; Ricci, E.C.; Stranieri, S.; Nayga, R.M.; Capri, E.; Castellari, E. Carbon footprint information, prices, and restaurant wine choices by customers: A natural field experiment. Ecol. Econ. 2021, 186, 107061. [Google Scholar] [CrossRef]
- Vagnoni, E.; Cesaraccio, C.; Pirino, P.; Duce, P. The environmental role of small organic wineries: The case study of a multi-year assessment of a local Italian red wine. Int. J. Life Cycle Assess. 2024, 29, 469–482. [Google Scholar] [CrossRef]
- Zambelli, M.; Giovenzana, V.; Casson, A.; Tugnolo, A.; Pampuri, A.; Vignati, S.; Beghi, R.; Guidetti, R. Is there mutual methodology among the environmental impact assessment studies of wine production chain? A systematic review. Sci. Total Environ. 2023, 857, 159531. [Google Scholar] [CrossRef]
- Barisan, L.; Lucchetta, M.; Bolzonella, C.; Boatto, V. How does carbon footprint create shared values in the wine industry? Empirical evidence from prosecco superiore PDO’s wine district. Sustainability 2019, 11, 3037. [Google Scholar] [CrossRef]
- Simona, C.; Nicola, F.; Micol, M.; Carmen, M.R.; Raffaella, M.; Daniele, P.; Andrea, V.; Roberto, Z. A multi-indicator approach to compare the sustainability of organic vs. integrated management of grape production. Ecol. Indic. 2024, 158, 111297. [Google Scholar] [CrossRef]
- Rotchés-Ribalta, R.; Marull, J.; Pino, J. Organic farming increases functional diversity and ecosystem service provision of spontaneous vegetation in Mediterranean vineyards. Ecol. Indic. 2023, 147, 110023. [Google Scholar] [CrossRef]
- Litskas, V.; Ledo, A.; Lawrence, P.; Chrysargyris, A.; Giannopoulos, G.; Heathcote, R.; Hastings, A.; Tzortzakis, N.; Stavrinides, M. Use of Winery and Animal Waste as Fertilizers to Achieve Climate Neutrality in Non-Irrigated Viticulture. Agronomy 2022, 12, 2375. [Google Scholar] [CrossRef]
- Vian, M.A.; Tomao, V.; Coulomb, P.O.; Lacombe, J.M.; Dangles, O. Comparison of the Anthocyanin Composition during Ripening of Syrah Grapes Grown Using Organic or Conventional Agricultural Practices. J. Agric. Food Chem. 2006, 54, 5230–5235. [Google Scholar] [CrossRef]
- Mulero, J.; Pardo, F.; Zafrilla, P. Antioxidant activity and phenolic composition of organic and conventional grapes and wines. J. Food Compos. Anal. 2010, 23, 569–574. [Google Scholar] [CrossRef]
- Dani, C.; Oliboni, L.S.; Vanderlinde, R.; Bonatto, D.; Salvador, M.; Henriques, J.A.P. Phenolic content and antioxidant activities of white and purple juices manufactured with organically- or conventionally-produced grapes. Food Chem. Toxicol. 2007, 45, 2574–2580. [Google Scholar] [CrossRef]
- ISO/TS 14067; Greenhouse Gases—Carbon Footprint of Products—Requirements and Guidelines for Quantifications and Guidelines for Quantification and Communication. 2018. Available online: https://www.iso.org/standard/71206.html (accessed on 16 February 2025).
- ISO 14046; Environmental Management—Water Footprint—Principles, Requirements and Guidelines. 2014. Available online: https://www.iso.org/standard/43263.html (accessed on 16 February 2025).
- Laio, F.; Tamea, S.; Tuninetti, M. The Water-Food Nexus in Italy: A Virtual Water Perspective. Water Resour. 2020, 5, 319–334. [Google Scholar]
- Legge N 238. 2016. Available online: https://www.normattiva.it/uri-res/N2Ls?urn:nir:stato:legge:2016;238 (accessed on 16 February 2025). (In Italian).
- Bove, A.; Masciocco, L. Studio geo-idrologico del bacino del Torrente Talloria (CN). In Analisi E Attività Di Mitigazione Dei Processi Geo-Idrologici in Italia; Codevintec: Milano, Italy, 2019; pp. 112–113. (In Italian) [Google Scholar]
- Niccolucci, V.; Galli, A.; Kitzes, J.; Pulselli, R.M.; Borsa, S.; Marchettini, N. Ecological Footprint analysis applied to the production of two Italian wines. Agric. Ecosyst. Environ. 2008, 128, 162–166. [Google Scholar] [CrossRef]
- Ventura, M.R.; Mazzaglia, C.M.; Saia, N.; Spampinato, E.C.; Carpitano, A. Carbon Footprint Emission’s Evaluation of High Control CO2 Level Wine Company. 2018. Available online: http://www.procedia-esem.eu (accessed on 16 February 2025).
- Kitzes, J.; Galli, A.; Bagliani, M.; Barrett, J.; Dige, G.; Ede, S.; Erb, K.; Giljum, S.; Haberl, H.; Hails, C.; et al. A research agenda for improving national Ecological Footprint accounts. Ecol. Econ. 2009, 68, 1991–2007. [Google Scholar] [CrossRef]
- Monfreda, C.; Wackernagel, M.; Deumling, D. Establishing national natural capital accounts based on detailed Ecological Footprint and biological capacity assessments. Land Use Policy 2004, 21, 231–246. [Google Scholar] [CrossRef]
- Global Footprint Network. 2023. Available online: https://www.footprintnetwork.org/our-work/ecological-footprint (accessed on 16 February 2025).
- GSE: Fuel Mix. Data on Italy’s Energy Mix. Available online: https://www.gse.it/servizi-per-te/news/fuel-mix-determinazione-del-mix-energetico-per-gli-anni-2019-2020 (accessed on 16 May 2025).
- RTE: Bilan Electrique 2019. Data on France’s Energy Mix. Available online: https://www.qualenergia.it/wp-content/uploads/2020/02/synthese_blianelectrique_2019_0.pdf (accessed on 16 May 2025).


| Reference | Type | Tool | Geographic Location | FU | Main Findings |
|---|---|---|---|---|---|
| [25] | R | WF | na | na | Water management policies on consumptive WF and supply chain profitability |
| [23] | R | WF | Italy | na | The total WF of national production in Italy: 81% associated with green WF, 8% to blue WF and 11% to grey WF |
| [26] | SA | WF | Spain | na | Very fast increase in the blue WF from 1995 |
| [27] | SA | CF | na | na | Viticulture contributes to >50% of the CF |
| [28] | SA | CF | Italy | na | In the global wine market firms’ sustainable strategies through activities aimed at improving CF performance. |
| [29] | SA | WF | Italy | 1 bottle 0.75 L | WF is 632.2 L, due to green water (98.3%) and with minor contributions (1.2% and 0.5%) given by grey and blue water, respectively. |
| [30] | SA | CF, WF | Italy | 1 bottle 0.75 L | The CF is 1.07 ± 0.09 kg CO2eq and the WF is 580 ± 30 L |
| [31] | SA | WF | Italy | 1 bottle 0.75 L | The blue WF corresponding to the 15%, the grey WF contributes only to the 2% and the green WF contributes to the 83% of the overall WF. |
| [32] | SA | CF, WF | Italy | 1 ha vineyard | Organic management in viticulture can be applied without having economic losses and with the benefit of better preserving the natural capital. |
| [12] | R | LCA | Italy | 1 bottle 0.75 L | The temporal aspects were treated only in 78% of cases, the specific geographical location was indicated for 97% of the studies. |
| [17] | SA | CF | Italy | 1 bottle 0.75 L | The CF is 0.79 ± 0.14 kg CO2eq, with 15% related to viticulture and 85% to the vinification. |
| [33] | SA | CF, WF | Italy | 1 bottle 0.75 L | CF is 1.47 kg CO2eq, while the WF is 666.7 L (86.75% green water, 1.92% blue and 11.34% grey). |
| [34] | SA | CF | Italy | 1 bottle 0.75 L | The main contributors of GHGs emissions are the glass bottle (29%), electricity used in the winery stage (14%), transport and distribution of the final product (13%), heat used in the winery phase (9%) and fossil fuels used in vineyard (8%). |
| [35] | SA | WF | Romania | 1 bottle 0.75 L | 99% of the total WF is related to the supply-chain water use, out of which 82% is green, 3% blue and 15% grey. |
| [36] | SA | LCA, | Italy | 0.75 L of packaged wine | Italian still wines showed impacts 30% higher compared to the European reference value, the opposite trend was observed for sparkling wines. |
| [28] | SA | CF | Italy | 1 bottle 0.75 L | CF is 2.2 kg CO2eq. |
| [37] | SA | LCA, LCC | Spain | 1 bottle 0.75 L | The weight of the glass bottle should be minimized as it has a great impact on environmental (−40%) and production costs. |
| [38] | SA | CF | Spain | na | CO2 alcoholic fermentation process strategy offers a new pathway toward a greener wine-making production with a 16.79% reduction in the CF. |
| [39] | R | LCA | Italy, Spain | 1 bottle 0.75 L | Wine type (red or white) and grape variety are less significant in determining the CF than the production strategies employed. |
| [40] | SA | WF | New Zealand | 1 bottle 0.75 L | The volumetric WF quantifies the water based on consumption along the product life cycle; in this way the comparisons of impacts between products of different regions are limited. |
| [41] | SA | CF | Italy | 1 bottle 0.75 L | Red high quality wine CF in the range 0.99 to 0.05 kg CO2eq. |
| [42] | SA | CF | Greece | na | Focus on CF related to vineyard practices link to pesticides, fertilizers and fuel use. Results show that fuel is the main contributor to CO2eq compared to pesticides and fertilizers. |
| [43] | SA | CF | Greece | na | The CF is due 32% to viticulture (328.27 t CO2eq) and 68% to vinification (1000.87 t CO2eq). The annual CF in 2020 was 1383.14 t CO2eq. |
| [44] | SA | WF | Italy | 1 bottle 0.75 L | Green water represents 81% of the WF, ranging between 704.5 and 915.9 L of green water/L wine produced. |
| [20] | SA | LCA | Chile | 1 bottle 0.75 L | The environmental impacts are associated with viticulture (39%), bottling (12%), and distribution (42%). |
| [45] | SA | LCA | Cyprus | 1 bottle 0.75 L | CF is 1.31 kg CO2eq (46% due to electrical energy consumption, 18% to packaging, 16% to viticulture, and 10% each to fuel and waste management). |
| [46] | SA | CF | Italy | 1 bottle 0.75 L | The contributions of CF are 29% distribution, 25% canteen activities, 25% packaging and 16% vineyard activities. |
| [47] | SA | CF | Italy | na | Recovery of biogenic CO2 from alcoholic fermentation of grapes could be seen as a new strategy to consolidate the status of carbon neutrality (approximately capture more than 6000 t CO2 in the territory of Siena. |
| [48] | SA | CF | Italy | 1 kg of grape yield | CF is 0.39 kg CO2eq, mostly related to fossil fuel use and soil management. |
| [49] | SA | LCA | Italy | 1 bottle 0.75 L | The packaging materials stage accounted for 71.3% of the contribution for each impact category of LCA study. |
| [19] | SA | LCA, LCC | Italy | 1 glass 0.125 L | The glass bottle is the most impactful packaging, followed by the PET keg and the steel keg; the higher quantity of raw material used for the glass bottles and the total weight of each batch led to a greater environmental impact. |
| [50] | SA | WF | Italy | na | Policy planning of wine production, integrating the notion of WF, land use and prices, represents the potential to reach the objective of an integrated and durable sustainability. |
| [24] | R | WF | Italy | na | Water sustainability assessment (including WF) of wine production in Italy. Crop water use (i.e., green water) is the main contributor to the WF. |
| [18] | SA | LC, LCC | Italy | 1 bottle 0.75 L | The GHG emissions that resulted from the LCA analysis of packaging activities were 0.55 kg CO2eq (57% related to the glass bottle, 32% to the label). |
| [51] | SA | LCA, | Brazil | 1 bottle 0.75 L | CF is 287.5 g of CO2eq for red wine and 29.2 g of CO2eq for white wine. |
| [22] | R | CF | Italy | 1 bottle 0.75 L | Utilizing environmental certification programmes is a useful strategy for raising standards in the food and wine industry. |
| [52] | SA | CF, WF | Australia | na | Water use occurred mainly in the vineyard (97%), and this was the main contribution to the WF (97%). |
| [53] | SA | CF, WF | na | 1 bottle 0.75 L | For red wine CF is 1.427 kg CO2eq and WF is 497.7 L; for white wine CF is 1.374 kg CO2eq and WF is 539.7 L. |
| [54] | SA | CF | na | na | The average CF values collected for 29 literature studies: the CF for a generic bottle of wine is 2.2 ± 1.3 kg CO2eq. |
| [55] | SA | CF, WF | Portugal | 1 bottle 0.75 L | WF ranged from 366 to 899 L, with green water representing >50% of the total WF. The winery stage is responsible for >75% of the CF. |
| [56] | SA | CF | na | na | An increase in price proportional to the CF of the wine is associated with wine choices that have lower levels of emissions. Specifically, the price increase is associated with an average reduction of approximately 0.1 kg CO2eq emitted per purchased wine bottle. |
| [21] | R | CF | Europe | 1 bottle 0.75 L | The average CF were 1.02, 1.25, and 1.62 CO2eq for red wine from organic cultivation, and for red wine and white wine from conventional cultivation, respectively. |
| [57] | SA | LCA | Italy | 1 bottle 0.75 L | Average value of GWP for four production years is 1.2 ± 0.18 kg CO2eq/bottle of wine. |
| [16] | SA | LCA | Italy | 1 bottle 0.75 L | CF is 1.1 kg CO2eq (55% due to the packaging, and 30% due to agricultural fuel use for grape production and harvesting activities). |
| [58] | R | LCA | Italy, Spain, Portugal | 1 bottle 0.75 L | CF is 1.37 ± 0.91 kg CO2eq (35% due to agricultural practices and 53% to vinification and packaging phase) |
| Input | Unit |
|---|---|
| Hectares cultivated | ha |
| Quantity of grapes harvested | kg |
| Number of bottles produced annually | - |
| Applied agricultural practice (organic/conventional) | - |
| Quantity of copper oxide | kg/ha |
| Quantity of sulphides | kg/ha |
| Quantity of sulphur dioxide | kg |
| Quantity of nitrogen fertilisers applied | kg |
| Weight of the glass bottle | kg |
| Weight of the bottle cap | g |
| Weight of the PVC capsule | g |
| Weight of the aluminum capsule | g |
| Weight of the label | g |
| Fuel used | L |
| Electricity consumption | kWh |
| Number of pesticide applications | - |
| Average volume of water used for pesticide dilution | m3 |
| Water consumption in the cellar | m3 |
| Input | Unit | Emission Factor (kg CO2eq/Input Unit) |
|---|---|---|
| Copper oxide | kg | 1.94 |
| Sulphur | kg | 1.39 |
| Iron wire | kg | 1.48 |
| Diesel for farming (fuel production) | kg | 0.51 |
| Diesel for farming (fuel combustion) | kg | 3.1 |
| Italian energy mix | kWh | 0.65 |
| Yeast and nutrient for the yeast | g | 0.001 |
| Sulphur dioxide | g | 0.0004 |
| Glass bottle | kg | 0.67 |
| Cork | g | 0.001 |
| Polyvinyl chloride | g | 0.003 |
| Recycled paper, | g | 0.002 |
| Aluminum | kg | 0.84 |
| Case Studies | Cultivated Hectares (ha) | Produced Bottles (No.) | Produced Grapes (t) | Type of Agriculture | CF (kg CO2eq/FU) | WF (L/FU) | EF (gha/FU) |
|---|---|---|---|---|---|---|---|
| A | 22 | 110,000 | 135 | Organic | 0.93 | 889.95 | 106.43 |
| B | 16 | 120,000 | 128.5 | Conventional | 0.63 | 666.58 | 77.56 |
| C | 50 | 300,000 | 320 | Organic | 0.65 | 855.29 | 231.19 |
| D | 5 | 28,000 | 30 | Conventional | 0.72 | 911.47 | 23.35 |
| E | 26 | 180,000 | 193 | Conventional | 0.75 | 722.53 | 129.43 |
| F | 20 | 120,000 | 128 | Organic | 0.85 | 835.85 | 99.17 |
| G | 9 | 76,000 | 81 | Conventional | 0.68 | 593.07 | 46.21 |
| H | 8 | 25,000 | 27 | Organic | 1.65 | 1574.38 | 39.78 |
| I | 10 | 60,000 | 64 | Organic | 0.72 | 832.43 | 47.35 |
| J | 12 | 85,000 | 91 | Conventional | 0.85 | 701.7 | 62.41 |
| K | 2 | 12,000 | 13 | Organic | 0.71 | 814.98 | 9.46 |
| L | 20 | 84,000 | 90 | Conventional | 1.4 | 1175.85 | 103.25 |
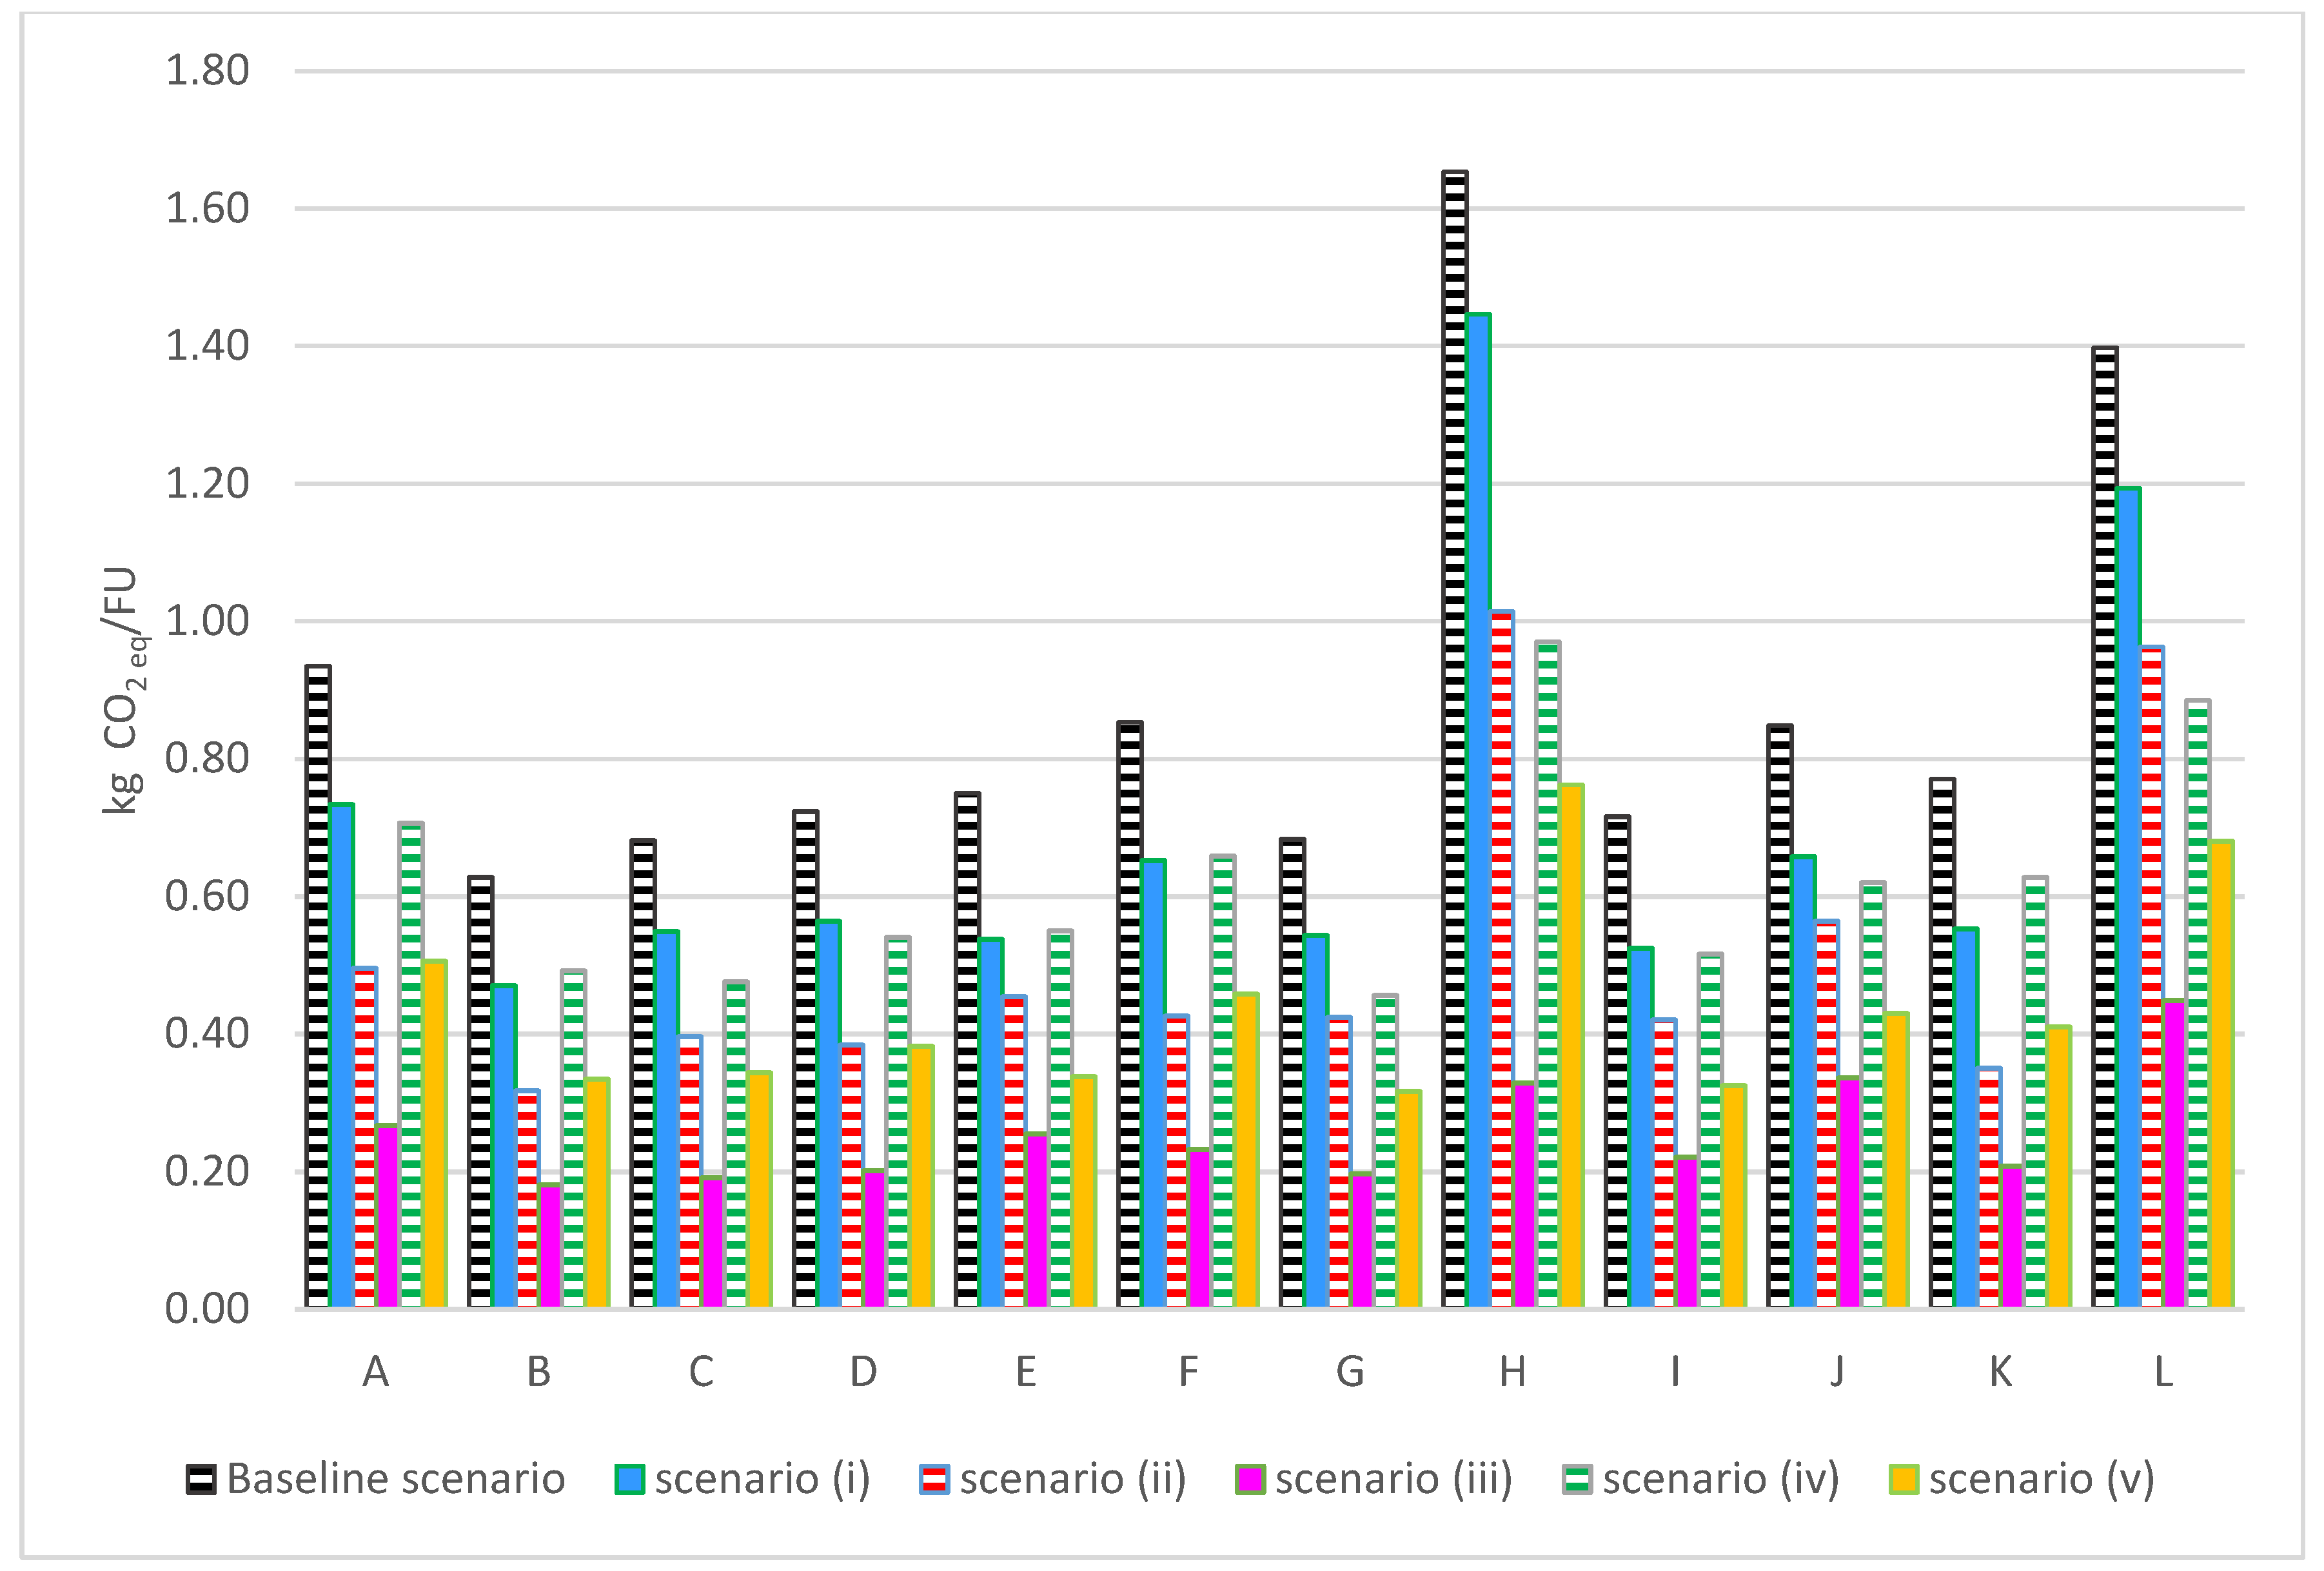
| Scenario | Grape Growing | Grape Harvest | Winemaking | Wine Bottling | Localization |
|---|---|---|---|---|---|
| Baseline scenario | Electricity mix | Italy | |||
| Scenario i | Electricity mix | France | |||
| Scenario ii | Electric tractor | Electric tractor | Electricity mix | Recycled glass, electricity mix | Italy |
| Scenario iii | Electric tractor | Electric tractor | Electricity mix | Recycled glass, electricity mix | France |
| Scenario iv | Electricity mix | Recycled glass, electricity mix | Italy | ||
| Scenario v | Electricity mix | Recycled glass, electricity mix | France |
Disclaimer/Publisher’s Note: The statements, opinions and data contained in all publications are solely those of the individual author(s) and contributor(s) and not of MDPI and/or the editor(s). MDPI and/or the editor(s) disclaim responsibility for any injury to people or property resulting from any ideas, methods, instructions or products referred to in the content. |
© 2025 by the authors. Licensee MDPI, Basel, Switzerland. This article is an open access article distributed under the terms and conditions of the Creative Commons Attribution (CC BY) license (https://creativecommons.org/licenses/by/4.0/).
Share and Cite
Orlandella, I.; Cicolin, M.; Tuninetti, M.; Fiore, S. Environmental Footprints of Red Wine Production in Piedmont, Italy. Sustainability 2025, 17, 5760. https://doi.org/10.3390/su17135760
Orlandella I, Cicolin M, Tuninetti M, Fiore S. Environmental Footprints of Red Wine Production in Piedmont, Italy. Sustainability. 2025; 17(13):5760. https://doi.org/10.3390/su17135760
Chicago/Turabian StyleOrlandella, Ilaria, Matteo Cicolin, Marta Tuninetti, and Silvia Fiore. 2025. "Environmental Footprints of Red Wine Production in Piedmont, Italy" Sustainability 17, no. 13: 5760. https://doi.org/10.3390/su17135760
APA StyleOrlandella, I., Cicolin, M., Tuninetti, M., & Fiore, S. (2025). Environmental Footprints of Red Wine Production in Piedmont, Italy. Sustainability, 17(13), 5760. https://doi.org/10.3390/su17135760