
How Does Green-Infrastructure Investment Empower Urban Sustainable Development?—Mechanisms and Empirical Tests


Abstract
1. Introduction
2. Literature Review
2.1. The Meaning, Motivation, Impact, and Mechanism of Urban Green-Infrastructure Investment
2.2. The Meaning, Measurement, and Optimization Pathways of Urban Economic Sustainable Development
2.3. The Relationship Between Urban Green-Infrastructure Investment and Urban Economic Sustainable Development
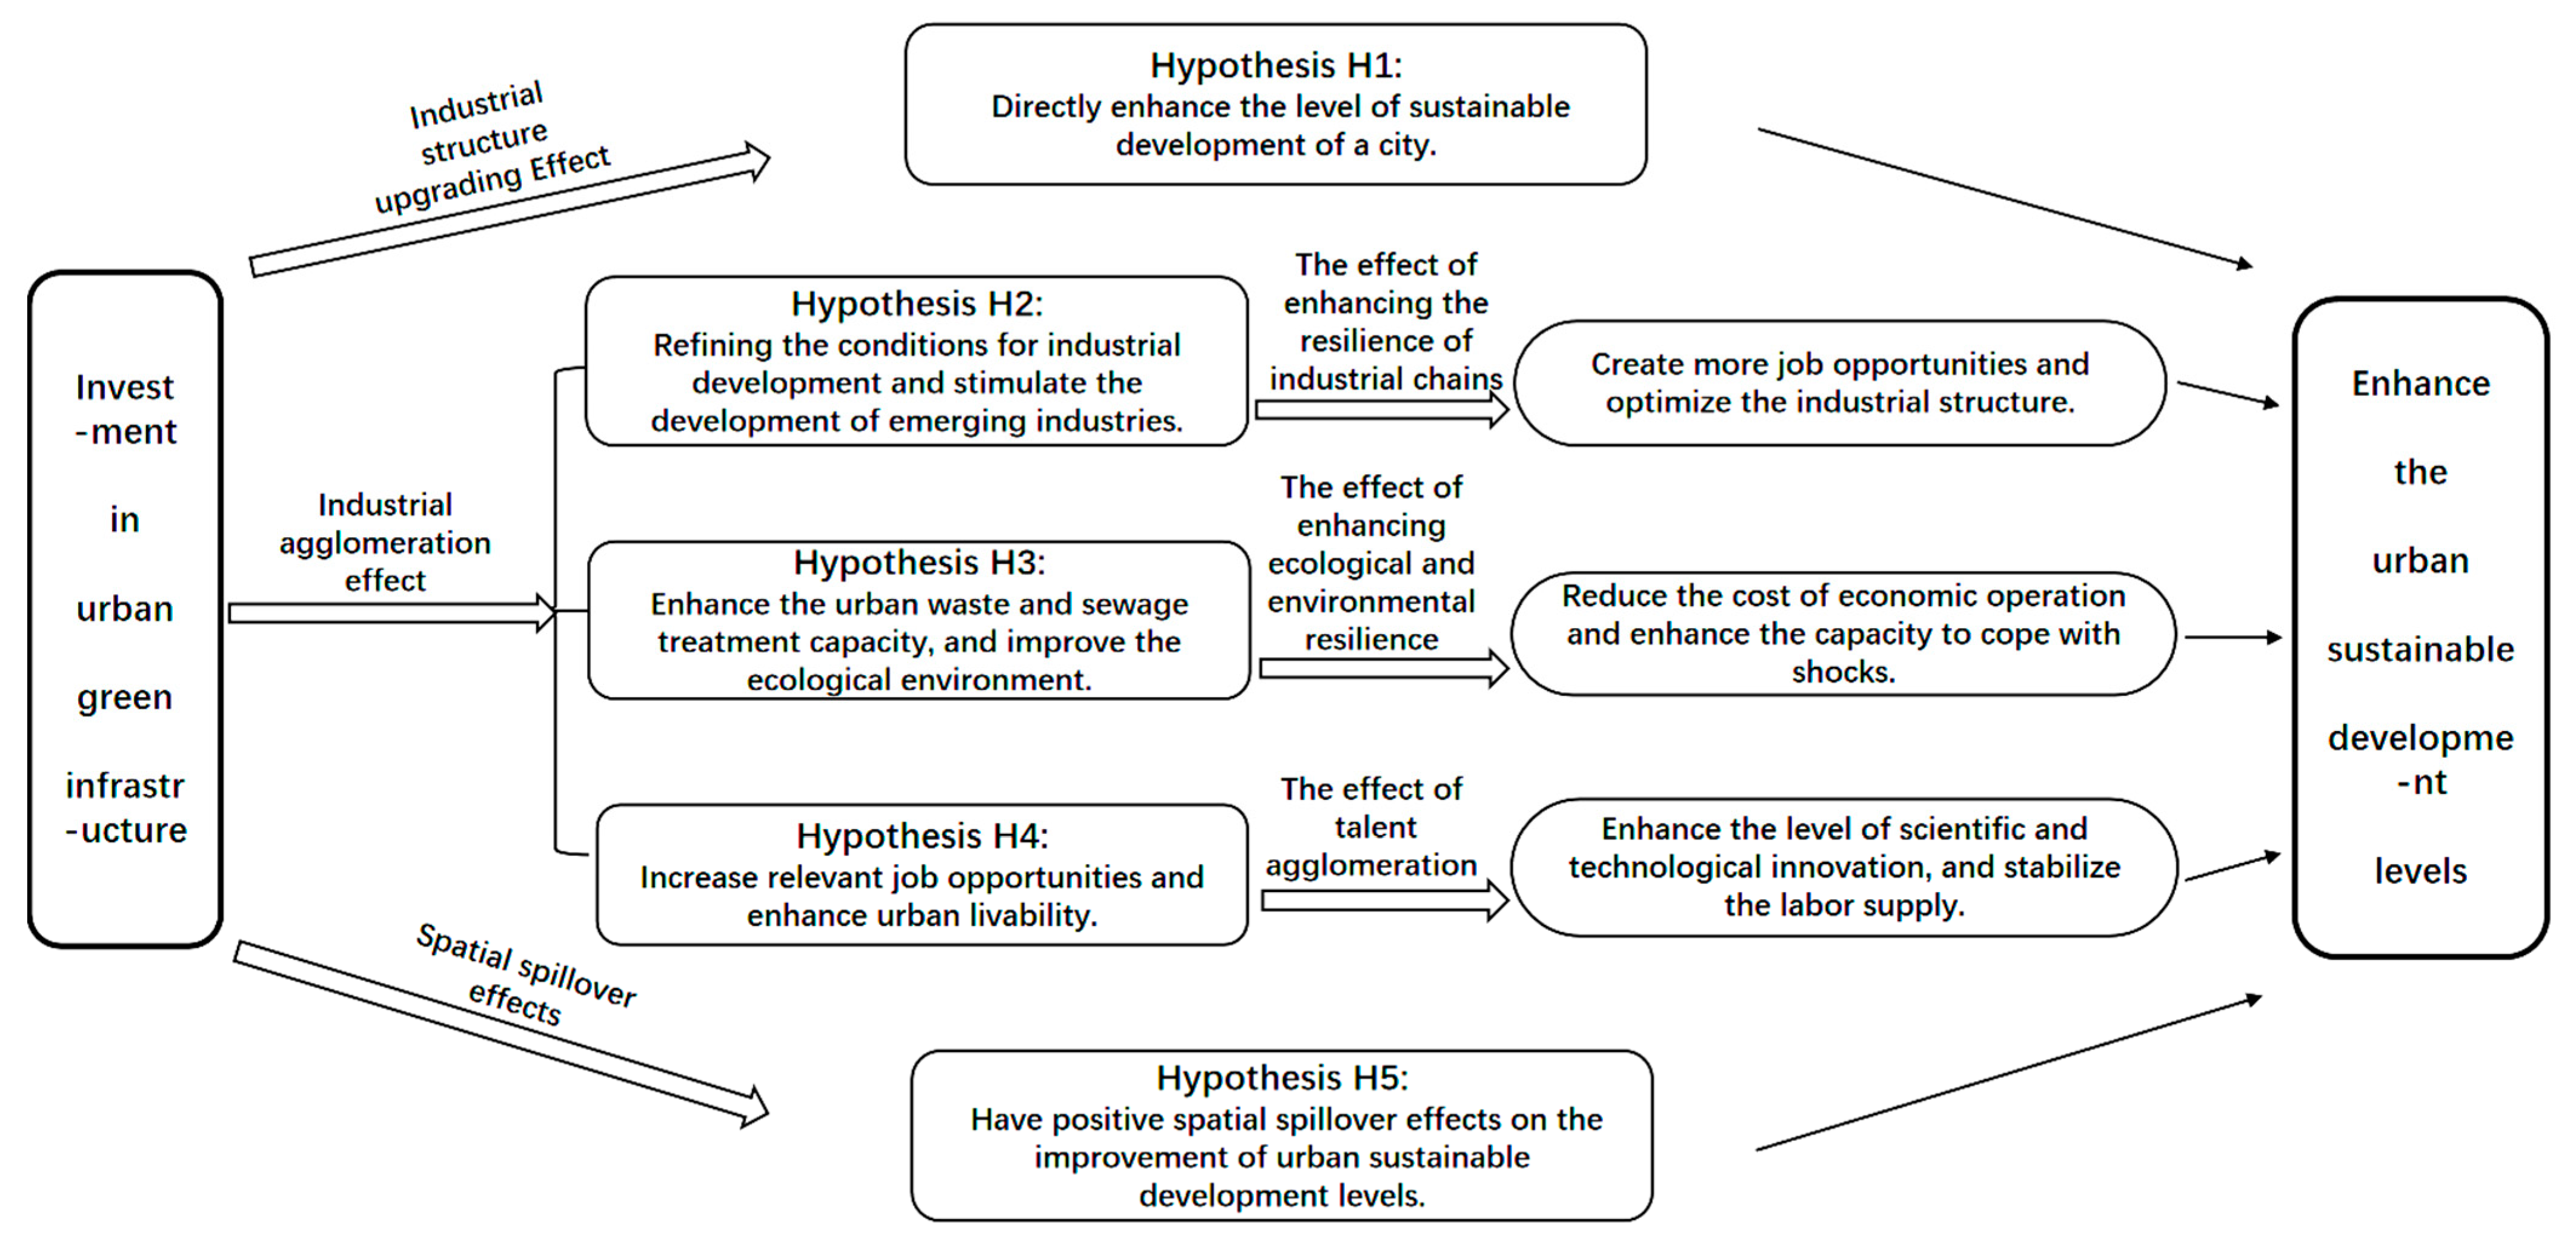
3. Mechanism Analysis and Research Hypothesis
3.1. Industrial Structure Upgrading Effect
3.2. Industrial Agglomeration Effect
3.3. Spatial Spillover Effects
4. Research Design
4.1. Model Specifications
4.2. Variable Explanation
5. Empirical Results Analysis
5.1. Benchmark Regression Analysis
5.2. Mechanism Test Results
5.3. Spatial Effect Test
6. Heterogeneity Analysis
6.1. Urban Location Heterogeneity
6.2. Urban Resource Endowment Heterogeneity
6.3. Urbanization Level Heterogeneity
6.4. Urban Openness Level Heterogeneity
6.5. Urban Scale Heterogeneity
6.6. Government Intervention Heterogeneity
7. Robustness Tests
7.1. Addressing Endogeneity Issues
7.2. Adding Control Variables
7.3. High-Dimensional Fixed-Effects Test
7.4. Exclusion of Data from Anomalous Years
7.5. Mitigation of Outlier Interference
7.6. Lagged Effect Test
8. Discussion
8.1. Discussion on the Role of Urban Green-Infrastructure Investment in the Sustainable Development of Urban Economy
8.2. Discussion on the Mechanisms of Urban Green-Infrastructure Investment on Urban Economic Sustainable Development
8.3. Research Contributions and Limitations
9. Conclusions and Recommendations
Author Contributions
Funding
Institutional Review Board Statement
Informed Consent Statement
Data Availability Statement
Conflicts of Interest
Appendix A
Appendix B. The Calculation Method of the Variable GTFP
={[E0t(xt+1,yt+1)E0t(x,y)]/[E0t+1(xt+1,yt+1)E0t+1(x,y)]}1/2
=[E0t(xt+1,yt+1)/E0t(xt,yt)] × {[E0t(xt+1,yt+1)E0t(x,y)]/[E0t+1(xt+1,yt+1)E0t+1(x,y)]}1/2
= GTC0t+1 × GEC0t+1
GEC0t+1 = E0t(xt+1,yt+1)/E0t(xt,yt)
Appendix C
References
- Acheampong, A.O.; Opoku, E.E.O. Environmental degradation and economic growth: Investigating linkages and potential pathways. Energy Econ. 2023, 123, 106734. [Google Scholar] [CrossRef]
- Xiong, W.; Jiang, M.Z.; Tashkhodjaev, M.; Pashayev, Z. Greening the economic recovery: Natural resource market efficiency as a key driver. Resour. Policy 2023, 86, 104268. [Google Scholar] [CrossRef]
- Ou, Z.X.; Cheng, C.X.; Song, Z.L.; Wu, X.D. Economic resilience of regions within the global supply network in the aftermath of disaster: A case study of Typhoon Mangkhut. Int. J. Disaster Risk Reduct. 2025, 118, 105275. [Google Scholar] [CrossRef]
- Atola, G. Implementing urban resilience in urban planning: A comprehensive framework for urban resilience evaluation. Sustain. Cities Soc. 2023, 98, 104821. [Google Scholar] [CrossRef]
- Andey, B.; Brelsford, C.; Seto, K.C. Rising infrastructure inequalities accompany urbanization and economic development. Nat. Commun. 2025, 16, 1193. [Google Scholar] [CrossRef]
- Gu, X. Strengthening Urban Resilience: Integrating Science, Economy, and Environment for Sustainable Development. J. Humanit. Arts Soc. Sci. 2023, 7, 2175–2179. [Google Scholar] [CrossRef]
- Wu, X.; Yan, Z.; Yang, H.; Wang, S.; Zhang, H.; Shen, Y.; Song, S.; Liu, Y.; Guo, Y.; Yang, D.; et al. Ecological restoration in the Yellow River Basin enhances hydropower potential. Nat. Commun. 2025, 16, 2566. [Google Scholar] [CrossRef]
- Atzkan, O.; Cohen, R.; Yaniv, E.; Rotem-Mindali, O. Urban Energy Transitions: A Systematic Review. Land 2025, 14, 566. [Google Scholar] [CrossRef]
- Zhang, M. Next-Gen TOD: Transforming Transit Oriented Development to Embrace New Challenges and Opportunities. Urban Rail Transit 2025, 1–14. [Google Scholar] [CrossRef]
- Fu, F.; Ullah, S. Toward green growth in China: The role of green finance investment, technological capital, and renewable energy consumption. Environ. Sci. Pollut. Res. 2023, 30, 72664–72674. [Google Scholar] [CrossRef]
- Homem de Almeida Rodriguez Correia, G. Increasing transport sustainability through the integration between power grids and electric mobility systems. npj Sustain. Mobil. Transp. 2025, 2, 17. [Google Scholar] [CrossRef]
- Pendam, D.V.; Rofin, T.M. Electric Vehicle and Charging Infrastructure Development: A Comprehensive Review Using Science Mapping and Thematic Analysis. In Applications of Emerging Technologies and AI/ML Algorithms ICDAPS 2022. Asset Analytics; Tiwari, M.K., Kumar, M.R., T. M., R., Mitra, R., Eds.; Springer: Singapore, 2023. [Google Scholar] [CrossRef]
- Lombardía, A.; Gómez-Villarino, M.T. Green infrastructure in cities for the achievement of the UN Sustainable Development Goals: A systematic review. Urban Ecosyst. 2023, 26, 1693–1707. [Google Scholar] [CrossRef]
- Herath, P.; Bai, X. Benefits and co-benefits of urban green infrastructure for sustainable cities: Six current and emerging themes. Sustain. Sci. 2024, 19, 1039–1063. [Google Scholar] [CrossRef]
- Gong, D.D.; Tian, J.J.; Hu, W.J.; Dong, J.J.; Chen, Y.C.; Ren, R.; Chen, Z.L. Sustainable Design and Operations Management of Metro-Based Underground Logistics Systems: A Thematic Literature Review. Buildings 2023, 13, 1888. [Google Scholar] [CrossRef]
- Moffatt, S. A Guide to Green Infrastructure for Canadian Municipalities. Ottawa: Federation of Canadian Municipalities. 2001. Available online: https://data.fcm.ca/documents/tools/PCP/A_Guide_to_Green_Infrastructure_for_Canadian_Municipalities_EN.pdf (accessed on 13 May 2025).
- Seidu, S.; Edwards, D.J.; Owusu-Manu, D.; Chan, D.W.M.; Abdulai, S.F.; Buertey, J.I.T. Achieving multifunctionality in green infrastructure projects: A fuzzy evaluation and Gini index of Key drivers in developing countries. Environ. Dev. Sustain. 2025, 1–24. [Google Scholar] [CrossRef]
- Hamann, F.; Blecken, G.T.; Ashley, R.M.; Viklander, M. Valuing the Multiple Benefits of Blue-Green Infrastructure for a Swedish Case Study: Contrasting the Economic Assessment Tools B£ST and TEEB. J. Sustain. Water Built Environ. 2020, 6, 05020003. [Google Scholar] [CrossRef]
- Dai, L.; Zhang, R. Environmental Regulation and Green Investment Efficiency: Threshold and Spatial Spillover Analysis for China. Sustainability 2025, 17, 2934. [Google Scholar] [CrossRef]
- Mei, K.L.; Zhang, Z.H. Environmental regulation, green investment and corporate green governance: Evidence from China’s New Environmental Protection Law. Financ. Res. Lett. 2025, 76, 106979. [Google Scholar] [CrossRef]
- Cook, L.M.; Good, K.D.; Moretti, M.; Kremer, P.; Wadzuk, B.; Traver, R.; Smith, V. Towards the intentional multifunctionality of urban green infrastructure: A paradox of choice? npj Urban Sustain. 2024, 4, 12. [Google Scholar] [CrossRef]
- Zarei, M.; Shahab, S. Nature-Based Solutions in Urban Green Infrastructure: A Systematic Review of Success Factors and Implementation Challenges. Land 2025, 14, 818. [Google Scholar] [CrossRef]
- Zhao, L.; Zhu, T.; Shi, J.; Kang, X.; Chen, H. Green Investment, Financial Efficiency, and Sustainable Development: Dual Perspectives of Enterprise Cost and Government Guidance. Appl. Spat. Anal. Policy 2024, 17, 799–821. [Google Scholar] [CrossRef]
- Mitra, S.; Madhuvanthi, S.; Sabumon, P. Nature-Based Urban Resilience: Integrating Green Infrastructure. In Nature-Based Solutions in Achieving Sustainable Development Goals; Singh, P., Srivastava, P., Sorokin, A., Eds.; Springer: Cham, Switzerland, 2025. [Google Scholar] [CrossRef]
- Almulhim, A.I.; Sharifi, A.; Aina, Y.A.; Ahmad, S.; Mora, L.; Filho, W.L.; Abubakar, I.R. Charting sustainable urban development through a systematic review of SDG11 research. Nat. Cities 2024, 1, 677–685. [Google Scholar] [CrossRef]
- Li, C.; Yang, X. The impact of financial agglomeration and the transformation of energy consumption structure on the regional green innovation. Clean Technol. Environ. Policy 2025, 1–15. [Google Scholar] [CrossRef]
- Shakya, R.; Ahiablame, L. A Synthesis of Social and Economic Benefits Linked to Green Infrastructure. Water 2021, 13, 3651. [Google Scholar] [CrossRef]
- Simmie, J.; Martin, R. The economic resilience of regions: Towards an evolutionary approach. Camb. J. Reg. Econ. Soc. 2010, 3, 27–43. [Google Scholar] [CrossRef]
- Martin, R. Regional economic resilience, hysteresis and recessionary shocks. J. Econ. Geogr. 2012, 12, 1–32. [Google Scholar] [CrossRef]
- Chao, X.J.; Xue, Z.X. The Impact of New-Type Information Infrastructure on China’s Economic Resilience: Evidence from Chinese Cities. Econ. Res. J. 2023, 44–62. Available online: https://kns.cnki.net/kcms2/article/abstract?v=i7m15r_oBqpswhvoejTLPwyqEg5FW9iu5TcvbBU5DnhG9KviWxWNiF35W7zBUewwzws7PKlQWju0iPo5cM4HPZM_WpLgh-uHWwnTxK9-6Afdop-1s8030szpoyX1Zpp7p_e-8lqa8hXBFQq2rA2HnM3-3HboJd7oCCnkAnRlOfdvoDTxFPvGWA==&uniplatform=NZKPT&language=CHS (accessed on 16 June 2025).
- Wang, J.K.; Fan, Q.X.; Hu, J.Y. Can Regional Integration Enhance Urban Resilience? Based on a Multidimensional View of Urban Resilience. J. Financ. Econ. 2024, 50, 4–18. [Google Scholar] [CrossRef]
- Kou, C.H.; Meng, D.H.; Yang, X.L. Construction and application of economic resilience evaluation model for megacities. PLoS ONE 2024, 19, e0301840. [Google Scholar] [CrossRef]
- Bristow, G.; Healy, A. Innovation and regional economic resilience: An exploratory analysis. Ann. Reg. Sci. 2018, 60, 265–284. [Google Scholar] [CrossRef]
- Wang, H.; Peng, G.; Du, H. Digital economy development boosts urban resilience—Evidence from China. Sci. Rep. 2024, 14, 2925. [Google Scholar] [CrossRef]
- Zeng, L.; Wen, M.; Li, C.; Nie, Y.; Wang, S. Impact of digital greening synergistic transformation on urban economic resilience in China: Evidence from quasi-natural experiments. Humanit. Soc. Sci. Commun. 2025, 12, 85. [Google Scholar] [CrossRef]
- Nie, C.; Zhong, Z.; Feng, Y. Can digital infrastructure induce urban green innovation? New insights from China. Clean Technol. Env. Policy 2023, 25, 3419–3436. [Google Scholar] [CrossRef]
- Liu, M.; Lo, K. Heterogeneous infrastructure and governance of low-carbon transition in Qingdao, China. Sustain. Sci. 2025, 1–18. [Google Scholar] [CrossRef]
- Wang, D.; Xu, P.-Y.; An, B.-W.; Guo, Q.-P. Urban green infrastructure: Bridging biodiversity conservation and sustainable urban development through adaptive management approach. Front. Ecol. Evol. 2024, 12, 1440477. [Google Scholar] [CrossRef]
- Lv, J.; Zeng, H.; Liu, Z. The Impact of Green Innovation Capacity on Urban Economic Resilience: Evidence from China’s Yangtze River Delta Region. Sustainability 2023, 15, 15235. [Google Scholar] [CrossRef]
- Wang, Z.; Liu, W. A comparative study of urban ecological resilience in the Yangtze River Economic Belt and the Yellow River Basin. Humanit. Soc. Sci. Commun. 2024, 11, 1471. [Google Scholar] [CrossRef]
- Lyu, S.; Huang, Y.N.; Sun, T.S. Urban sprawl, public transportation efficiency and carbon emissions. J. Clean. Prod. 2025, 489, 144652. [Google Scholar] [CrossRef]
- Pan, X.F.; Guo, S.C.; Li, M.N.; Song, J.B. The effect of technology infrastructure investment on technological innovation—A study based on spatial Durbin model. Technovation 2021, 107, 102315. [Google Scholar] [CrossRef]
- Li, C.; Wen, M.; Jiang, S.; Wang, H. Assessing the effect of urban digital infrastructure on green innovation: Mechanism identification and spatial-temporal characteristics. Humanit. Soc. Sci. Commun. 2024, 11, 320. [Google Scholar] [CrossRef]
- Strbac, S.; Kasanin-Grubin, M.; Pezo, L.; Stojic, N.; Loncar, B.; Curcic, L.; Pucarevic, M. Green Infrastructure Designed through Nature-Based Solutions for Sustainable Urban Development. Int. J. Environ. Res. Public Health 2023, 20, 1102. [Google Scholar] [CrossRef]
- Zuniga-Teran, A.A.; Gerlak, A.K.; Mayer, B.; Evans, T.P.; Lansey, K.E. Urban resilience and green infrastructure systems: Towards a multidimensional evaluation. Curr. Opin. Environ. Sustain. 2020, 44, 42–47. [Google Scholar] [CrossRef]
- Nyokum, T.; Tamut, Y. Sustainable Urban Infrastructure Development: Integrating Smart Technologies for Resilient and Green Cities. SSRG Int. J. Civ. Eng. 2025, 12, 18–36. [Google Scholar] [CrossRef]
- Meng, J.Y.; Ye, Z.; Wang, Y. Financing and investing in sustainable infrastructure: A review and research agenda. Sustain. Futures 2024, 8, 100312. [Google Scholar] [CrossRef]
- Shi, Y.; Ge, J. The role of government fiscal and tax incentives in green technology innovation and enterprise development: Implications for human health and hygiene. Front. Public Health 2025, 12, 1502856. [Google Scholar] [CrossRef] [PubMed] [PubMed Central]
- Zhang, L.; Lin, G.; Lyu, X.; Su, W. Suppression or promotion: Research on the impact of industrial structure upgrading on urban economic resilience. Humanit. Soc. Sci. Commun. 2024, 11, 843. [Google Scholar] [CrossRef]
- Li, J.; Fu, G.; Zhao, X. Urban Economic Resilience and Supply Chain Dynamics: Evaluating Monetary Recovery Policies in Global Cities during the Early COVID-19 Pandemic. Mathematics 2024, 12, 673. [Google Scholar] [CrossRef]
- Sato, M.; Kharrazi, A.; Nakayama, H.; Kraines, S.; Yarime, M. Quantifying the supplier-portfolio diversity of embodied energy: Strategic implications for strengthening energy resilience. Energy Policy 2017, 105, 41–52. [Google Scholar] [CrossRef]
- Jonidi Jafari, A.; Charkhloo, E.; Pasalari, H. Urban air pollution control policies and strategies: A systematic review. J. Environ. Health Sci. Eng. 2021, 19, 1911–1940. [Google Scholar] [CrossRef]
- Adebanjo, A.U.; Shafiq, N.; Kumar, V.; Olatoyan, O.J.; Abd Razak, S.N.; Yusof, N.F. Innovative Green Infrastructure Initiatives for Development in the Construction Industry. In Sustainable Green Infrastructure; Shaffie, E., Hassan, R., Arshad, A.K., Bhkari, N.M., Sidek, M.N.M., Eds.; Springer: Singapore, 2025. [Google Scholar] [CrossRef]
- Golden, H.E.; Lane, C.R.; Adnan, R.; Wu, Q. Improving global flood and drought predictions: Integrating non-floodplain wetlands into watershed hydrologic models. Environ. Res. Lett. 2021, 16, 091002. [Google Scholar] [CrossRef]
- Wang, S.; Song, R.; Xu, Z.; Chen, M.; Di Tanna, G.L.; Downey, L.; Jan, S.; Si, L. The costs, health and economic impact of air pollution control strategies: A systematic review. Glob. Health Res. Policy 2024, 9, 30. [Google Scholar] [CrossRef] [PubMed]
- Wang, X.; Ouyang, L.; Lin, J.; An, P.; Wang, W.; Liu, L.; Wu, L. Spatial Patterns of Urban Green-Blue Spaces and Residents’ Well-Being: The Mediating Effect of Neighborhood Social Cohesion. Land 2023, 12, 1454. [Google Scholar] [CrossRef]
- Comunian, R.; England, L.; Faggian, A.; Mellander, C. Positioning Talent: History, Cities and the Growing Importance of Talent. In The Economics of Talent. SpringerBriefs in Regional Science; Springer: Cham, Switzerland, 2021. [Google Scholar] [CrossRef]
- van Oorschot, J.; Slootweg, M.; Remme, R.P.; Sprecher, B.; van der Voet, E. Optimizing green and gray infrastructure planning for sustainable urban development. npj Urban Sustain. 2024, 4, 41. [Google Scholar] [CrossRef]
- Atanga, R.A.; Wang, Y.; Ayambire, R.A.; Wang, C.; Xu, M.; Li, J. Sister city partnerships and sustainable development in emerging cities: Empirical cases from Ghana and Tanzania. Habitat Int. 2024, 154, 103208. [Google Scholar] [CrossRef]
- Sun, T.; Bian, X.Z.; Liu, J.X.; Wang, R.; Sriboonchitta, S. The economic and social effects of skill mismatch in China: A DSGE model with skill and firm heterogeneity. Econ. Model. 2023, 125, 106345. [Google Scholar] [CrossRef]
- Li, D.; Yao, Q.Y. A pathway towards high-quality development of the manufacturing industry: Does scientific and technological talent matter? PLoS ONE 2024, 19, e0294873. [Google Scholar] [CrossRef]
- Huang, Y.; Gan, J.; Lin, X. City Size, Industrial Agglomeration Pattern Selection, and Urban Economic Efficiency. Financ. Trade Econ. 2024, 43, 82–95. [Google Scholar]
- Du, M.F.; Zhang, Y.J. The impact of producer services agglomeration on green economic development: Evidence from 278 Chinese cities. Energy Econ. 2023, 124, 106769. [Google Scholar] [CrossRef]
- Xu, L.; Luo, Y.; Wu, C.; Umar, M.; Li, H.; Muhammad, S. Environmental regulation and green innovation efficiency: A revisit of the porter hypothesis based on Chinese cities. Environ. Dev. Sustain. 2024, 1–25. [Google Scholar] [CrossRef]
- Zhang, L.; Tao, Y.; Nie, C. Does broadband infrastructure boost ffrm productivity? Evidence from a quasi-natural experiment in China. Financ. Res. Lett. 2022, 48, 102886. [Google Scholar] [CrossRef]
- Chen, S.; Wang, D. The Measurement, Decomposition, and Driving Mechanism of Economic Resilience of Chinese Urban Agglomerations. East China Econ. Manag. 2022, 36, 1–13. [Google Scholar] [CrossRef]
- Zhang, L.; Yao, L. The impact of digital technology innovation on urban economic resilience: Evidence from 278 prefecture-level cities and above in China. J. Manag. Sci. 2023, 36, 38–59. [Google Scholar] [CrossRef]
- Ding, J.; Wang, Z.; Liu, Y.; Yu, F. Measurement of economic resilience of contiguous poverty-stricken areas in China and influencing factor analysis. Prog. Geogr. 2020, 39, 924–937. [Google Scholar] [CrossRef]
- Yu, J.; Hu, W.; Deng, T. Towards more resilient economy—Analyzing the impact of new-type urbanization on urban economic resilience: Mechanisms and spatial spillover boundaries. Econ. Chang. Restruct. 2024, 57, 158. [Google Scholar] [CrossRef]
- Zhang, S.L.; Zheng, H.Q.; Zhou, H.Y.; Shao, Q.; Wu, Q. Sustainable land urbanization, urban amenities, and population urbanization: Evidence from city-level data in China. Soc. Sci. Q. 2021, 102, 1686–1698. [Google Scholar] [CrossRef]
- Liu, S.F.; Deng, J. On the model of industrial structure coordination degree and optimization planning of industrial structure in Jiangsu province and China. J. Grey Syst. 2021, 33, 29–38. [Google Scholar]
- Park, J.I. Industrial diversity in building units and factors associated with diversity: A case study of the Seoul Metropolitan Area. Res. Policy 2020, 49, 103984. [Google Scholar] [CrossRef]
- Nie, L.; Wang, Y. Spatial Effects of Service Industry’s Heterogeneous Agglomeration on Industrial Structure Optimization: Evidence from China. Systems 2024, 12, 85. [Google Scholar] [CrossRef]
- Rezvani, S.M.; Falcão, M.J.; Komljenovic, D.; de Almeida, N.M. A Systematic Literature Review on Urban Resilience Enabled with Asset and Disaster Risk Management Approaches and GIS-Based Decision Support Tools. Appl. Sci. 2023, 13, 2223. [Google Scholar] [CrossRef]
- Zhao, W.; Toh, M.Y. Impact of Innovative City Pilot Policy on Industrial Structure Upgrading in China. Sustainability 2023, 15, 7377. [Google Scholar] [CrossRef]
- Ma, X.F.; Zhang, R.; Ruan, Y.F. How to Evaluate the Level of Green Development Based on Entropy Weight TOPSIS: Evidence from China. Int. J. Environ. Res. Public Health 2023, 20, 1707. [Google Scholar] [CrossRef] [PubMed]
- Wen, Z.L.; Ye, B.J. Mediation Effect Analysis: Method and Model Development. Adv. Psychol. Sci. 2014, 22, 731–745. [Google Scholar] [CrossRef]
- Chen, X.D.; Liu, Y.; Zhou, K. Research on the Path of Digital Economy to Enhance the Resilience of China’s Industrial Chain. Econ. Syst. Reform 2022, 1, 95–102. [Google Scholar]
- Indrianti, N.; Leuveano, R.A.C.; Abdul-Rashid, S.H.; Ridho, M.I. Green Vehicle Routing Problem Optimization for LPG Distribution: Genetic Algorithms for Complex Constraints and Emission Reduction. Sustainability 2025, 17, 1144. [Google Scholar] [CrossRef]
- Khodadad, M.; Aguilar-Barajas, I.; Khan, A.Z. Green Infrastructure for Urban Flood Resilience: A Review of Recent Literature on Bibliometrics, Methodologies, and Typologies. Water 2023, 15, 523. [Google Scholar] [CrossRef]
- Fang, Y.; Liu, Y.L.; Yang, Y.; Lucey, B.; Abedin, M.Z. How do Chinese urban investment bonds affect its economic resilience? Evidence from double machine learning. Res. Int. Bus. Financ. 2025, 74, 102728. [Google Scholar] [CrossRef]
- Sun, X.; Dong, Y.; Shafiq, M.N.; Santos, P.G.-D.; Gillani, S. Economic policy uncertainty and environmental quality: Unveiling the moderating effect of green finance on sustainable environmental outcomes. Humanit. Soc. Sci. Commun. 2025, 12, 801. [Google Scholar] [CrossRef]
- Li, Z.J.; Shi, Y.Y.; Wojewodzki, M.; Wei, Y.G.; Guo, M.Y. The Impact of New-Type Urbanization Policy on Urban Green Total Factor Productivity: New Evidence from China. Sustainability 2024, 16, 5220. [Google Scholar] [CrossRef]
- Gao, B.; Zhang, N.W.; Chen, C.Y. Comprehensive evaluation of urban talent ecological environment and diagnosis of barrier factors: An analysis of 16 cities in Shandong Province. Expert Syst. Appl. 2024, 246, 123157. [Google Scholar] [CrossRef]
- Cao, J.; Law, S.H.; Samad, A.R.B.A.; Mohamad, W.N.B.W.; Wang, J.; Yang, X. Effect of financial development and technological innovation on green growth—Analysis based on spatial Durbin model. J. Clean. Prod. 2022, 365, 132865. [Google Scholar] [CrossRef]
- Du, G.; Li, W. Does innovative city building promote green logistics efficiency? Evidence from a quasi-natural experiment with 285 cities. Energy Econ. 2022, 114, 106320. [Google Scholar] [CrossRef]
- Arogundade, S.; Hassan, A.S. Digital economy and environmental quality of African countries: Evidence from spatial Durbin model. Environ. Dev. Sustain. 2025, 1–18. [Google Scholar] [CrossRef]
- Zheng, J.; Guo, Y.X.; Tang, L. Can regional integration cooperation promote industrial structure upgrading?—A quasi-natural experiment based on the Yangtze River Delta Urban Economic Coordination Council. China Soft Sci. 2021, 8, 1–15. [Google Scholar] [CrossRef]
- Feng, R.D.; Wang, K.Y. The direct and lag effects of administrative division adjustment on urban expansion patterns in Chinese mega-urban agglomerations. Land Use Policy 2022, 112, 105805. [Google Scholar] [CrossRef]
- Zhang, H.; Jiang, L.; Zhou, J.; Chu, N.; Li, F. The characteristics and influencing factors of spatial network of city-based innovation correlation in China: From the perspective of high tech zones. Sci. Rep. 2023, 13, 16289. [Google Scholar] [CrossRef]
- Wang, P.; Li, D.H. New energy demonstration cities policy and urban green transformation. Financ. Res. Lett. 2025, 79, 107261. [Google Scholar] [CrossRef]
- Hu, Y.; Connor, D.S.; Stuhlmacher, M.; Peng, J.; Ii, B.L.T. More urbanization, more polarization: Evidence from two decades of urban expansion in China. npj Urban Sustain. 2024, 4, 33. [Google Scholar] [CrossRef]
- Zheng, F.H.; Niu, Y. Environmental Decentralization, Resource Endowment and Urban Industrial Transformation and Upgrading: A Comparison of Resource-Based and Non-Resource-Based Cities in China. Sustainability 2023, 15, 10475. [Google Scholar] [CrossRef]
- Hoffmann, E.M.; Schareika, N.; Dittrich, C.; Schlecht, E.; Sauer, D.; Buerkert, A. Rurbanity: A concept for the interdisciplinary study of rural–urban transformation. Sustain. Sci. 2023, 18, 1739–1753. [Google Scholar] [CrossRef]
- Dmitrović, V.; Ignjatijević, S.; Vapa Tankosić, J.; Prodanović, R.; Lekić, N.; Pavlović, A.; Čavlin, M.; Gardašević, J.; Lekić, J. Sustainability of Urban Green Spaces: A Multidimensional Analysis. Sustainability 2025, 17, 4026. [Google Scholar] [CrossRef]
- Aziz, K.M.A.; Daoud, A.O.; Singh, A.K.; Alhusban, M. Integrating digital mapping technologies in urban development: Advancing sustainable and resilient infrastructure for SDG 9 achievement—A systematic review. Alex. Eng. J. 2025, 116, 512–524. [Google Scholar] [CrossRef]
- Arlati, A.; Nagel, M. Understanding, communicating, and imagining urban biodiversity in German and Italian cities. npj Clim. Action 2025, 4, 42. [Google Scholar] [CrossRef]
- Chen, D.; Hu, W.; Li, Y.; Zhang, C.; Lu, X.; Cheng, H. Exploring the temporal and spatial effects of city size on regional economic integration: Evidence from the Yangtze River Economic Belt in China. Land Use Policy 2023, 132, 106770. [Google Scholar] [CrossRef]
- Li, Y.M.; You, D.D.; Yang, X.; Wang, S.; Ge, R.H. A review of the progress of major infrastructure construction from the perspective of ecological environment based on CiteSpace. J. Nat. Sci. Harbin Norm. Univ. 2023, 39, 75–80. [Google Scholar]
- Semadeni, M.; Withers, M.C.; Certo, S.T. The perils of endogeneity and instrumental variables in strategy research: Understanding through simulations. Strateg. Manag. J. 2014, 35, 1070–1079. [Google Scholar] [CrossRef]
- Pierce, J.R.; Costadone, L.; Mannetti, L.; Morpurgo, J.; Green, C.E.; Halder, M.D.; Guijosa, P.A.L.; Bogan, A.L.; Galt, R.; Hughes, J. Urban Nature Indexes tool offers comprehensive and flexible approach to monitoring urban ecological performance. npj Urban Sustain. 2024, 4, 22. [Google Scholar] [CrossRef]
- Xu, X.J.; Xu, H.; Mei, K.; Tong, L.H.; Liu, Z.J.; Wang, T.T.; Fang, K. Integrating multi-modal data into transformer model for short-term gas consumption forecasting. Alex. Eng. J. 2025, 122, 655–664. [Google Scholar] [CrossRef]
- Gao, Y.L.; Lin, T.T.; Zhang, Y.S.; Luo, S.Z.; Nie, F.P. Robust Principal Component Analysis Based on Discriminant Information. IEEE Trans. Knowl. Data Eng. 2023, 35, 1991–2003. [Google Scholar] [CrossRef]
- Li, X.; Chen, Z.; Chen, Y. The Impact of Digital Talent Inflow on the Co-Agglomeration of the Digital Economy Industry and Manufacturing. Systems 2024, 12, 317. [Google Scholar] [CrossRef]
- Zucaro, A.; Agostinho, F. Urban sustainability: Challenges and opportunities for resilient and resource-efficient cities. Front. Sustain. Cities 2025, 7, 1556974. [Google Scholar] [CrossRef]
- Kolditz, O.; Teti, P.; Dörhöfer, G.; LaMoreaux, J.; Andriani, G.F.; Appleyard, S.; Asch, T.; Buttafuoco, G.; Dietrich, P.; Hursthouse, A.; et al. Environmental Earth Sciences Progress Report 2020 and Outlook 2021. Environ. Earth Sci. 2021, 80, 314. [Google Scholar] [CrossRef] [PubMed]
- Li, Y.; Sun, F.; Li, M.Y. Innovative talent agglomeration, spatial spillover effects and regional innovation performance—Analyzing the threshold effect of government support. PLoS ONE 2024, 19, e0311672. [Google Scholar] [CrossRef]
- Guo, J.; Fu, Y.; Sun, X. Green innovation efficiency and multiple paths of urban sustainable development in China: Multi-configuration analysis based on urban innovation ecosystem. Sci. Rep. 2023, 13, 12975. [Google Scholar] [CrossRef] [PubMed]
- Zhang, M.M.; Wang, K.M. The Impact of Carbon Trading Policy on Green Total Factor Productivity—A Perspective of Technological Progress and Efficiency. J. China Univ. Pet. Soc. Sci. Ed. 2024, 40, 26–36. [Google Scholar] [CrossRef]
- Saxena, V. Water Quality, Air Pollution, and Climate Change: Investigating the Environmental Impacts of Industrialization and Urbanization. Water Air Soil Pollut. 2025, 236, 73. [Google Scholar] [CrossRef]


| First-Level Indicator | Second-Level Indicator | Third-Level Indicator | Indicator Weight | Indicator Attribute |
|---|---|---|---|---|
| Economic Sustainable Development Levels | Capability of Resistance and Recovery (Res) 0.1803 | Per Capita Regional Gross Domestic Product (CNY) | 0.0467 | + |
| Disposable Income of Urban Residents (CNY) | 0.0208 | + | ||
| Savings Balance of Urban and Rural Residents (CNY) | 0.0010 | + | ||
| Number of Registered Unemployed in Urban Areas (persons) | 0.1096 | - | ||
| Ratio of Total Imports and Exports to GDP (%) | 0.0022 | - | ||
| Capability of Adjustment and Adaptation (Adp) 0.2339 | Local Fiscal Revenue–Expenditure Ratio (%) | 0.0237 | + | |
| Total Retail Sales of Consumer Goods (CNY ten thousand) | 0.0959 | + | ||
| Tertiary Industry’s Share in GDP (%) | 0.0072 | + | ||
| Year-End Financial Institutions’ Loan–Deposit Ratio (%) | 0.0232 | + | ||
| Fixed Asset Investment (CNY ten thousand) | 0.0839 | + | ||
| Capability of Optimization and Transformation (Opt) 0.5859 | Number of Patent Grants (items) | 0.1826 | + | |
| Number of Students in General Higher Education Institutions (ten thousand persons) | 0.0864 | + | ||
| Fiscal Expenditure on Science (CNY ten thousand) | 0.0812 | + | ||
| Fiscal Expenditure on Education (CNY ten thousand) | 0.2357 | + |
| First-Level Indicator | Second-Level Indicator | Third-Level Indicator | Indicator Weight | Indicator Attribute |
|---|---|---|---|---|
| Level of Urban Green-Infrastructure Investment | Capacity of Urban Sewage Conveyance 0.3607 | Annual Urban Sewage Discharge Volume (ten thousand cubic meters) | 0.1940 | + |
| Length of Urban Sewage Discharge Pipelines (kilometers) | 0.1667 | + | ||
| Development Level of Urban Public Transport 0.3321 | Number of Taxis in Urban Areas at Year-end (thousand vehicles) | 0.1689 | + | |
| Number of Urban Public Transport Buses at Year-end (thousand vehicles) | 0.1632 | + | ||
| Level of Urban Greening Construction 0.3071 | Urban Green Space Area (square kilometers) | 0.0258 | + | |
| Urban Greening Rate (%) | 0.2812 | + |
| Variable | Symbol | Definition |
|---|---|---|
| Urban registered population | LnPop | The logarithm of the urban registered population at year-end (ten thousand people) |
| Urban economic development level | AvGDP | Urban per capita GDP (CNY ten thousand) |
| Urban industrial structure | Ind | The proportion of the value of the tertiary industry to the total industrial value in the city |
| Degree of government intervention | Gov | The proportion of urban fiscal expenditure (CNY ten thousand) to GDP (CNY ten thousand) |
| Urban innovation input level | Inv | The total amount of urban innovation investment (CNY hundred million) |
| Variable | N | Mean | SD | Min | Max |
|---|---|---|---|---|---|
| EcoRes | 3653 | 0.1308 | 0.0732 | 0.0285 | 0.7633 |
| Score | 3653 | 0.0463 | 0.0721 | 0.0050 | 0.7646 |
| Res | 3653 | 0.0497 | 0.0841 | 0.0012 | 0.8885 |
| Adp | 3653 | 0.0352 | 0.0599 | 0.0001 | 0.9958 |
| Trans | 3653 | 0.0535 | 0.0918 | 0.0002 | 0.9494 |
| lnPop | 3653 | 5.9051 | 0.6906 | 2.9704 | 8.1362 |
| AvGdp | 3653 | 5.5000 | 3.4769 | 0.5304 | 46.7749 |
| Ind | 3653 | 42.2225 | 10.1283 | 14.3600 | 83.8700 |
| Gov | 3653 | 0.1965 | 0.0966 | 0.4389 | 1.4852 |
| Inv | 3653 | 2.0704 | 4.2371 | 0.0015 | 57.4385 |
| Variables | (1) | (2) | (3) | (4) |
|---|---|---|---|---|
| EcoRes | Res | Adp | Trans | |
| Score | 0.0588 *** | 0.247 *** | 0.3537 *** | 0.4455 *** |
| (0.0121) | (0.0121) | (0.0093) | (0.0167) | |
| LnPop | 0.0908 *** | 0.0812 *** | 0.0494 *** | 0.0631 *** |
| (0.0047) | (0.0043) | (0.0037) | (0.0043) | |
| AvGDP | 0.00748 *** | 0.0066 *** | 0.0064 *** | 0.0061 *** |
| (0.0002) | (0.0002) | (0.0001) | (0.0001) | |
| Ind | 0.0021 *** | 0.0020 *** | 0.0020 *** | 0.0022 *** |
| 0.0001 | 0.0000 | 0.0000 | 0.0001 | |
| GOV | −0.0036 | 0.0012 | −0.0025 | −0.0039 |
| (0.0062) | (0.0056) | (0.0046) | (0.0054) | |
| InvInn | 0.0058 *** | 0.0055 *** | 0.0023 *** | 0.0052 *** |
| (0.0002) | (0.0003) | (0.0002) | (0.0002) | |
| Constant | −0.5501 *** | −0.4947 *** | −0.2971 *** | −0.3949 *** |
| (0.0274) | (0.0254) | (0.0214) | (0.0249) | |
| City | Yes | Yes | Yes | Yes |
| Year | Yes | Yes | Yes | Yes |
| N | 3653 | 3653 | 3653 | 3653 |
| R2 | 0.776 | 0.799 | 0.854 | 0.816 |
| Variables | 10th Percentile | 20th Percentile | 50th Percentile | 75th Percentile | 90th Percentile |
|---|---|---|---|---|---|
| (1) | (1) | (2) | (3) | (4) | |
| Score | 0.1740 *** | 0.1971 *** | 0.2402 *** | 0.2573 *** | 0.3336 *** |
| (0.0191) | (0.0157) | (0.0167) | (0.0302) | (0.0206) | |
| LnPop | 0.0152 *** | 0.0145 *** | 0.0141 *** | 0.0139 *** | 0.0117 *** |
| (0.0012) | (0.0008) | (0.0007) | (0.0005) | (0.0006) | |
| AvGDP | 0.0057 *** | 0.00665 *** | 0.00688 *** | 0.00803 *** | 0.00742 *** |
| (0.0003) | (0.0003) | (0.0002) | (0.0003) | (0.0004) | |
| Ind | 0.0018 *** | 0.0016 *** | 0.0015 *** | 0.0015 *** | 0.0017 *** |
| (0.0000) | (0.0001) | (0.0000) | (0.0000) | (0.0000) | |
| GOV | −0.0306 *** | −0.0198 *** | −0.0143 *** | −0.0131 *** | −0.0119 * |
| (0.0036) | (0.0027) | (0.0030) | (0.0032) | (0.0068) | |
| InvInn | 0.0031 *** | 0.00415 *** | 0.00536 *** | 0.00608 *** | 0.00687 *** |
| (0.0006) | (0.0004) | (0.0005) | (0.0005) | (0.0006) | |
| Constant | −0.0939 *** | −0.0850 *** | −0.0767 *** | −0.0739 *** | −0.0596 *** |
| (0.0079) | (0.0055) | (0.0043) | (0.0036) | (0.0047) | |
| City | Yes | Yes | Yes | Yes | Yes |
| Year | Yes | Yes | Yes | Yes | Yes |
| N | 3653 | 3653 | 3653 | 3653 | 3653 |
| R2 | 0.602 | 0.667 | 0.730 | 0.790 | 0.834 |
| Variables | Stepwise Regression Method | Sobel–Goodman Method | ||
|---|---|---|---|---|
| IndRes | EcoRes | IndRes | EcoRes | |
| (1) | (2) | (3) | (4) | |
| Score | 0.0114 *** | 0.2352 *** | 0.1188 *** | 0.2032 *** |
| (0.0041) | (0.0101) | (0.0141) | (0.0106) | |
| IndRes | - | - | - | 0.2728 *** |
| (0.0121) | ||||
| LnPop | 0.0272 *** | 0.0152 *** | 0.0045 *** | 0.0147 *** |
| (0.0016) | (0.000) | (0.0014) | (0.0017) | |
| AvGDP | 0.0004 *** | 0.0062 *** | 0.0022 *** | 0.0057 *** |
| (0.0001) | (0.0003) | (0.0001) | (0.0000) | |
| Ind | −0.0000 | 0.0028 *** | 0.0000 | 0.002 *** |
| 0.0000 | (0.0002) | (0.0000) | (0.0001) | |
| GOV | 0.00473 ** | −0.0276 *** | 0.0425 *** | −0.0382 *** |
| (0.0021) | (0.0040) | (0.0067) | (0.0044) | |
| Inv | 0.0021 *** | 0.0051 *** | 0.0073 *** | 0.0037 *** |
| (0.0001) | (0.0001) | (0.0004) | (0.0002) | |
| Sobel Z | - | - | - | 7.8751 *** |
| (0.0042) | ||||
| Constant | −0.1461 *** | −0.0862 *** | −0.0447 *** | −0.0746 |
| (0.0093) | (0.0041) | (0.0064) | (0.0032) | |
| City | Yes | Yes | Yes | Yes |
| Year | Yes | Yes | Yes | Yes |
| N | 3653 | 3653 | 3653 | 3653 |
| R2 | 0.412 | 0.927 | 0.731 | 0.938 |
| Variables | Stepwise Regression Method | Sobel–Goodman Method | ||
|---|---|---|---|---|
| GTFP | EcoRes | GTFP | EcoRes | |
| (1) | (2) | (3) | (4) | |
| Score | 1.283 *** | 0.2350 *** | 0.2282 *** | 0.2374 *** |
| (0.130) | (0.0102) | (0.0534) | (0.0102) | |
| GTFP | - | - | - | 0.0085 ** |
| (0.0013) | ||||
| LnPop | 0.0226 | 0.0157 *** | 0.0118 *** | 0.0151 *** |
| (0.0361) | (0.0016) | (0.0034) | (0.0011) | |
| AvGDP | 0.0045 *** | 0.0062 *** | 0.0061 *** | 0.006 *** |
| (0.0012) | (0.0001) | (0.0012) | (0.000) | |
| Ind | 0.0017 *** | 0.0021 *** | 0.0017 *** | 0.0021 *** |
| (0.0003) | (0.0000) | (0.0005) | (0.0000) | |
| GOV | −0.0869 ** | −0.0277 *** | 0.1387 *** | −0.0285 *** |
| (0.0384) | (0.0049) | (0.0226) | (0.0042) | |
| Inv | 0.0045 *** | 0.0052 *** | −0.0021 * | 0.0051 *** |
| (0.0015) | (0.0000) | (0.0002) | (0.0030) | |
| Sobel Z | - | - | - | 2.0587 *** |
| (0.0014) | ||||
| Constant | 0.0718 | −0.0862 *** | −0.2133 *** | −0.0741 |
| (0.2120) | (0.0040) | (0.0217) | (0.0032) | |
| City | Yes | Yes | Yes | Yes |
| Year | Yes | Yes | Yes | Yes |
| N | 3653 | 3653 | 3653 | 3653 |
| R2 | 0.529 | 0.914 | 0.754 | 0.927 |
| Variables | Stepwise Regression Method | Sobel–Goodman Method | ||
|---|---|---|---|---|
| TalGath | EcoRes | TalGath | EcoRes | |
| (1) | (2) | (3) | (4) | |
| Score | 1.0311 *** | 0.2352 *** | 0.2223 *** | 0.2091 *** |
| (0.0397) | (0.0105) | (0.0210) | (0.0106) | |
| TalGath | - | - | - | 0.1190 *** |
| (0.0081) | ||||
| LnPop | 0.1277 *** | 0.0152 *** | −0.0032 ** | 0.0160 *** |
| (0.0094) | (0.0001) | (0.0014) | (0.001) | |
| AvGDP | 0.0009 ** | 0.0069 *** | −0.0051 *** | 0.0056 *** |
| (0.0004) | (0.0000) | (0.000) | (0.0004) | |
| Ind | 0.0001 | 0.0021 *** | 0.0021 *** | 0.0022 *** |
| 0.0001 | (0.000) | (0.0006) | (0.0001) | |
| GOV | 0.0157 | −0.0272 *** | 0.0091 | −0.0285 *** |
| (0.0118) | (0.0041) | (0.0090) | (0.0042) | |
| Inv | 0.0072 *** | 0.0055 *** | 0.0112 *** | 0.0046 *** |
| (0.0005) | (0.0002) | (0.0008) | (0.0002) | |
| Sobel Z | - | - | - | 8.4370 *** |
| (0.0031) | ||||
| Constant | −0.7940 *** | −0.0866 *** | 0.0065 | −0.0872 *** |
| (0.0550) | (0.0047) | (0.0090) | (0.0031) | |
| City | Yes | Yes | Yes | Yes |
| Year | Yes | Yes | Yes | Yes |
| N | 3653 | 3653 | 3653 | 3653 |
| R2 | 0.374 | 0.924 | 0.666 | 0.932 |
| Year | Green-Infrastructure Investment | Economic Resilience |
|---|---|---|
| Moran’s I | Moran’s I | |
| 2010 | 0.2467 | 0.1039 |
| 2011 | 0.3614 | 0.1741 |
| 2012 | 0.2612 | 0.1279 |
| 2013 | 0.2871 | 0.0541 |
| 2014 | 0.2630 | 0.0744 |
| 2015 | 0.3012 | 0.1217 |
| 2016 | 0.2551 | 0.0278 |
| 2017 | 0.1957 | 0.1341 |
| 2018 | 0.1844 | 0.1596 |
| 2019 | 0.1630 | 0.1079 |
| 2020 | 0.1836 | 0.1217 |
| 2021 | 0.1917 | 0.0693 |
| 2022 | 0.1753 | 0.0942 |
| Variables | Main | LR_Direct | LR_Indirect | LR_Total |
|---|---|---|---|---|
| (1) | (2) | (3) | (4) | |
| Score | 0.1270 *** | 0.0625 *** | 0.0245 *** | 0.1872 *** |
| (0.0254) | (0.0121) | (0.0066) | (0.0177) | |
| LnPop | 0.0271 *** | 0.0350 *** | 0.0171 *** | 0.0266 *** |
| (0.0031) | (0.0024) | (0.0015) | (0.0014) | |
| AvGDP | 0.0067 *** | 0.0061 *** | 0.0057 *** | 0.0082 *** |
| (0.0003) | (0.0002) | (0.0004) | (0.0004) | |
| Ind | 0.0034 *** | 0.0067 *** | 0.0012 *** | 0.0054 *** |
| (0.0004) | (0.0001) | (0.0000) | (0.0001) | |
| Gov | −0.0587 *** | −0.0121 | −0.0296 *** | −0.0483 *** |
| (0.0145) | (0.0092) | (0.0040) | (0.0091) | |
| Inv | 0.0061 *** | −0.1568 *** | 0.0046 *** | 0.0008 |
| (0.0012) | (0.0271) | (0.0006) | (0.0007) | |
| Spatial Autoregressive Coefficient | 0.7161 *** | - | - | - |
| (0.0821) | ||||
| Sigma2_e | 0.0104 *** | - | - | - |
| (0.0018) | ||||
| Year | Yes | Yes | Yes | Yes |
| City | Yes | Yes | Yes | Yes |
| N | 3653 | 3653 | 3653 | 3653 |
| R2 | 0.316 | 0.316 | 0.316 | 0.316 |
| Variables | (1) | (2) | (3) | (4) |
|---|---|---|---|---|
| Central and Western Regions Cities | Eastern Region Cities | Resource-Based Cities | Non-Resource-Based Cities | |
| Score | 0.1800 *** | 0.0405 *** | 0.178 *** | 0.0665 *** |
| (0.0189) | (0.0137) | (0.0274) | (0.0124) | |
| LnPop | 0.0195 *** | 0.0365 *** | 0.0160 *** | 0.0331 *** |
| (0.0012) | (0.0029) | (0.0012) | (0.0021) | |
| AvGDP | 0.0087 *** | 0.0068 *** | 0.0068 *** | 0.0077 *** |
| (0.0002) | (0.0002) | (0.0002) | (0.0002) | |
| Ind | 0.0017 *** | 0.0027 *** | 0.0017 *** | 0.0025 *** |
| (0.0000) | (0.0001) | (0.0000) | (0.0001) | |
| GOV | −0.0052 | −0.0128 | 0.0005 | −0.0126 |
| (0.0064) | (0.0091) | (0.0052) | (0.0083) | |
| Inv | 0.0074 *** | 0.0060 *** | 0.0040 *** | 0.0061 *** |
| (0.0004) | (0.0002) | (0.0006) | (0.0002) | |
| Constant | −0.125 *** | −0.248 *** | −0.0943 *** | −0.2290 *** |
| (0.0073) | (0.0173) | (0.0069) | (0.0131) | |
| City | Yes | Yes | Yes | Yes |
| Year | Yes | Yes | Yes | Yes |
| N | 2431 | 1222 | 1178 | 1422 |
| R2 | 0.542 | 0.633 | 0.621 | 0.484 |
| Variables | (1) | (2) | (3) | (4) |
|---|---|---|---|---|
| Lower-Level-of-Urbanization Cities | Higher-Level-of-Urbanization Cities | Higher-Level-of-Openness Cities | Lower-Level-of-Openness Cities | |
| Score | 0.2180 *** | 0.0274 | 0.101 *** | −0.118 *** |
| (0.0152) | (0.0167) | (0.0114) | (0.0197) | |
| LnPop | 0.0212 *** | 0.0288 *** | 0.0265 *** | 0.0167 *** |
| (0.001) | (0.0030) | (0.0016) | (0.0018) | |
| AvGDP | 0.00839 *** | 0.0068 *** | 0.00723 *** | 0.0083 *** |
| (0.0002) | (0.0003) | (0.0002) | (0.0003) | |
| Ind | 0.0017 *** | 0.0035 *** | 0.0023 *** | 0.0018 *** |
| (0.0000) | (0.0005) | (0.0001) | (0.0001) | |
| GOV | 0.0120 *** | −0.0582 *** | −0.0157 ** | −0.0011 |
| (0.0043) | (0.0167) | (0.0067) | (0.0084) | |
| Inv | 0.0020 *** | 0.0061 *** | 0.0057 *** | 0.0098 *** |
| (0.0003) | (0.0003) | (0.0002) | (0.0004) | |
| Constant | −0.1332 *** | −0.2271 *** | −0.1763 *** | −0.1071 *** |
| (0.0063) | (0.0178) | (0.0010) | (0.0108) | |
| City | Yes | Yes | Yes | Yes |
| Year | Yes | Yes | Yes | Yes |
| N | 1178 | 1422 | 1517 | 1246 |
| R2 | 0.621 | 0.484 | 0.519 | 0.485 |
| Variables | (1) | (2) | (3) | (4) |
|---|---|---|---|---|
| Large-Sized Cities | Medium- and Small-Sized Cities | High-Levels-of-Government-Intervention Cities | Insufficient-Levels-of-Government-Intervention Cities | |
| Score | 0.1120 *** | 0.0014 | 0.1037 *** | 0.0087 |
| (0.0152) | (0.0119) | (0.0025) | (0.0126) | |
| LnPop | 0.0212 *** | 0.0211 *** | 0.0233 *** | 0.0155 *** |
| (0.001) | (0.0028) | (0.0009) | (0.0018) | |
| AvGDP | 0.0045 *** | 0.0158 *** | 0.0051 *** | 0.0074 *** |
| (0.0002) | (0.0002) | (0.0002) | (0.0004) | |
| Ind | 0.0037 *** | 0.0145 *** | 0.0026 *** | 0.0018 *** |
| (0.0002) | (0.0004) | (0.0002) | (0.0041) | |
| GOV | 0.0174 *** | −0.0642 *** | −0.0119 ** | −0.0058 |
| (0.0036) | (0.0177) | (0.0042) | (0.0062) | |
| Inv | 0.0022 *** | 0.0053 *** | 0.0066 *** | 0.0175 *** |
| (0.0003) | (0.0002) | (0.0002) | (0.0004) | |
| Constant | −0.2091 *** | −0.2385 *** | −0.2041 *** | −0.1293 *** |
| (0.0043) | (0.0097) | (0.0037) | (0.0046) | |
| City | Yes | Yes | Yes | Yes |
| Year | Yes | Yes | Yes | Yes |
| N | 286 | 3367 | 1703 | 1950 |
| R2 | 0.562 | 0.519 | 0.483 | 0.578 |
| Variables | (1) | (2) | (3) | (4) |
|---|---|---|---|---|
| Score | EcoRes | Score | EcoRes | |
| Ins1 | 0.2021 *** | - | - | - |
| (0.0514) | ||||
| Ins2 | - | - | 0.1960 *** | - |
| 0.0028 | ||||
| Score | - | 0.5852 *** | - | 0.7680 *** |
| (0.1595) | 0.1237 | |||
| LnPop | 0.0073 *** | 0.0123 *** | 0.0030 ** | 0.0109 *** |
| (0.0012) | (0.0016) | 0.0013 | 0.0014 | |
| AvGDP | 0.0021 *** | 0.0049 *** | 0.0032 *** | 0.0044 *** |
| (0.0005) | (0.0006) | 0.0004 | 0.0007 | |
| Ind | 0.0011 *** | 0.0014 *** | 0.0009 *** | 0.0012 *** |
| (0.0001) | (0.0002) | 0.0001 | 0.0001 | |
| GOV | −0.0196 | −0.0277 *** | 0.0024 | −0.0280 *** |
| (0.0072) | (0.0083) | 0.0062 | 0.0083 | |
| InvInn | 0.0108 *** | 0.0007 | 0.0089 *** | −0.0016 *** |
| (0.0008) | (0.0020) | 0.0008 | 0.0017 | |
| Constant | −0.0736 *** | −0.4859 *** | 0.0575 *** | −0.0389 ** |
| (0.0106) | (0.0000) | 0.0091 | 0.0119 | |
| N | 3653 | 3653 | 3653 | 3653 |
| R2 | 0.807 | 0.898 | 0.822 | 0.861 |
| Chi-squared (1) | 23.527 | - | 18.795 | - |
| (0.125) | (0.349) | |||
| Kleibergen–Paap rk Wald F Value | 16.7942 | - | 49.4559 | - |
| (16.38) | (16.38) |
| Variables | (1) |
|---|---|
| EcoRes | |
| pc1 | 0.0382 *** |
| (0.0002) | |
| pc2 | 0.0058 *** |
| (0.0003) | |
| pc3 | 0.0032 *** |
| (0.0003) | |
| pc4 | 0.0019 *** |
| (0.0005) | |
| pc5 | 0.0051 *** |
| (0.0006) | |
| pc6 | 0.0033 *** |
| (0.0009) | |
| Constant | 0.1250 *** |
| (0.0003) | |
| N | 3080 |
| R2 | 0.927 |
| Variables | (1) | (2) |
|---|---|---|
| EcoRes | EcoRes | |
| Score | 0.4552 *** | 0.2341 *** |
| (0.0172) | (0.0101) | |
| LnPop | 0.0125 *** | 0.0153 *** |
| (0.0041) | (0.0012) | |
| AvGDP | 0.0051 *** | 0.0076 *** |
| (0.000) | (0.000) | |
| Ind | 0.0021 *** | 0.0023 *** |
| (0.0000) | (0.0000) | |
| GOV | −0.0132 *** | −0.0314 *** |
| (0.0050) | (0.0041) | |
| Inv | 0.0042 *** | 0.0022 *** |
| (0.0001) | (0.0000) | |
| Fin | 0.0020 *** | - |
| (0.0000) | ||
| Tech | 0.0082 *** | - |
| (0.000) | ||
| Constant | −0.0801 *** | −0.0861 *** |
| (0.0220) | (0.0041) | |
| City | Yes | Yes |
| Year | Yes | Yes |
| N | 3653 | 3653 |
| R2 | 0.877 | 0.897 |
| Variables | (1) | (2) | (3) |
|---|---|---|---|
| Excluding Data from 2020 | Winsorized Regression | Truncated Regression | |
| Score | 0.656 *** | 0.4661 *** | 0.5620 *** |
| (0.0182) | (0.0170) | (0.0172) | |
| LnPop | 0.0321 *** | 0.0261 *** | 0.0352 *** |
| (0.0041) | (0.0030) | (0.0032) | |
| AvGDP | 0.0055 *** | 0.0080 *** | 0.0070 *** |
| (0.0001) | (0.0001) | (0.0001) | |
| Ind | 0.0027 *** | 0.0022 *** | 0.0021 *** |
| (0.0003) | (0.0000) | (0.0000) | |
| GOV | −0.0031 | 0.0365 *** | 0.0192 *** |
| (0.0055) | (0.0051) | (0.0050) | |
| Inv | 0.0050 *** | 0.0022 *** | 0.0030 *** |
| (0.0000) | (0.0000) | (0.0000) | |
| Constant | −0.2036 *** | −0.1651 *** | −0.2212 *** |
| (0.0242) | (0.0190) | (0.0210) | |
| City | Yes | Yes | Yes |
| Year | Yes | Yes | Yes |
| N | 3372 | 3653 | 3287 |
| R2 | 0.841 | 0.876 | 0.858 |
| Variables | (1) | (2) |
|---|---|---|
| EcoRes | EcoRes | |
| L.Score | 0.6562 *** | - |
| (0.0181) | ||
| L2.Score | - | 0.6442 *** |
| (0.0203) | ||
| LnPop | 0.0417 *** | 0.0446 *** |
| (0.0041) | (0.0044) | |
| AvGDP | 0.0043 *** | 0.0041 *** |
| (0.0001) | (0.0000) | |
| Ind | 0.0022 *** | 0.0036 *** |
| (0.0000) | (0.0000) | |
| GOV | 0.0091 | 0.0017 |
| (0.0064) | (0.0062) | |
| Inv | 0.0067 *** | 0.0064 *** |
| (0.0000) | (0.0002) | |
| Constant | −0.2581 *** | −0.2667 *** |
| (0.0244) | (0.0253) | |
| N | 3372 | 3091 |
| R2 | 0.836 | 0.818 |
| Variables | GTFP→IndRes | |||
|---|---|---|---|---|
| TalGath | IndRes | Score | Score | |
| (1) | (2) | (3) | (4) | |
| Score | 0.9142 *** | 0.5165 *** | 0.6469 *** | 0.5286 *** |
| (0.0301) | (0.1192) | (0.0174) | (0.0183) | |
| LnPop | 0.1024 *** | −0.0260 | 0.0375 *** | 0.0190 *** |
| (0.0071) | (0.0251) | (0.0042) | (0.0041) | |
| AvGDP | 0.0000 | 0.0022 ** | 0.0053 *** | 0.0055 *** |
| (0.0000) | (0.0015) | (0.0002) | (0.0007) | |
| Ind | 0.0001 | 0.0014 *** | 0.0026 *** | 0.0023 *** |
| (0.0002) | (0.0000) | (0.0004) | (0.0002) | |
| GOV | 0.0217 ** | −0.0687 ** | 0.0033 | −0.0000 |
| (0.0083) | (0.0296) | (0.0057) | (0.0050) | |
| Inv | 0.0084 *** | 0.0007 | 0.0051 *** | 0.0044 *** |
| (0.0006) | (0.0024) | (0.0002) | (0.0003) | |
| GTFP | 0.4216 *** | |||
| (0.0651) | ||||
| IndRes | 0.0168 *** | |||
| (0.0034) | ||||
| Constant | −0.6462 *** | 0.424 *** | −0.2396 *** | −0.1214 *** |
| (0.0401) | (0.144) | (0.0213) | (0.0231) | |
| Interaction1 | 0.2056 *** | |||
| (0.0117) | ||||
| City | Yes | Yes | Yes | Yes |
| Year | Yes | Yes | Yes | Yes |
| Bootstrap-Z | 3.01 | |||
| (0.004~0.019) | ||||
| N | 3653 | 3653 | 3653 | 3653 |
| R2 | 0.514 | 0.437 | 0.848 | 0.863 |
| Variables | TalGath→IndRes | |||
|---|---|---|---|---|
| TalGath | IndRes | Score | Score | |
| (1) | (2) | (3) | (4) | |
| Score | 0.1364 *** | 0.6583 *** | 0.6462 *** | 0.5778 *** |
| (0.0072) | (0.0295) | (0.0173) | (0.0172) | |
| LnPop | 0.0133 *** | 0.0796 *** | 0.0377 *** | 0.0369 *** |
| (0.0021) | (0.0061) | (0.0041) | (0.0044) | |
| AvGDP | 0.0005 ** | 0.0000 | 0.0058 *** | 0.0052 *** |
| (0.0003) | (0.0000) | (0.0006) | (0.0004) | |
| Ind | −0.0001 *** | 0.0001 *** | 0.0024 *** | 0.0027 *** |
| (0.0000) | (0.0000) | (0.0001) | (0.0003) | |
| GOV | 0.0047 ** | 0.0121 | 0.0032 | −0.0007 |
| (0.0022) | (0.0079) | (0.0055) | (0.0054) | |
| Inv | 0.0029 *** | 0.0041 *** | 0.0057 *** | 0.0023 *** |
| (0.0003) | (0.0002) | (0.0002) | (0.0005) | |
| IndRes | 1.8721 *** | |||
| (0.0733) | ||||
| TalGath | 0.0168 *** | |||
| (0.0039) | ||||
| Constant | −0.0622 *** | −0.5316 *** | −0.2390 *** | −0.2232 *** |
| (0.0097) | (0.0368) | (0.0233) | (0.0227) | |
| Interaction1 | 0.4091 *** | |||
| (0.0113) | ||||
| City | Yes | Yes | Yes | Yes |
| Year | Yes | Yes | Yes | Yes |
| Bootstrap-Z | 4.65 | |||
| (0.006~0.015) | ||||
| N | 3653 | 3653 | 3653 | 3653 |
| R2 | 0.471 | 0.606 | 0.848 | 0.860 |
| Variables | (1) | (2) | (3) | (4) |
|---|---|---|---|---|
| Eastern Region Cities | Central and Western Region Cities | Large-Sized Cities | Medium- and Small-Sized Cities | |
| Score | 0.2444 *** | 0.3064 *** | 0.1532 *** | 0.2546 *** |
| (0.0079) | (0.0149) | (0.0130) | (0.0102) | |
| LnPop | 0.0273 *** | 0.0178 *** | 0.0216 *** | 0.0191 *** |
| (0.0027) | (0.0013) | (0.0012) | (0.0028) | |
| AvGDP | 0.0054 *** | 0.0081 *** | 0.0082 *** | 0.0052 *** |
| (0.0002) | (0.0002) | (0.0002) | (0.0003) | |
| Ind | 0.0024 *** | 0.0016 *** | 0.0017 *** | 0.0031 *** |
| (0.0001) | (0.0000) | (0.0000) | (0.0001) | |
| GOV | −0.0154 ** | −0.0049 | 0.0161 *** | −0.0691 *** |
| (0.0067) | (0.0066) | (0.0046) | (0.0140) | |
| Inv | 0.0042 *** | 0.0072 *** | 0.0028 *** | 0.0045 *** |
| (0.0002) | (0.0004) | (0.0003) | (0.0002) | |
| Constant | −0.1745 *** | −0.1087 *** | −0.1310 *** | −0.1463 *** |
| (0.0159) | (0.0075) | (0.0069) | (0.0166) | |
| City | Yes | Yes | Yes | Yes |
| Year | Yes | Yes | Yes | Yes |
| N | 1222 | 2431 | 286 | 3367 |
| R2 | 0.906 | 0.930 | 0.841 | 0.836 |
| Variables | (1) | (2) | (3) | (4) |
|---|---|---|---|---|
| Eastern Region Cities | Central and Western Region Cities | Large-Sized Cities | Medium- and Small-Sized Cities | |
| Score | 0.0337 *** | 0.0245 *** | 0.0411 *** | 0.0021 |
| (0.0032) | (0.0014) | (0.0053) | (0.0056) | |
| LnPop | 0.00627 *** | 0.0086 *** | 0.0438 *** | 0.0220 *** |
| (0.0003) | (0.0002) | (0.0036) | (0.0016) | |
| AvGDP | 0.0028 *** | 0.0017 *** | 0.0059 *** | 0.0098 *** |
| (0.0001) | (0.0000) | (0.0003) | (0.0003) | |
| Ind | −0.0079 | 0.0092 * | 0.0028 *** | 0.0016 *** |
| (0.0116) | (0.0053) | (0.0001) | (0.0001) | |
| GOV | 0.0062 *** | 0.0017 *** | −0.0085 | 0.0033 |
| (0.0003) | (0.0003) | (0.0098) | (0.0078) | |
| Inv | 0.0475 *** | 0.0022 | 0.0060 *** | 0.0077 *** |
| (0.0019) | (0.0081) | (0.0003) | (0.0005) | |
| Constant | −0.2431 *** | −0.1490 *** | −0.3041 *** | −0.1376 *** |
| (0.0189) | (0.0084) | (0.0216) | (0.0097) | |
| City | Yes | Yes | Yes | Yes |
| Year | Yes | Yes | Yes | Yes |
| N | 1222 | 2431 | 286 | 3367 |
| R2 | 0.833 | 0.764 | 0.895 | 0.813 |
| Variables | (1) | (2) | (3) | (4) |
|---|---|---|---|---|
| Eastern Regions Cities | Central and Western Regions Cities | Large-Sized Cities | Medium- and Small-Sized Cities | |
| Score | 0.3081 *** | 0.6194 *** | 0.2412 *** | 0.5456 *** |
| (0.0260) | (0.0419) | (0.0299) | (0.0389) | |
| LnPop | 0.0335 *** | 0.0175 *** | 0.0251 *** | 0.0197 *** |
| (0.0032) | (0.0014) | (0.0035) | (0.0011) | |
| AvGDP | 0.0069 *** | 0.0092 *** | 0.0071 *** | 0.0085 *** |
| (0.0002) | (0.0002) | (0.0003) | (0.0006) | |
| Ind | 0.0026 *** | 0.0017 *** | 0.0035 *** | 0.0018 *** |
| (0.0001) | (0.0001) | (0.0002) | (0.0000) | |
| GOV | −0.0142 | −0.0064 | −0.0747 *** | 0.0112 *** |
| (0.0088) | (0.0067) | (0.0178) | (0.0043) | |
| Inv | 0.0042 *** | 0.0035 *** | 0.0045 *** | 0.0010 *** |
| (0.0003) | (0.0006) | (0.0004) | (0.0003) | |
| Constant | −0.2281*** | −0.1153 *** | −0.2030 *** | −0.1254 *** |
| (0.0192) | (0.0085) | (0.0205) | (0.0067) | |
| City | Yes | Yes | Yes | Yes |
| Year | Yes | Yes | Yes | Yes |
| N | 1222 | 2431 | 286 | 3367 |
| R2 | 0.851 | 0.772 | 0.908 | 0.872 |
Disclaimer/Publisher’s Note: The statements, opinions and data contained in all publications are solely those of the individual author(s) and contributor(s) and not of MDPI and/or the editor(s). MDPI and/or the editor(s) disclaim responsibility for any injury to people or property resulting from any ideas, methods, instructions or products referred to in the content. |
© 2025 by the authors. Licensee MDPI, Basel, Switzerland. This article is an open access article distributed under the terms and conditions of the Creative Commons Attribution (CC BY) license (https://creativecommons.org/licenses/by/4.0/).
Share and Cite
Chen, S.; Wang, Z.; Du, D.; Kong, Q. How Does Green-Infrastructure Investment Empower Urban Sustainable Development?—Mechanisms and Empirical Tests. Sustainability 2025, 17, 5751. https://doi.org/10.3390/su17135751
Chen S, Wang Z, Du D, Kong Q. How Does Green-Infrastructure Investment Empower Urban Sustainable Development?—Mechanisms and Empirical Tests. Sustainability. 2025; 17(13):5751. https://doi.org/10.3390/su17135751
Chicago/Turabian StyleChen, Shang, Ziyi Wang, Danica Du, and Qiang Kong. 2025. "How Does Green-Infrastructure Investment Empower Urban Sustainable Development?—Mechanisms and Empirical Tests" Sustainability 17, no. 13: 5751. https://doi.org/10.3390/su17135751
APA StyleChen, S., Wang, Z., Du, D., & Kong, Q. (2025). How Does Green-Infrastructure Investment Empower Urban Sustainable Development?—Mechanisms and Empirical Tests. Sustainability, 17(13), 5751. https://doi.org/10.3390/su17135751