


Abstract
Due to increased container traffic, the problems of congestion at terminal gates generate serious air pollution and decrease terminal efficiency. To address this issue, many terminals are implementing a truck appointment system (TAS) based on several concepts. Our work addresses gate congestion at a container terminal. A conceptual model was developed to identify system components and interactions, analyzing container flow from both static and dynamic perspectives. A truck appointment system (TAS) was modeled to optimize waiting times using a non-stationary approach. Compared to existing methods, our TAS introduces a more adaptive scheduling mechanism that dynamically adjusts to fluctuating truck arrivals, reducing peak congestion and improving resource utilization. Unlike traditional static appointment systems, our approach helps reduce truckers’ dissatisfaction caused by the deviation between the preferred time and the assigned one, leading to smoother operations. Various genetic algorithms were tested, with a hybrid genetic–tabu search approach yielding better results by improving solution stability and reducing computational time. The model was applied and adapted to the Port of Casablanca using real-world data. The results clearly highlight a significant potential to enhance sustainability, with an annual reduction of 785 tons of CO2 emissions from a total of 1281 tons. Regarding trucker dissatisfaction, measured by the percentage of trucks rescheduled from their preferred times, only 7.8% of arrivals were affected. This improvement, coupled with a 62% decrease in the maximum queue length, further promotes efficient and sustainable operations.
1. Introduction
The port passage is an essential link in most transport chains. International trade relies mainly on maritime transport. Commodities generally transit through a port before being transported to their final destination by land or sea. In [1], the operations of a container terminal (CT), regardless of its type, are classified into four subsystems: ship-to-shore subsystem, horizontal-transport/transfer subsystem, storage subsystem and delivery–receipt subsystem, which is the concern of the present study. These different subsystems are interconnected; any delay or incident in one has consequences on the others. Furthermore, each subsystem is characterized by its own distinct operations and its effectiveness depends on the performance of the subsystems to which it is linked [2]. The performance criteria include the respect for the container delivery date and the reduction in carbon emissions. Since the pick-up or delivery of containers is usually carried out by conventional trucks, it is important to reduce their dwell time in the port to avoid congestion, on the one hand, and to reduce their environmental impact, on the other hand, and at the same time to deliver the containers to the final customers on time. If road transport is very easy to organize due to its flexibility, reliability, speed and competitiveness, then the mass transport by train and barge remains more time-consuming and labor intensive than trucks. The modal shifts are very difficult to organize for occasional orders and low traffic. In Morocco, road freight is widely used throughout the transport chain, from pre-carriage to post-carriage. Road transport, the main greenhouse gas (GHG) producer, provides about 75% of national freight transport (excluding phosphates). Thus, faced with increasing transport volumes, ports need to optimize truck arrivals at the land interface to load/unload containers. Therefore, an appointment system is needed to avoid long queues at the port entrance. This is the case for the Port of Casablanca, the largest Moroccan port for import/export traffic, which suffers from truck congestion. The long queues formed at the entrance hinder traffic and increase driver dissatisfaction, limit terminal performance and contributes to GHG emissions. This situation of congestion directly impacts all the other areas of the port and can even penalize it in terms of attractiveness in the view of logistics providers.
This study addresses the scheduling of truck arrivals through a novel appointment system. It introduces a truck queuing model that includes an estimation of queue length, aimed at improving operational efficiency and reducing waiting times. The developed optimization model determines the number of trucks allowed to enter into the port at each hour of the day and maximizes driver satisfaction by minimizing the number of arrivals to be shifted from one period to another, without penalizing the port performance in terms of predefined waiting time at the gates. The data are based on on-site observations and consultations with terminal port managers. Our ambition is to make the activity of port actors, and more particularly road transporters, a part of sustainable development with less air pollution and a lower carbon footprint, owing to successful energy transition. The activity more particularly targeted is that of short distance road transport in the port area.
Since the container delivery or retrieval data are difficult to obtain, the systematic forecasting of truck arrival times is prevented. Truck arrival distribution can only be roughly estimated based on ship docking times and related history [3].
Congestion caused by external trucks around the terminal has become a problem of traffic management, space availability for waiting trucks, environmental pollution caused by idling trucks and driver dissatisfaction. Hence, the problem has been addressed by different stakeholders.
A TAS defines the maximum number of trucks that can enter the terminal gate during each time window of the day. Truck drivers need to make appointments before entering the CT. To calculate the most appropriate arrival rate that the terminal should announce for each time window, three variants of the genetic algorithm (GA) were proposed. These variants were tested with different instances, relying on an example from the literature. The effectiveness of a TAS was justified by the improvements concretely perceived in the Port of Casablanca context, considering the truck coordination at the gate and the carbon emissions.
The report is structured as follows: Section 2 discusses related work. Section 3 and Section 4 address the main problem and its mathematical formulation. Section 5 outlines our resolution approach, while Section 6 compares our results with existing literature. In Section 7, we provide an in-depth overview of our research conducted on the Port of Casablanca. Finally, Section 8 concludes the study and suggests some perspectives.
2. Related Work
The use of a TAS to manage external truck arrivals has attracted considerable attention from different researchers who have highlighted its various advantages for different stakeholders [4]. These advantages are related to increasing CT efficiency, reducing truck turnaround time, reducing congestion at CTs, reducing truck emissions, reducing transport costs and reducing arrival changes.
Increasing operational efficiency and service quality are key objectives for terminal managers. Improved operations provide terminals with more opportunities to gain more customers. Several researchers have investigated truck appointment management systems to increase CT efficiency. The impact of using external truck arrival information on yard operations was studied by [5], who conclude that advanced knowledge of external trucks’ arrival time reduces queue length at the gates and the reshuffling frequency at the yard. Based on previous studies, [6] developed a discrete event simulation (DES) model to assess the effect of truck announcements on the performance of yard operations. Accordingly, yard crane movements were significantly reduced by the proposed algorithms.
To examine the impact of the TAS on the performance of yard crane operations, ref. [7] employed a hybrid approach of simulation and queuing models. The results reveal a significant improvement in system performance and efficiency after TAS implementation. A mixed-integer scheduling model was formulated by [8] to find the optimal appointment number based on the overall workload and the available handling capacity. The results are validated using DES to ensure service quality improvement for trucks and terminal resources.
Carriers need to be served at high service rates to maximize the use of their resources. One way to achieve this is to reduce truck turnaround time (TTT), the total time that external trucks spend in the terminal, through a methodology developed by [9] to determine the optimal truck number to be handled per period. In this regard, a DES model was suggested and then tested using the Barbours Cut Container Terminal in the Port of Houston.
The effect of various external truck arrival patterns on TTT was studied by [10]. Based on a simulation study, the results showed that arrival distributions significantly affect the terminal performance.
An integer programming model was formulated by [11] to minimize TTT. After investigating different scenarios, the obtained results indicate a reduction in truck delays and TTT resulting from the TAS.
High demand in many CTs results in high congestion at terminal gates, storage yards and quaysides. For example, ref. [12] conducted a case study at the Hong Kong International Terminal to examine the effectiveness of a TAS in solving congestion problems by developing a decision support system which was based on an information system to make effective operational decisions at the terminal. To ensure a smooth arrival of external trucks at CTs, ref. [13] created an agent-based simulation model that shows the possibility to reduce congestion at CTs using gate congestion information and estimating truck idling times.
In order to decrease truck congestion in CTs, ref. [14] introduced an optimization approach for truck appointments. Based on the GA and point-wise stationary fluid flow approximation (PSFFA) approaches, a method was designed to reduce TTT. For this, ref. [15] developed new concepts such as chassis exchange to lower the congestion using simulation as a computational tool and to reduce the additional handling requirements of yard cranes by a set of chassis to place the containers on. Although the proposed method has been effective in minimizing congestion and emissions, it requires more space. Another study [16] aimed at controlling the arrival of external trucks according to the relationship between trucks and ships by implementing some strategies to sort out the problem of congestion. To do this, they compared the proposed strategies and found that the quality of planning coordination between land and sea operations is essential.
Global warming has motivated many researchers to investigate how to reduce greenhouse gases in the service and industrial sectors. There has been considerable interest in reducing emissions in CTs; ref. [17] developed a collaborative TAS to minimize empty trip emissions through coordinating appointments between truck drivers. These appointments were evaluated using DES. The results indicate that despite a significant reduction in truck emissions, the terminal sometimes experienced greater congestion.
From an economic perspective, as minimizing transport costs is essential for road transport companies and terminal authorities, ref. [18] implemented a planning strategy for collection and delivery operations in CTs based on an integer programming heuristic. The sequence of land-based operations is determined by minimizing transport costs. An improvement in productivity and capacity utilization is achieved with some sensitivity to the wrong selection of the appointment time. Ref. [19] probed into the transport operations for export containers in a Chinese terminal, proposed an integer programming model to reduce transportation costs through time window management and reported that the arrival peaks are smoothed using a GA. Additionally, ref. [20] developed a mixed-integer non-linear model to reduce drayage cost when determining appointment times for trucks.
From a customer-oriented position, it is essential to provide a smooth application of the TAS by focusing on reducing truckers’ dissatisfaction caused by arrival changes. In this context, ref. [21] suggested static and dynamic appointment systems. While the former defines the distribution of truck arrivals that most satisfies drivers’ preferences, the latter provides real-time assistance to make appointments based on the existing ones.
Focusing on the carbon emissions, ref. [22] addressed the problem of minimizing the total number of shifted arrivals and the total waiting time of trucks through developing a GA. The results confirm that the emissions could be decreased by shifting a few trucks from peak hours.
Recent research on TAS for container terminals has focused on optimizing scheduling, reducing congestion, and improving operational efficiency through advanced models and algorithms.
Various optimization techniques, including exact, heuristic and metaheuristic algorithms, emphasizing the need for adaptive scheduling mechanisms to handle dynamic terminal conditions were analyzed in [23].
A binary programming model was proposed to reduce truck waiting times, demurrage costs and container delivery expenses [24]. The presented sensitivity analysis demonstrates that balancing terminal workload leads to improved efficiency and reduced overall costs.
To promote the collaboration between transport companies and terminal operators, ref. [25] introduced a TAS. The model incorporates penalties for truck delays and container rehandling, ensuring a more balanced and coordinated scheduling system. However, to ensure predicting truck arrivals with greater accuracy, ref. [26] leveraged deep learning techniques, including long short-term memory and transformer models, which facilitated improved resource planning and reduced gate congestion.
For truck appointment scheduling, a simulation-based optimization method was developed by [27]. Their system minimizes truck turnaround times and mitigates dissatisfaction caused by deviations from preferred appointment slots, integrating simulation models with mixed-integer programming. In addition, concerning decarbonization of a Chinese port [28], the authors developed an optimization model to help port managers plan the purchase of more environmentally friendly container trucks (electric, hybrid) over the medium to long term.
Overall, recent studies highlight the importance of predictive, adaptive, and cooperative TAS approaches. By integrating optimization techniques and machine learning, these advancements contribute to more efficient and responsive container terminal operations.
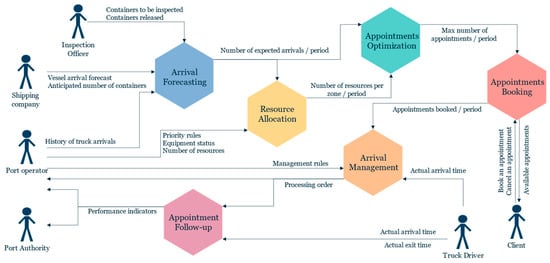
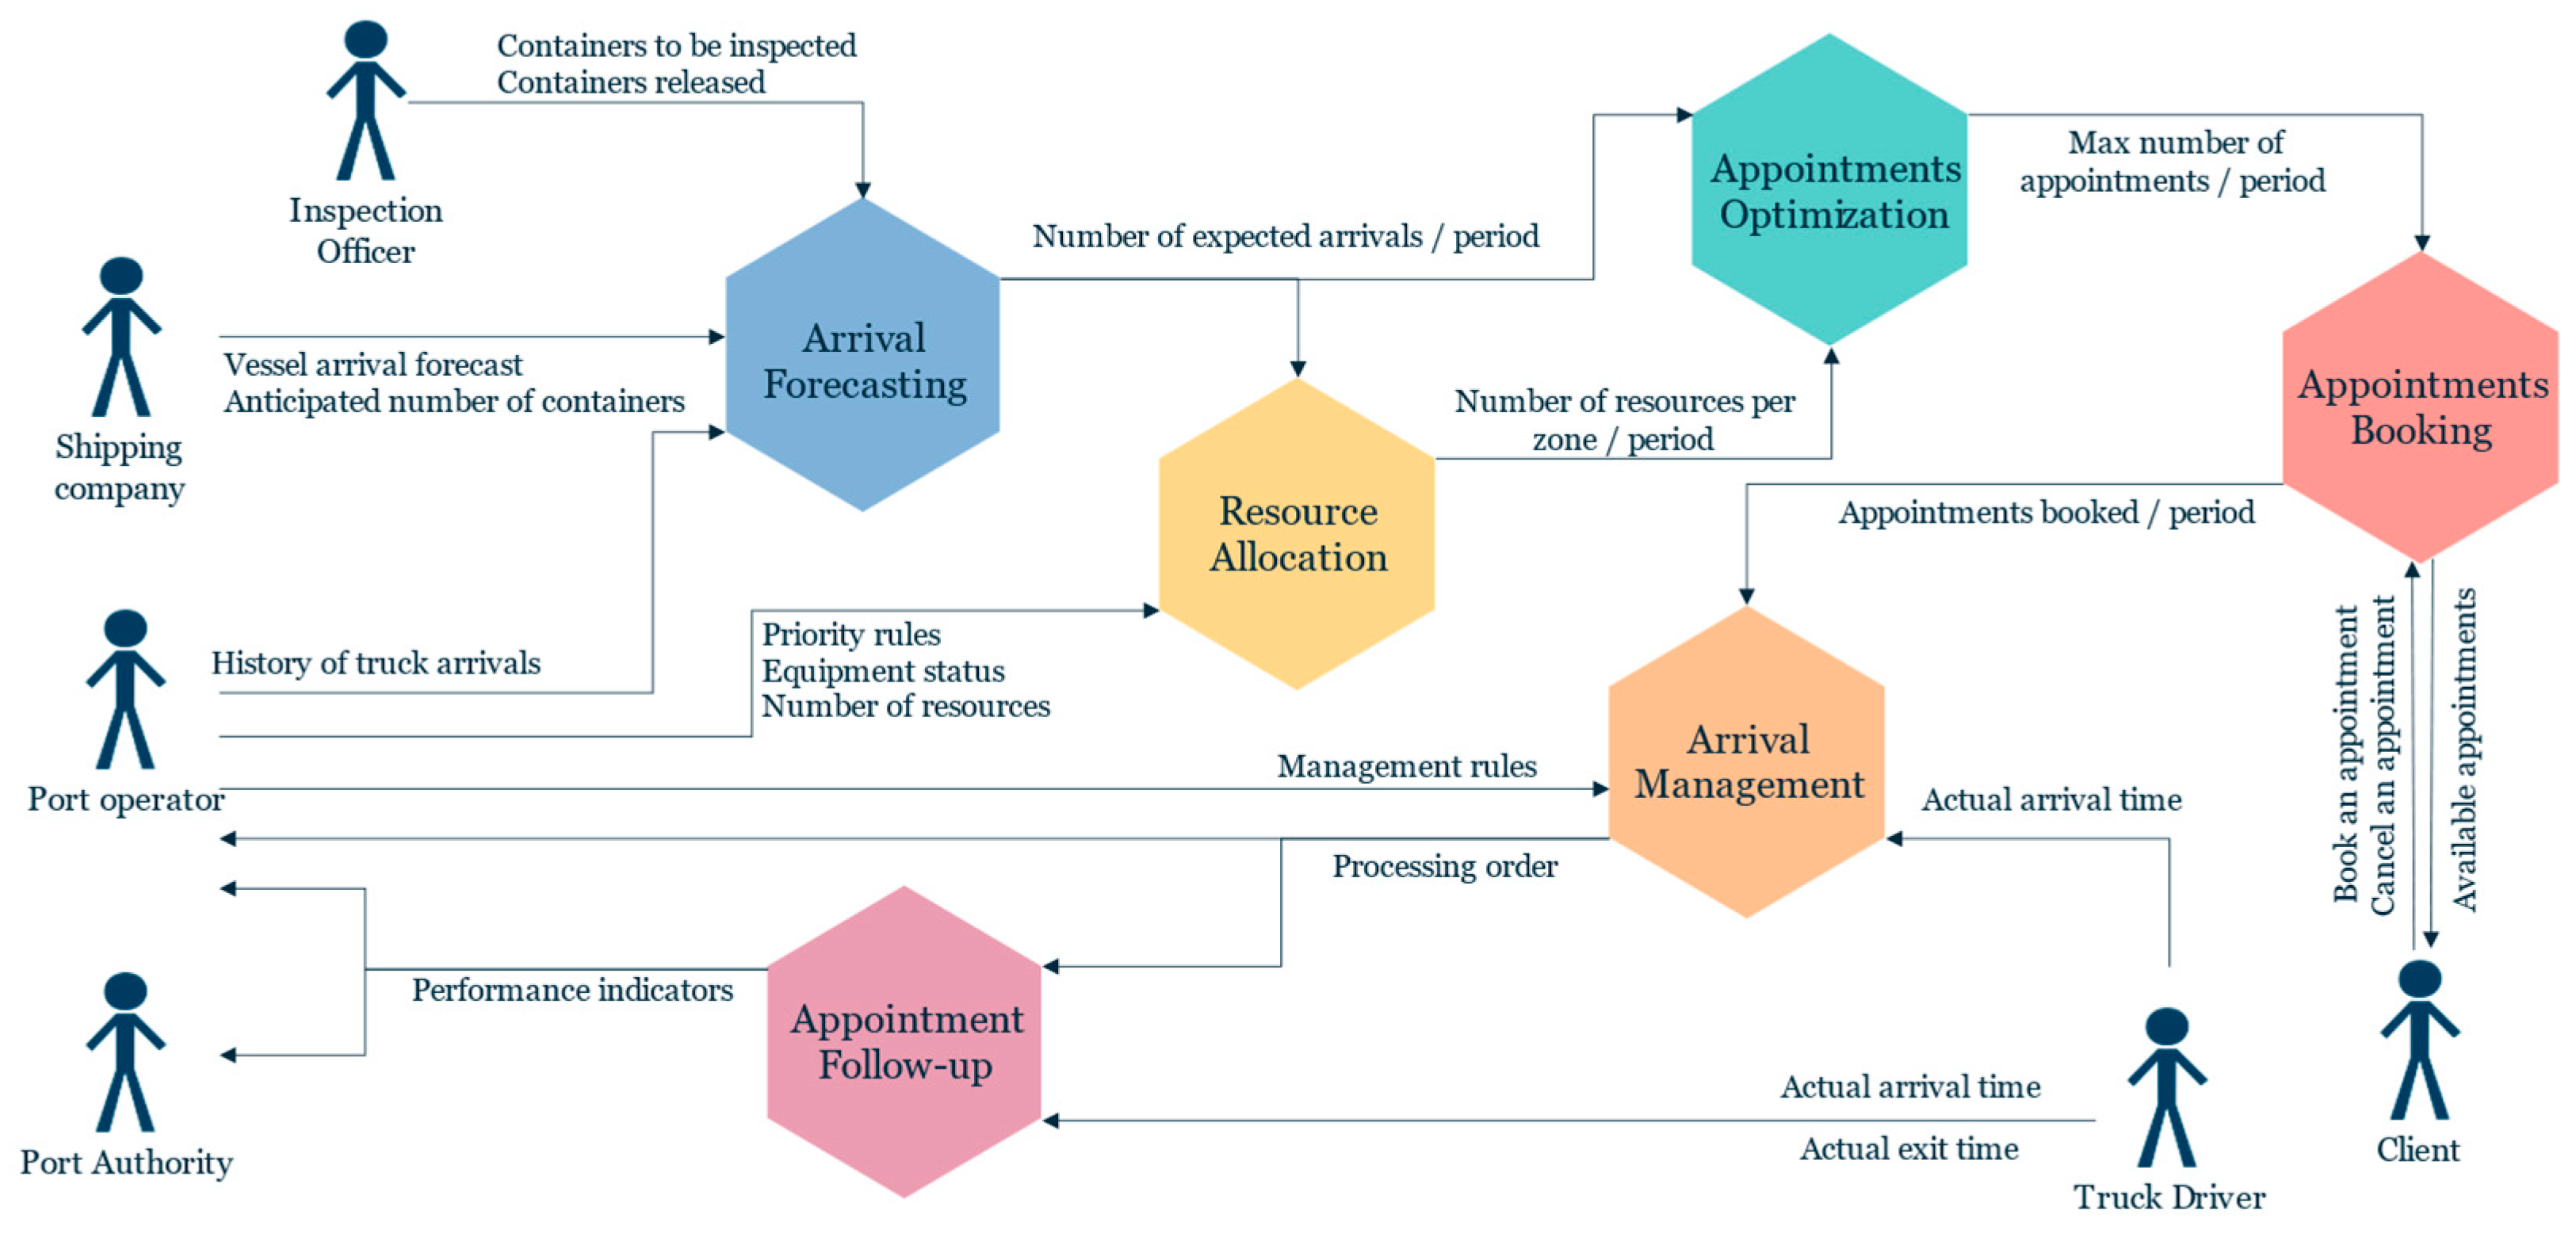
In contrast to existing approaches, our TAS (Figure 1) implements a more adaptive scheduling mechanism that dynamically responds to fluctuations in truck arrivals. This reduces peak congestion and enhances overall resource efficiency. Unlike conventional static appointment systems, our method mitigates driver dissatisfaction by minimizing the gap between preferred and assigned time slots, thereby facilitating smoother and more predictable terminal operations.
Figure 1.
Framework chart of our truck appointment system.
The shipping line provides the arrival forecast module with the ship’s expected arrival date and the estimated number of containers to be handled at the terminal. Inspection bodies (particularly customs) identify the containers that must be moved to the control zone and those that can be released afterward. The port operator incorporates historical data on truck arrivals into the module, which, based on all these inputs, generates a forecast of truck arrivals per hour or per a defined period.
This forecast serves as input to the resource allocation module, which assigns available resources according to priority rules between terminal zones, equipment availability and the number of material and human resources communicated by the operator. The optimization module then calculates the number of appointment slots to be made available for each time window, based on the forecasted arrivals and the number of resources (servers) available.
The appointment booking module allows customers, carriers or freight forwarders to view available appointment slots and to book or cancel appointments for container pickups.
The arrival management module uses real-time truck arrival data to determine the processing order of trucks, based on the management rules defined by the port operator.
Finally, the appointment tracking module provides the port operator and port authority with key performance indicators related to the system’s operation
While numerous studies have proposed TASs to manage terminal access, most rely on static scheduling frameworks that assume stable or predictable truck arrival patterns. These assumptions often hold in dry-port or distribution center contexts but do not reflect the operational realities of container seaports, where truck arrivals are highly dynamic due to ship delays, gate processing variability and urban congestion. As a result, existing TAS models fall short in capturing the complexity of real-time port operations. Our work addresses this gap by introducing a dynamic scheduling approach that models non-stationary arrival patterns using a time-varying queuing system. This model is further enhanced with a hybrid genetic algorithm–tabu search optimization method tailored to adapt to fluctuating gate conditions. This contribution represents a significant step forward in developing TAS models that are both realistic and responsive to seaport-specific challenges.
3. Problem Description
We consider that the CT has one entrance gate with multiple lanes. The number of open gate lanes is controlled by the terminal operator and might change during the day. A truck arrives at the gate at his preferred time, and the truck arrival rate varies by time of day. In this study, we assume that the preferred arrival times and consequently the arrival rate for each time window (hour) are estimated using arrival history. The gate serves trucks on a ”first-come–first-served” policy.
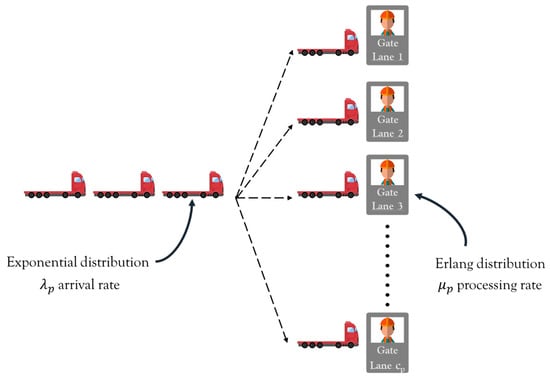
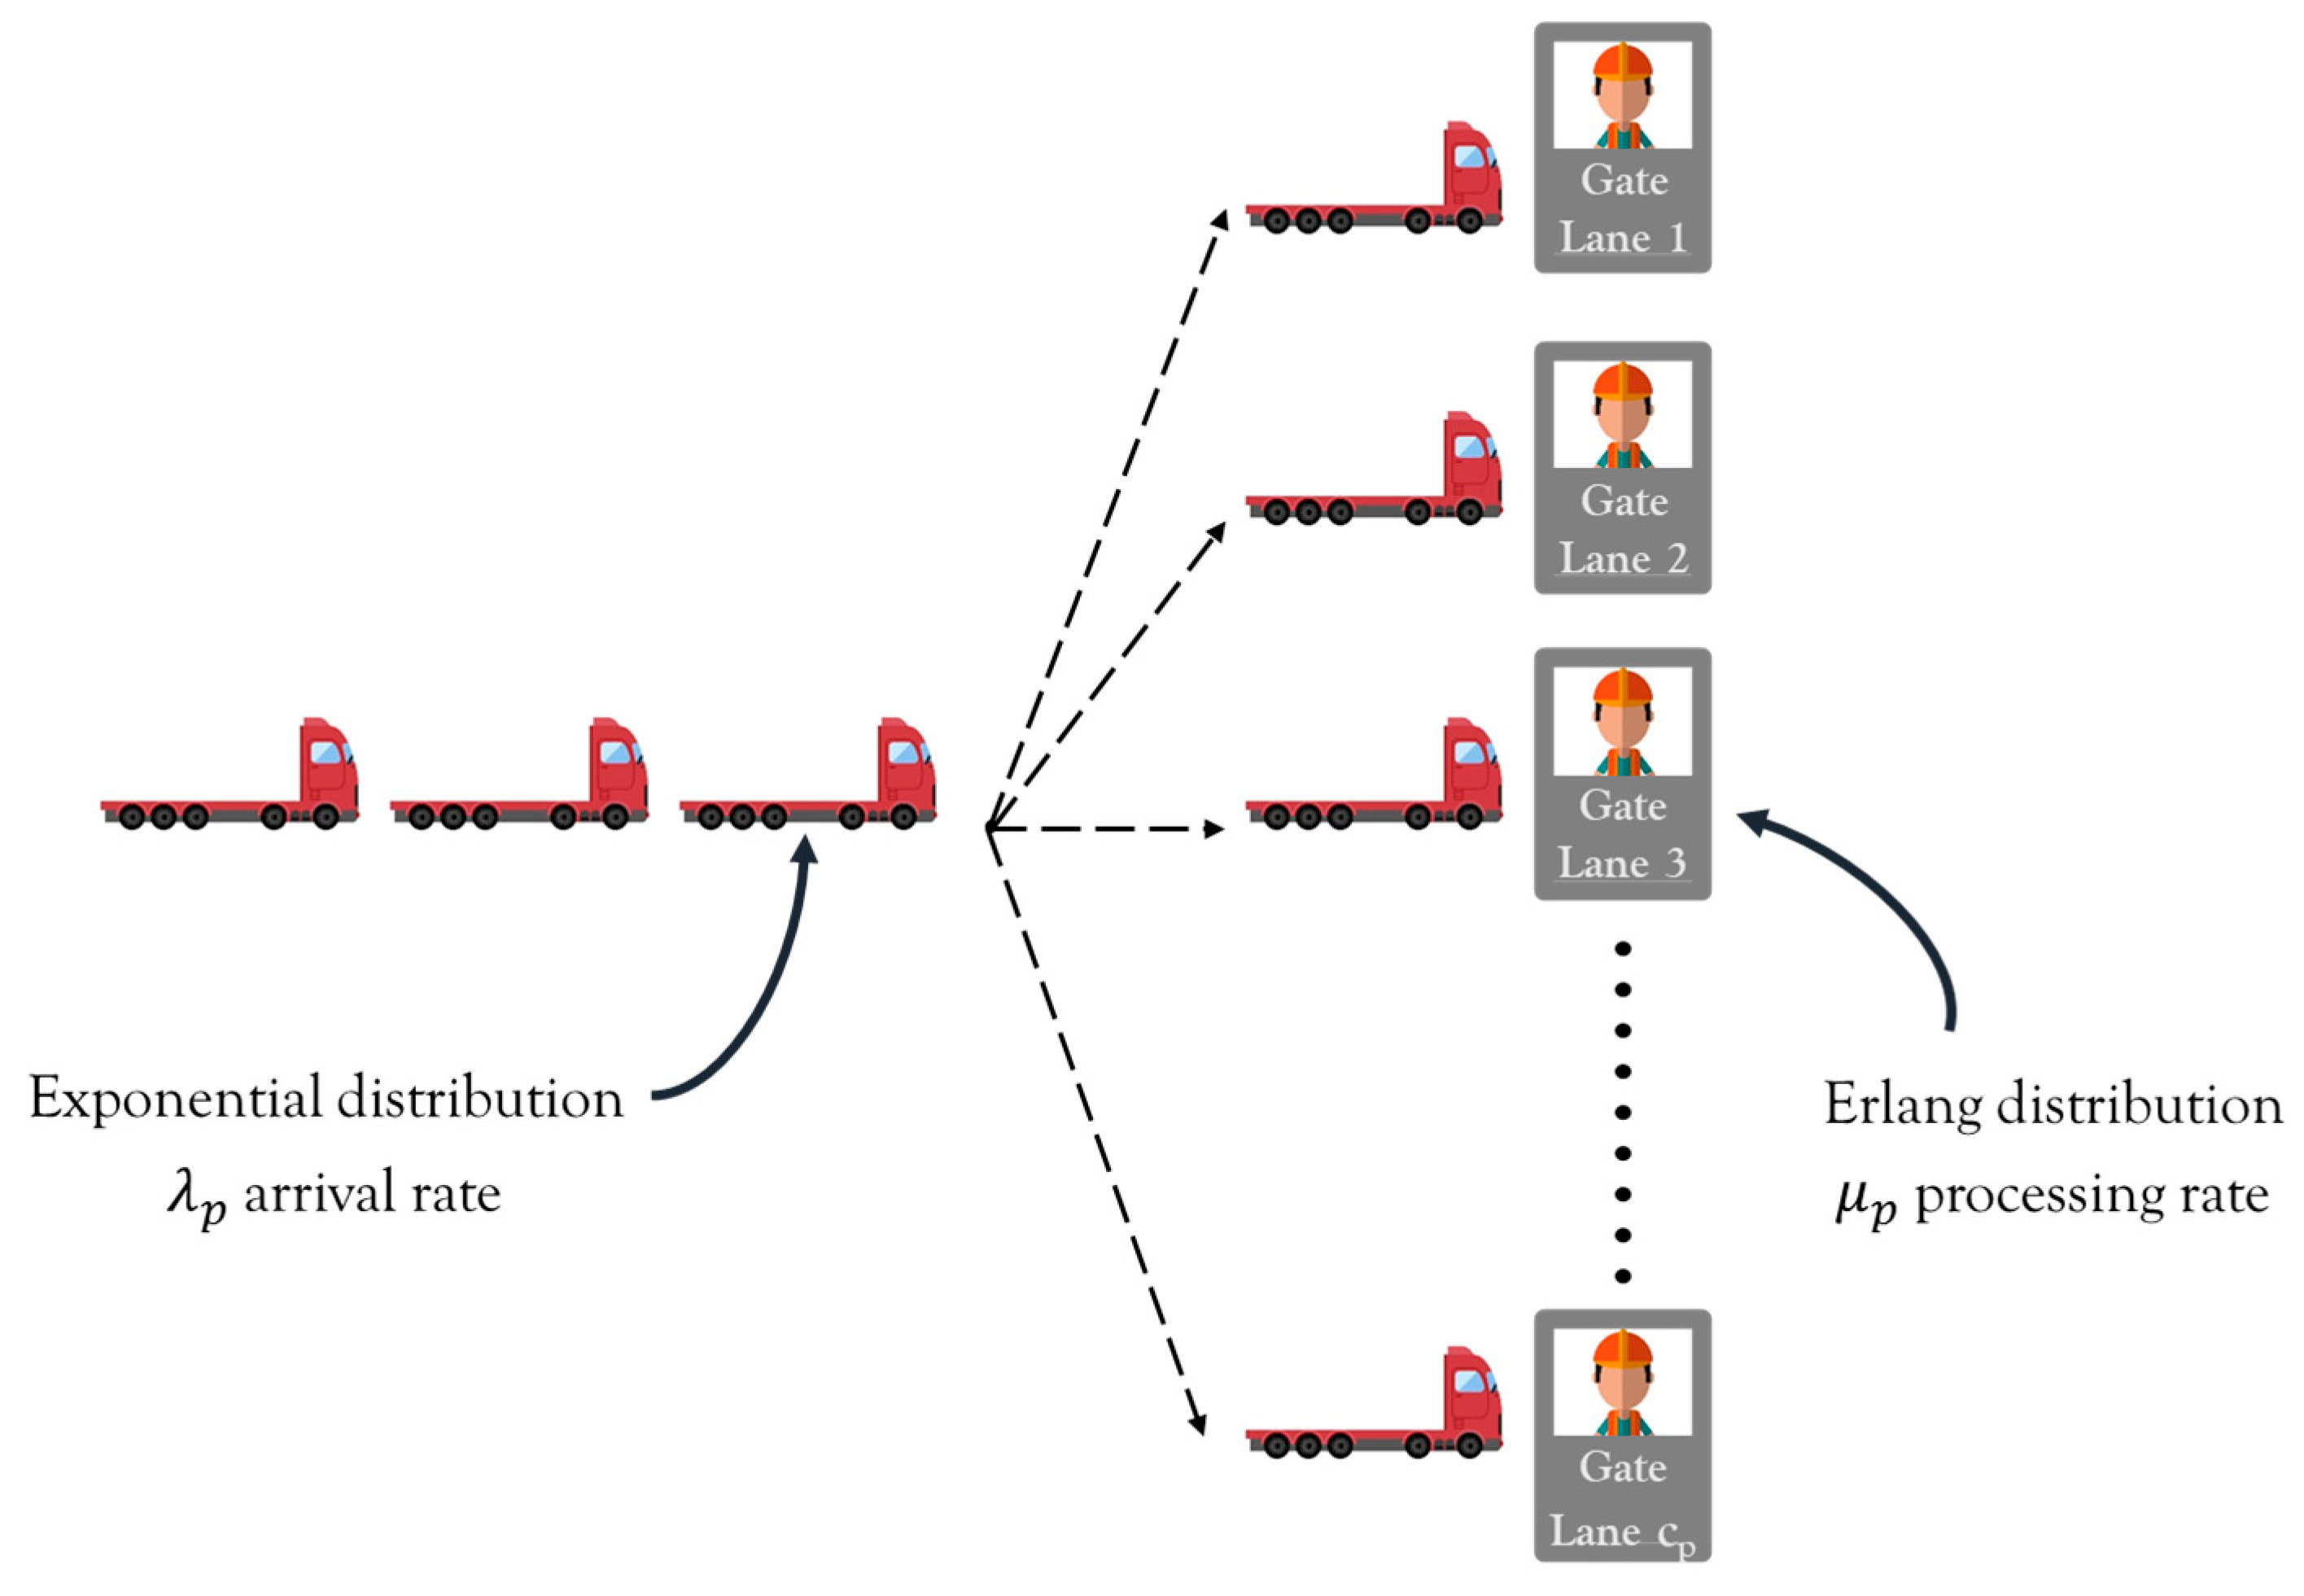
The gate system can be treated as a multi-server non-stationary queuing system [22]. The probability distributions of the truck arrival process and gate service process must be identified through statistical analysis of empirical data. We also assume that truck inter-arrival time follows an exponential distribution and the processing time at the gate follows an Erlang distribution, based on field observations presented previously [29]. Therefore, in this research project, the gate system should be modeled with the non-stationary queuing model. A general illustration is shown in Figure 2 for truck arrival with open gate lanes during the time window .
Figure 2.
Truck arrival process at the gate.
Truck queues often occur at both terminal gate and yard when the rate of truck arrivals exceeds the capacity of servers. Truckers usually keep their engines idling while waiting in a queue, which generates GHG emissions. To reduce these emissions, it is essential to maintain truck waiting time under a certain limit by managing truck arrivals. Shifting some truck arrivals from peaks to off-peaks can balance the demand and service and reduce the waiting time and truck emissions.
Ref. [30] states that under the large-scale numerical example, it is difficult to find the exact solution since its sub-problem involving intra-port and out-of-port scheduling is an NP-hard problem. Therefore, we focus on the gate system in this work.
4. Mathematical Formulation
Our mathematical model uses CT-specific input data and some derived parameters that are calculated from the input parameters and used during the bisection–point-wise stationary fluid flow approximation (B-PSFFA) process.
| Sets and indices | |
| Number of time windows (hour) | |
| Input parameters | |
| (trucks/h) | |
| Erlang distribution of the gate service time | |
| The target level of waiting time at the gate | |
| Derived variables | |
| using the bisection method | |
| Decision variable | |
To estimate truck queue length at the gate, a method based on PSFFA is adopted [31]. This method follows three main steps:
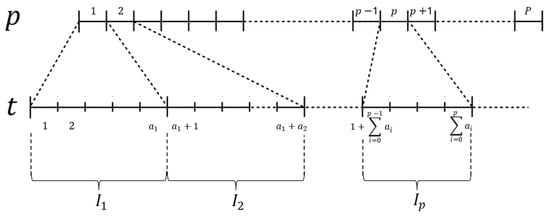
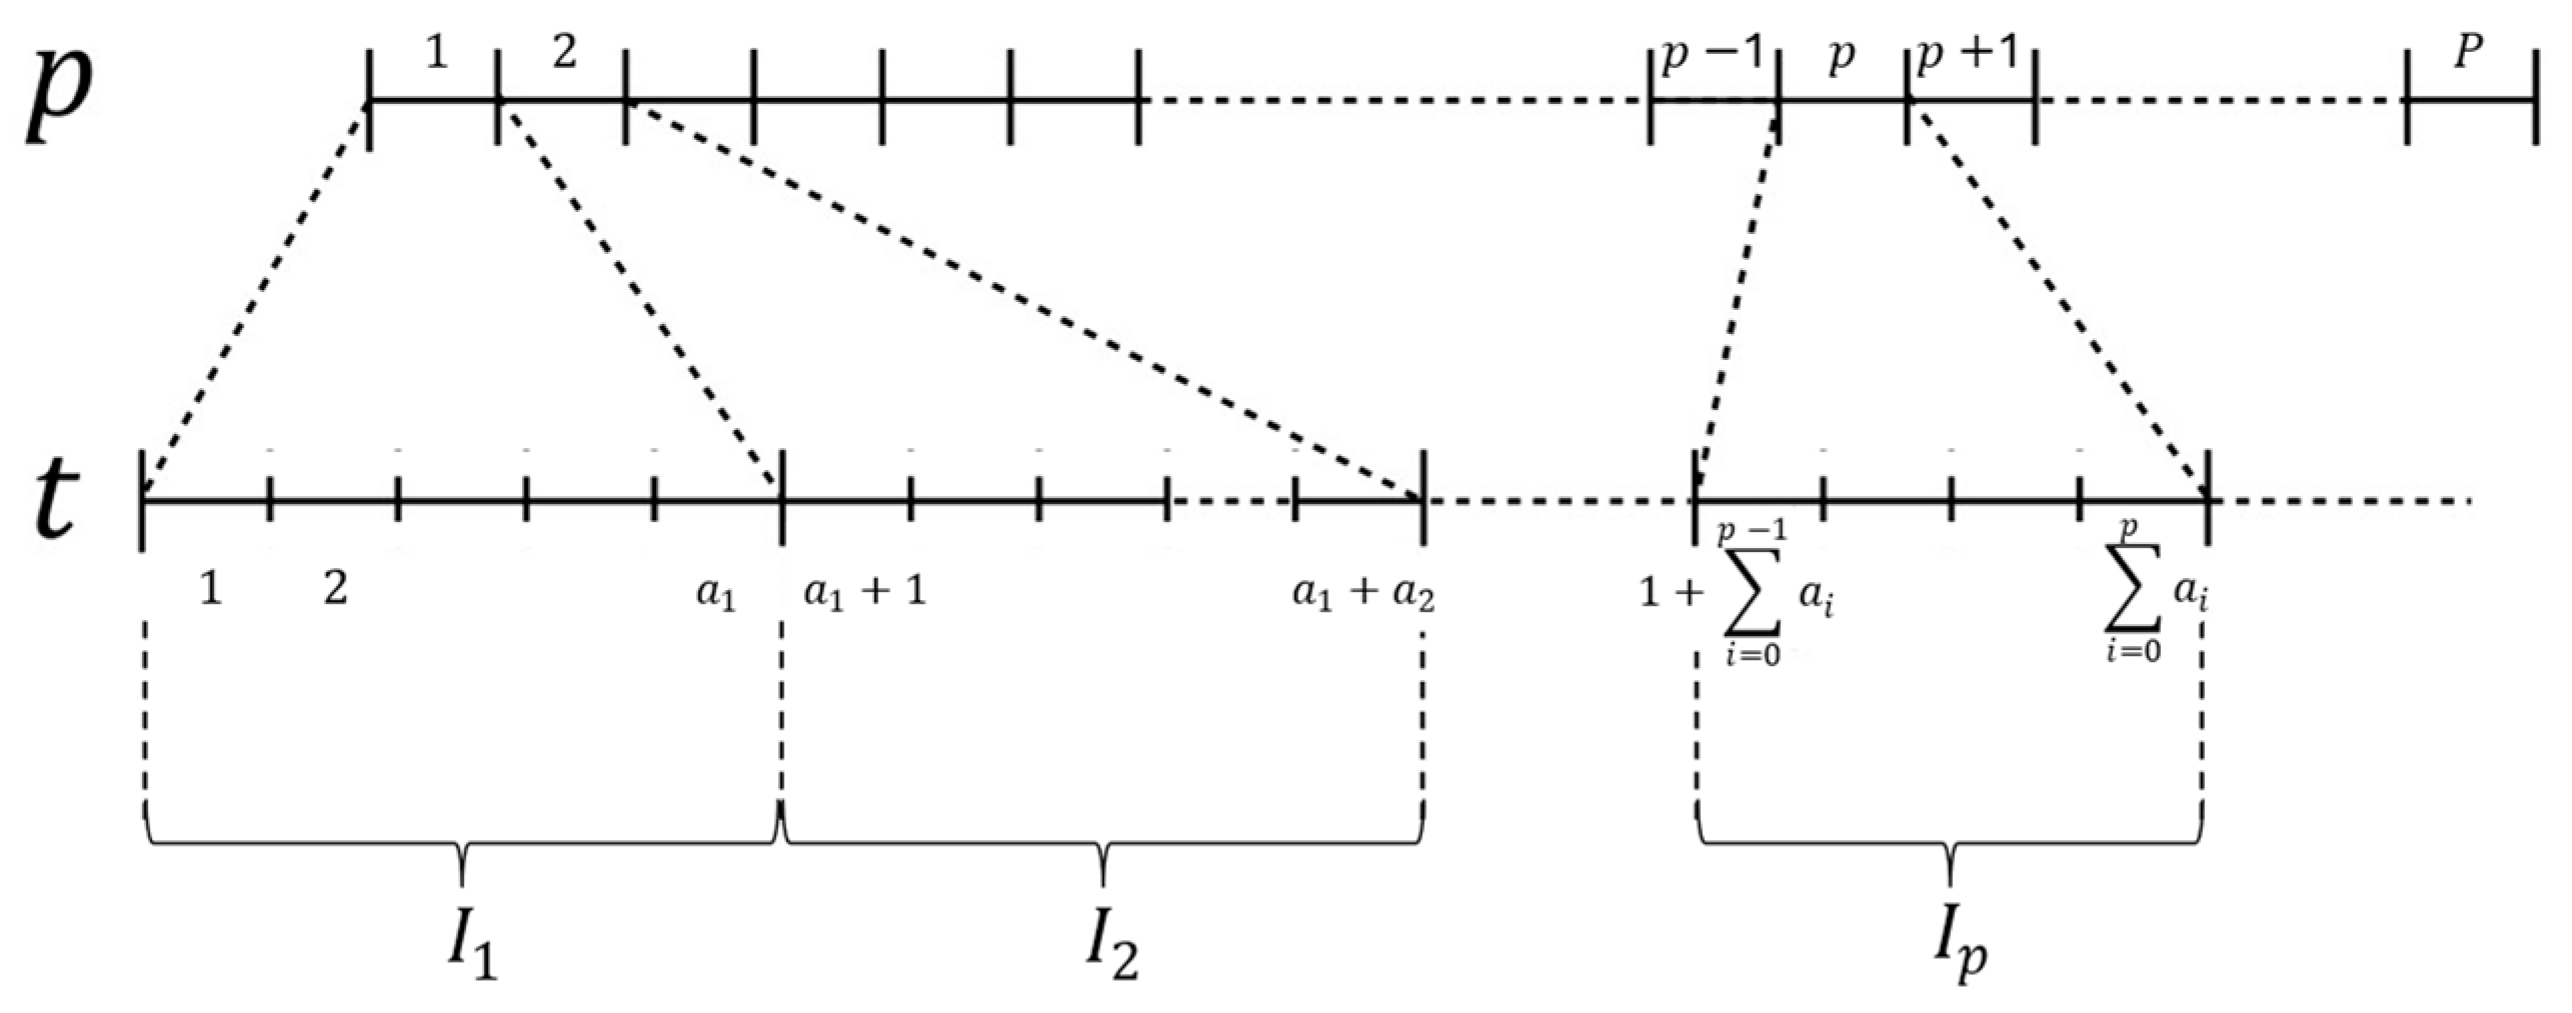
- Divide each time window into shorter periods to apply a stationary approximation. Figure 3 illustrates time window partitioning for non-stationary queuing. The number of time periods is determined based on the gate processing rate , as shown in constraint (1) [21].Figure 3. Time period division.For each time window , the time period index t varies in the interval presented in constraint (2).The arrival and the processing rates for the time period t are calculated based on and , respectively, as shown in constraints (2) and (3).
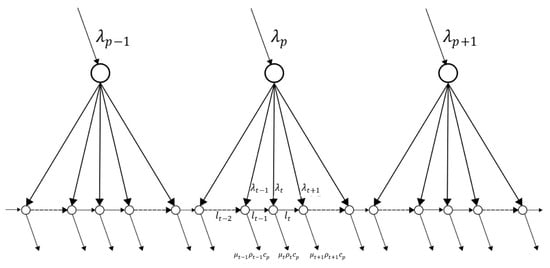
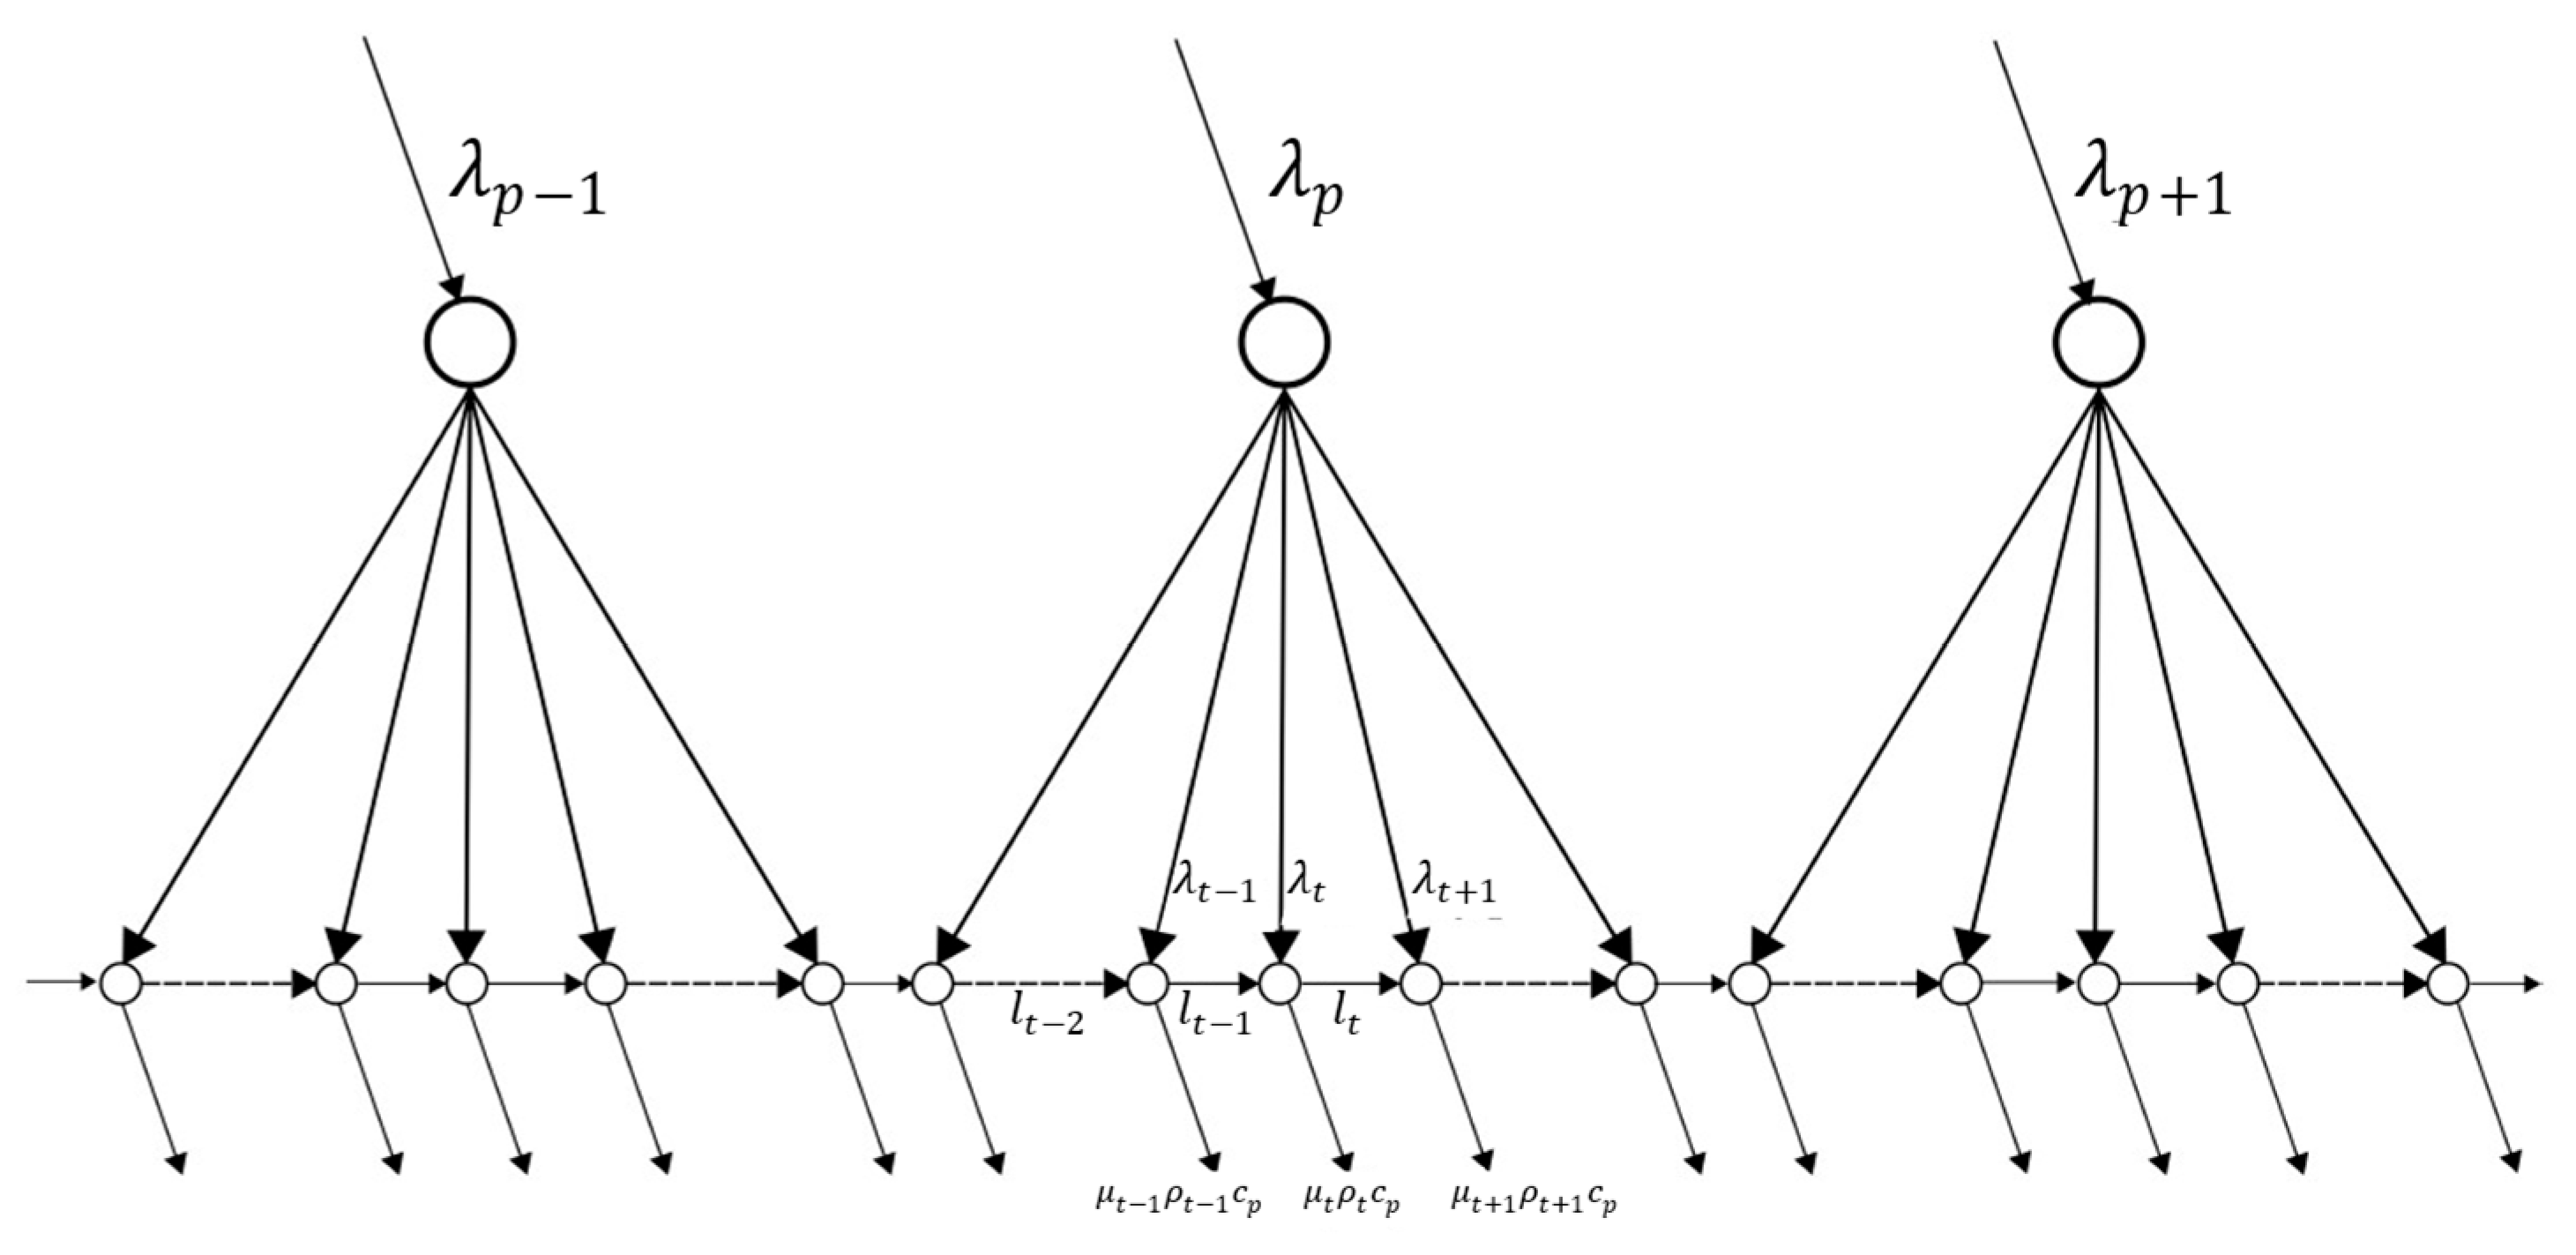
- Calculate the queue length according to the flow conservation principle described in constraint (4). This means that the queue length change is equal to arrivals minus departures, as presented in Figure 4.Figure 4. Flow conservation in the PSFFA process.
- Finally, evaluate the utilization rate with an inverted function of the queue length, as shown in Equation (6). For this model, we use the approximation developed by [32] expressed by constraint (5). This function is difficult to invert. Consequently, we use the bisection method to estimate the utilization rate.
Since is a percentage, we start the bisection method with an interval [a, b] = [0, 1]. To guarantee a maximum absolute error of 0.001 for estimation, bisection needs to be iterated 10 times. Furthermore, to fit the approximation results, a correction factor was introduced to modify the utilization rate . The correction factor is determined through experimentation, as in constraint (7).
Equation (8) presents waiting time estimation based on queue length, divided by departures (. The average waiting time for the time window is calculated using Equation (9).
The estimation method is then integrated into the optimization model to evaluate the performance of the solution in terms of respecting the waiting time limit.
In the current study, the objective function is to minimize the difference between the preferred arrival times and the rescheduled arrival times, noted (Equation (10)). This deviation represents the inconvenience experienced by truckers when their requested arrival times are unavailable. Although all time shifts are treated equally in this formulation, it provides a transparent and interpretable approximation in the absence of detailed contextual data—such as trip distance, planned delivery schedules or road conditions—that would allow for a more differentiated treatment of inconvenience. The optimization ensures that all the trucks are scheduled to arrive on the same day (Equation (11)) without exceeding a specific threshold for the truck’s waiting time at the gate (Equation (13)). Queuing time is calculated using B-PSFFA, noted , in Equation (14). This means that Equations (1)–(9) are used for instead of . It is also assumed that the appointment number should be a positive integer (Equation (12)).
5. Problem Resolution
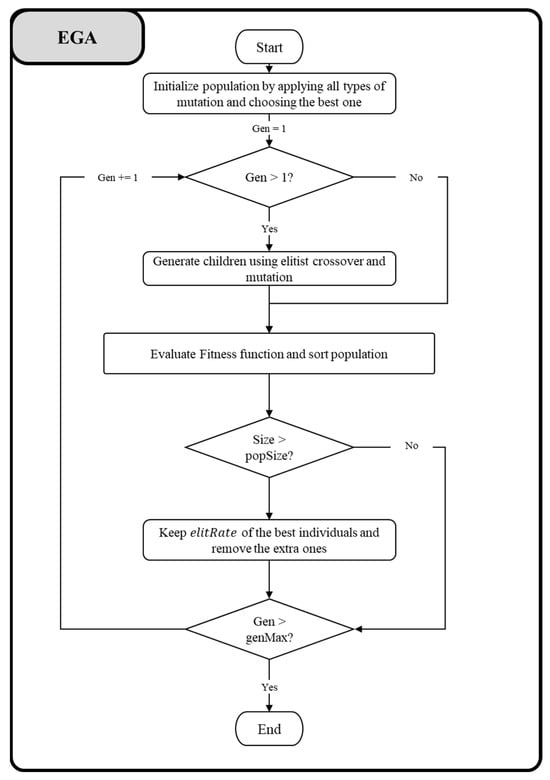
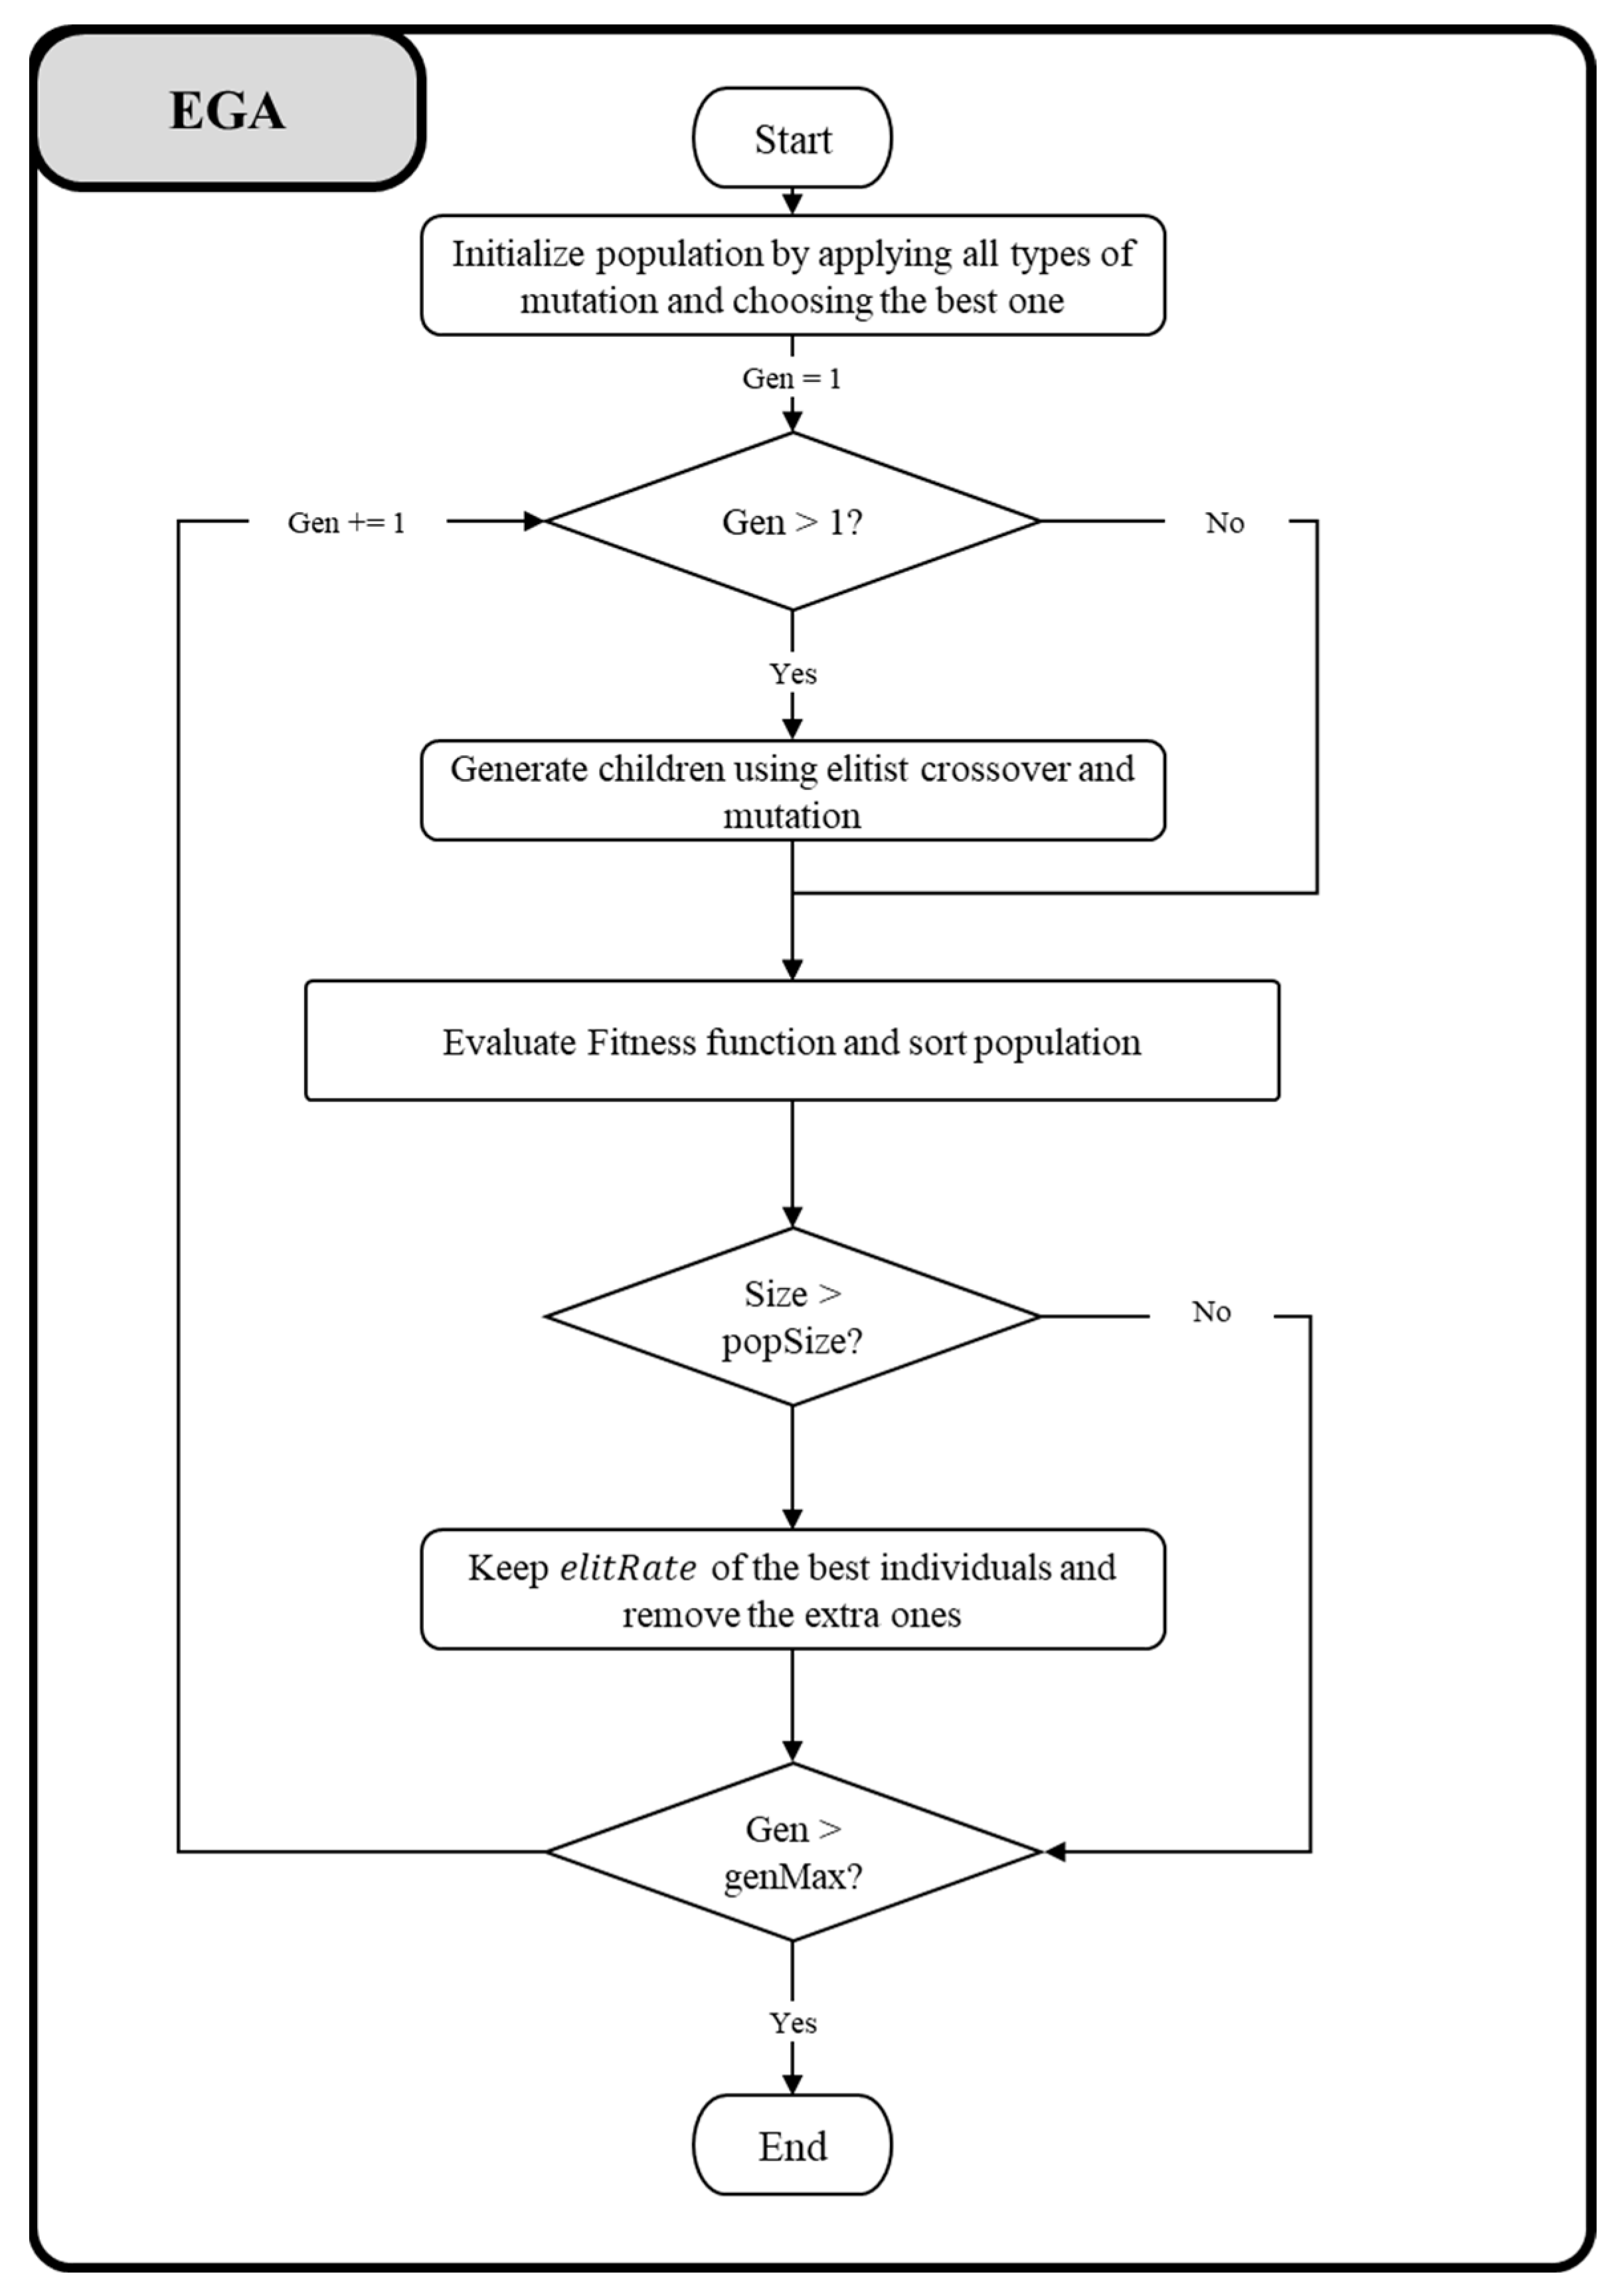
This problem is known to be NP-hard [22,30]. In terms of optimization algorithms used for truck arrival planification, the GA is the main metaheuristic one adopted [33]. Furthermore, the GA can also be combined with a tabu search (TS) algorithm to avoid local optima [34]. To the best of our knowledge, this study remains the first hybridization of GA and TS for truck appointment scheduling and definition of the optimal distribution of truck arrivals at a CT that reduces truckers’ dissatisfaction. In this research, we use three variants of the GA: elitist GA (EGA), travel time to history GA (TTH-EGA) hybrid GA and TS (TTH-EGA-TS).
The EGA differs from the classical version by the principle of elitism. We introduce this principle, in the initial generation, selection and mutation methods, and indirectly in the crossover method (Figure 5).
Figure 5.
EGA algorithm process.
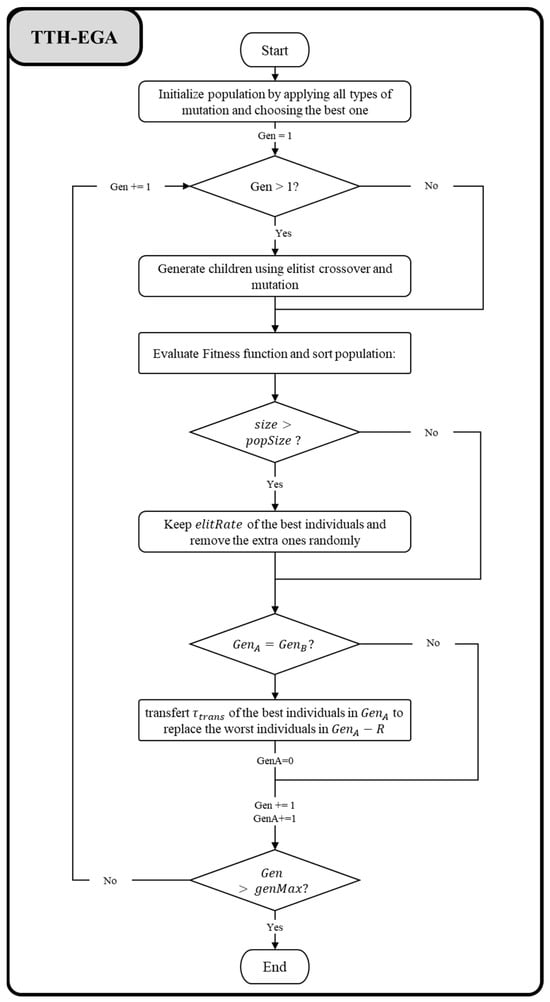
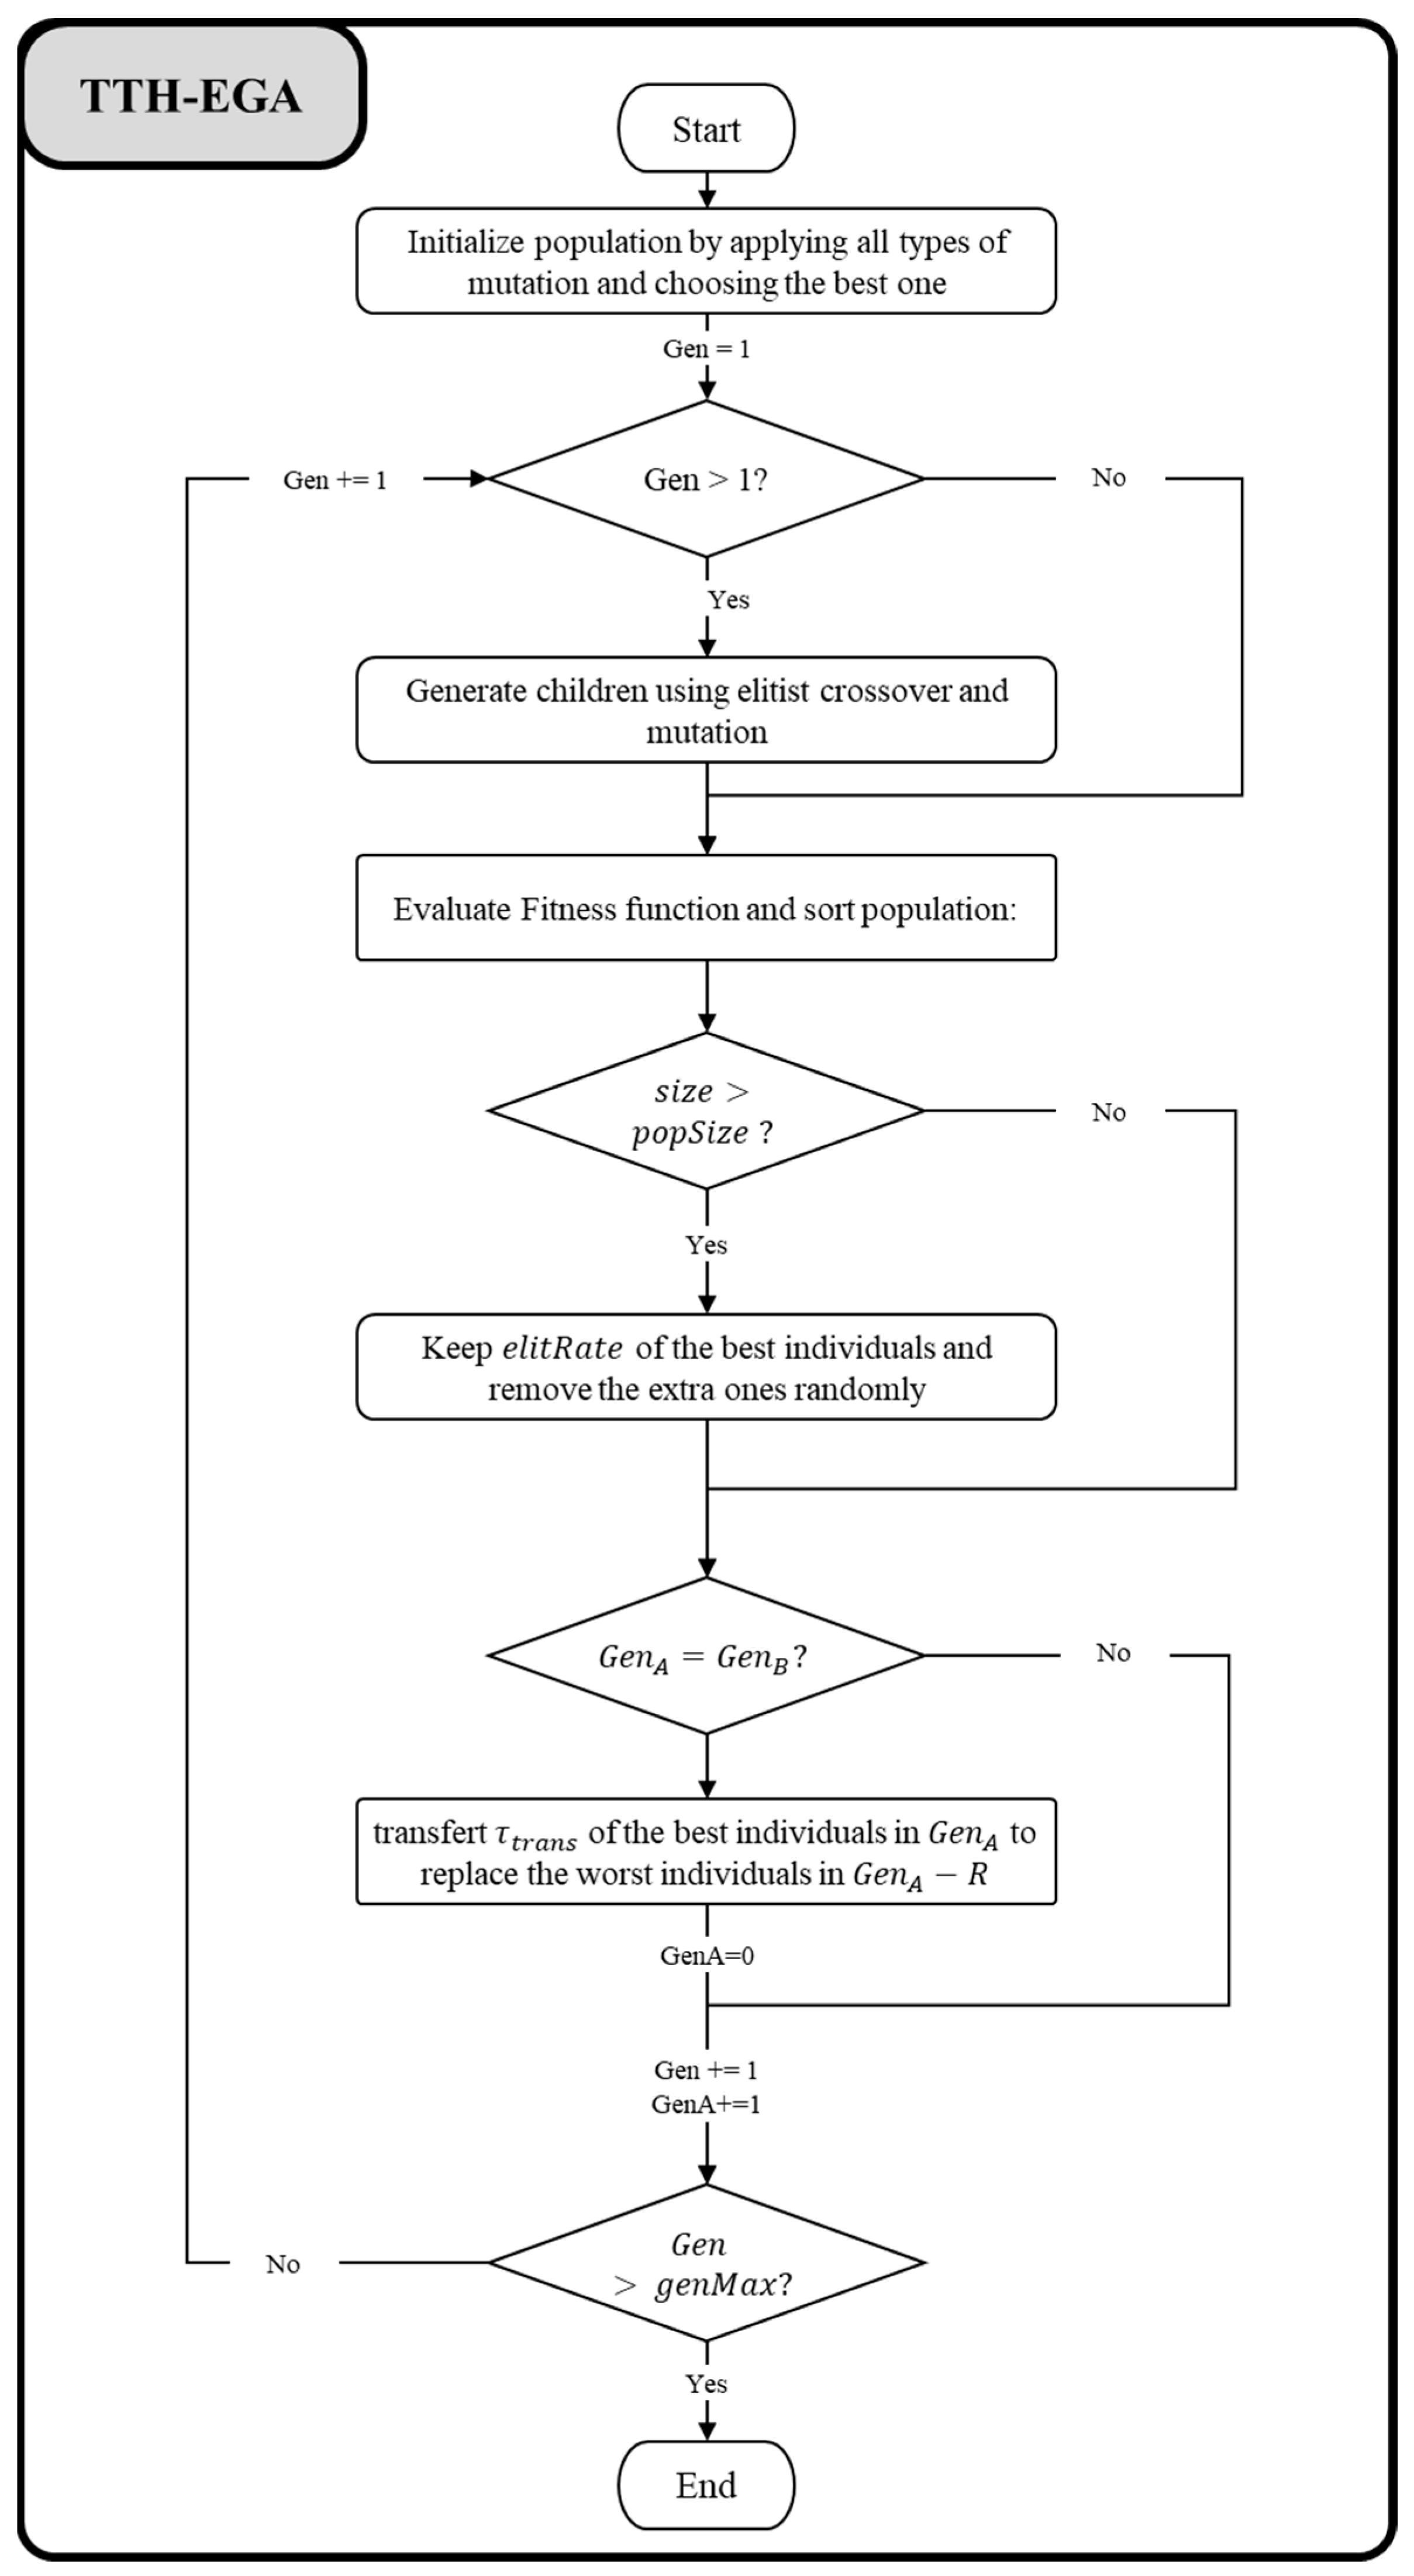
The TTH is based on the concept of time travel [35]. Its principle is based on the idea of going back in time and allowing the solutions to travel to a previous generation. To this end, some modifications are made to the elitist GA: when a criterion, called the travel criterion is met, some solutions are selected from one generation to be transferred to a few generations before. This procedure is repeated until the algorithm’s stopping criterion is met. The main specific parameters to the proposed TTH-EGA presented in Figure 6 encompass the following features:
Figure 6.
TTH-EGA algorithm process.
- Travel criterion: Once the criterion is met, the travel process is started. In this study, the travel criterion is a generation counter (). The criterion is fulfilled when the generation counter reaches a predefined number denoted .
- Transfer rate: It determines the rate of the best solutions of the current generation that should travel to previous generations.
- Number of generations to travel back: This parameter determines the number of generations that the solutions should travel back. In other words, when is the index of the current generation, then the selected solutions should travel back to the generation . In this case, a number equal to of the worst solutions of the generation are discarded and replaced by the selected solutions.
The GA has achieved good results in solving many different types of optimization problems. However, one of its major shortcomings is that it cannot make full use of the feedback information of the system and converges to the local optimal solution prematurely, resulting in premature convergence of the algorithm [34]. On the other hand, the TS excels at performing deeper exploitation because of its forbidden move’s strategy [36]. Given their diversification and intensification capabilities, the GA and TS are hybridized to achieve a good balance between exploration and exploitation.
The TS algorithm was originally proposed by [37] to allow local search methods to escape local optima. The fundamental principle of TS is to continue the search encountering a local optimum by permitting non-improving moves. To prevent cycling back to previously visited solutions, TS employs memory structures known as tabu lists, which record the recent history of the search. This is core concept that can be linked to artificial intelligence concepts [38].
Many hybrid GAs, obtained in combination with TS, are available in the literature [39,40]. To the best of our knowledge, however, there has been no attempt to integrate GAs with TS to solve the truck appointment problem. To this end, this study proposes a hybrid algorithm that integrates TS into the elitist GA with time travel to history (TTH-GA-TS) to address the problem.
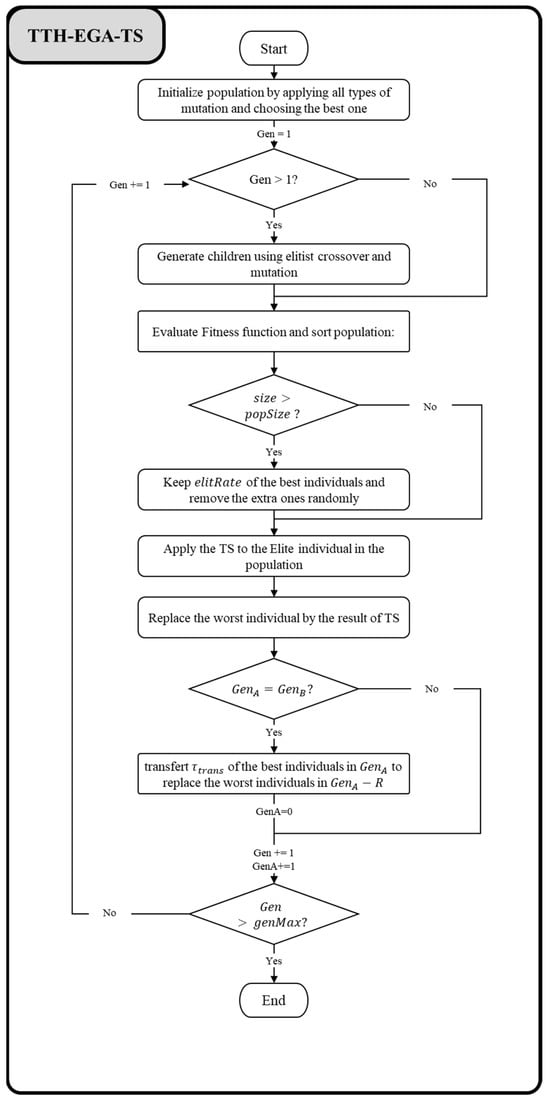
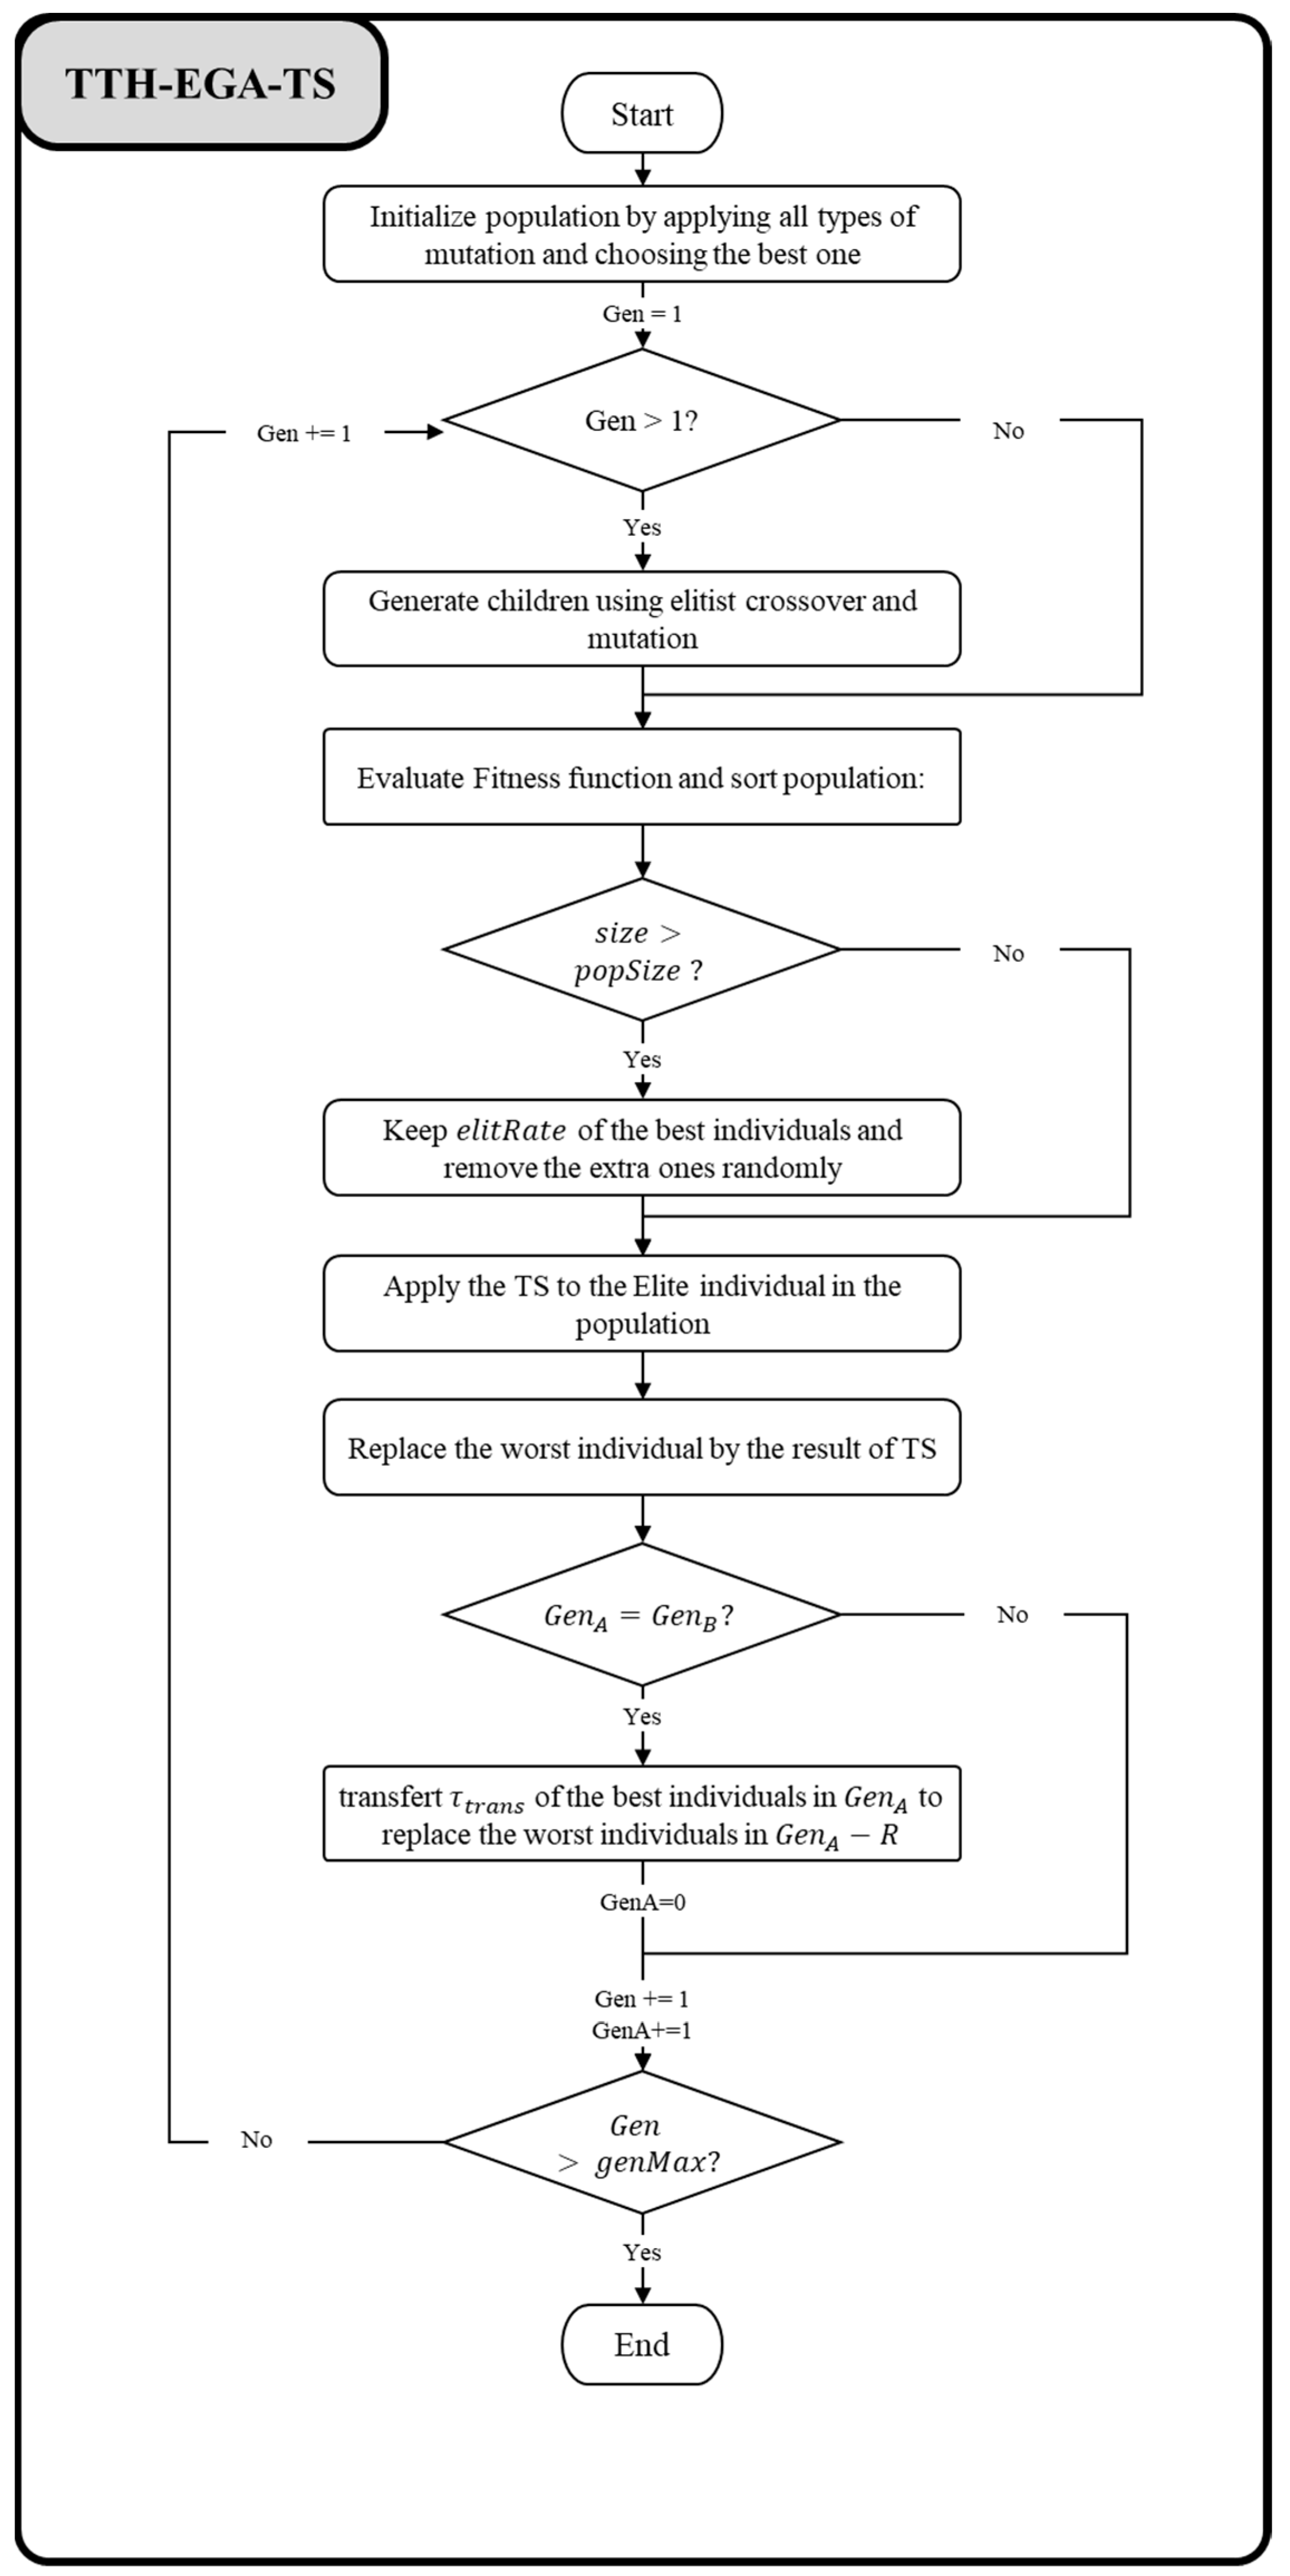
As shown in Figure 7, TS is applied to the elite individual of each generation, which corresponds to the worst-performing solution in the population.
Figure 7.
TTH-EGA-TS algorithm process.
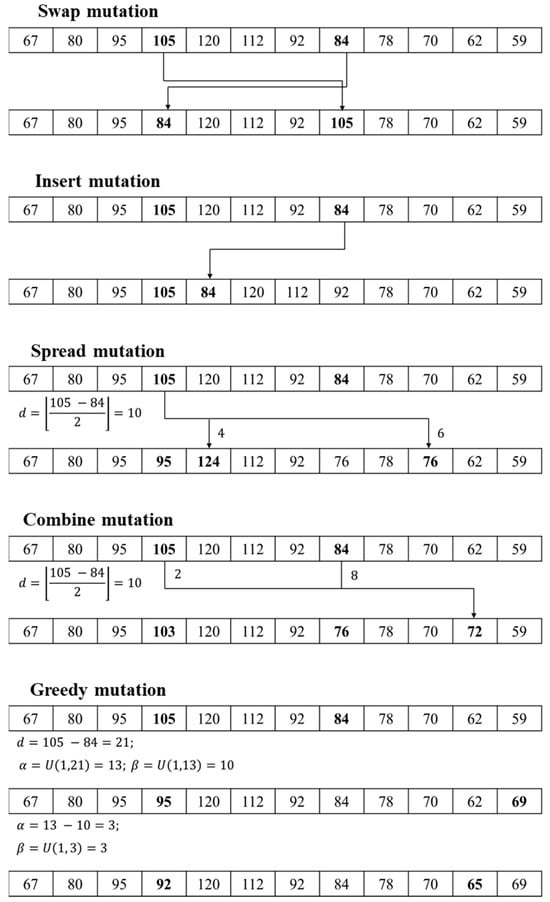
The TS process begins with the elite solution, which undergoes a local search procedure that generates candidate solutions by applying the four basic mutation operators: swap, insert, spread and combine. These operators perturb the current solution by redistributing and combining its elements. Fitness evaluations guide the selection of solutions throughout the process.
The algorithm incorporates a tabu tenure matrix to maintain a list of recently visited moves, preventing immediate revisitation and encouraging exploration. At each iteration, the best feasible solution is updated, with the tabu list dynamically adjusted.
For all the algorithms, a solution consists of an array of integers whose length corresponds to the time window’s number . As illustrated in Figure 8, each element in the array denotes the appointment number assigned to the corresponding time window [21].
Figure 8.
Structure of a chromosome.
The fitness function of an individual k is the maximum value of the objective function in the population divided by the value of the objective function of individual , noted , as shown below:
The initial population is generated using mutation operators. For each individual, we apply five mutation operators: swap, insert, spread, combine and greedy [22]. The best individual is included in the population. The process is repeated until the maximum number of individuals per generation is reached.
In this study, we use an elitist selection method. Instead of using the roulette wheel selection to select two individuals at each iteration, only one individual is selected with this method whereas the other one corresponds to the elite of the population.
After the selection process, the crossover operator is applied with a (predetermined) probability on each pair and generates the pair of offspring .
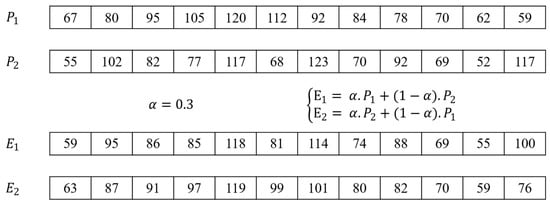
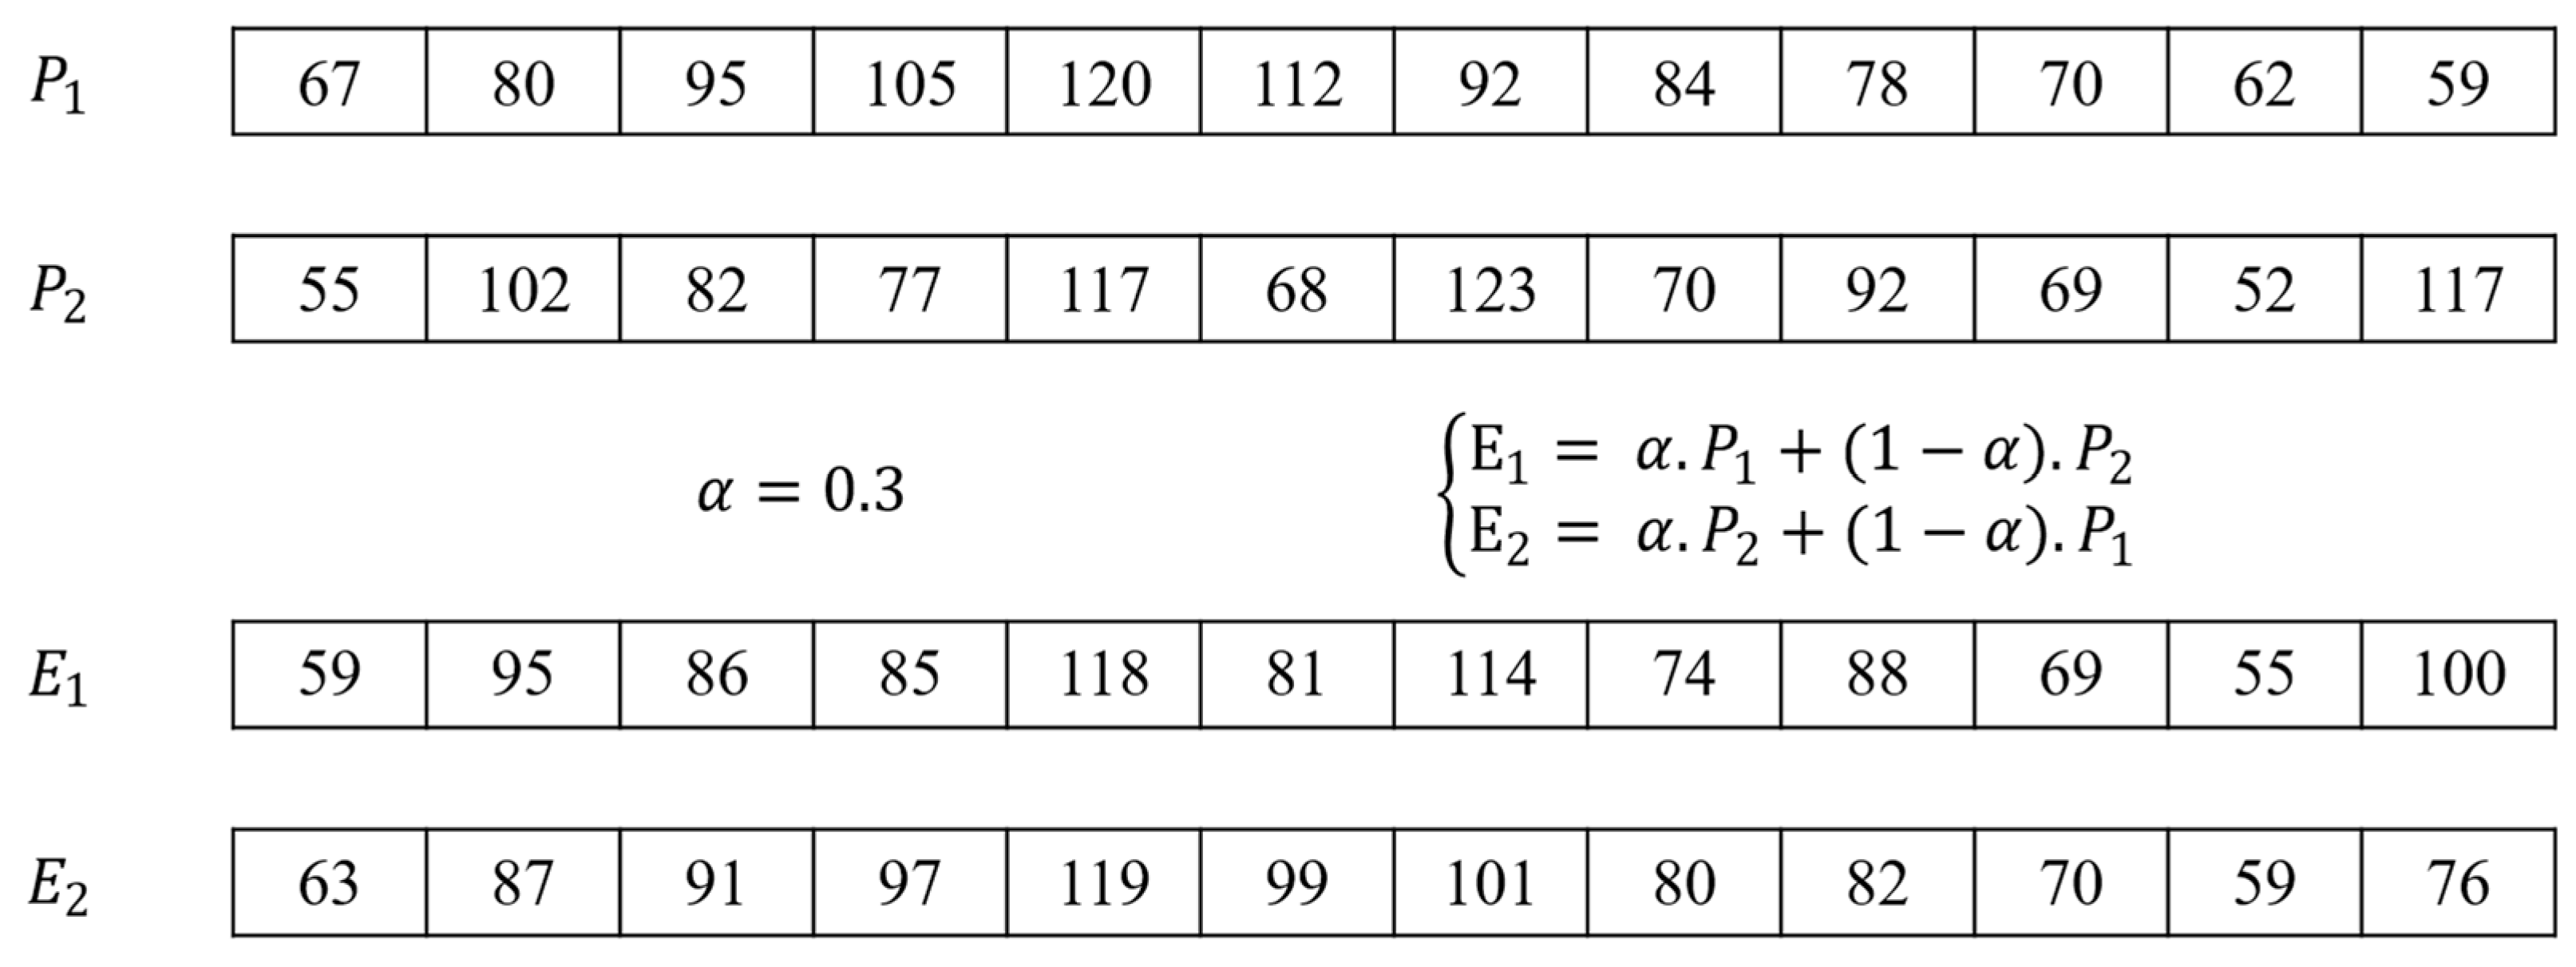
Popular crossover methods such as single-point and uniform crossover are not suitable for our problem. The reason is that the children are generally invalid in terms of the total number of truck arrivals. We opted for the arithmetic crossover presented in Figure 9.
Figure 9.
Arithmetic crossover.
A parameter is randomly generated and the children are defined by the equation below:
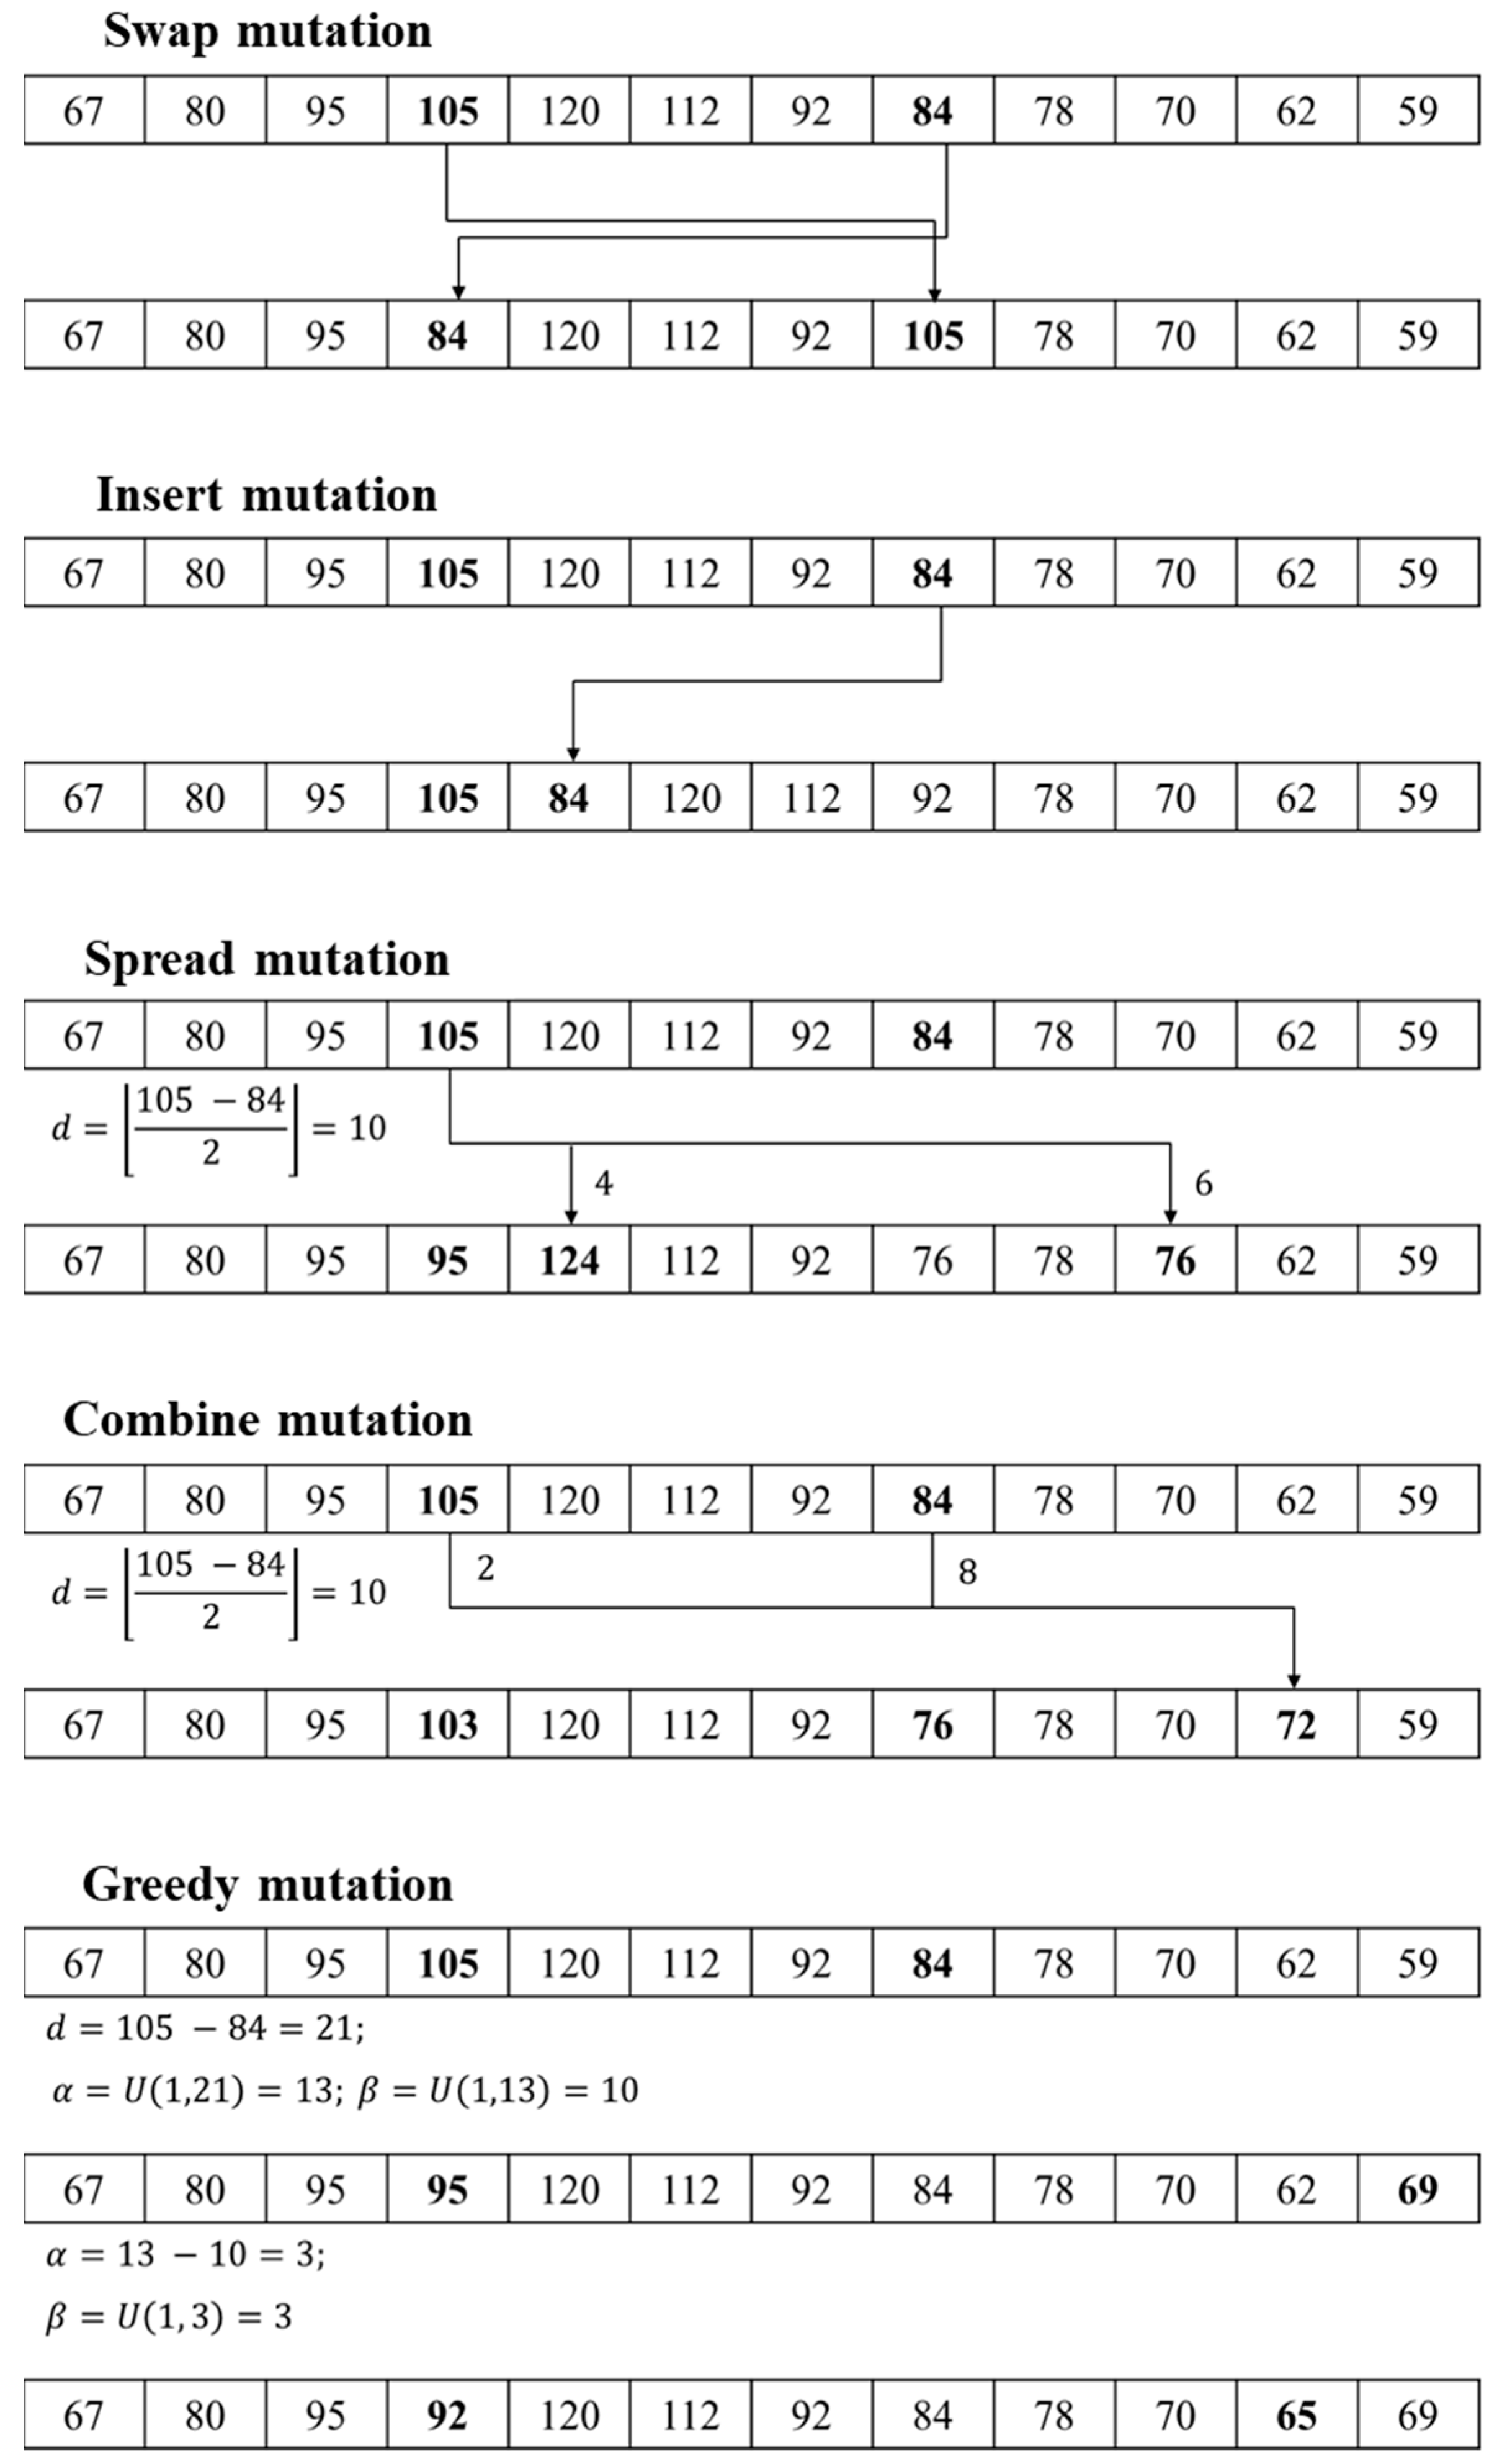
As the selection method is elitist, the best solution is crossed with another one chosen by the roulette wheel selection at each iteration. We use an elitist mutation that consists of generating five solutions by applying all mutation methods: swap, insert, spread, combine and greedy and selecting the best one. The mutation methods used are presented in Figure 10.
Figure 10.
Mutation operators.
To run our GA, the following parameters must be set: population size and number of iterations to 50 and elitism rate to 5%; the mutation operator and rate were fixed (spread and 0.6) based on the study reported in [31], and three crossover rates (0; 0.3; 0.7) were chosen based on numerical experiments. Table 1 summarizes the main parameters used in this work.
Table 1.
Algorithm parameters.
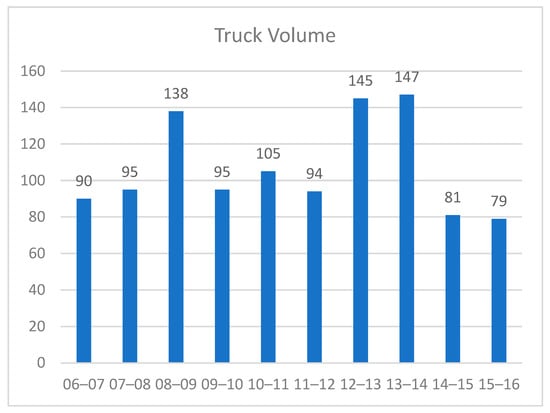
To calibrate the proposed model, data from [29] are used. Then, the time between truck arrivals follows the exponential distribution, and the service time at the entrance gate obeys the Erlang distribution with a shape parameter and a mean of min. The terminal opens for 10 h (from 06:00 to 16:00). On a given day, 1069 trucks arrive at the terminal. The arrival pattern, presented in Figure 11, shows two peaks: the first in the morning and the second in the early afternoon. We assume that the number of lanes available is five for the whole day. The waiting time limit is 10 min.
Figure 11.
Truck arrivals distribution.
6. Results and Discussion
Using 40 different scenarios developed by [22], the comparison of the performance of the different algorithms shows that they all have the same capacity with differences in demand. These scenarios were based on the arrival model of [29], which has a first peak in the morning and a second in the early afternoon. Whereas the first scenario is the original arrivals model of [29], the other 39 demand-scenarios are generated with an increase in the total number of arrivals and the opening hours of the terminal. The opening hours vary between 10, 12, 18 and 24 h. The average total number of arrivals is 1000, 1200, 1800 and 2500 vehicles, respectively. Since these numerical experiments are based on synthetic data, they cannot fully represent real-world cases. Waiting time limits were set to 7.5, 10 or 12.5 min depending on the average truck arrivals.
All experiments in this study are evaluated on a PC with Intel® Core™ i5-3210M CPU @2.50 GHz and a memory of 8.00 GB.
The three variants of the GA (EGA, TTH-GA and the hybrid algorithm TTH-GA-TS) were compared. Using a crossover rate of 0, 0.3 and 0.7, and a mutation rate of 0.6, three configurations which are coded as were selected for each algorithm [31]. Each algorithm runs each scenario 20 times (replications). Objective function values and processing time were considered in data collection and analysis using the following key performance indicators.
- Best objective function value ();
- Worst objective function value ();
- Average of the objective function values ();
- Standard deviation of objective function values ();
- Average processing time (.
These indicators were converted into percentage of the best obtained value () to compare the different algorithms for all scenarios.
The following section presents a comparison of the results obtained by all the tested algorithms based on the previously defined performance indicators. High percentages are highlighted in bold, while lower values are indicated with a gray background.
To perform these tests, we empirically determined the upper bound by running our algorithms on multiple instances. This bound is the best solution obtained across all tests.
Table 2 presents the results of the best value of the objective function indicating good performance of EGA. The hybrid one generates unstable and mixed results penalizing its average. Thus, the EGA algorithm is selected, precisely with the configuration 0.7–0.6.
Table 2.
Best value of objective function.
Table 3 shows the results of the worst-case objective function. Accordingly, the hybrid algorithm outperforms the performance of the others’ GA as it generates stable results and does not go below 76%. In contrast to its performance in terms of the best objective function value, the EGA shows performance below 70% for several scenarios.
Table 3.
Worst value of objective function.
The results of the mean value of the objective function are presented in Table 4. The hybrid algorithm outperforms for the first 30 scenarios. However, the EGA produces more stable results and ultimately achieves better overall performance.
Table 4.
Mean value of objective function.
Table 5 shows the result of the standard deviation of the objective function. It is clear that the hybrid algorithm far exceeds the others. The integration of the TS reduced the variation in the results of the algorithm.
Table 5.
Standard deviation of objective function.
Table 6 highlights the processing time in minutes. For this indicator, the hybrid algorithm is always the worst as its processing time exceeds 16 min for 24 h scenarios. Compared to the other algorithms, it does not exceed 6%. On the other hand, the EGA with mutation only always presents the best performance in terms of time. For all algorithms, it is clear that the performance in terms of time is affected by the crossover rate.
Table 6.
CPU time in minutes.
Overall, the elitist genetic algorithm (EGA), especially the configuration with a 0.7 crossover rate, offers the best trade-off between performance and processing time. While the hybrid TTH-GA-TS model excels in solution stability, its longer computation times reduce its practical efficiency in time-sensitive contexts. These findings suggest that EGA is better suited for deployment in real-world port terminals where rapid scheduling adjustments are needed.
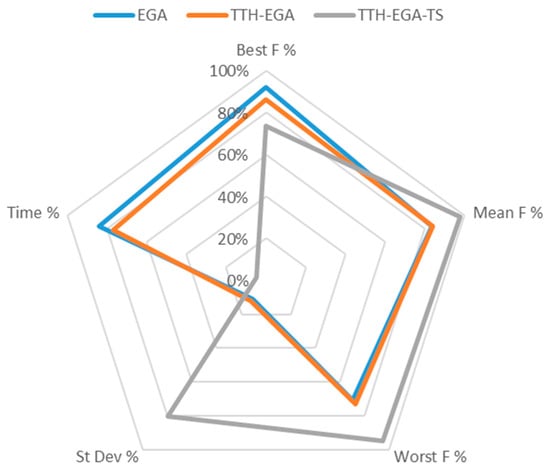
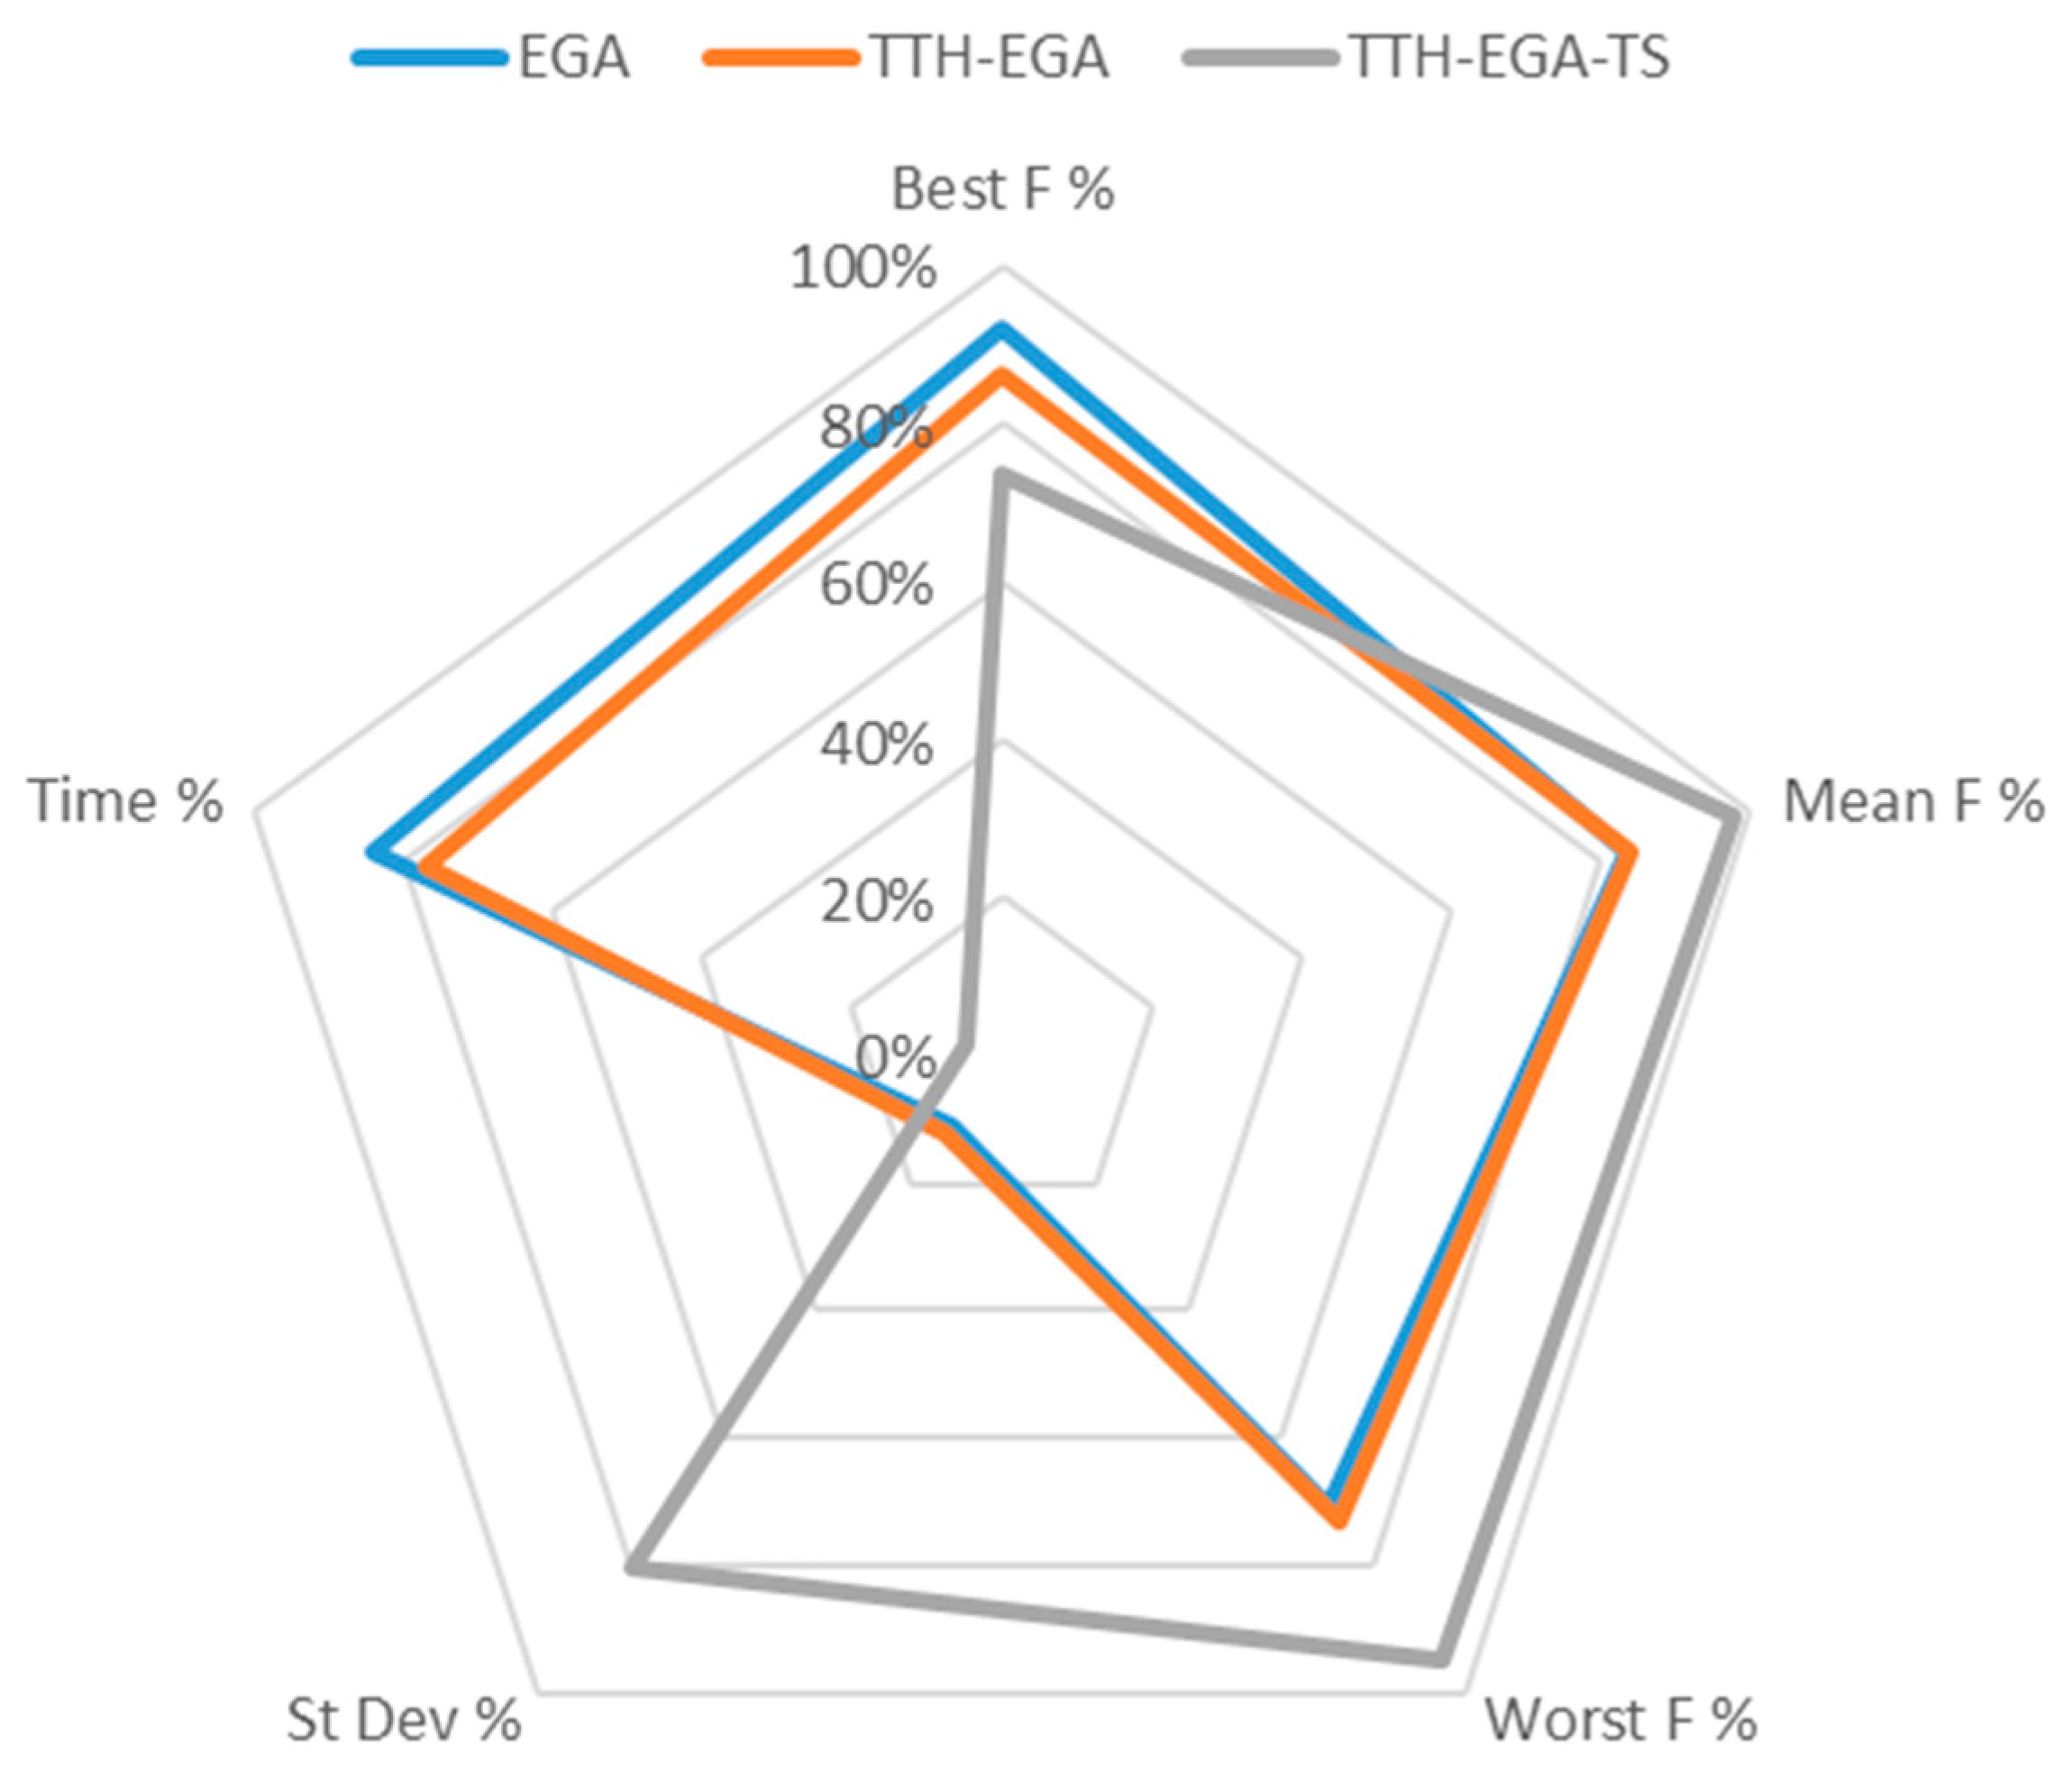
Figure 12 summarizes the overall performance of the three algorithm categories. The EGA shows the best performance in terms of the and . The TTH-EGA improves slightly , and at the expense of and . The hybrid algorithm significantly increases the , providing more stable results with the best result for , and good performance in terms of . However, it is time-consuming in terms of .
Figure 12.
Overall algorithm performance.
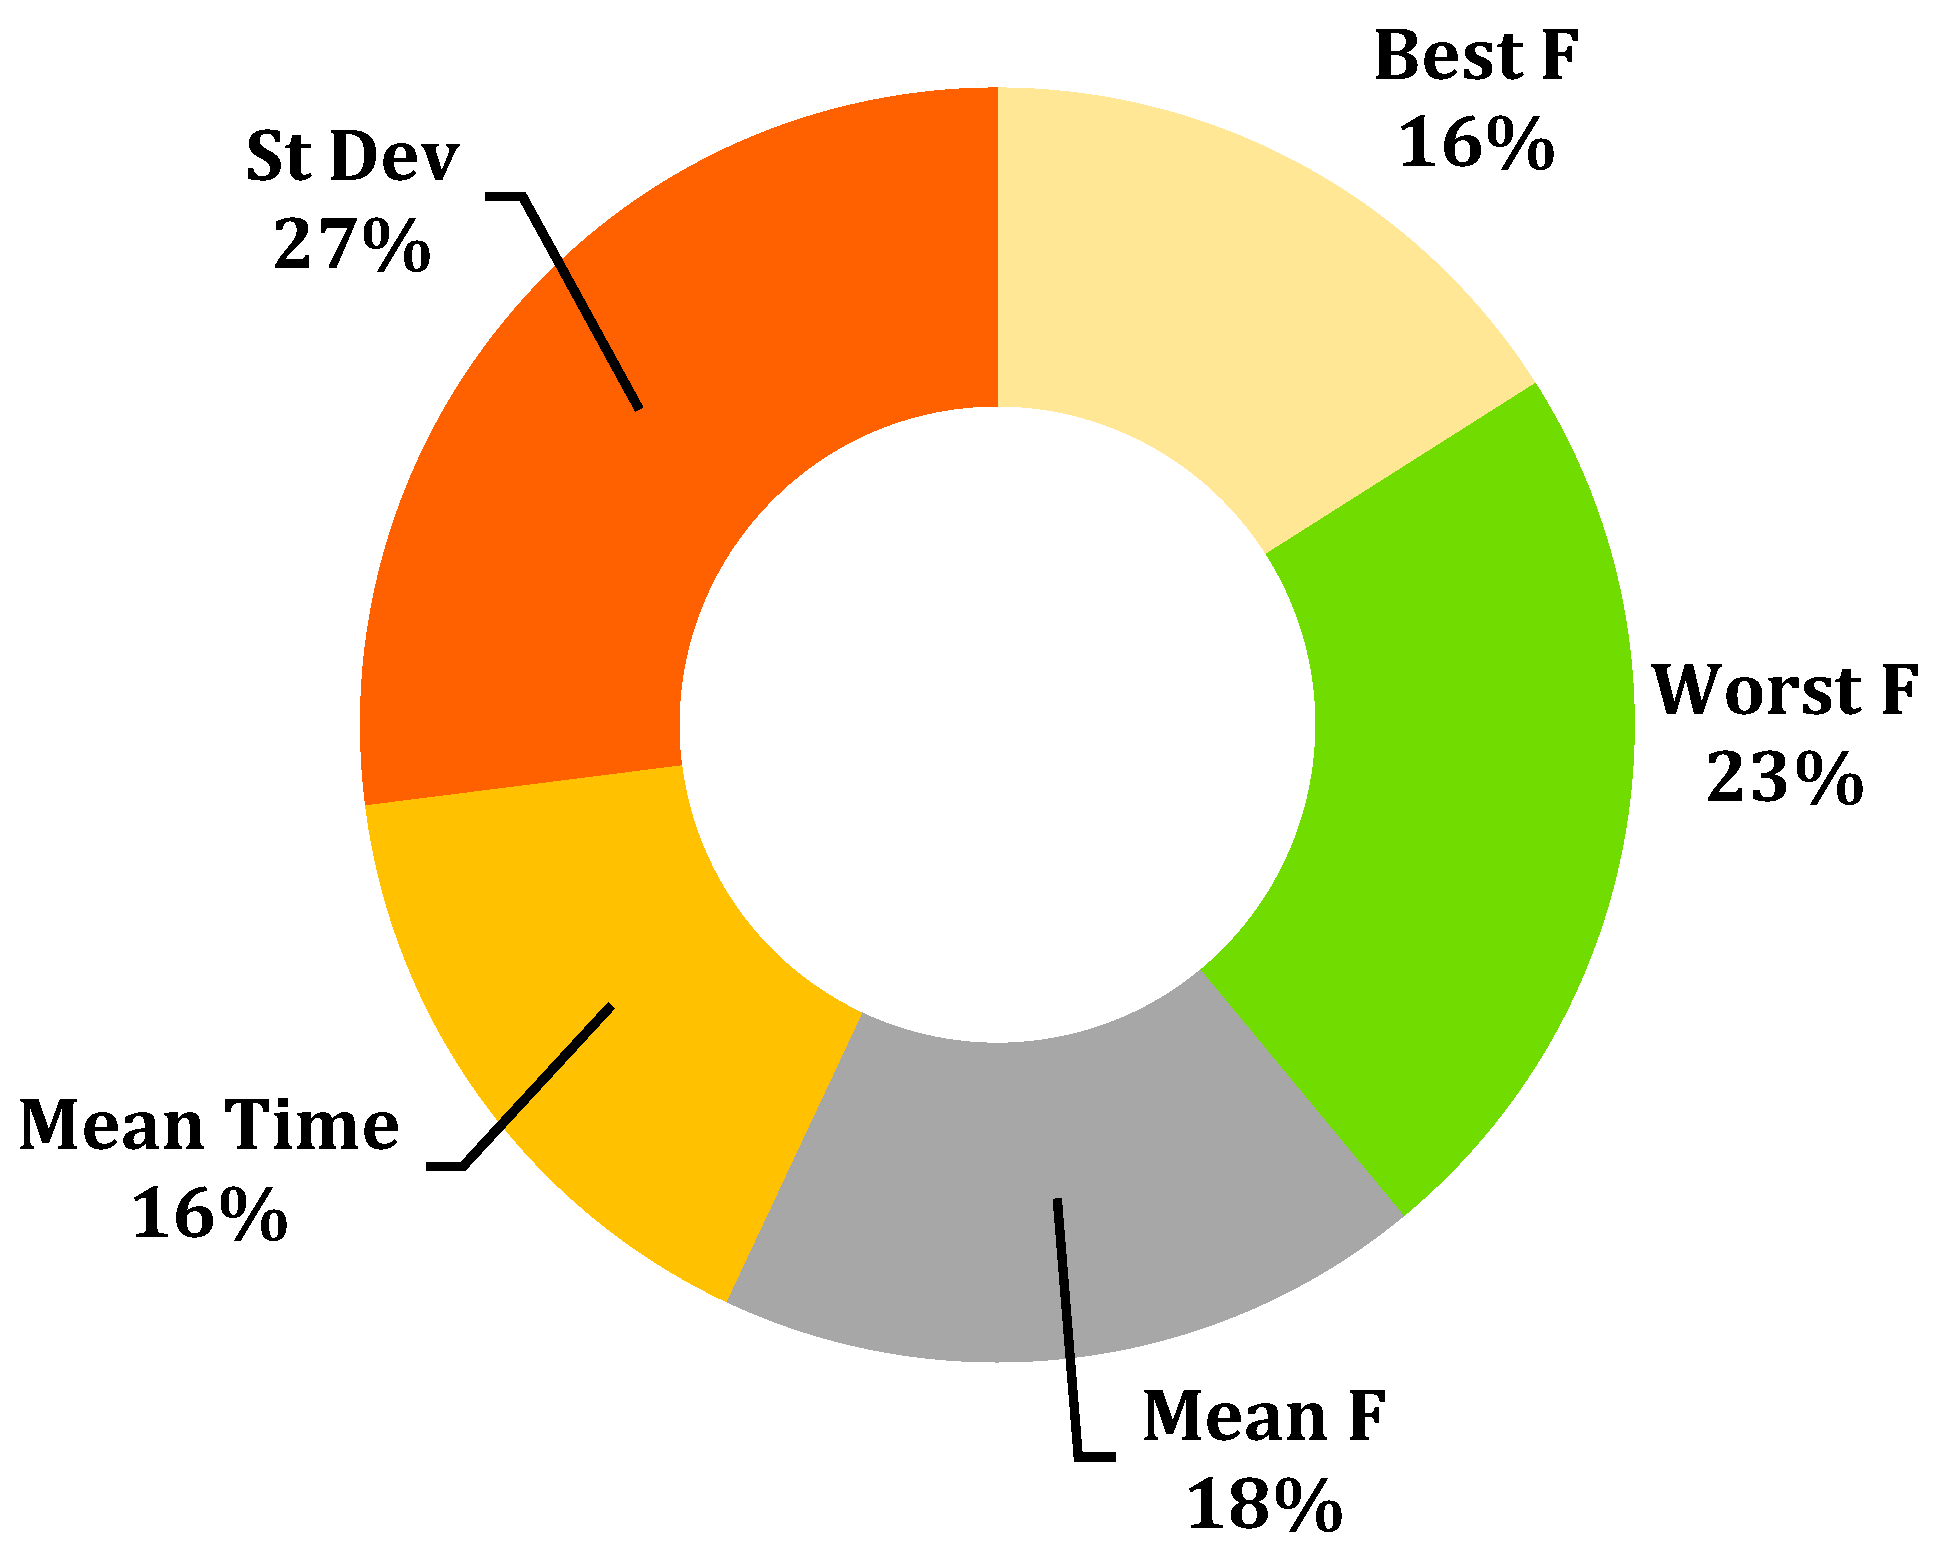
To enhance the objectivity evaluation of criteria weights, the entropy weighting method (EWM) is employed [41]. It is an information weighting model that avoids the interference of human factors on the weighting of indicators, Then, the Shannon entropy method is usually used to determine the objective weights and to evaluate the presented algorithms by calculating a score for each one as a weighted sum of the previously presented indicators [42]. The EWM is employed to measure the weights of each indicator. Results are plotted in Figure 13. It shows the weight , resulting from the entropy method, for each indicator. These weights were used to calculate the scores of the algorithms tested, using the weighted sum presented in Equation (22), with indicator index, indicator weight and indicator’s result for the algorithm.
Figure 13.
Indicator weights resulting from the entropy method.
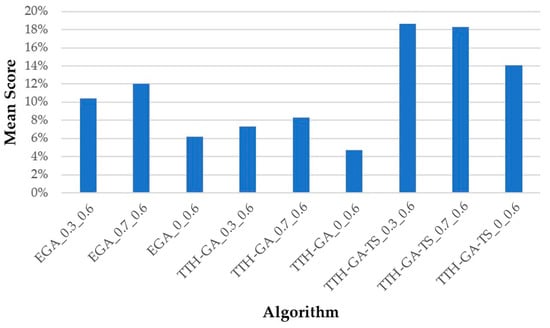
To determine the selected configuration, the performance scores from the algorithms across all scenarios are presented in Figure 14. The results show that the hybrid algorithm achieves the highest score, with the peak observed for the 0.3–0.6 configuration. Accordingly, the local case of the Port of Casablanca is addressed using this selected configuration.
Figure 14.
Average score of algorithms.
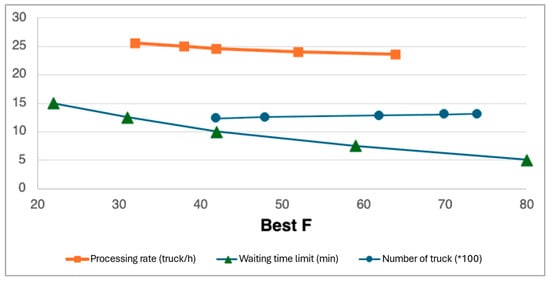
A sensitivity analysis was conducted to study the impact of the waiting time limit (min), the processing rate (truck/h) and the number of trucks on the objective function using the TTH-GA-TS_0.3_0.6 algorithm (Figure 15). It is to notify that an increase in waiting time limit is associated with a decrease in the objective function. The same observation applies to the processing rate. On the other hand, the objective function is negatively affected by an increase in the number of trucks.
Figure 15.
Sensitivity analysis.
7. Case Study: Port of Casablanca
The Port of Casablanca is a multifunctional port created in 1906. In terms of containerized traffic, it is ranked second after the Port of Tangier Med and sixth port in Africa. However, it is considered the first for import/export activities. As a result, the Port of Casablanca is the port that receives the most trucks for container reception and delivery in Morocco. This results in long truck queues during peak hours. This congestion disrupts operations at the port, terminals and in the urban environment.
This study originates from considerations about introducing a TAS at a terminal in the Port of Casablanca. The port management highlighted the importance of a smooth implementation, to ensure the adherence to this new system.
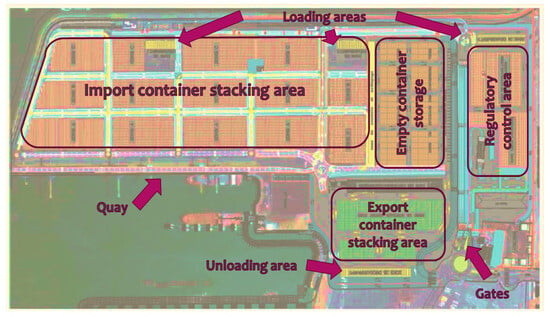
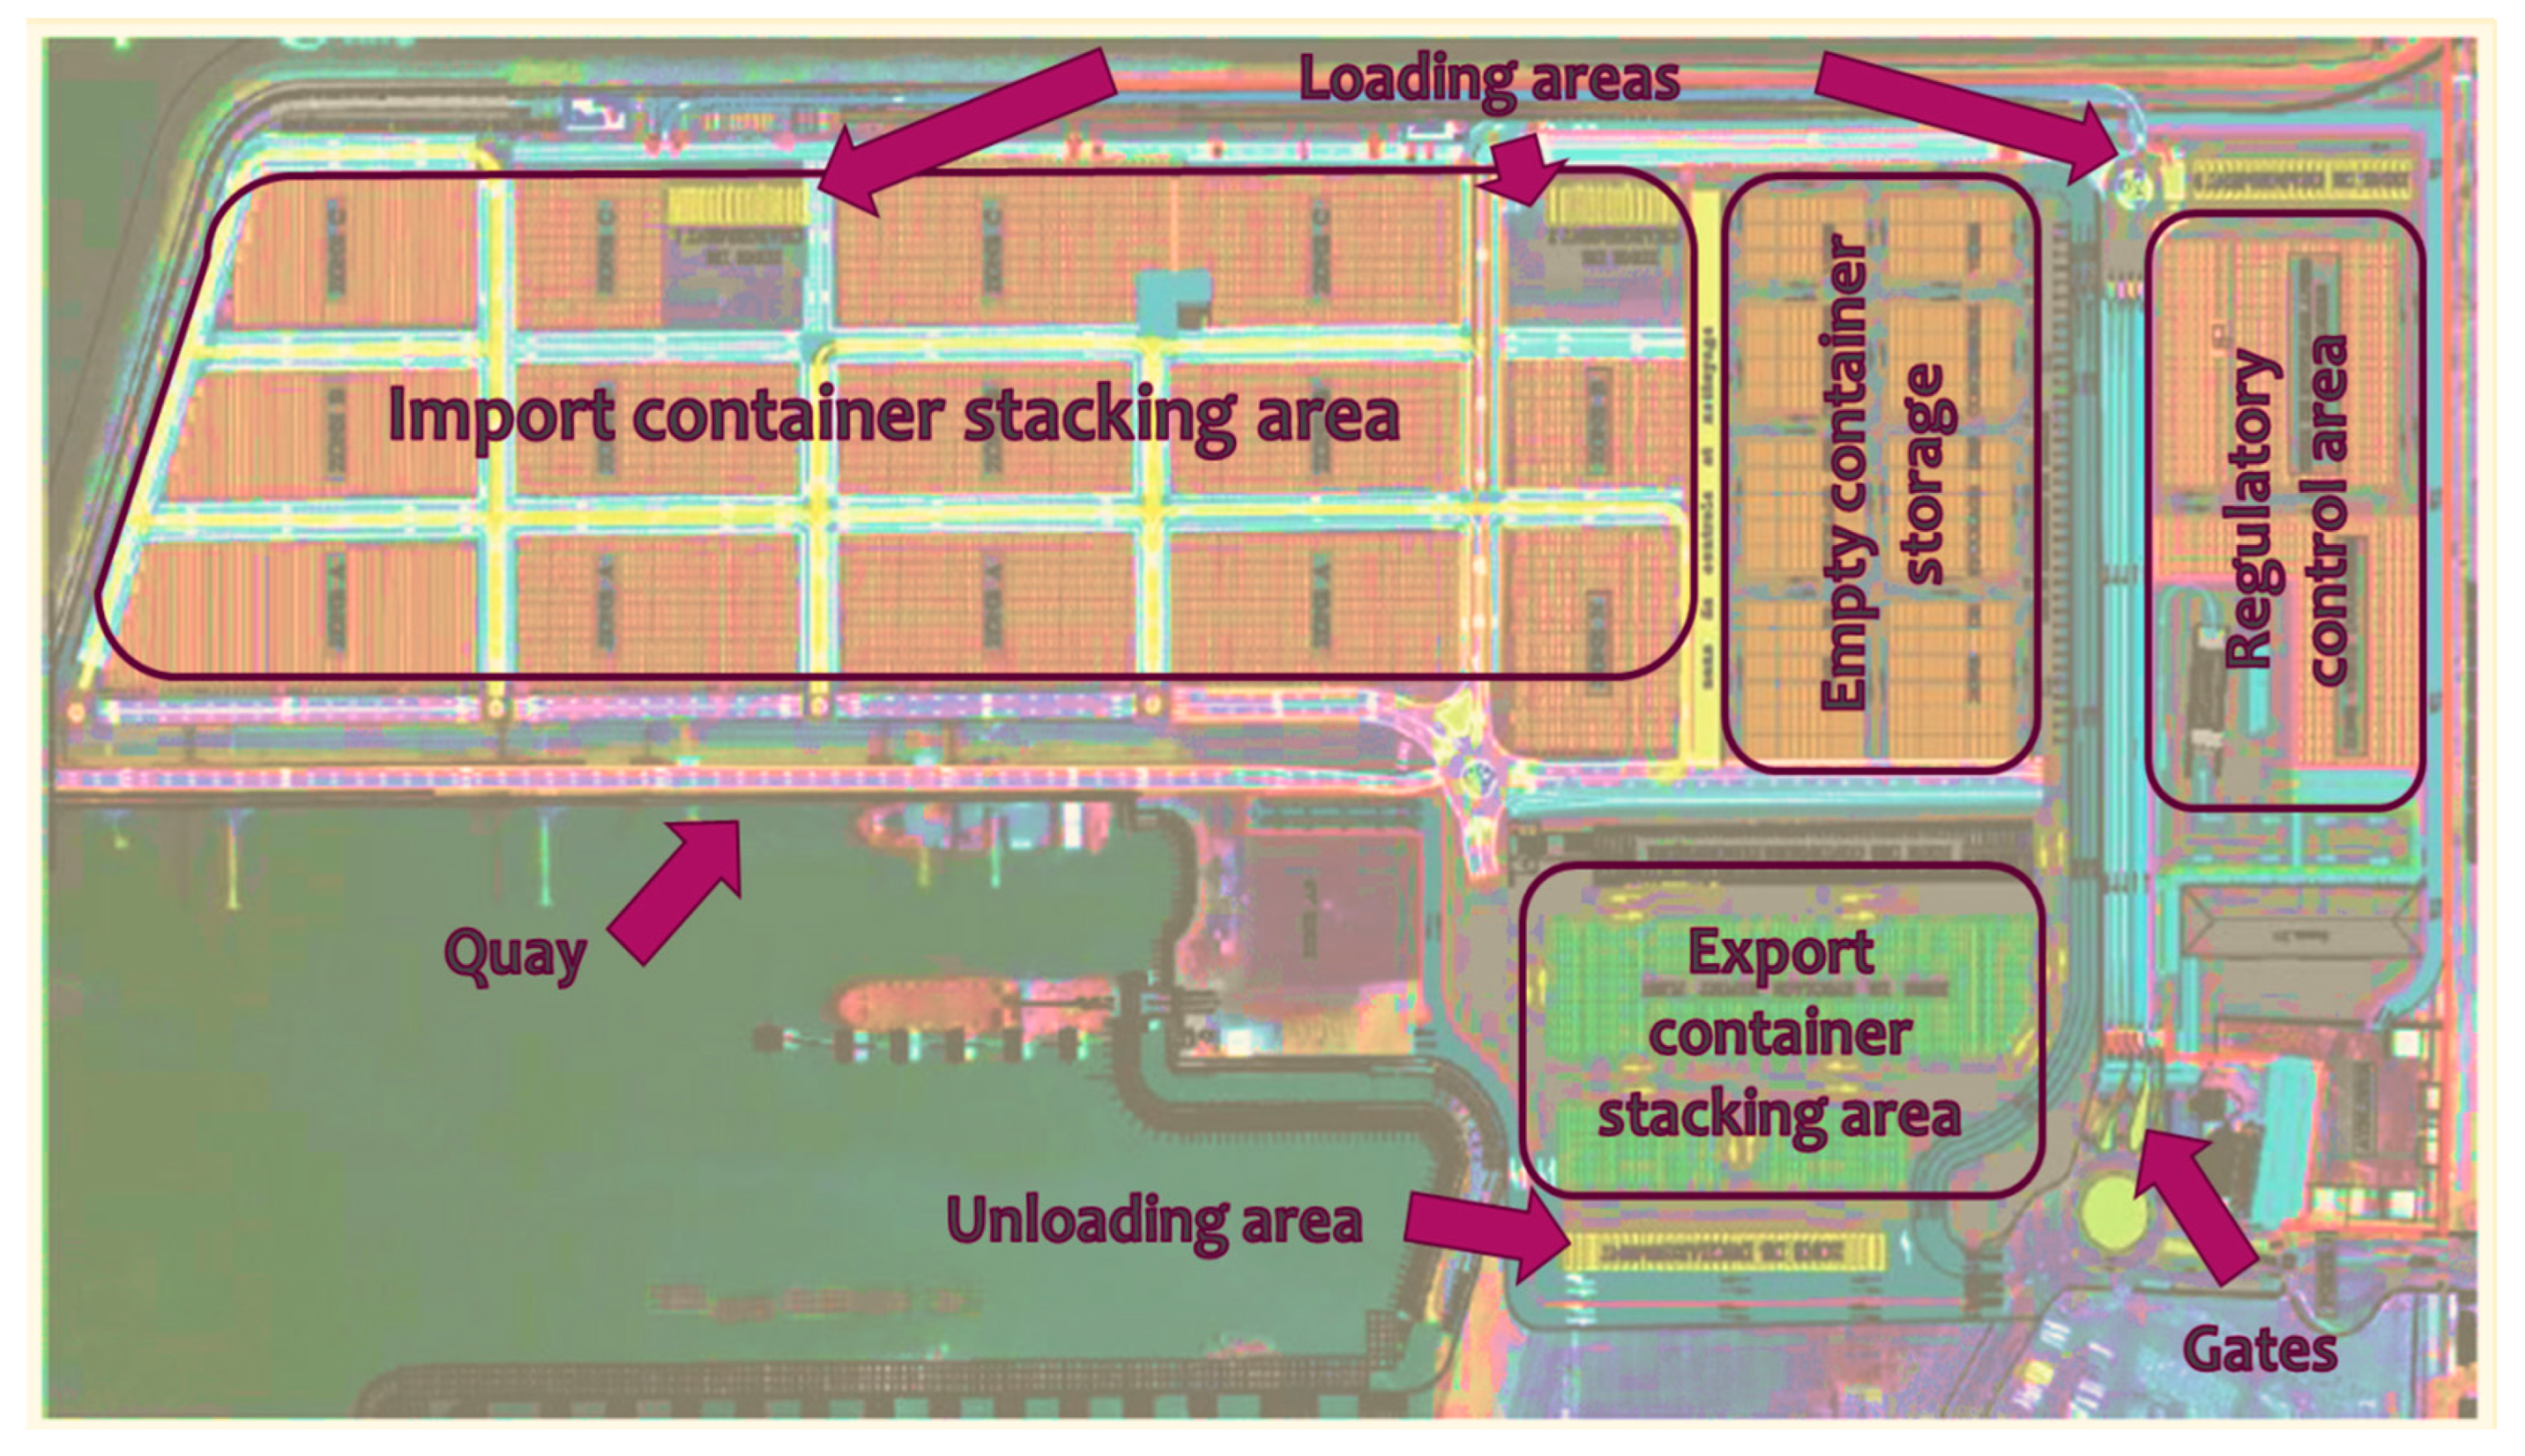
We focused on the “EST” terminal, which is one of the biggest container terminals in the Port of Casablanca. It handles an annual volume exceeding 537,000 TEU and is equipped with a 600 m long quay with a draught of up to 12 m deep. Figure 16 represents the general layout of the terminal.
Figure 16.
General layout of the EST terminal.
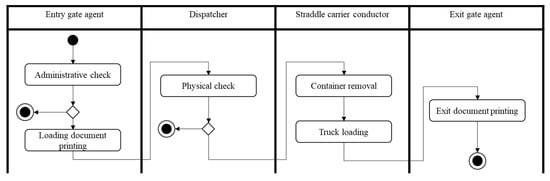
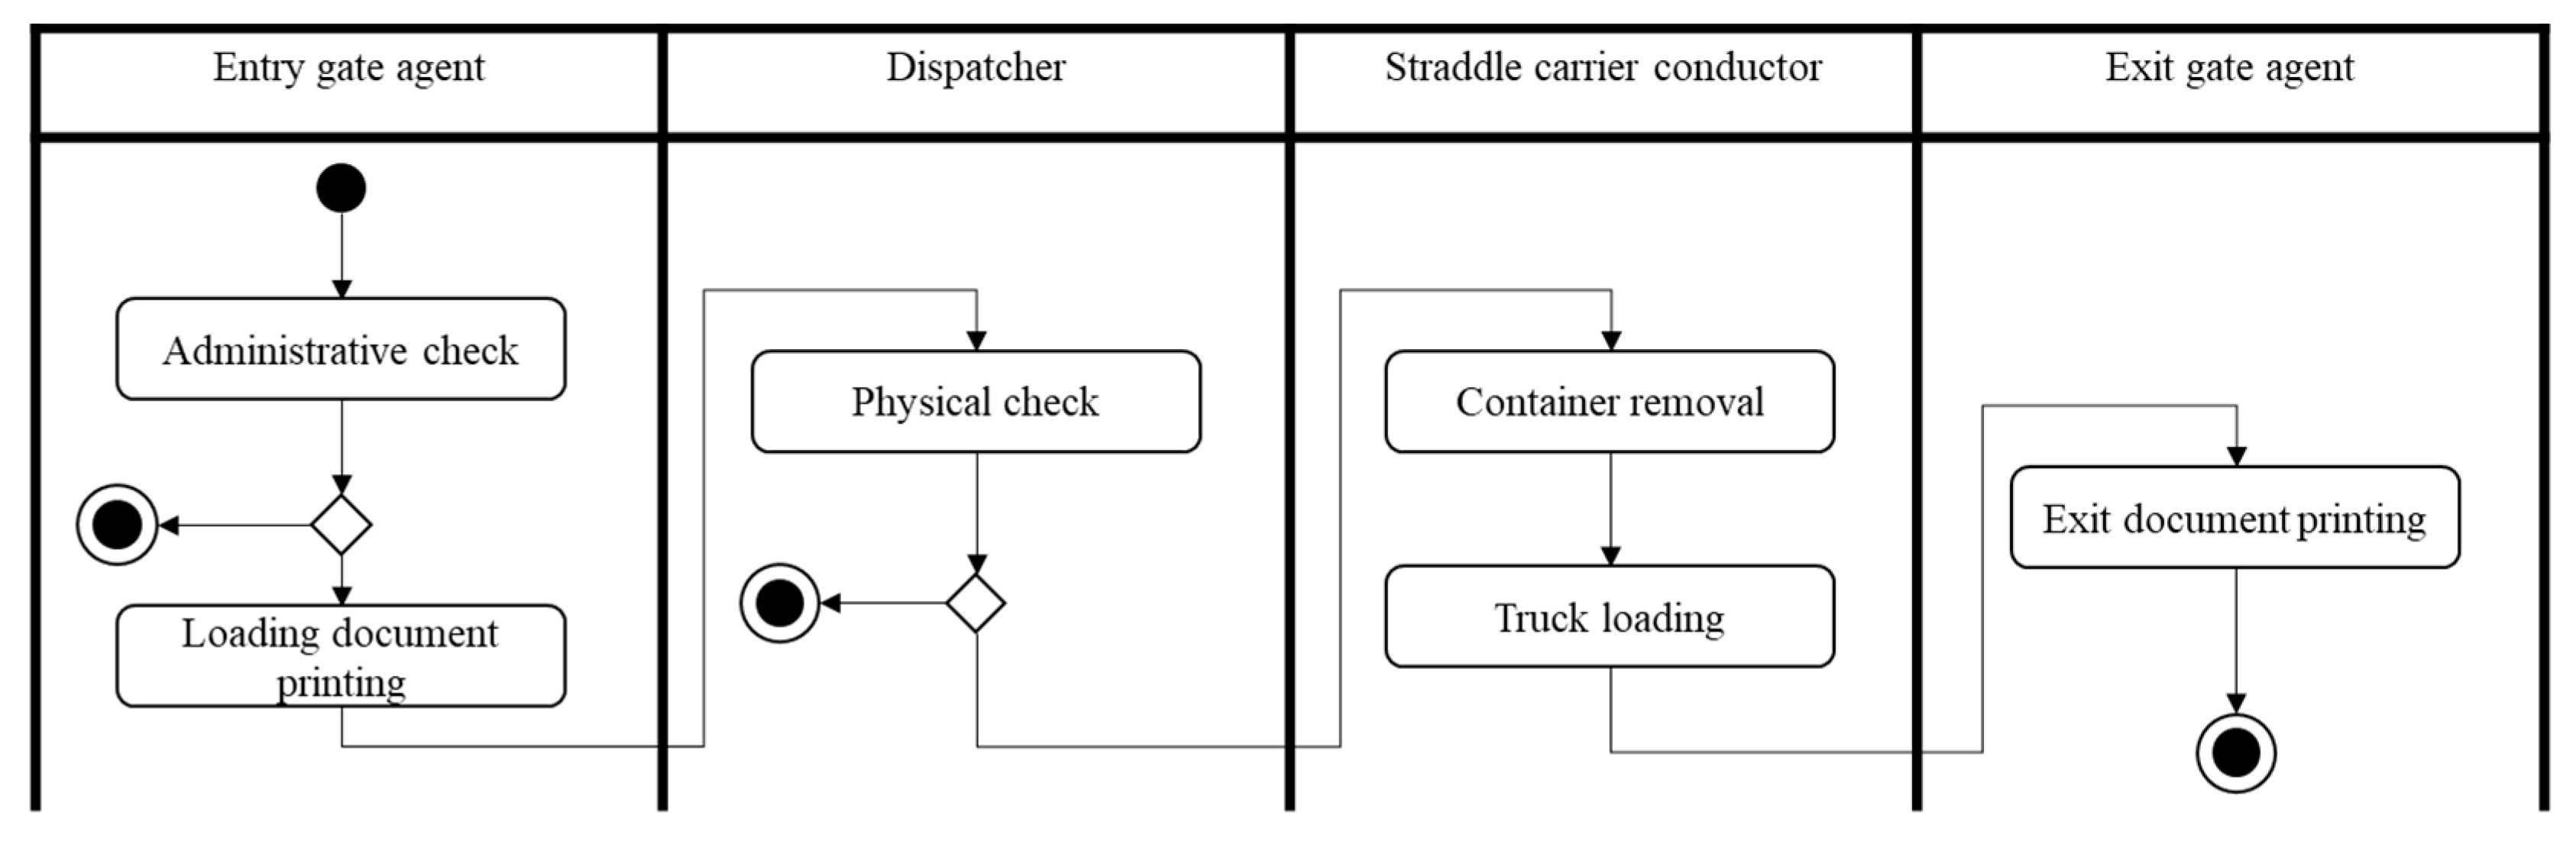
The truck driver presents to the agent at the entrance gate the documents of the container to be loaded. If they are compliant, the loading permit is issued and the truck driver is directed to the loading area associated with his container. Once there, the dispatcher performs a physical check of the truck and records the data on the system. The instruction is then sent to the straddle carrier driver who retrieves the container from the storage area and loads the truck. The truck driver goes to the exit gate, where he obtains an exit receipt proving the delivery of his container (Figure 17).
Figure 17.
Truck loading process.
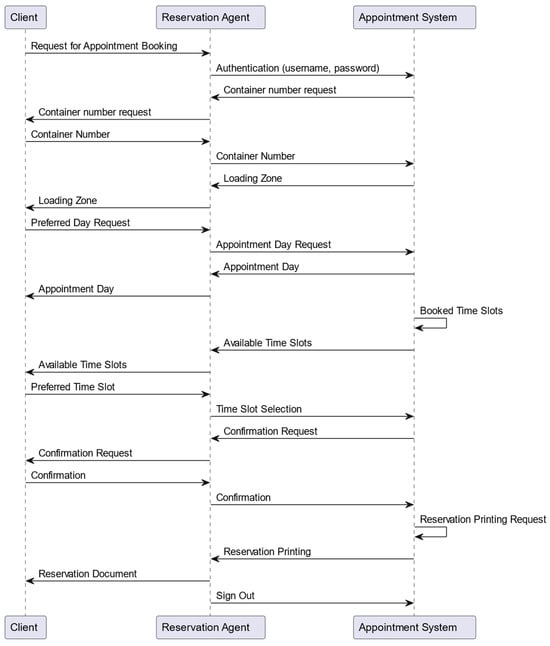
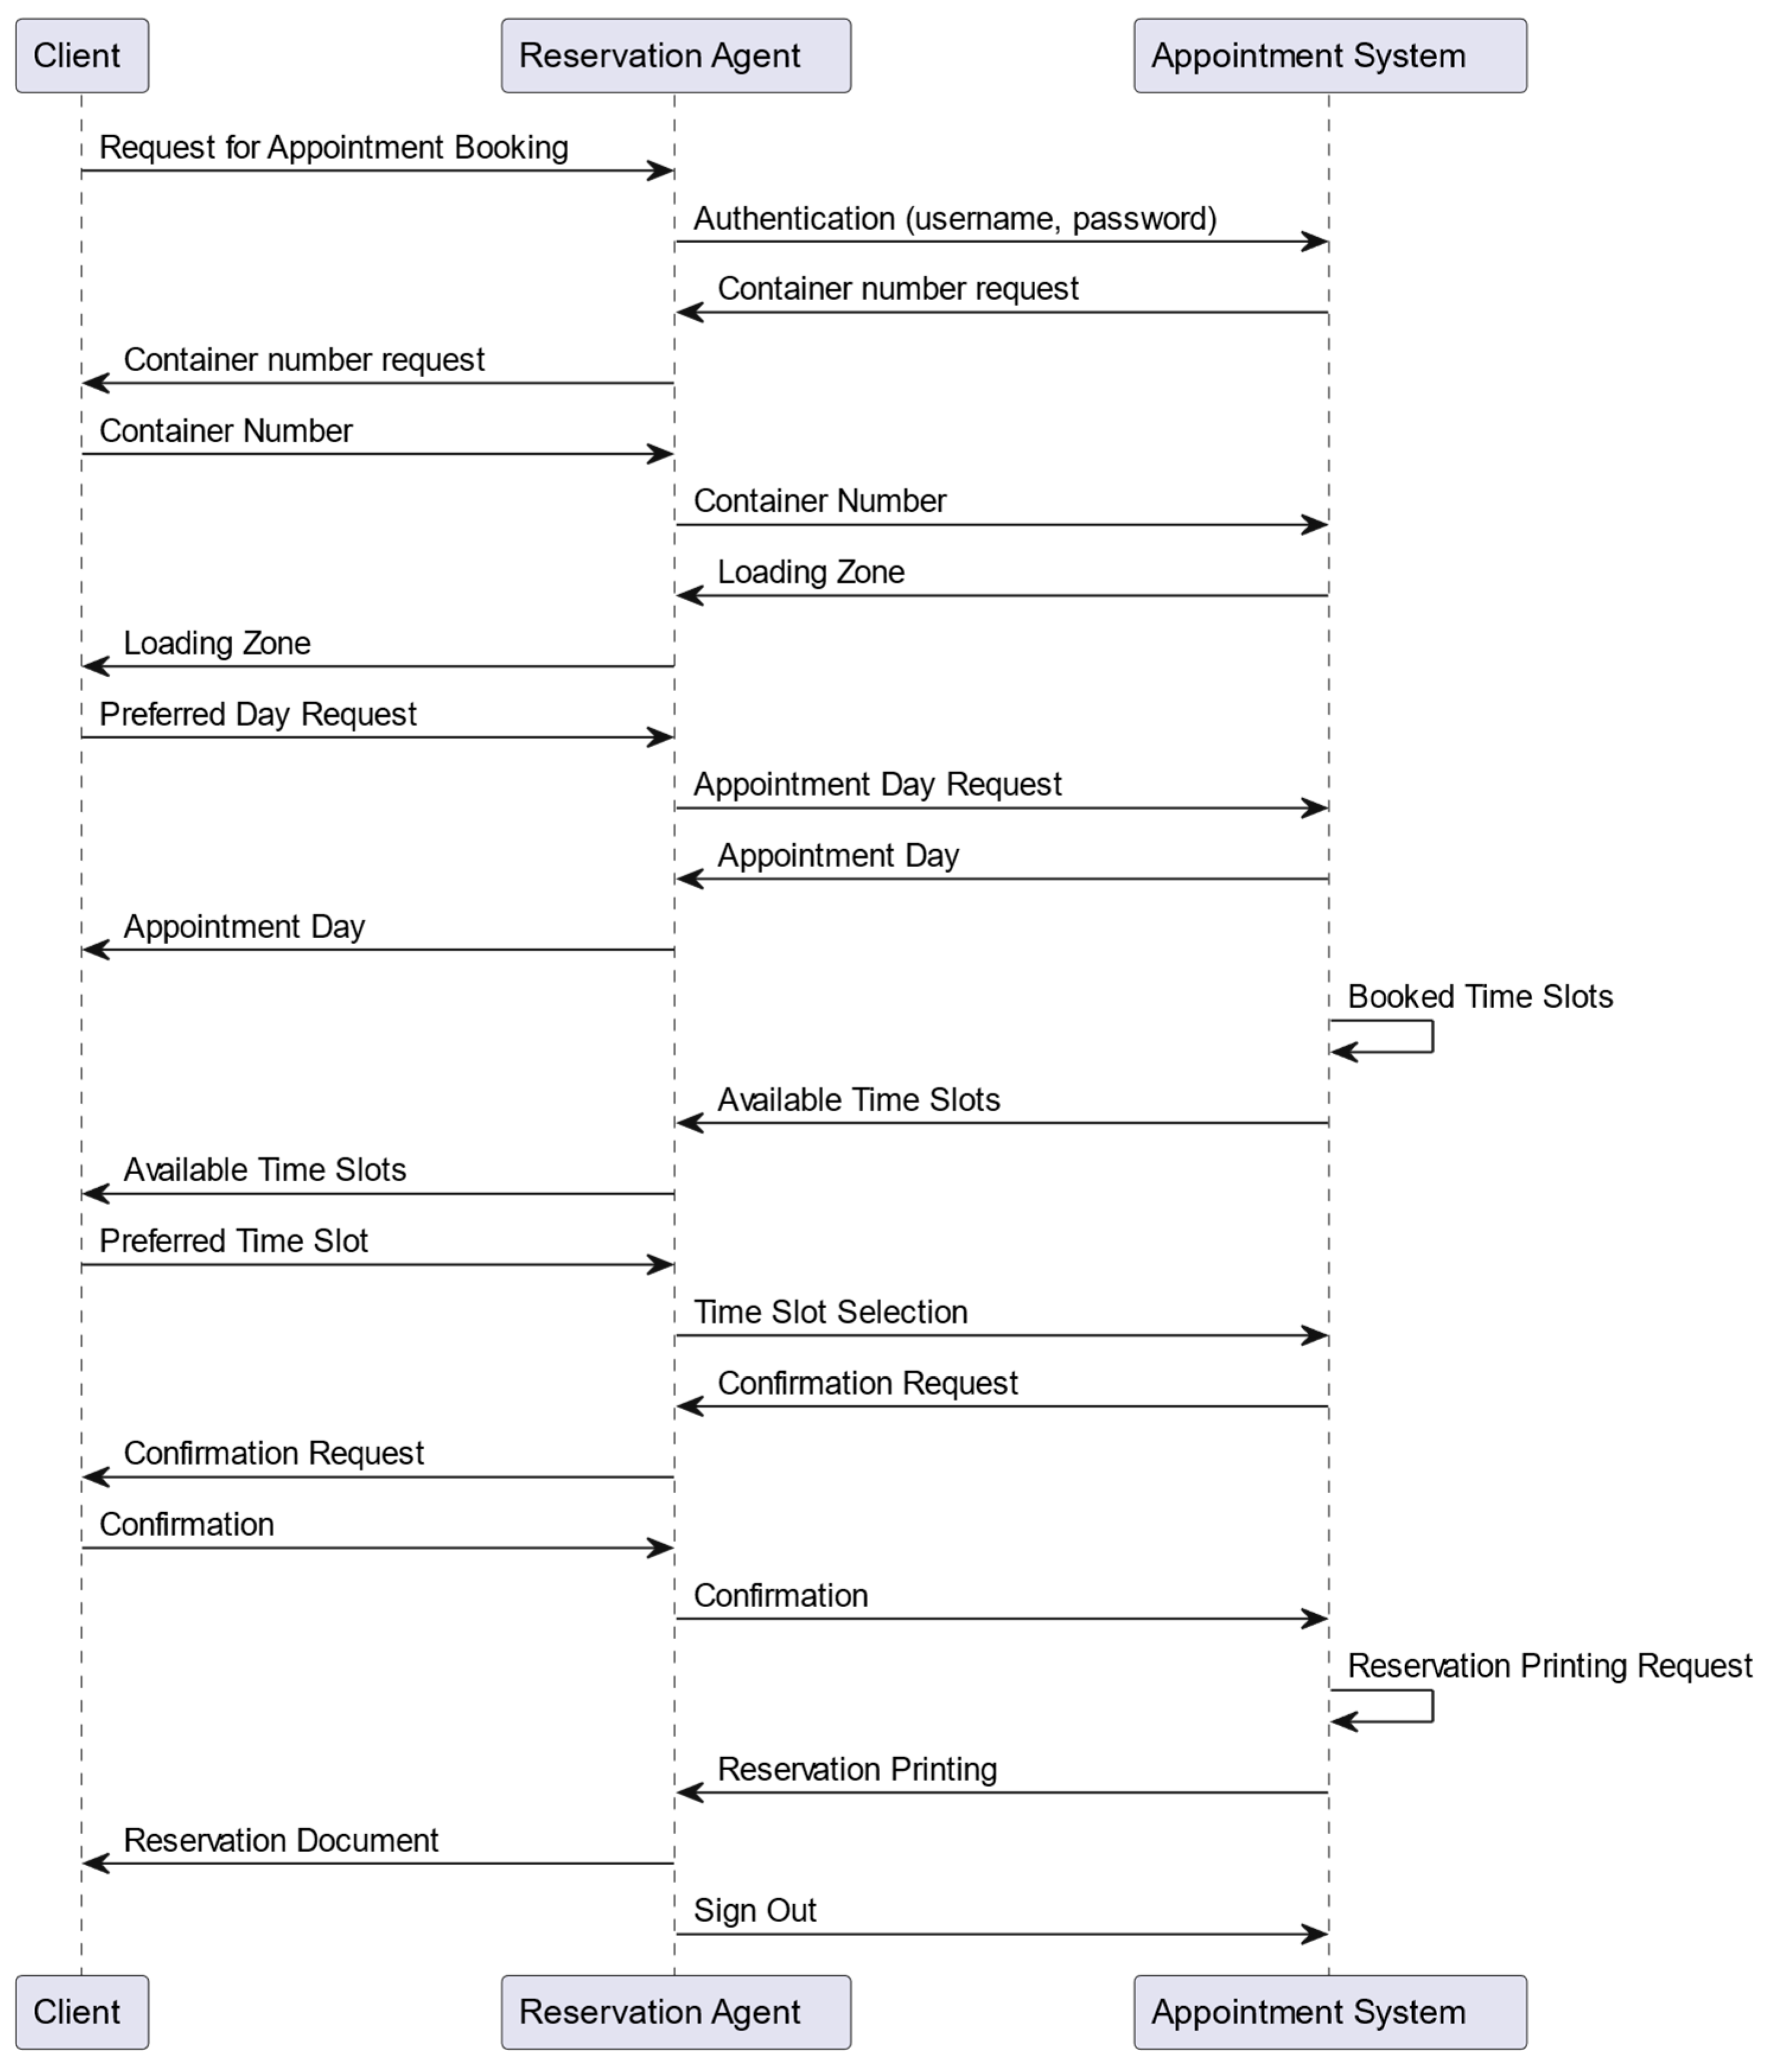
Figure 18 shows the sequence of exchanges between the actors and the system for booking an appointment. The customer goes to the customer area in the CT to make an appointment. The reservation agent responsible for the booking accesses the system and enters the container number to be loaded. The agent determines the loading zone associated with the container and informs the client. The agent asks the client for his preferred loading day and enters it into the system. The system displays the number of appointments available for each time window. This information is communicated to the client, who can then choose the time window that suits him best. The agent then selects the chosen appointment and confirms it on the system. A reservation document is then printed as a proof of the appointment. The agent can log out of the system at the end of the operation.
Figure 18.
Sequence diagram for making an appointment with a reservation agent.
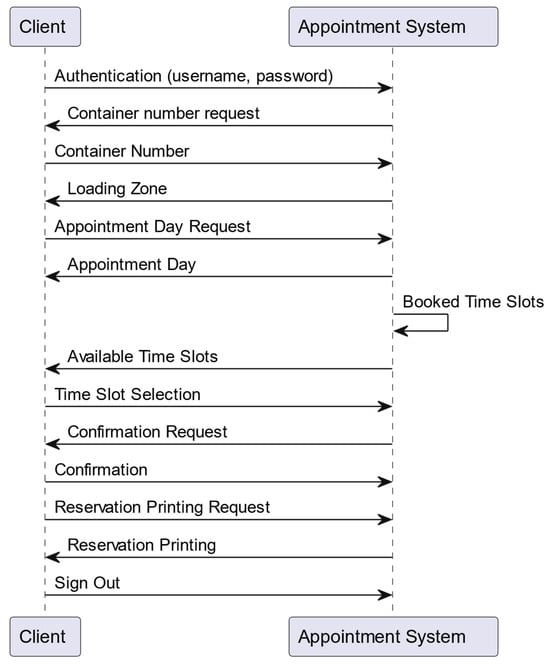
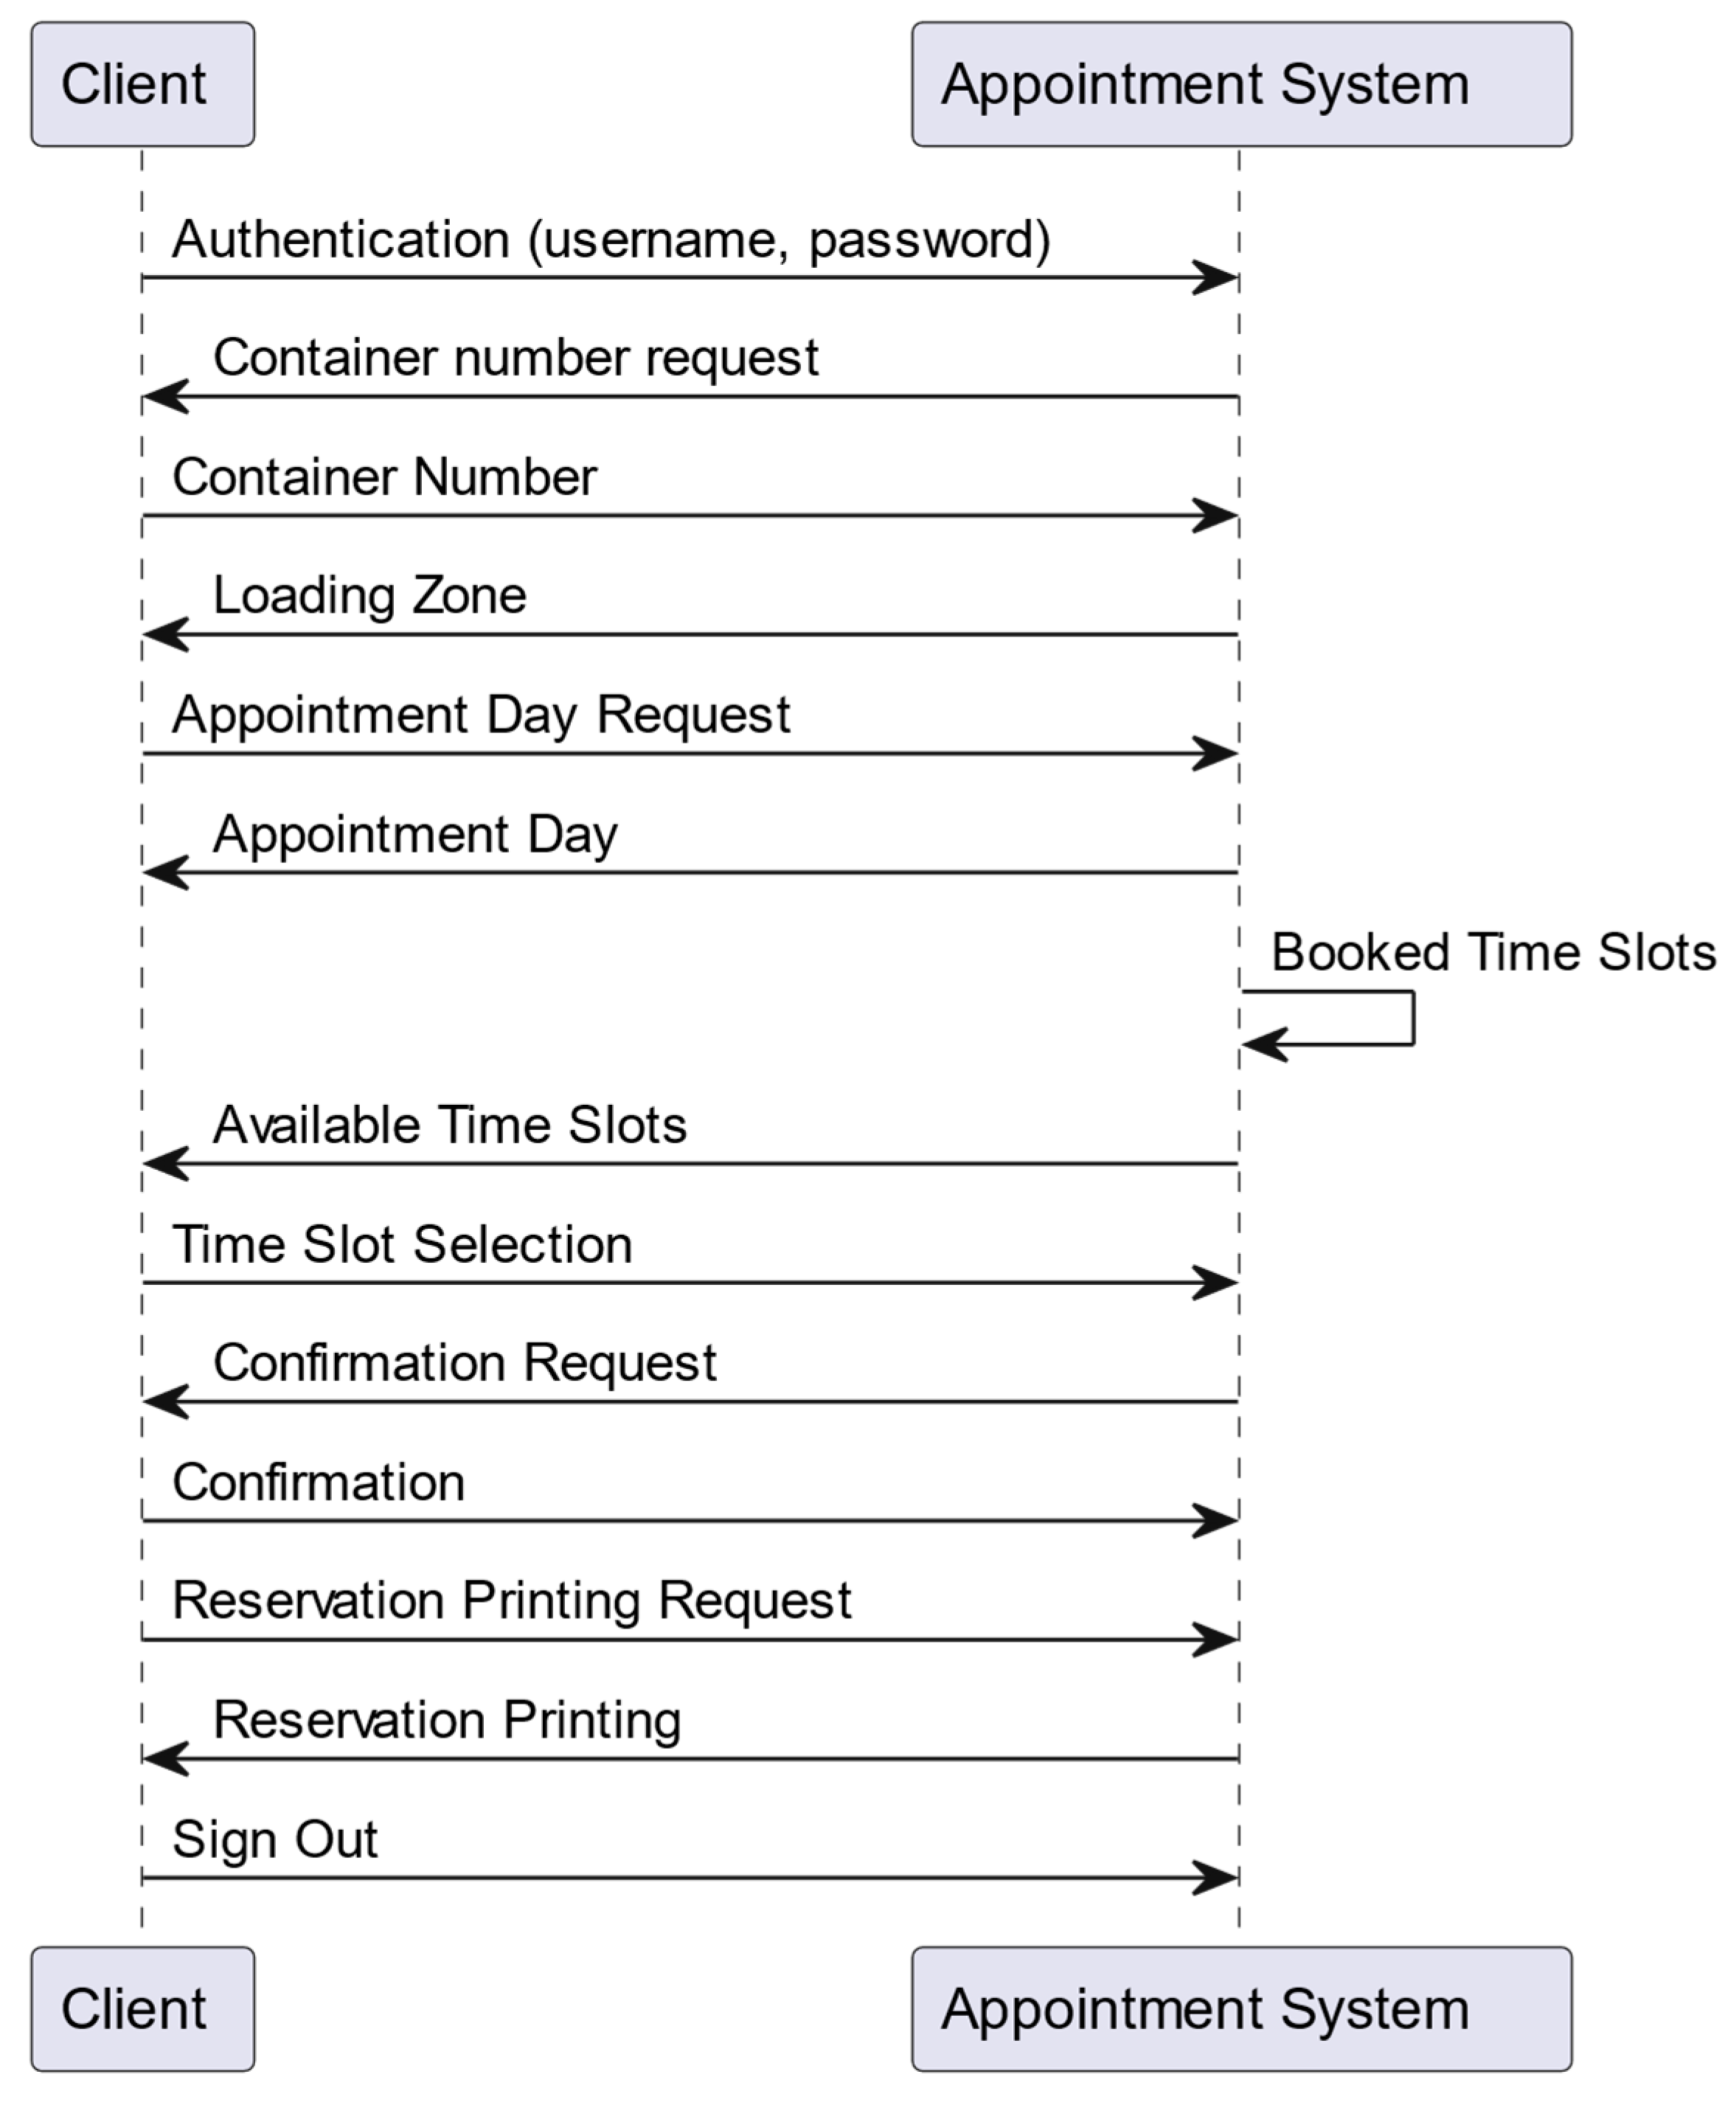
If the client has an account on the system, the client can book the appointment by following the same procedure (Figure 19) without having to go to the customer area.
Figure 19.
Sequence diagram for making an appointment directly via the system.
To analyze the congestion problem at the entrance of a terminal, several parameters must be obtained. Among these parameters, truck arrival time and gate processing time are essential to apply the waiting time analysis. The most common statistical distribution for waiting times used in queuing models is the exponential distribution. In order to apply the or models, the arrival time distribution must be tested to determine if it matches the exponential distribution. For the service time distribution, it must be tested whether it is an exponential or Erlang distribution. Once these two critical parameters are defined, an appropriate model can be chosen to undertake the wait time analysis.
Several field observations were made in 2016, at different times of the day over several days. These data were compiled and processed. The inter-arrival time was obtained by calculating the difference between two consecutive truck arrivals.
Table 7 provides the descriptive statistics for inter-arrival time. It identifies several key factors. First, the skewness is positive (2.16), which means that the curve is spread to the right and its distribution is not symmetric. Second, the relationship between its mean and variance is very significant. The mean is equal to 1.35 and the standard deviation is equal to 1.41, the coefficient of variation (the standard deviation divided by the mean) is 1.04. According to the characteristics of the exponential distribution, the mean and standard deviation should be the same. The intuitive judgment is that the distribution of observed inter-arrival times should be an exponential distribution.
Table 7.
Descriptive statistics of inter-arrival times (minutes).
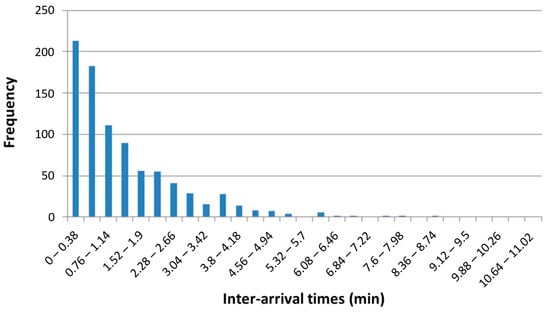
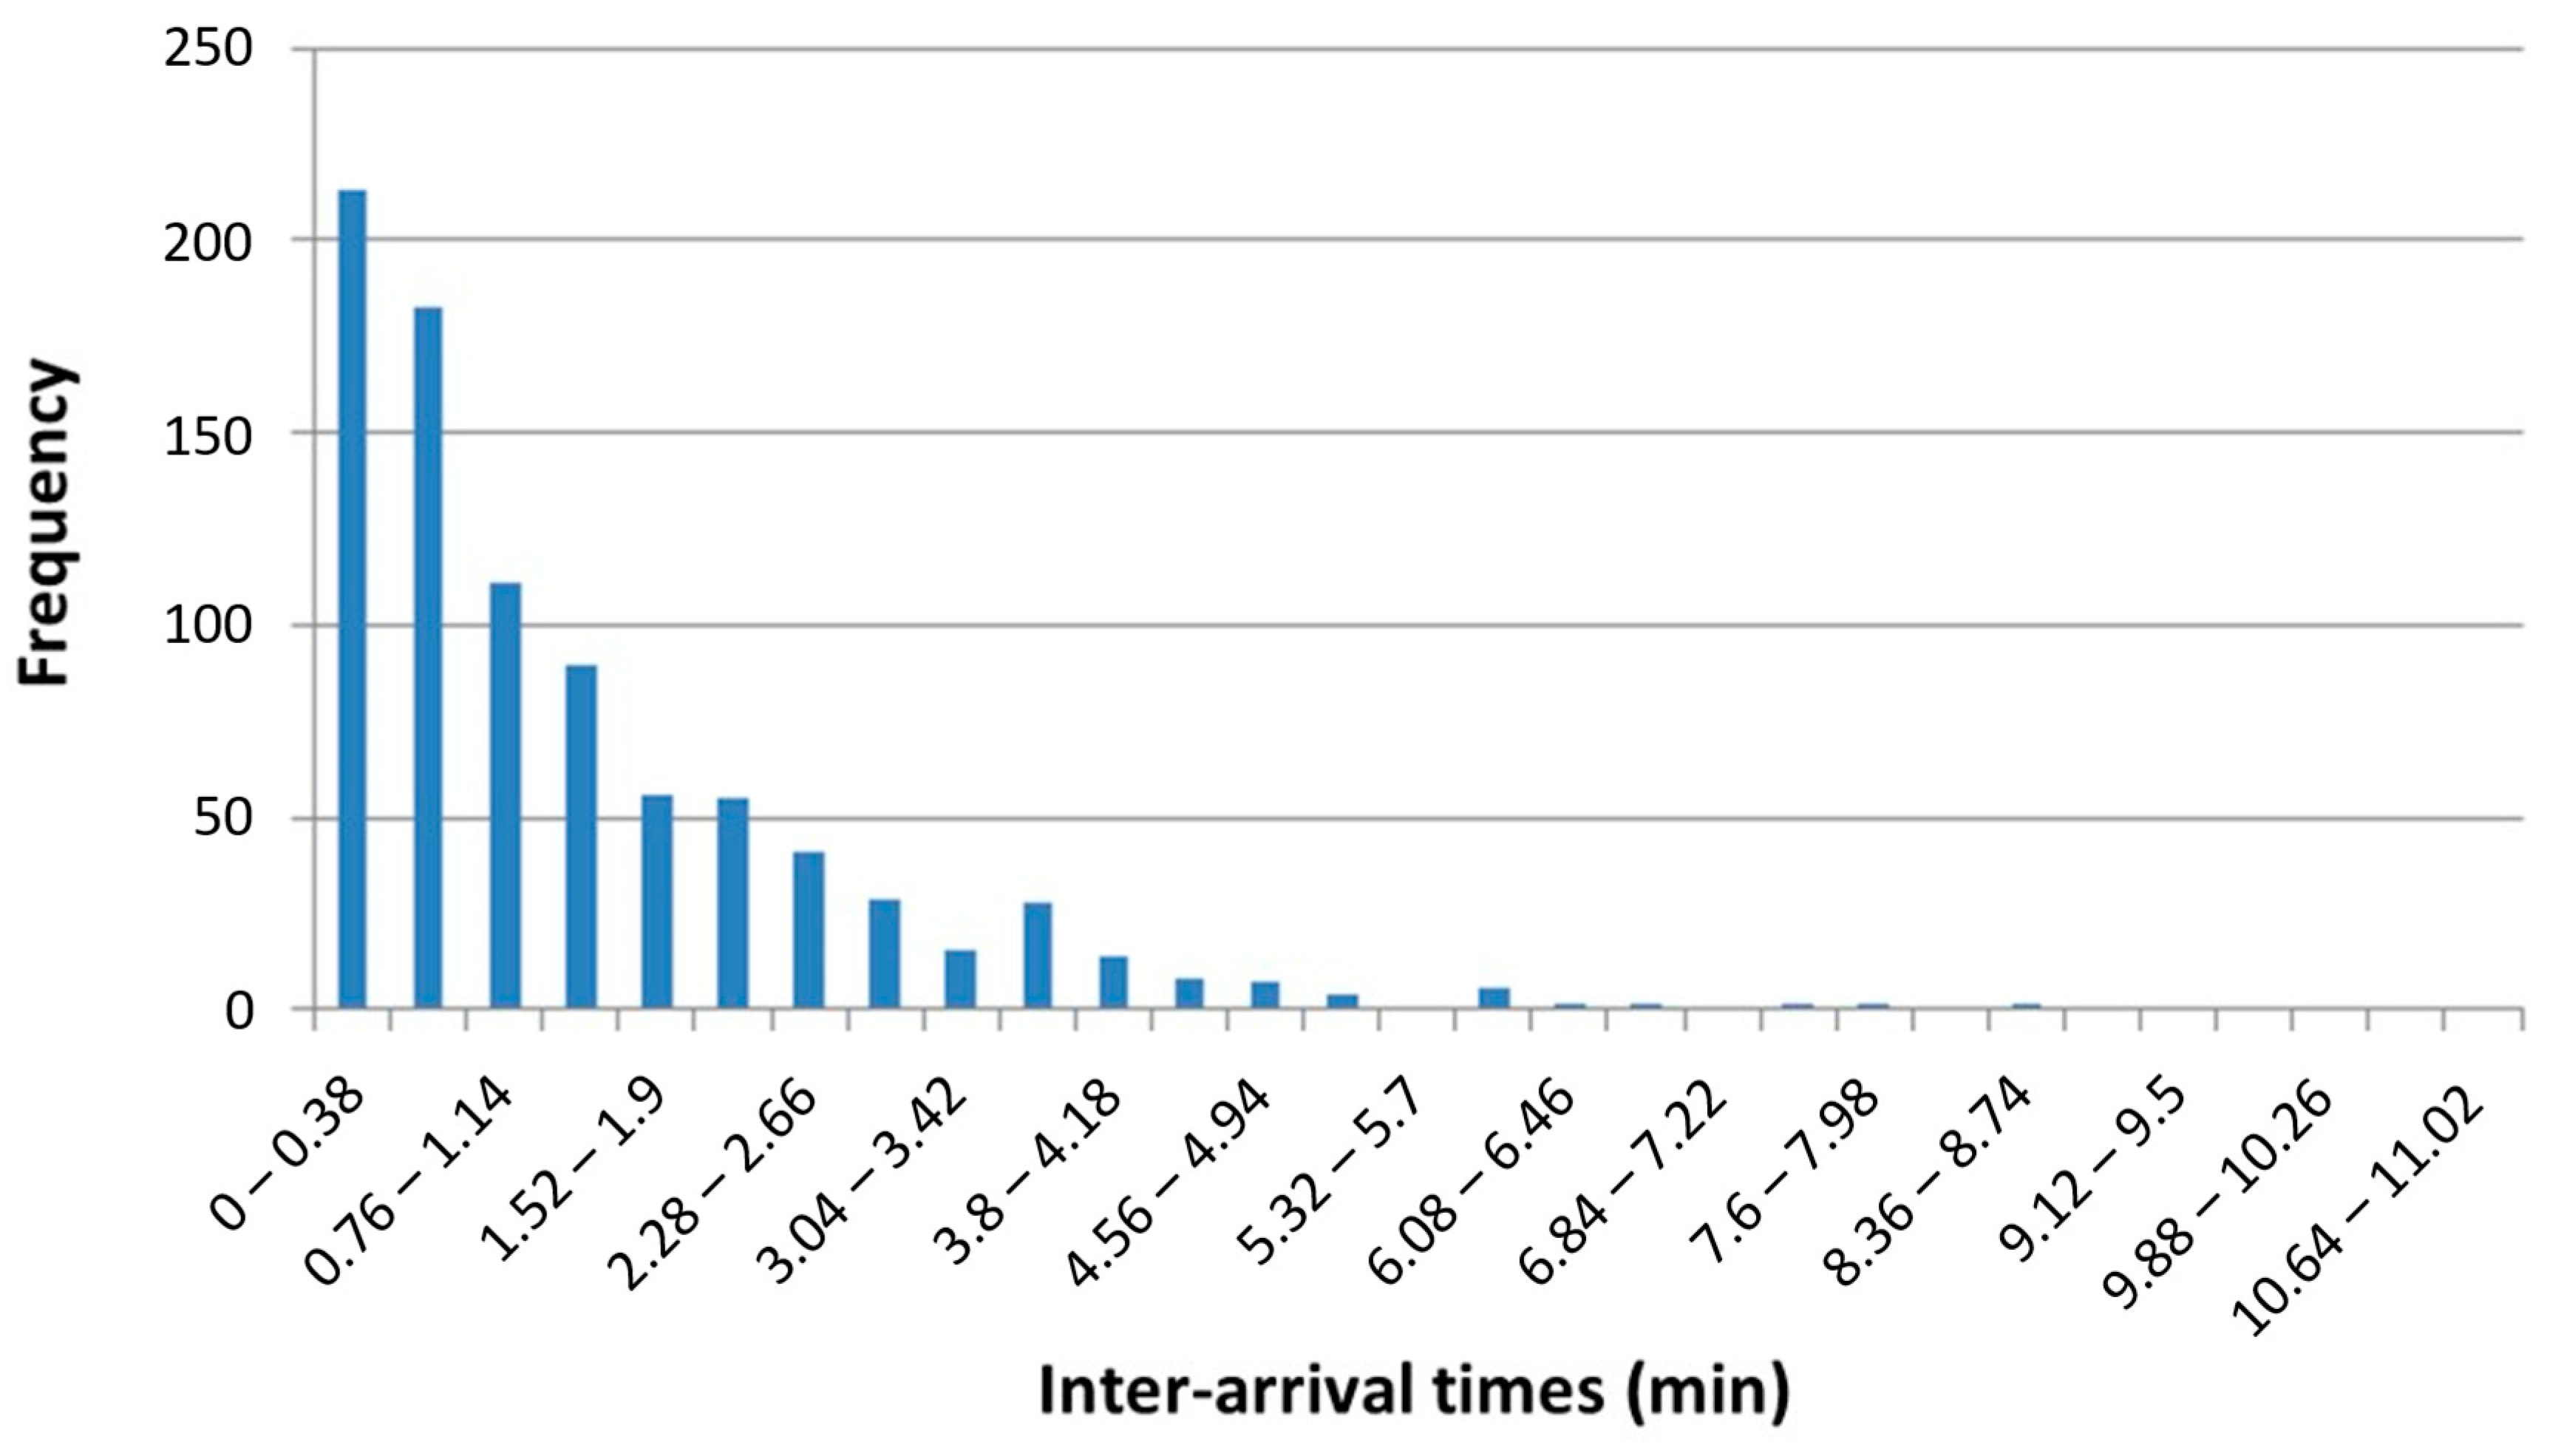
In addition, the observed inter-arrival times are grouped into 29 intervals of 0.38 min. Plotting the frequency distribution (Figure 20), the shape of the graph appears to be an exponential curve; its asymmetric shape shows a downward trend and a slope to the right.
Figure 20.
Frequency distribution of truck inter-arrival time.
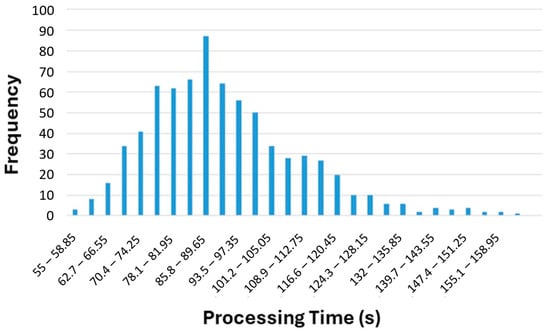
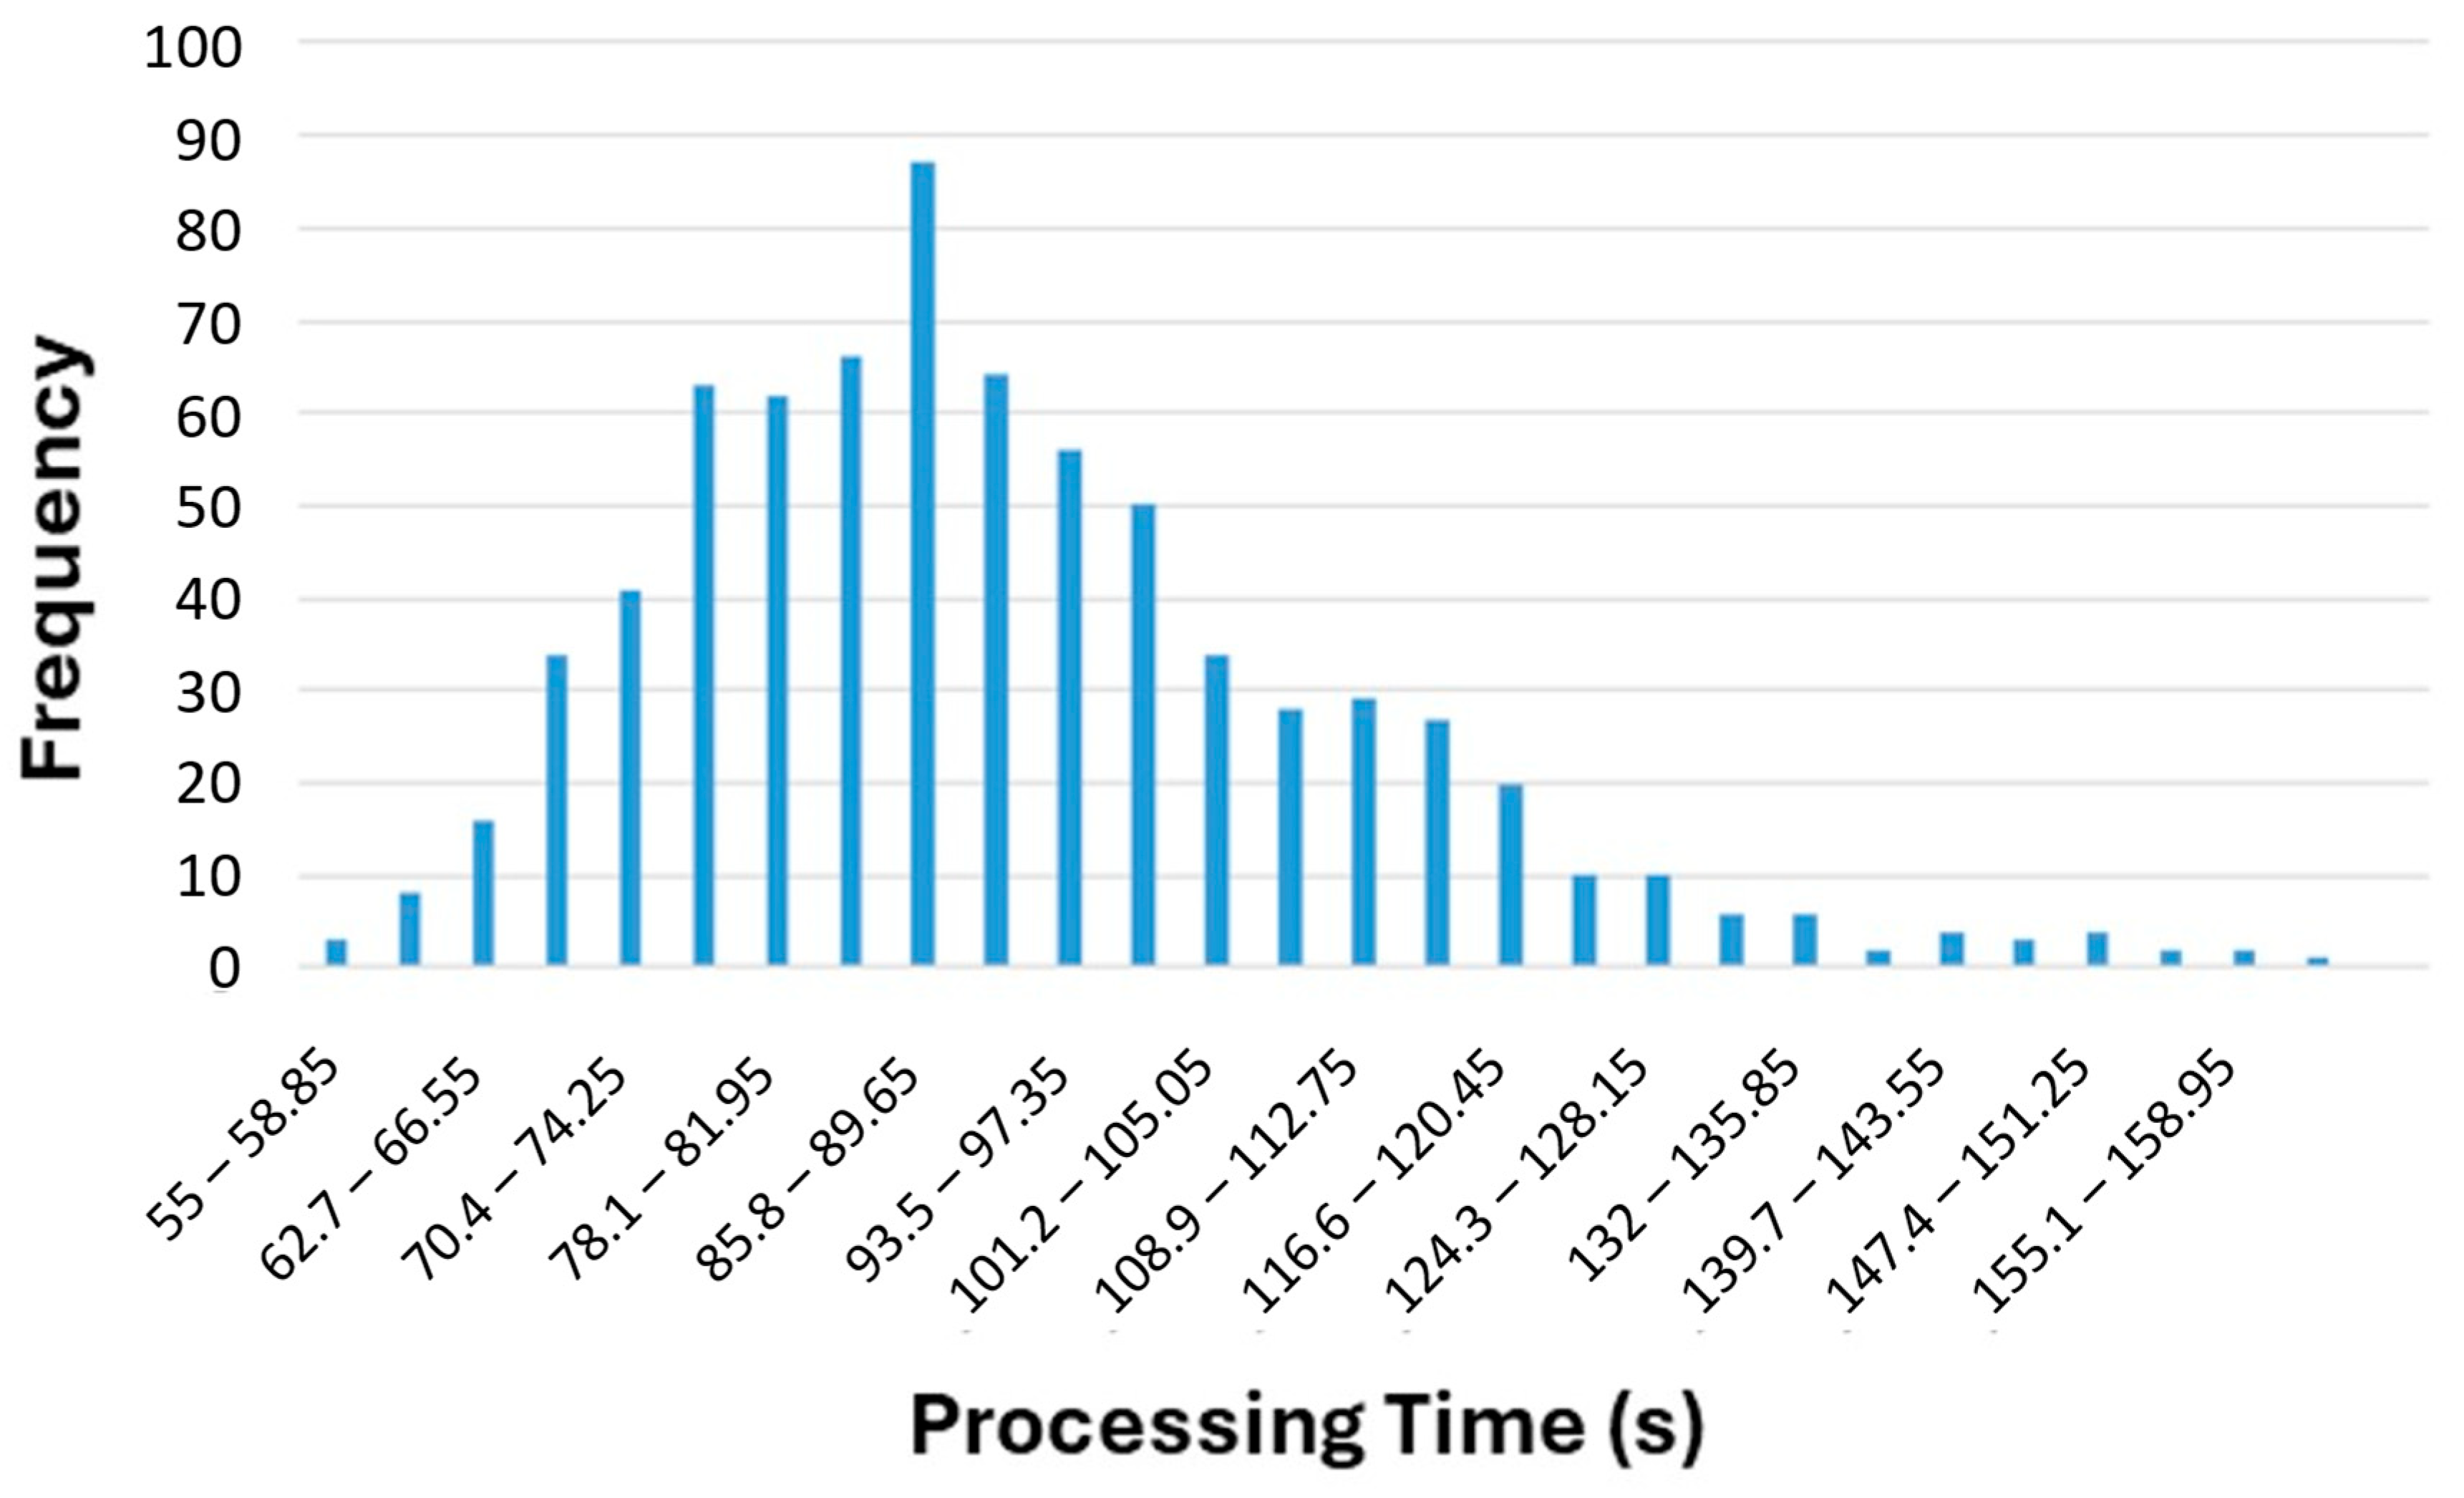
There were 738 observations of processing time at the gate. Table 8 presents the descriptive statistics for this time. The shortest time is 55 s and the longest is 159 s. On average, it takes a gate agent about 92.09 s (1.53 min) to process a truck. A simple comparison of the mean and standard deviation shows that these two measures are different; this eliminates the possibility of having an exponential distribution. The distribution of processing times is presented over 28 intervals of 3.85 min (Figure 21); the shape of the curve confirms the conclusion of a non-exponential distribution. As for the Erlang distribution, it is a special class of gamma distribution with two parameters: a shape parameter and an intensity parameter .
Table 8.
Descriptive statistics of processing times (seconds).
Figure 21.
Frequency distribution of processing time.
To confirm the distribution function of inter-arrival time and processing time, statistical hypothesis tests (goodness-of-fit test) are required.
Using the Input Analyzer module of the Arena software version 14.00.00, the goodness-of-fit tests are performed on the beta, Erlang, exponential, gamma, lognormal, normal and Weibull distributions. The test results show that the exponential and Erlang distributions are the most appropriate for inter-arrival times and gate processing times, respectively; the test results are presented in Table 9. The results show that all test statistics of all parameters for inter-arrival times (exponential distribution) and gate processing times (Erlang distribution) are significant. This confirms, therefore, that the appropriate model for the terminal entrance congestion analysis is the model.
Table 9.
Goodness-of-fit results.
On a given day, proposed by the terminal management as a typical busy day, 860 trucks enter the terminal. The number of available gates is two from 14:00 to 22:00 and one for the rest of the day. We set the waiting time limit at 63.2 min.
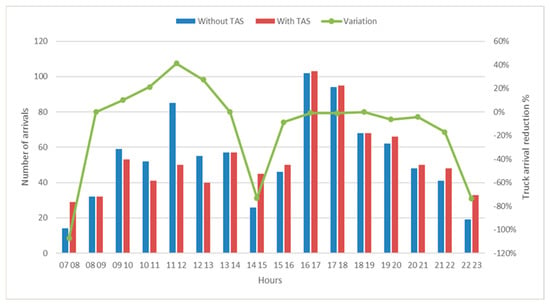
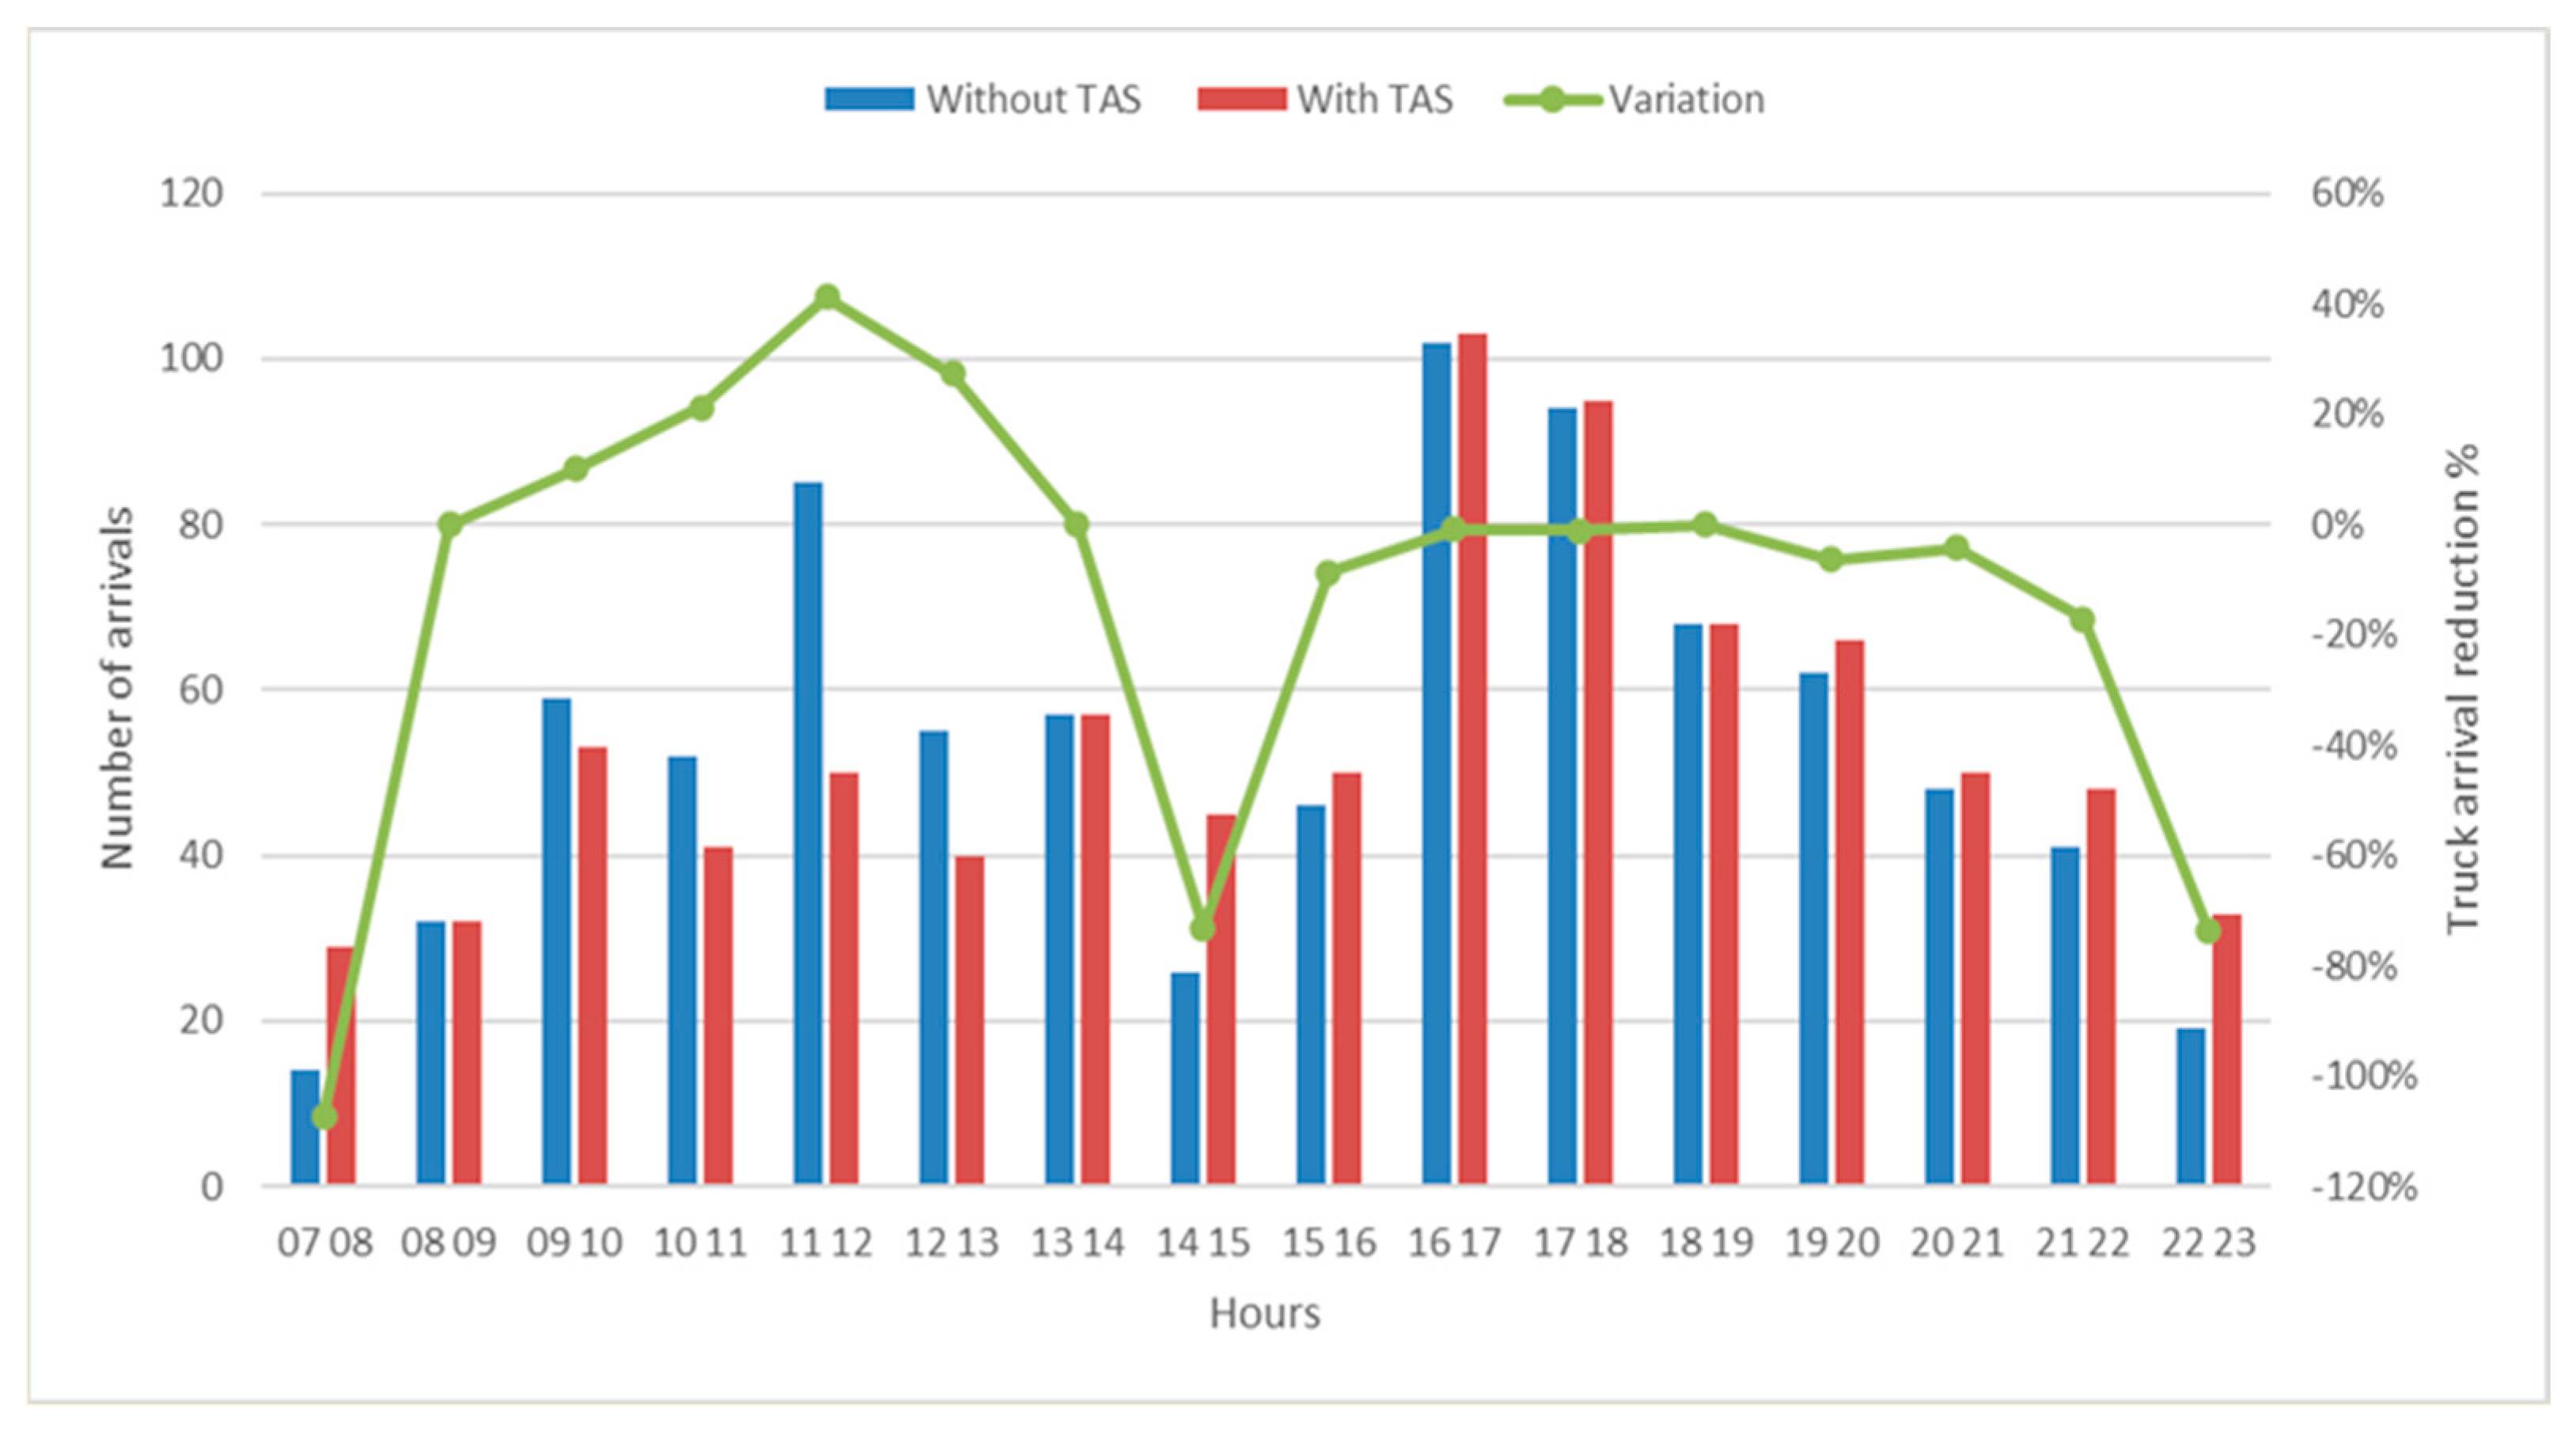
Figure 22 shows the truck arrival rate before optimization (without TAS) and after optimization (with TAS); 67 trucks were rescheduled from their actual arrival time. The arrivals were shifted from morning to afternoon since the number of open gates is larger.
Figure 22.
Truck arrival rates before and after optimization.
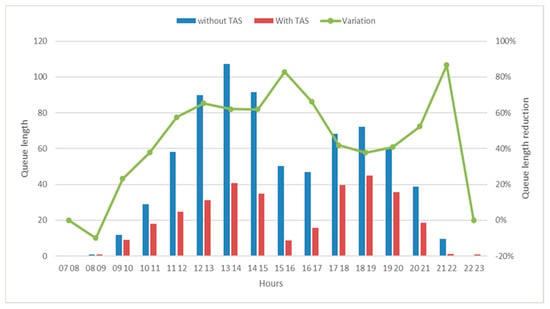
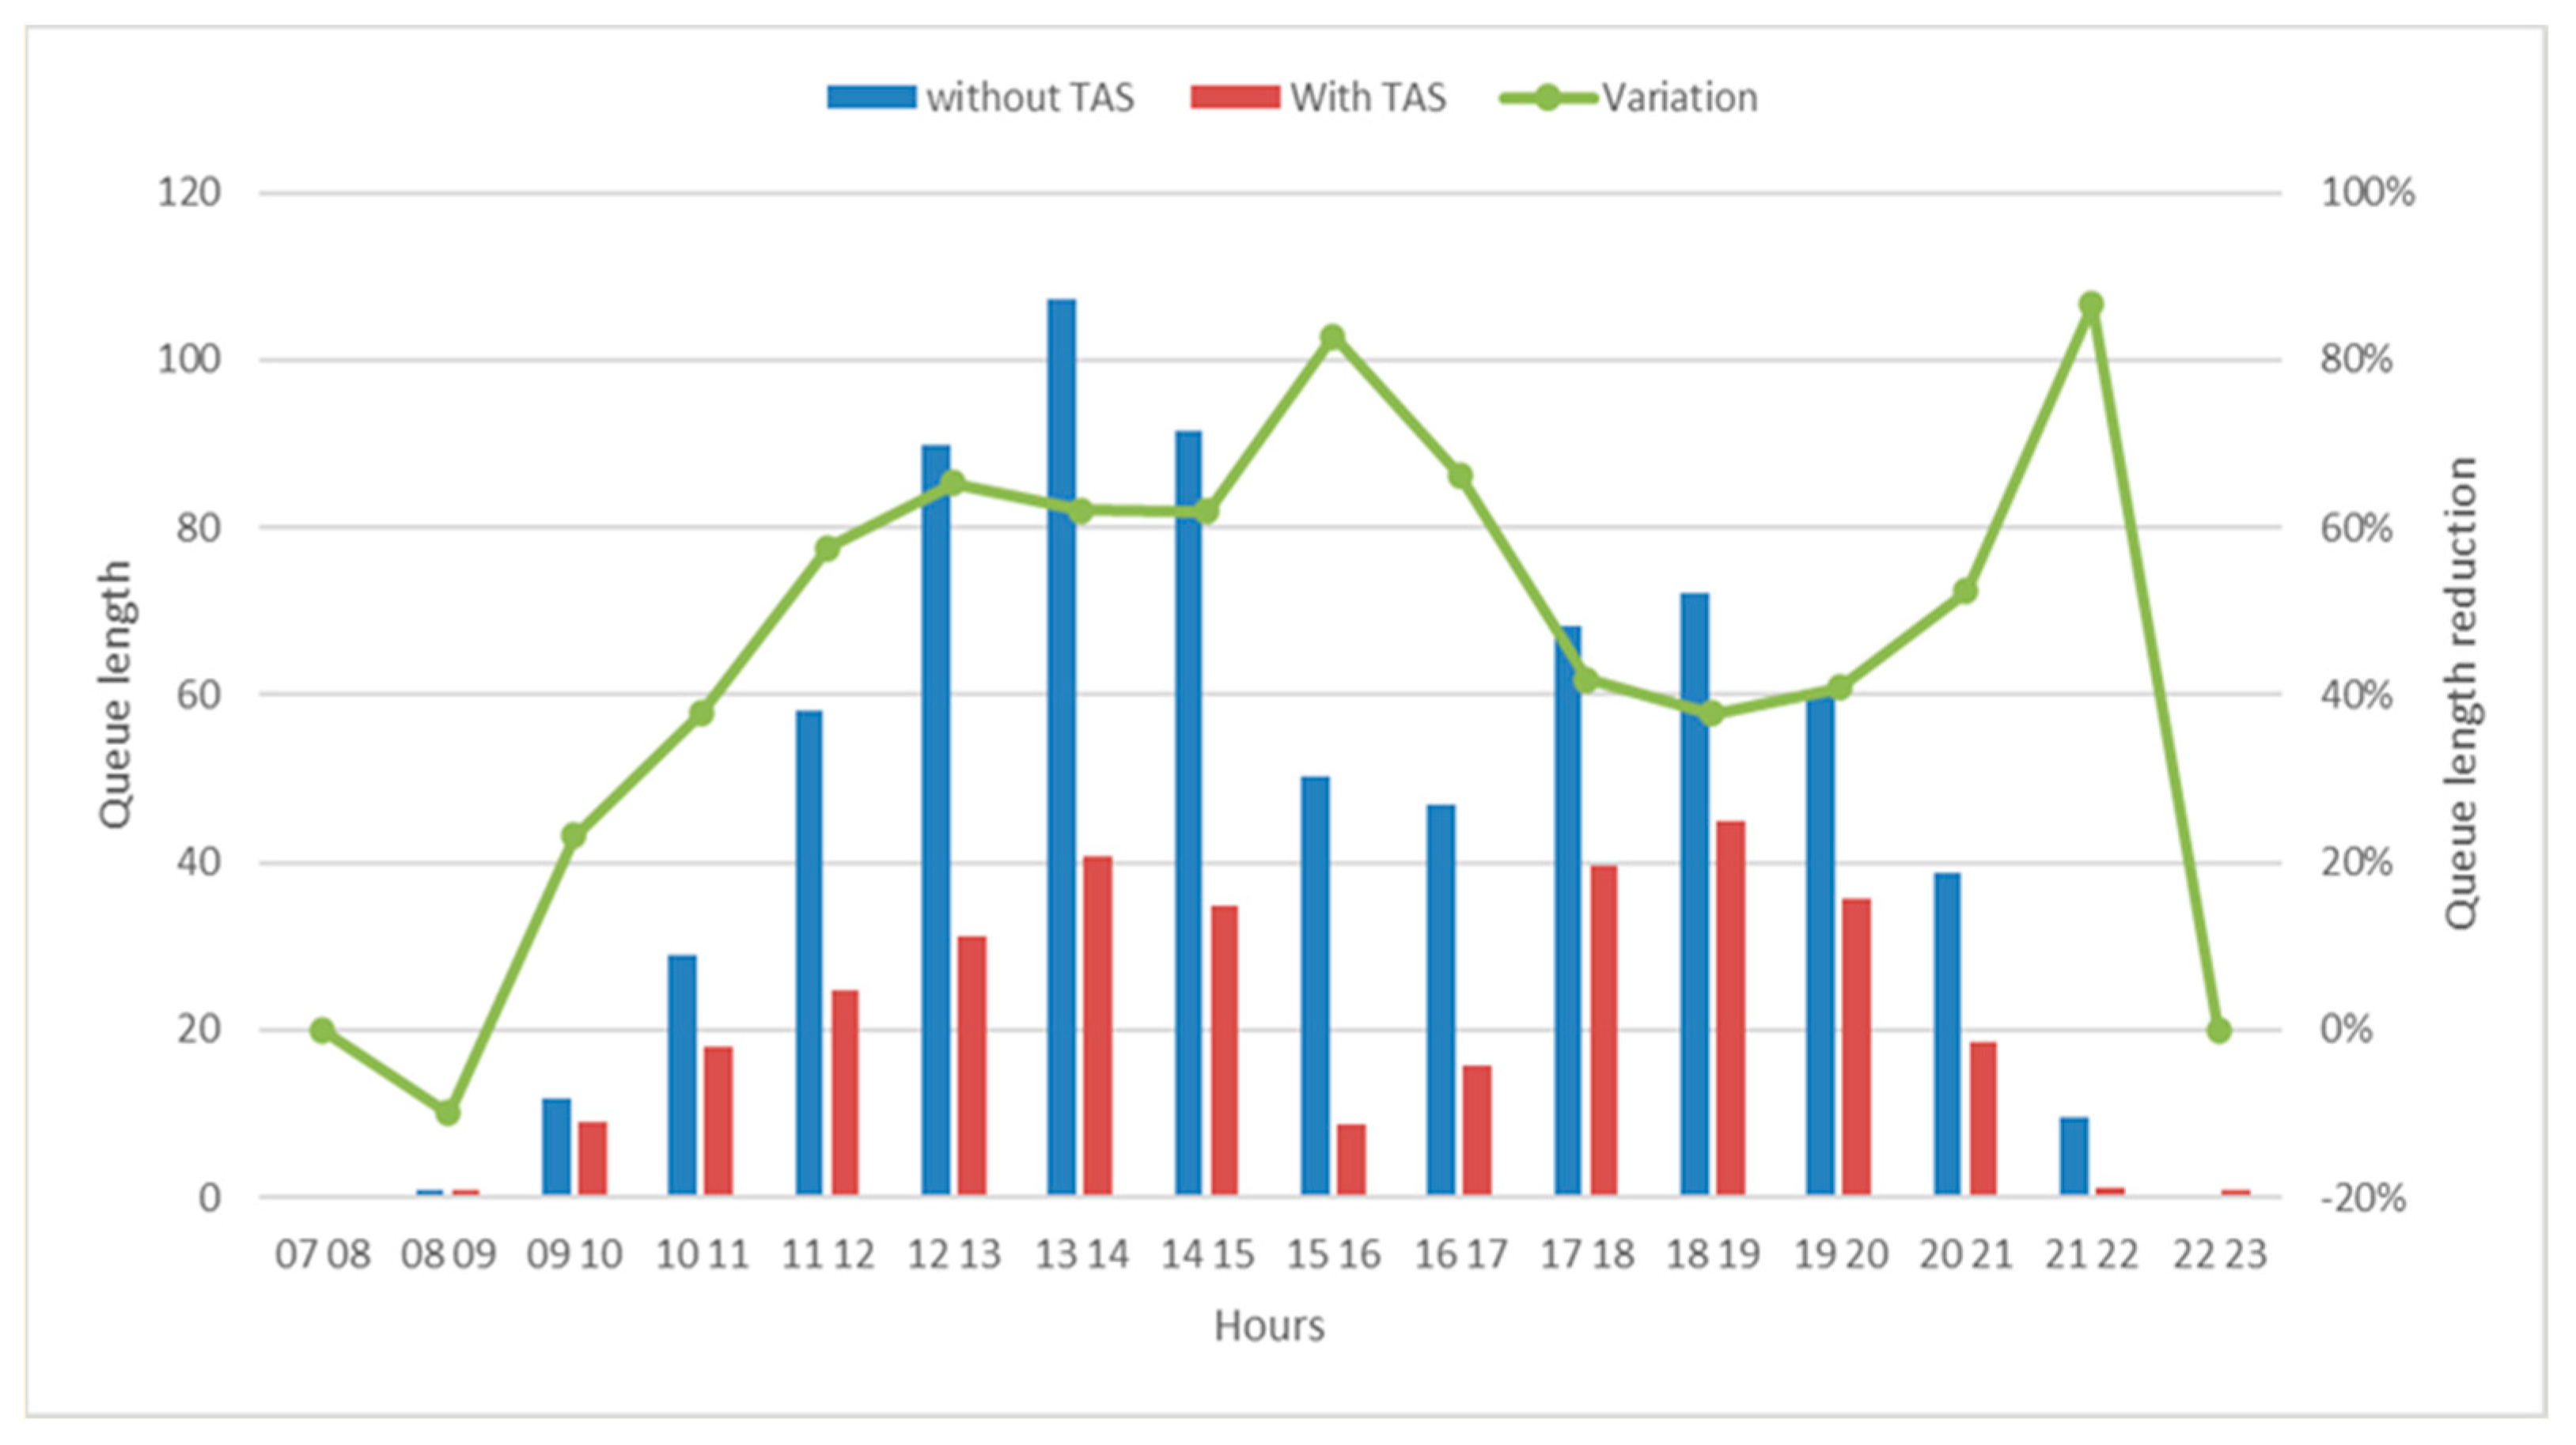
The queue length before and after optimization is shown in Figure 23 with blue and red bars, respectively.
Figure 23.
Queue length before and after optimization.
Truck arrivals were primarily shifted from the morning to the afternoon. As a result, the length of the queue decreases significantly between 10:00 and 17:00. The reduction in queue length during this period ranged from 58% to 83%. Despite the increase in arrivals in the afternoon (compared to the initial distribution), the terminal performance is not negatively affected. The queue length after the optimization remains lower than in the initial case. This could be due to the cumulative impact of the queue length in the first few hours. When the arrival rate exceeds the capacity of the gate, it does not only affect the current hour. It can limit terminal performance for many hours later, despite the increased capacity for the afternoon.
This result shows that collaboration and communication between the terminal and truckers could save time and energy for both parties by synchronizing demand and capacity. Regarding trucker dissatisfaction measured by the percentage of trucks moved, only 7.8% of arrivals were moved from their preferred time. In contrast, the maximum queue length decreases by 62% (from 107 to 41).
The truck arrival coordination enables a significant reduction in truck waiting times, which directly translates into lower fuel consumption and decreased greenhouse gas emissions. This contributes to more sustainable logistics operations by minimizing the environmental footprint of freight transportation. We focus on the emissions from idling trucks. Two types can be considered: “low idle” and “high idle” emission rates. In normal port operation conditions, “low idle” rates are used to assess the emissions inventory. Thus, Equation (23) estimates the reduced truck idling emissions in our study case, where is the idling emission factor listed in Table 10, which follows the Gaz type [43].
Table 10.
Emissions factors of truck engine idling (g/h).
Table 11 shows the yearly emission decreasing for the optimal solution. It is noted that shifting away less than 8% of truck arrivals from peak hours can reduce approximately 785 tones per year. This result supports the claim that coordinating operations is an efficient method, not only for saving time and energy for both parties, but also for reducing truck idling emissions at a container terminal.
Table 11.
The yearly emission reduction for the optimal solution (kg).
It should be mentioned that emissions from moving trucks were not taken into account due to their dependency on the terminal layout.
8. Conclusions
Our work was dedicated to the problem of gate congestion at a container terminal. It presents the management of container flows from both a static and dynamic perspective. This allows for a better understanding of the operations of the container terminal, particularly the gate system and the causes of congestion at this level. A truck arrival management system was modeled, considering the process as a whole. This model serves as a basis for the development of a decision support tool regarding truck arrival processing through an appointment system.
The study of this management system focused primarily on the aspect of optimizing truck waiting times. A method based on a non-stationary approach was developed and validated to measure the truck queue. This method constitutes an integrated part of the proposed optimization model. The optimization results provide possible solutions to mitigate gate congestion, by acting solely on the arrival distribution.
Regarding optimization algorithms, several variants of genetic algorithms were studied in terms of solution quality and processing time. The hybridization of this algorithm with tabu search yields better results and limits variation. The local context was also studied with a case from the Port of Casablanca. Field data were collected and analyzed for the application and adaptation of the optimization model.
However, this work presents some limitations that warrant further studies and deeper research in our future work:
Scope of the study: First, the queue model developed in this study provides a basic framework for the container terminal congestion problem. This study focuses solely on congestion at the gate level and does not address the operation of the container yard. Therefore, the impacts of optimizing the gate system on the functioning of the yard have not been analyzed. The TAS enhances coordination between the port’s four sub-systems by coordinating truck arrivals with handling operations within the port, while reducing idle times for handling equipment, such as straddle carrier and yard crane. This is the main objective to improve overall seaport performance. Since truck movements at the gate directly affect the equipment needs of the yard to handle containers, future studies should integrate the functioning of both systems. Additional data collection should include the characteristics of the yard handling system, truck arrival rates in the yard, equipment and space allocation, truck waiting times, etc. Integrating both systems into a single model would allow for the analysis of the overall operational behavior of the terminal, a better understanding of the terminal’s global congestion, and the optimization of the total truck waiting time. The resource allocation aspect of the terminal should also be considered for better truck arrival planning.
Time slot: Secondly, this study focuses on optimizing the gate system within the initial operating hours (from 7:00 to 23:00 for the case of Casablanca). The option to extend the appointment interval beyond these hours was not analyzed. Obviously, there are additional gate capacities that could be used. Therefore, this seems to be an easy solution. However, this issue requires further investigation to explore all its aspects, considering the constraints of the various stakeholders (port operator, truck drivers, authorities, warehouse managers, etc.). These related issues should be addressed and analyzed.
Optimization algorithm: In this study, variants of genetic algorithms were tested along with hybridization with tabu search. The latter provides stable results but is costly in terms of time. It would be interesting to test other hybridization approaches of these two algorithms or to use other optimization methods to improve both the solution quality and processing time. As for the parameterization of metaheuristics, an a priori parameterization was used in this study. Future work should employ learning-based methods (Meta Learning).
Integration of uncertainties: The limited on-site observations do not cover all situations regarding hourly truck arrival rates; this tends to generalize truck arrival models. In situations involving vessel delays and public holidays, some variations in truck arrival models may not be captured. To study congestion behavior in detail, a thorough simulation is necessary, but this falls outside the scope of this study. Additionally, the management of uncertainties related to appointment non-compliance is of great interest. The impact of these uncertainties on terminal performance and truck waiting times should be studied. It would be interesting to test the potential of the Internet of Things (IoT), which could provide more visibility and flexibility in handling uncertainties through the connectivity of objects (ships, containers, trucks, etc.).
Author Contributions
Conceptualization, F.B.; methodology, F.B., S.B. and Y.M.; software, S.B. and Y.M.; validation, F.B.; formal analysis, S.B. and F.B.; investigation, S.B. and Y.M.; resources, F.B. and S.B.; data curation, S.B.; writing—original draft preparation, S.B. and F.B.; writing—review and editing, J.B., F.B. and S.L.E.; visualization, S.B.; supervision, F.B., S.L.E. and J.B.; project administration, F.B., S.L.E. and J.B. All authors have read and agreed to the published version of the manuscript.
Funding
This research received no external funding.
Institutional Review Board Statement
Not applicable.
Informed Consent Statement
Not applicable.
Data Availability Statement
The raw data supporting the conclusions of this article will be made available by the authors on request.
Acknowledgments
The authors would like to thank the personnel at the Port of Casablanca’s container terminal “EST” for their support in providing data and information for this research.
Conflicts of Interest
The authors declare no conflicts of interest.
Abbreviations
The following abbreviations are used in this manuscript:
| B-PSFFA | Bisection–Point-wise Stationary Fluid Flow Approximation |
| CT | Container Terminal |
| DES | Discrete Event Simulation |
| GA | Genetic Algorithm |
| GHG | Greenhouse Gas |
| PSFFA | Point-wise Stationary Fluid Flow Approximation |
| TAS | Truck Appointment System |
| TS | Tabu Search |
| TTT | Truck Turnaround Time |
References
- Steenken, D.; Voss, S.; Stahlbock, R. Container Terminal Operation and Operations Research—A Classification and Literature Review. OR Spectr. 2004, 26, 3–49. [Google Scholar] [CrossRef] [Scilit]
- Henesey, L.E. Multi-Agent Systems Container Terminal Management. Ph.D. Thesis, Blekinge Institute of Technology, Karlskrona, Suède, 2006. [Google Scholar]
- Dekker, R.; Voogd, P.; van Asperen, E. Advanced Methods for Container Stacking. In Container Terminals and Cargo Systems; Springer: Berlin/Heidelberg, Germany, 2007; pp. 131–154. [Google Scholar]
- Abdelmagid, A.M.; Gheith, M.S.; Eltawil, A.B. A Comprehensive Review of the Truck Appointment Scheduling Models and Directions for Future Research. Transp. Rev. 2022, 42, 102–126. [Google Scholar] [CrossRef] [Scilit]
- Zhao, W.; Goodchild, A. V The Impact of Truck Arrival Information on Container Terminal Rehandling. Transp. Res. E Logist. Transp. Rev. 2010, 46, 327–343. [Google Scholar] [CrossRef] [Scilit]
- Van Asperen, E.; Borgman, B.; Dekker, R. Evaluating Impact of Truck Announcements on Container Stacking Efficiency. Flex. Serv. Manuf. J. 2013, 25, 543–556. [Google Scholar] [CrossRef] [Scilit]
- Zhao, W.; Goodchild, A.V. Using the Truck Appointment System to Improve Yard Efficiency in Container Terminals. Marit. Econ. Logist. 2013, 15, 101–119. [Google Scholar] [CrossRef] [Scilit]
- Zehendner, E.; Feillet, D. Benefits of a Truck Appointment System on the Service Quality of Inland Transport Modes at a Multimodal Container Terminal. Eur. J. Oper. Res. 2014, 235, 461–469. [Google Scholar] [CrossRef] [Scilit]
- Huynh, N.; Walton, C.M. Robust Scheduling of Truck Arrivals at Marine Container Terminals. J. Transp. Eng. 2008, 134, 347–353. [Google Scholar] [CrossRef] [Scilit]
- Azab, A.E.; Eltawil, A.B. A Simulation Based Study of The Effect of Truck Arrival Patterns On Truck Turn Time in Container Terminals. In Proceedings of the ECMS 2016 Proceedings Edited by Thorsten Claus, Frank Herrmann, Michael Manitz, Oliver Rose, ECMS, Regensburg, Germany, 3 June 2016; Volume 2, pp. 80–86. [Google Scholar]
- Abdelmagid, A.M.; Gheith, M.S.; Eltawil, A.B. A Binary Integer Programming Formulation and Solution for Truck Appointment Scheduling and Reducing Truck Turnaround Time in Container Terminals. In Proceedings of the 2020 IEEE 7th International Conference on Industrial Engineering and Applications, ICIEA, Bangkok, Thailand, 16–21 April 2020; pp. 149–153. [Google Scholar] [CrossRef] [Scilit]
- Murty, K.G.; Wan, Y.; Liu, J.; Tseng, M.M.; Leung, E.; Lai, K.-K.; Chiu, H.W.C. Hongkong International Terminals Gains Elastic Capacity Using a Data-Intensive Decision-Support System. Interfaces 2005, 35, 61–75. [Google Scholar] [CrossRef] [Scilit]
- Sharif, O.; Huynh, N.; Vidal, J.M. Application of El Farol Model for Managing Marine Terminal Gate Congestion. Res. Transp. Econ. 2011, 32, 81–89. [Google Scholar] [CrossRef] [Scilit]
- Zhang, X.; Zeng, Q.; Chen, W. Optimization Model For Truck Appointment In Container Terminals. Procedia Soc. Behav. Sci. 2013, 96, 1938–1947. [Google Scholar] [CrossRef] [Scilit]
- Dekker, R.; van der Heide, S.; van Asperen, E.; Ypsilantis, P. A Chassis Exchange Terminal to Reduce Truck Congestion at Container Terminals. Flex. Serv. Manuf. J. 2013, 25, 528–542. [Google Scholar] [CrossRef] [Scilit]
- Chen, G.; Jiang, L. Managing Customer Arrivals with Time Windows: A Case of Truck Arrivals at a Congested Container Terminal. Ann. Oper. Res. 2016, 244, 349–365. [Google Scholar] [CrossRef] [Scilit]
- Schulte, F.; González, R.G.; Voß, S. Reducing Port-Related Truck Emissions: Coordinated Truck Appointments to Reduce Empty Truck Trips. In Proceedings of the Computational Logistics; Corman, F., Voß, S., Negenborn, R.R., Eds.; Springer International Publishing: Cham, Switzerland, 2015; Volume 9335, pp. 495–509. [Google Scholar]
- Namboothiri, R.; Erera, A.L. Planning Local Container Drayage Operations given a Port Access Appointment System. Transp. Res. E Logist. Transp. Rev. 2008, 44, 185–202. [Google Scholar] [CrossRef] [Scilit]
- Chen, G.; Yang, Z. Optimizing Time Windows for Managing Export Container Arrivals at Chinese Container Terminals. Marit. Econ. Logist. 2010, 12, 111–126. [Google Scholar] [CrossRef] [Scilit]
- Torkjazi, M.; Huynh, N.; Shiri, S. Truck Appointment Systems Considering Impact to Drayage Truck Tours. Transp. Res. E Logist. Transp. Rev. 2018, 116, 208–228. [Google Scholar] [CrossRef] [Scilit]
- Chen, G.; Govindan, K.; Yang, Z.-Z.; Choi, T.-M.; Jiang, L. Terminal Appointment System Design by Non-Stationary M(t)/Ek/c(t) Queueing Model and Genetic Algorithm. Intern. J. Prod. Econ. 2013, 146, 694–703. [Google Scholar] [CrossRef] [Scilit]
- Chen, G.; Govindan, K.; Golias, M.M. Reducing Truck Emissions at Container Terminals in a Low Carbon Economy: Proposal of a Queueing-Based Bi-Objective Model for Optimizing Truck Arrival Pattern. Transp. Res. E Logist. Transp. Rev. 2013, 55, 3–22. [Google Scholar] [CrossRef] [Scilit]
- Gracia, M.D.; Mar-Ortiz, J.; Vargas, M. Truck Appointment Scheduling: A Review of Models and Algorithms. Mathematics 2025, 13, 503. [Google Scholar] [CrossRef] [Scilit]
- Abdelmagid, A.M.; Gheith, M.; Eltawil, A. Scheduling External Trucks Appointments in Container Terminals to Minimize Cost and Truck Turnaround Times. Logistics 2022, 6, 45. [Google Scholar] [CrossRef] [Scilit]
- Kim, H.; Lee, J.; Kim, S. Collaborative Truck Appointment System for Container Terminals. J. Traffic Transp. Eng. 2021, 9, 168–178. [Google Scholar]
- Zhao, S.; Yu, X.; Zhang, Y. Predicting Truck Arrival Time at Container Terminals Using LSTM and Transformer Models. J. Mar. Sci. Technol. 2023, 31, 405–418. [Google Scholar]
- Azab, M.; Awasar, P.; Boulmakoul, A. Simulation-Based Optimization for Truck Appointment Scheduling in Container Terminals. Transp. Res. E Logist. Transp. Rev. 2020, 137, 111–124. [Google Scholar]
- Li, S.; Wu, W.; Ma, X.; Zhong, M.; Safdar, M. Modelling Medium- and Long-Term Purchasing Plans for Environment-Orientated Container Trucks: A Case Study of Yangtze River Port. Transp. Saf. Environ. 2023, 5, tdac043. [Google Scholar] [CrossRef] [Scilit]
- Guan, C.; Liu, R. Container Terminal Gate Appointment System Optimization. Marit. Econ. Logist. 2009, 11, 378–398. [Google Scholar] [CrossRef] [Scilit]
- Huiyun, Y.; Xin, L.; Lixuan, X.; Xiangjun, L.; Zhihong, J.; Zhan, B. Truck Appointment at Container Terminals: Status and Perspectives. In Proceedings of the 2018 IEEE Chinese Control and Decision Conference (CCDC), Shenyang, China, 9–11 June 2018; pp. 1954–1960. [Google Scholar]
- Belaqziz, S.; Bouyahia, F.; Lissane ElHaq, S.; Boukachour, J. A Non-Stationary Queuing Approach and Genetic Algorithm for the Optimization of Truck Appointment System in a Container Terminal in Casablanca City. Int. J. Logist. Syst. Manag. 2022, 43, 238–267. [Google Scholar] [CrossRef] [Scilit]
- Cosmetatos, G.P. Some Approximate Equilibrium Results for the Multi-Server Queue (M/G/r). Oper. Res. Q. 1976, 27, 615–620. [Google Scholar] [CrossRef] [Scilit]
- Ng, W.C.; Mak, K.L.; Zhang, Y.X. Scheduling Trucks in Container Terminals Using a Genetic Algorithm. Eng. Optim. 2007, 39, 37–47. [Google Scholar] [CrossRef] [Scilit]
- Xiuwu, Y.; Ying, L.; Yong, L.; Hao, Y. WSN Clustering Routing Algorithm Based on Hybrid Genetic Tabu Search. Wirel. Pers. Commun. 2022, 124, 3485–3506. [Google Scholar] [CrossRef] [Scilit]
- Taheri, S.M.R.; Beheshtinia, M.A. A Genetic Algorithm Developed for a Supply Chain Scheduling Problem. Iran. J. Manag. Stud. 2019, 12, 281–306. [Google Scholar] [CrossRef] [Scilit]
- Yeh, C.-T.; Lin, Y.-K.; Yang, J.-Y. Network Reliability Maximization for Stochastic-Flow Network Subject to Correlated Failures Using Genetic Algorithm and Tabu Search. Eng. Optim. 2018, 50, 1212–1231. [Google Scholar] [CrossRef] [Scilit]
- Glover, F. Paths for Integer Programming. Comput. Oper. Res. 1986, 13, 533–549. [Google Scholar] [CrossRef] [Scilit]
- Gendreau, M.; Potvin, J.-Y. (Eds.) Tabu Search. In Handbook of Metaheuristics; Springer: Boston, MA, USA, 2010; pp. 41–59. ISBN 978-1-4419-1665-5. [Google Scholar]
- Xiao, J.; Lin, B.; Wang, J. Solving the Train Formation Plan Network Problem of the Single-Block Train and Two-Block Train Using a Hybrid Algorithm of Genetic Algorithm and Tabu Search. Transp. Res. Part. C Emerg. Technol. 2018, 86, 124–146. [Google Scholar] [CrossRef] [Scilit]
- Zhang, H.; Liu, F.; Zhou, Y.; Zhang, Z. A Hybrid Method Integrating an Elite Genetic Algorithm with Tabu Search for the Quadratic Assignment Problem. Inf. Sci. 2020, 539, 347–374. [Google Scholar] [CrossRef] [Scilit]
- Zhao, H.; Yao, L.; Mei, G.; Liu, T.; Ning, Y. A Fuzzy Comprehensive Evaluation Method Based on AHP and Entropy for a Landslide Susceptibility Map. Entropy 2017, 19, 396. [Google Scholar] [CrossRef] [Scilit]
- Chen, C.-H. A Novel Multi-Criteria Decision-Making Model for Building Material Supplier Selection Based on Entropy-AHP Weighted TOPSIS. Entropy 2020, 22, 259. [Google Scholar] [CrossRef] [Scilit]
- Available online: https://starcrestllc.com/projectnews.html (accessed on 15 June 2025).



Disclaimer/Publisher’s Note: The statements, opinions and data contained in all publications are solely those of the individual author(s) and contributor(s) and not of MDPI and/or the editor(s). MDPI and/or the editor(s) disclaim responsibility for any injury to people or property resulting from any ideas, methods, instructions or products referred to in the content. |
© 2025 by the authors. Licensee MDPI, Basel, Switzerland. This article is an open access article distributed under the terms and conditions of the Creative Commons Attribution (CC BY) license (https://creativecommons.org/licenses/by/4.0/).