1. Introduction
The escalation of greenhouse gases (GHGs) in the atmosphere leads to global climate change, which has detrimental effects on the environment, society, and economy [
1,
2]. Recently, governments, shareholders, firms, regulators, and consumers have acknowledged that climate change and greenhouse gas emissions are critical issues [
3].
The objective of carbon management is to regulate high emissions of carbon dioxide, which will unavoidably influence the carbon performance of the organization. We contend that there are massive risks related to the economy arising from climate change. CEOs are crucial for successful climate change strategies as they are key in tackling issues like GHG emissions and monitoring firms’ strategic involvement efforts such as carbon initiatives [
2] and tracking companies’ environmental actions [
4].
Meanwhile, a lot of prior research has examined the impacts of executives’ qualities (especially CEOs) on social and environmental variables [
5,
6,
7,
8], as well as previous papers related to non-financial disclosure (e.g., environmental disclosure) [
9]. Nonetheless, little research to date has discussed in detail the crucial roles that CEOs play in carbon emission reduction strategies, in addition to the characteristics of CEOs and their influence on firms’ carbon emissions.
The motivation of this study is the increasing focus on corporate leadership responsibility for sustainability performance, especially in light of regulatory requirements and stakeholder expectations. Although more and more attention has been paid to ESG, the academic literature has not provided an in-depth discussion on how CEO-specific characteristics—including gender, nationality, and multiple directorship—influence firms’ carbon emissions. This is especially relevant in the UK, where mandatory carbon disclosure frameworks (e.g., SECR) have heightened scrutiny of executive-level decisions. Furthermore, we are motivated by the need to understand whether these CEO characteristics have heterogeneous effects across the carbon emission distribution, which traditional mean-based models may obscure. Hence, this study contributes by applying a quantile regression approach to offer a more nuanced view of CEO influence on corporate environmental performance.
This study aims to empirically examine the association between a combination of demographic (gender and nationality) and cognitive CEO characteristics (multiple directorships) and carbon emissions.
Our study introduces CEO nationality and multiple directorships—variables not commonly combined in prior carbon emissions research—as core explanatory factors. In addition to examining demographic traits, we capture cognitive dimensions of CEO influence, thereby contributing a richer conceptualization of executive decision-making in sustainability. Together with our use of quantile regression, this approach allows us to demonstrate how CEO characteristics manifest differently across firms with different levels of emissions—a better interpretation than traditional linear models. Finally, we distinguish between environmentally sensitive and non-sensitive companies, according to standard industry classifications of carbon intensity. This categorization allows us to identify whether CEO characteristics have heterogeneous or amplified effects on industry segments subject to higher levels of regulatory and stakeholder scrutiny—an approach that adds contextual granularity to our findings and remains limited in the present literature.
Beside the cognitive CEO characteristic examined in this study (multiple directorships), the importance of managerial cognitive characteristics, such as management myopia, in shaping corporate environmental performance was highlighted by recent studies [
10]. Management myopia reflects an inclination to give short-term benefits a higher priority over long-term sustainability benefits, which may influence CEOs’ strategies to mitigate carbon emissions.
Using a sample consisting of 295 UK-listed firms from the STOXX 600 Index of European-listed companies, covering the period from 1999 to 2023, our paper uses the stakeholder and upper echelons theories to explain the effect of CEO attributes on carbon emissions. Data related to carbon emissions are acquired from Refinitiv DataStream, while data on the CEO characteristics (gender, nationality, and multiple directorships) are obtained from BoardEx.
This study offers several contributions to the literature. First, we extend the application of upper echelons theory by empirically linking CEO demographic characteristics—including nationality and gender—and multiple directorships as a cognitive CEO characteristic to corporate carbon emissions, a critical yet underexplored sustainability outcome. Second, unlike most previous studies that consider environmental disclosure or ESG scores, we conduct a direct assessment of carbon emissions as a material and policy-relevant indicator of performance. Third, by incorporating sector-level sensitivity to environmental issues, we consider contextual variation in the degree of executive influence, thereby providing a new understanding of the conditional nature of CEO characteristics. Fourth, quantile regression enables us to capture heterogeneous CEO effects at various emission levels—providing methodological contribution to the literature at large in this line of study. Finally, in lines with the other country studies, analyses are performed on UK-listed companies in a pre-and post-Brexit regulations context for the years 1999–2023. This long period enables us to capture CEO impact on carbon emissions under changing sustainability prescriptions.
The remainder of this paper is structured as follows: The theoretical background and hypothesis development are discussed in
Section 2. The data, sample, and methods are explained in
Section 3.
Section 4 presents empirical findings and data analysis.
Section 5 provides the conclusions, implications, and directions for future research.
2. Literature Review and Hypothesis Development
2.1. Theoretical Background
The upper echelons theory suggests that the demographic characteristics of top executives, such as their education level, age, tenure, and gender, significantly influence organizational results, including strategies and effectiveness [
11]. According to the upper echelons theory, individuals with a higher level of education tend to exhibit traits such as open-mindedness, the ability to digest knowledge effectively, and a greater tolerance for change [
11,
12]. The upper echelons theory establishes a connection between the cognitive and demographic traits of the senior management team and the strategic outcomes and performance of the organization. The upper echelons theory posits that organizational outcomes are indicative of the intellectual foundation and values of influential persons inside the organization [
13].
Meanwhile, stakeholder theory highlights the importance of disclosing sustainability information to communicate and build trust with stakeholders [
14], achieving this requires the efforts of the chief executive officer. Stakeholder theory also emphasizes that maximizing the interests of various stakeholders and creating a balance among all stakeholders’ interests is the CEO’s responsibility [
15]. Furthermore, it is notable that the demands and needs of stakeholders are reflected in terms of carbon emission disclosure, placing a significant responsibility on their firms towards the environment and society [
16]. As a result, we employ both theories as a framework to assess the effect of CEO attributes on carbon emissions.
A country’s cultural, social, and religious values are crucial factors in corporate governance and ESG engagement and, consequently, may have an influence on ethical judgments and the CEO’s strategic priorities. CEO nationality can be used as a proxy for cultural orientation. For example, CEOs from countries with strong long-term orientation and collectivist values may place higher emphasis on environmental sustainability, while CEOs from countries with more individualistic or short-term focused contexts may prioritize profitability [
17]. These cultural values may shape policies and decisions related to carbon emission at the firm level. This highlights the importance of assessing how nationality-driven values may affect environmental performance plans and decisions.
2.2. Hypothesis Development
2.2.1. CEO Gender and Carbon Emissions
A lot of studies have discussed the positive impact of female CEOs and the ESG performance. It is revealed that women have different styles of management, values, and expertise than men. They are more capable of meeting the needs of shareholders and better respond to ESG performance [
18,
19,
20]. Matching with gender socialization theory [
21] in which the style of leadership of women is quite different from that of male CEOs, they are more considerate than men and place an emphasis on environmental sustainability matters and other non-profit issues such as employees’ development and the execution of the regulations [
22,
23,
24]. Additionally, female CEOs contribute various resources and capabilities, leading to improved ESG performance within the high-polluting industries (particularly), which are complex to manage in terms of their environmental effect [
25,
26]. Meanwhile, in general, when the number of women is increased on boards, it creates more awareness of ESG performance and a more environmentally beneficial thematic board [
27].
Moreover, prior studies reveal that having females on boards increases the responsibility towards various environmental and moral matters, improving carbon emission performance [
28,
29,
30,
31]. In the same vein, it is argued that women on boards are better motivated towards projects related to the environmental aspect [
32]. As an example, some studies, such as [
33], detailed that boards with gender diversity or a female CEO are more responsive to the needs of stakeholders and responsible for enhancing CO
2 disclosure in the UK.
Similarly, it is found that a gender-diverse thematic board has a positive association with the disclosure of carbon emissions, using a sample of 203 firm-year observations in Australia [
34,
35]. Aligning with stakeholder theory, companies that maintain strong relationships and trust with stakeholders are more prone to enhance their sustainability performance [
36,
37]. Thus, a female CEO has a positive impact on increasing the disclosure of carbon emissions, whether in sustainability reports or yearly reports [
38]. A sample of firms from 43 countries during the 2005–2019 period was used by the authors of [
39] and revealed that gender diversity on boards augments the ESG performance by lowering carbon emissions. A recent study [
40] highlights that firms in Japan with females on boards or a female CEO are more likely to have a lower percentage of carbon (CO
2) emissions. Thus, the following hypothesis was developed:
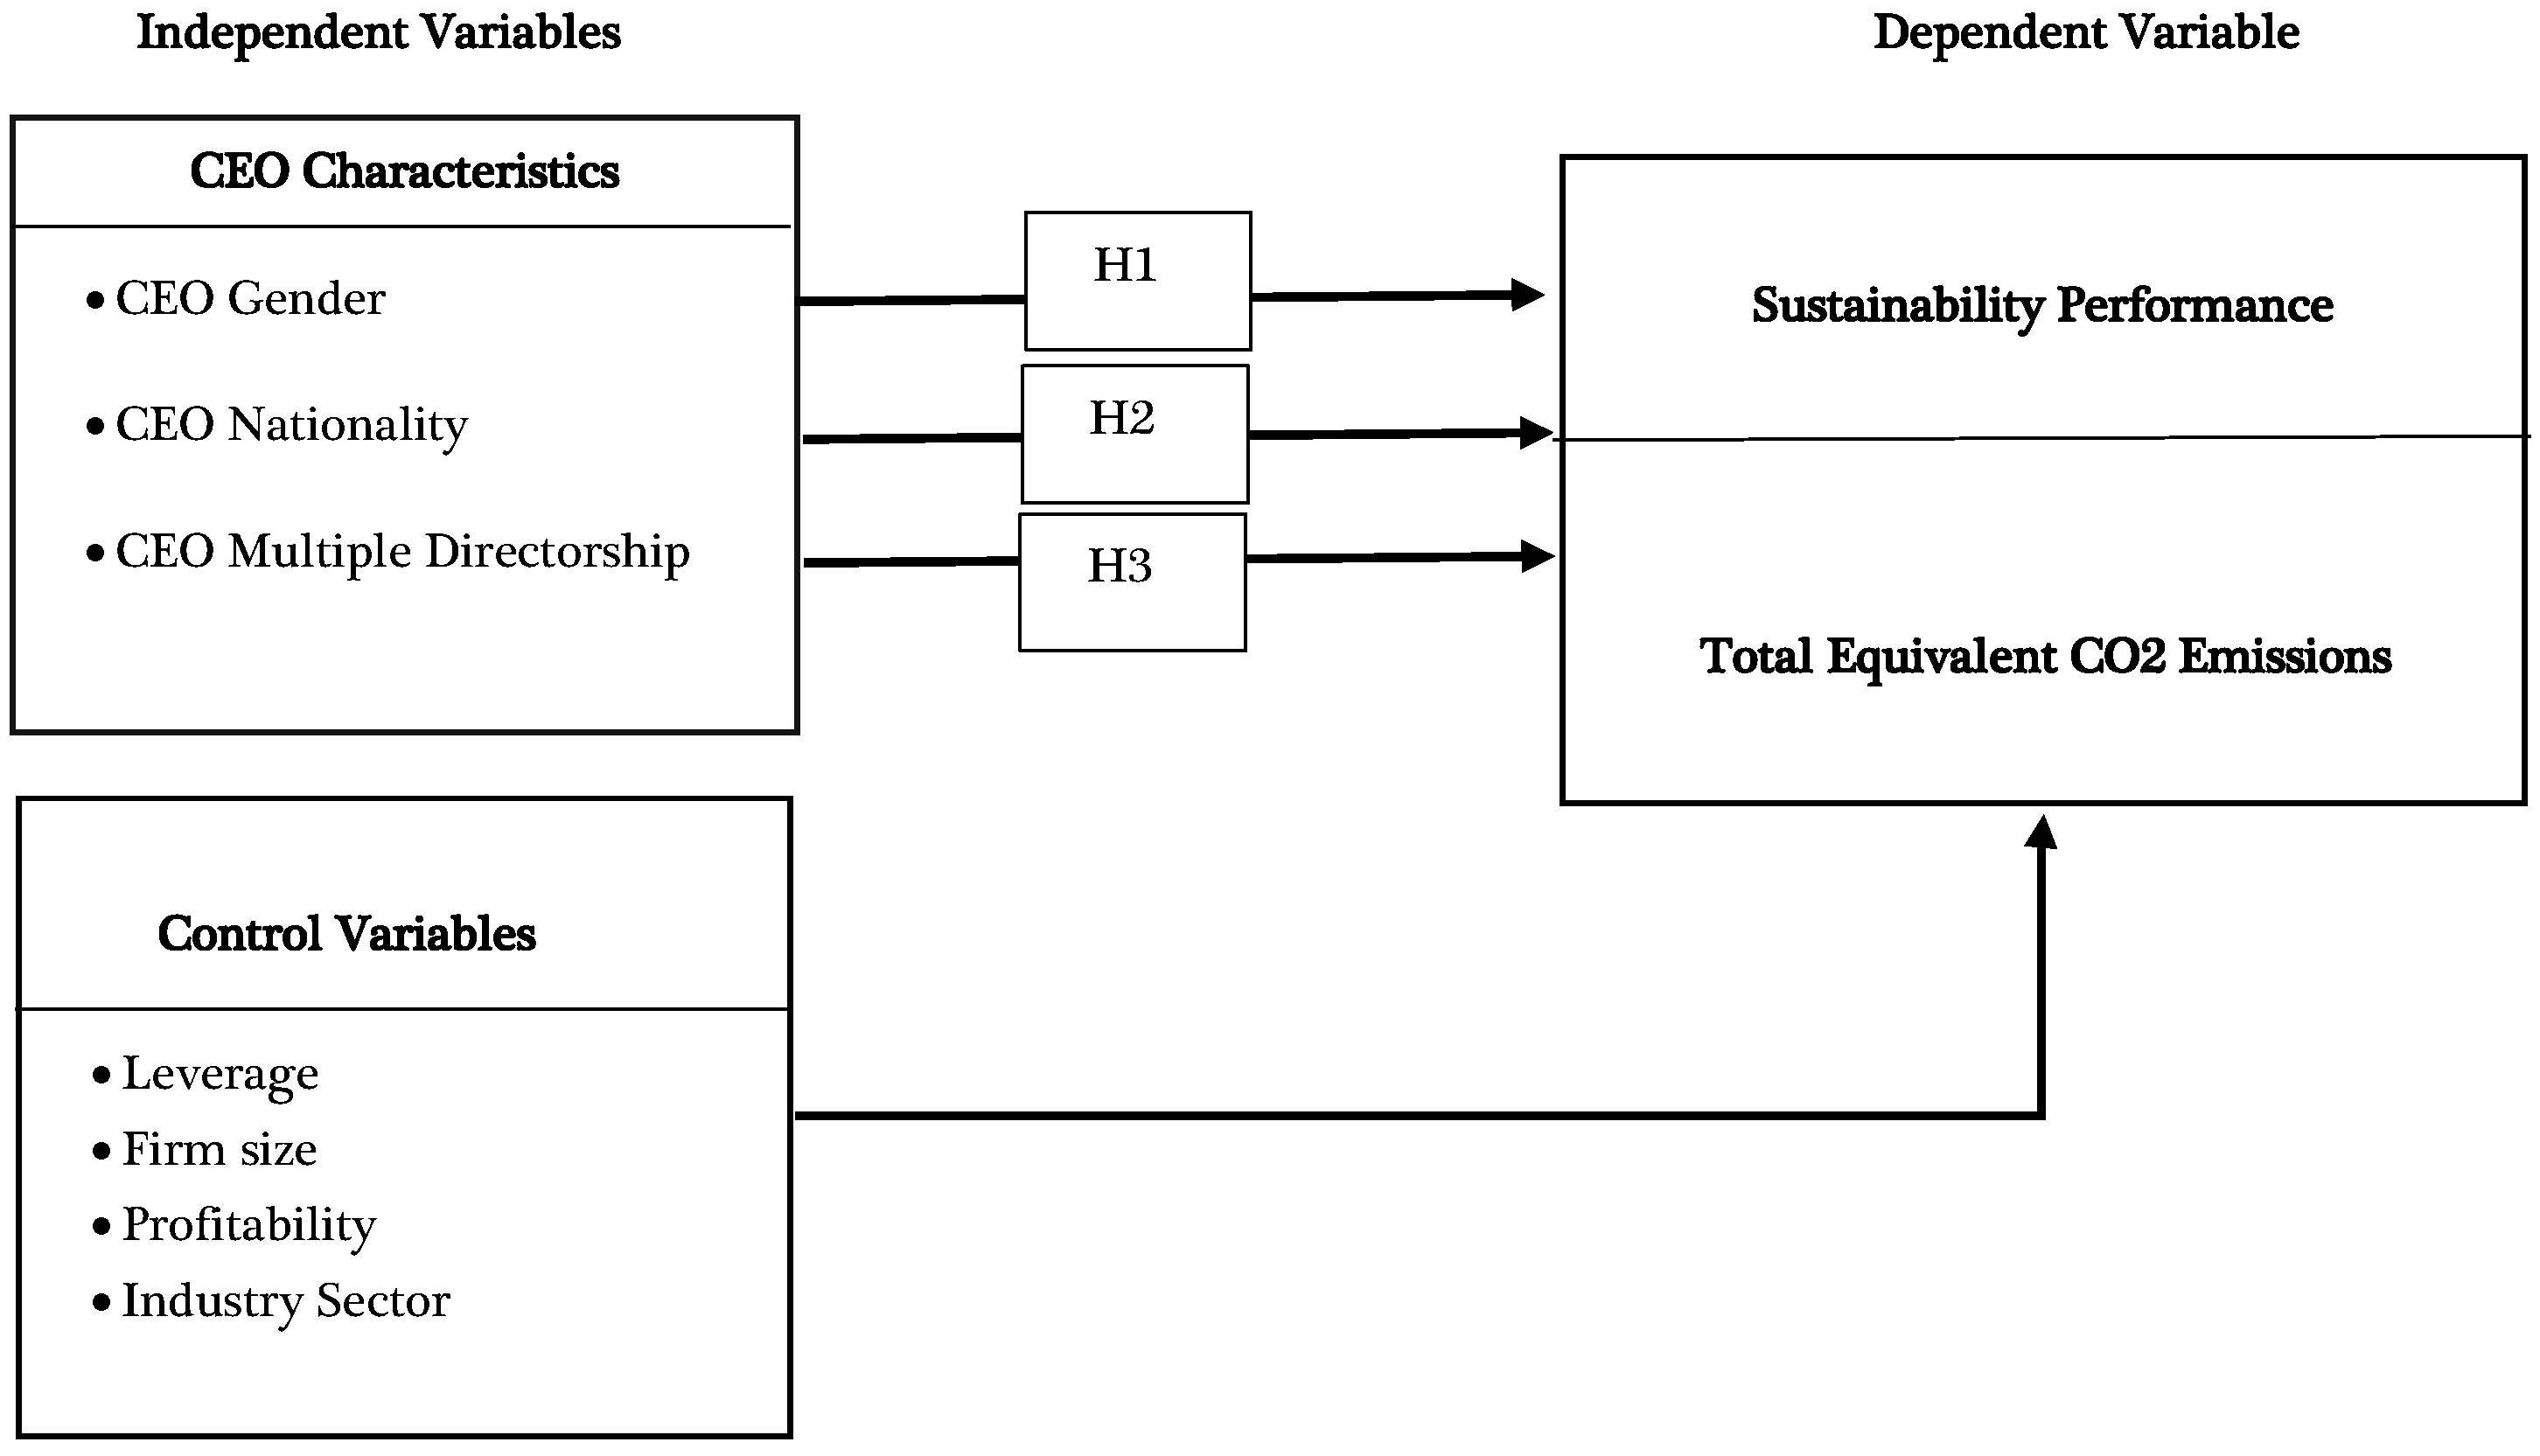
H1. Firms led by female CEOs are associated with lower carbon emission intensity.
2.2.2. CEO Nationality and Carbon Emissions
In relation to the CEO nationality and carbon emissions, it is a debatable issue with some mixed findings. Some previous studies revealed that there is a positive association between the existence of foreign CEOs and sustainability performance, as directors from foreign nationalities usually have diverse knowledge internationally and various exposure levels [
41,
42,
43]. However, some studies [
5,
44] have suggested that the presence of foreign CEOs on boards is associated with higher carbon emissions, as they may prioritize profit maximization to meet shareholder expectations over the environmental performance of their companies. This tendency could be influenced by the CEO’s cultural background from their home country, where sustainability practices might be less emphasized.
While it is also found that foreign CEOs help in minimizing information asymmetrical problems and are more inclined to sustainable disclosure and transparency. Consequently, they are more pressured by shareholders who are highly concerned with the sustainability matter [
42,
45,
46]. In the same vein, the nationality of the CEO is more likely to lead to voluntary disclosure of information related to climate change (e.g., carbon disclosure) to the stakeholders of the firm, which is considered a competitive edge to adhere to the rules and regulations, grounded on the legitimacy theory perspective [
47]. Within the context of the legitimacy theory, it is highly significant that foreign CEOs are more concerned about the stakeholders of the firm, promoting policies related to carbon disclosure; thus, the reputation of the firm is improved especially within high-carbon industries [
48].
It is also perceived that nationality is considered one of the most significant stimuli for sustainability reporting [
49]. Ref. [
50] adds that CEOs from overseas are accountable for various duties such as running the day-to-day business operations, assigning tasks to the employees, and adhering to the rules and regulations of the country in which they are operating (especially within the context of international business). Thus, they are more involved with ESG disclosure activities (especially the environmental aspect) in multicultural countries. Similarly, it is found that companies controlled by foreign CEOs have a high tendency to disclose information regarding sustainable performance rather than companies controlled by non-foreign CEOs [
51]. Therefore, the following hypothesis was developed:
H2. There is a positive association between the presence of a foreign CEO and carbon emissions.
2.2.3. CEO with Multiple Directorships and Carbon Emissions
Despite the significance of this variable, there are few studies that have discussed the number of quoted boards that the CEO has served on and its relationship with ESG performance. Refs. [
52,
53,
54] found that the number of directorships a CEO holds can significantly influence organizational performance, as suggested by research on resource dependence theory [
55] and agency theory [
56].
Some studies reveal that busy CEOs positively improve their experience, knowledge, and skills; consequently, they lead to better ESG performance [
57]. Another recent study [
58] supports the association between busy directors and the environmental and social performance of the firm specifically. In the same vein, the authors of [
59,
60] suggest that directors with multiple board memberships may be more likely to report sustainability practices in their companies’ annual or sustainability reports, potentially viewing these practices to enhance their organization’s competitive position.
In contrast, some studies, such as [
61] and those based on the attention/busyness theory, suggest that there is a negative association between the number of quoted boards that CEOs have served on and carbon emissions. In this context, the attention of busy directors may be divided between various boards, as well as their commitment obligations among different firms. It is worth mentioning that within the U.S. context, there is no restriction regarding the number of quoted boards that the director can hold. However, corporate governance laws have indicated that multiple directorships have a negative association with the director’s commitment to various responsibilities [
62].
Moreover, it is noteworthy to point out two main concepts regarding this matter, which are the implementation of ESG practices and their monitoring. Mostly, executing the ESG practices by the CEO requires less effort to implement and to instantly respond to the shareholders’ expectations [
63]; however, ongoing monitoring ESG practices, improving them, and adhering to various rules and technological aspects demand constant commitment [
3].
Nonetheless, some studies have also stated that there is a positive association between CEOs with multiple directorships and ESG practices [
64,
65,
66], whereas other literature refers to a positive association between busy directors and ESG practices within specific contexts [
67,
68]. Aligning with this, the authors of [
69,
70,
71] agree that experienced or busy directors (including CEOs) positively influence the environmental (carbon emissions) performance of the firms (mainly in environmentally sensitive industries) because of the outside pressure of the stakeholders. Hence, the following hypothesis was developed in conjunction with the attention/busyness theory [
3,
62].
H3. The presence of directors with multiple directorships is associated with higher levels of carbon emissions.
Therefore, the following conceptual framework was developed, as shown in
Figure 1:
3. Methods
3.1. Sampling and Data Collection
The initial sample comprises 295 UK-listed firms from the STOXX 600 Index of European-listed companies, covering the period from 1999 to 2023. Additionally, data for this study were collected from Refinitiv Eikon and BoardEx.
Meanwhile, following the same classification of the industry type as cited in ref. [
72], the sample was classified into 11 industries as follows: consumer discretionary, basic materials, finance, energy, real estate, technology, telecommunications, utilities, consumer staples, healthcare, and industrials. Additionally, the firms within the sample are categorized into sensitive firms and non-sensitive firms. The non-sensitive firms are healthcare, real estate and technology.
This study focuses on UK firms within the STOXX Europe 600 that constitute approximately 22.3% of the index—making the UK the single largest country representation within the index. UK-listed firms span a wide range of 11 industries aligned with the Industry Classification Benchmark (ICB), including carbon-intensive sectors such as energy, utilities, industrial goods, and materials. This sectoral diversity enhances the generalizability of our findings. Additionally, the UK is a global leader in ESG disclosure regulation, with robust environmental reporting mandates such as the Streamlined Energy and Carbon Reporting (SECR) framework. These regulatory structures provide consistent and comparable emission data over a long horizon. The availability of firm-level carbon emission disclosures, coupled with detailed CEO demographic data, makes the UK an appropriate and data-rich setting to explore the role of CEO characteristics in shaping corporate environmental performance. Unlike prior studies that often limit their analysis to firms in the FTSE 100 or FTSE 350 indices, our study draws on a wider cross-section of UK firms within the STOXX Europe 600 universe. This allows for broader industry representation and cross-country comparability, while preserving a UK focus within a well-defined pan-European index framework.
3.2. Variables Measurement
Table 1 shows the independent variables used in this study, which are CEO gender, nationality, and multiple directorships, while the dependent variable is carbon emissions, and the control variables are firm size, profitability, leverage, and industry type.
3.3. Statistical Models
We investigate the impact of CEO characteristics on carbon emissions of UK-listed Companies. We consider the following regression model:
where
is the total equivalent CO
2 emissions (sustainability performance),
are the independent variables and control variables
are the regression coefficients to be estimated and ε
i,t is the error term.
Carbon emissions can be quantified using various metrics. One of the commonly utilized measures by researchers [
72,
73,
74,
75,
76] is the total equivalent CO
2 emissions in tons, which is listed in
Table 1. We use total CO
2 emissions in the dependent variable; however, we control for firm size using the natural log of total assets to control for scale effects and to allow comparability across firms of differing sizes.
To explore this relationship more deeply, we use the quantile regression instead of classical linear regression. Quantile regression is preferred over linear regression because the later captures the impact of the explanatory variables in the center of the distribution (the average effect) without addressing any evidence about how these variables affect the dependent variable across the whole distribution at different levels of sustainability/CO2 emission, i.e., what happens in the case of low CO2 emission firms versus medium and high CO2 emission firms. That is, a given explanatory variable may have a negative effect at a given quantile and positive or no significant effect at another quantile. In summary, quantile regression captures heterogeneity.
The quantile regression model, introduced by ref. [
91] (see also [
92,
93,
94]), can be written as follows:
where
are the parameters specific to each quantile α (α is a probability between zero and one).
In this study, we use quantile regression to examine the heterogeneous impacts of CEO attributes across the distributions of carbon emissions within 10th, 50th and 90th quantiles to capture firms with low, medium and high levels of carbon emissions. We chose this as we were encouraged by policy relevance and data distribution. From a distributional aspect, these various quantiles allow us to pinpoint whether the influence of CEO attributes differs across carbon emissions intensity levels. As an example, for firms at lower ends (10%) and at upper ends of the distribution (90%), each group is subjected to specific governance patterns or goals, compared to medium-emitting firms (50%). This gives us a better understanding than using the traditional OLS regression. From the policy point of view, these quantiles match regulatory frameworks, in relation to the high-polluting companies and low-polluting ones. Mostly, high-polluting firms (at 90%) are subjected to strict scrutiny from regulators and society, while low-emitting firms (at 10%) act as a good example for well-established environmental practices and their compliance with the rules and regulations. By incorporating the medium-emitter firms (at 50%), we gain more insights into the median firms within the UK context.
Compared to least squares regression, quantile regression minimizes the absolute deviations instead of squared deviations, giving the least weight to large deviations. In addition, quantile regression estimates different parameters (betas) for different quantiles and this leads to the assignment of different weights to large values in different quantiles, heavily reducing the effect of possible outliers in low quantiles, i.e., a type of clustering of data around different quantiles. That is, quantile regression imposes no assumptions about residual distribution or homoscedasticity, rendering it robust to outliers and skewed data, and outperforms OLS regression especially in small sample settings.
4. Results and Discussion
4.1. Descriptive Statistics
Table 2 shows descriptive statistics for total CO
2 equivalents in tons, CEO characteristics, and control variables for all the firms in the sample. The descriptive analysis comprises the mean, standard deviation, minimum, and maximum. We find that the mean value of total CO
2 equivalents is 1,217,488.00 tons and its standard deviation is 6,467,725, demonstrating a substantial spread in the emissions. Moreover, the minimum is 0, revealing some companies have no CO
2 emissions, while the maximum is very high (117,482,635.00). This means that a few firms are key contributors. The mean value of CEO gender is 0.05 and the standard deviation is 0.23, suggesting a small percentage of the sample size are female CEOs. The mean and standard deviation for CEO nationality are 0.24 and 0.43, respectively. Additionally, the average of CEOs with multiple directorships is 2.21 and the standard deviation is 1.59.
Sample by Industry Type
Table 3 describes the means of total CO
2 equivalents by industry type and by sector. Regarding Panel A data, it is noteworthy that the basic materials industry has the highest mean of CO
2 emissions at approximately 11.54 million tons, followed by the utilities industry at 9.78 million tons. These industries appear to have a negative impact on the environment. However, financial and technology industries display much smaller means of carbon emissions (around 10,653 and 9045, respectively) and this implies that both industries have less direct influence on the environment compared to the basic material and utilities sectors. In relation to consumer discretionary and staples, although they have moderate CO
2 emissions, their impact is lower in contrast to other highly intensive industries. Panel B data represent the mean percentages of the sensitive and non-sensitive industries. As shown, 79.69% is the mean percentage allocated for the sensitive industries, and the remaining mean percentage (20.31%) is allocated for the non-sensitive industries.
4.2. Pearson’s Correlation Coefficients
Table 4 presents Pearson’s correlation coefficients. The Pearson correlation coefficient is less than 0.7, indicating that there is no multicollinearity problem between the independent variables.
We computed the VIF score and the values for all regressors to be around 1, which shows that there is no issue of multicollinearity, as shown in
Table 5.
4.3. Hypothesis Testing
Table 6 and
Table 7 depict quantile regression to examine the effects of CEO characteristics on carbon emissions across the overall sample of UK-listed firms, sensitive, and non-sensitive firms. The results are presented for the 10%, 50%, and 90% percentiles, revealing significant insights into how these relationships vary across carbon levels. As for the CEO gender, within the 10% quantile in sensitive firms, it is noteworthy that it has an insignificant effect on reducing carbon emissions in low emission companies within sensitive industries, aligning with previous studies [
95,
96]. One possible explanation is that such companies may already have solid practices regarding sustainability and carbon emissions issues, therefore limiting the scope for additional influence of the top executive on carbon emission mitigation. Additionally, the insignificant effect of female CEOs in sensitive industries may be driven by industry-specific constraints that limit CEO autonomy. Some sectors, such as energy, mining, and manufacturing, are male-dominated and have existing norms, hierarchical cultures, and opposition to new leadership styles [
97,
98]. In these and similar contexts, female executives could be subjected to heightened scrutiny, have weaker board support, or limited ability to influence strategic actions –all of which might limit their ability to translate personal environmental values into emissions outcomes, despite gender socialization theory predictions.
It is also found that the presence of female CEOs decreases the carbon emissions in companies with medium-level emissions in non-sensitive industries. Since, female CEOs are perceived to have more knowledge and are better equipped with resources and skills, they are more likely to improve carbon emissions, consistent with gender socialization theory [
21] and upper echelons theory [
11,
29,
30,
31].
As for CEO nationality, within the 10% and 50% quantiles, CEO nationality is highly significant and has a positive association (
p-value < 0.01) with carbon emissions across the overall sample of UK-listed firms, as shown in
Table 6. This signals that the existence of foreign CEOs may lead to an increase in carbon emissions across the overall sample of UK-listed firms, across the three levels of carbon emitters within the sensitive industries, and within low- and high-level emitters within the non-sensitive industries in the same direction as some prior studies [
5,
44]. Due to the variations in the UK regulatory frameworks, foreign CEOs might be less acquainted with local environmental policies or less willing to adhere to them. For example, the challenges exhibited by foreign executives with post-Brexit environmental regulations arise from substantial changes in compliance requirements, governance and reporting responsibilities.
Additionally, another possible reason might be the cultural aspect of foreign executives, which could substantially differ within the UK context. Foreign CEOs are influenced by the culture of their home country, in which they may prioritize short-term profitability rather than allocating resources to sustainability projects. Their experience in countries with weaker environmental enforcement or differing carbon accountability norms [
10,
99] may influence their decision-making, in line with the upper echelons theory. Consequently, foreign CEOs might find this challenging when adapting to these adjustments, leading to the ineffective implementation of carbon mitigation plans or even non-compliance with the regulatory requirements.
While the CEO has multiple directorships, it is found that the CEO with multiple directorships is highly significant in relation to carbon emissions (
p-value < 0.01) within medium-level emitters across the overall sample of UK-listed firms and highly carbon-emitting firms across the overall sample (
p-value < 0.1) and sensitive industries. Consistent with agency theory [
56], CEOs with multiple directorships may be responsible for high carbon emissions, as the attention of busy directors may be diversified between various boards as well as their commitment to obligations among various firms. Subsequently, busy directors will not be focused on taking initiatives related to sustainability and carbon emission practices, in accordance with attention/busyness theory [
62] and other previous studies [
3,
61].
Furthermore, as demonstrated in
Table 6 and
Table 7, profitability has significant positive results for the medium-level carbon emitters across the overall sample of UK firms and within the non- sensitive industries (
p-value < 0.01). Further, there is a positive significant association between profitability and carbon emissions within the 10% quantile (
p-value < 0.1). This supports the idea that firms with high profits tend to give less attention to carbon emission strategies, consistent with the studies of [
100,
101]. It is also demonstrated that firm size has a highly significant positive impact on carbon emission performance (
p-value < 0.01) within all the percentiles across the overall sample of UK-listed firms, sensitive, and non-sensitive firms. The larger the firm size, the greater the carbon emissions, and consequently, higher chances of pollution exist, especially within highly sensitive industries, which is in line with the results of various studies [
3,
46].
The leverage represents a complicated relationship with carbon emissions. There is a significant positive association between leverage and carbon emission performance within low-carbon emitters (10% quantile) (
p-value < 0.05) and medium-carbon emitters (50% quantile) (
p-value < 0.01) across the overall sample of UK-listed firms. There is also a highly significant positive relationship between the leverage and carbon emission performance of low-carbon emitters and medium-carbon emitters within sensitive industries (
p-value < 0.01). Taking this into account, excessive leverage may hinder carbon emission reduction, thus resulting in an underestimation of the importance of reasonable financial control in relation to the objectives of sustainability (especially carbon emissions). In addition, high leverage will push the company to focus more on paying its debts rather than incurring costs to reduce carbon emissions, as they are pressured by their creditors in compliance with stakeholder theory [
102,
103].
On the other hand, it is clear that there is a significant negative association between leverage and low-level (
p-value < 0.1) and medium-level (
p-value < 0.05) carbon emitters within non-sensitive industries. This suggests that moderate leverage may motivate low- to medium-carbon emitters in non-sensitive industries by allowing investments in carbon reduction strategies, in line with ref. [
34,
104].
We used the Wald test, as reported in
Table 8, to test for the symmetric quantile effect and the test is strongly rejected when testifying for heterogeneous effects across quantiles.
5. Conclusions
This study focuses on a set of CEO demographics (gender and nationality) and a cognitive characteristic (multiple directorships) and examines their associations with carbon emissions among UK-listed firms by drawing on the upper echelons and stakeholder theories. The study is conducted on a total of 295 UK-listed firms from the STOXX 600 Index of European-listed companies, covering the period from 1999 to 2023. Descriptive statistics, quantile regression, and correlation are employed to examine the association between CEO characteristics and the carbon emissions of the UK-listed firms.
The results contribute to the existing literature on corporate governance, sustainability, environmental performance, and carbon emissions. As mentioned before, the use of quantile regression in a study is an addition to the literature, since most studies have used the traditional pooled ordinary least squares regression, which statistically has some negatives that can be addressed by quantile regression. The findings of the study reveal that female CEOs have a minor impact on reducing carbon emissions in low-emission companies within sensitive industries. However, their role is widely emphasized in companies with medium-level emissions in non-sensitive industries, a result explained by gender socialization theory and upper echelons theory.
Furthermore, foreign CEOs may lead to an increase in carbon emissions across the overall sample of UK-listed firms and across the three levels of carbon emitters within sensitive industries, and within low- and high-level emitters within the non-sensitive industries, consistent with other studies. The UK differs in terms of the presence of foreign CEOs and their impact on carbon emissions. Foreign CEOs may have less familiarity with local environmental policies or different levels of commitment to adhering to them due to the cultural background of their home country. Likewise, the continuous updates to the UK’s environmental regulations, designed to align with global climate objectives, can be difficult to keep up with. Subsequently, foreign CEOs might find this challenging when adapting to these adjustments, resulting in unsuccessful implementation of carbon mitigation plans or even non-compliance with the regulatory requirements.
As for the results of the CEO with multiple directorships, it was found that there is a highly significant positive association between busy CEOs and carbon emissions in the UK-listed firms, specifically in sensitive industries. CEOs with several directorships may be responsible for larger carbon emissions in their companies, as busy directors’ attention may be divided between various boards, as well as their commitments to various firms. As a result, busy directors will not be focused on taking actions linked to sustainability and carbon emission practices, according to the attention/busyness hypothesis.
The findings of this study have significant implications for managers, regulators, and investors. To make CEOs more environmentally accountable—especially foreign CEOs who might struggle with adapting to the UK sustainability terrain—regulators could implement ESG orientation programs or onboarding modules to ensure that foreign CEOs align with national climate policies, disclosure norms, and stakeholders’ expectations. Additionally, institutional investors and boards might choose to link some executive compensation to measurable reductions in emissions, reinforcing the importance of environmental goals through financial incentives. It should not just be token gestures promoting gender diversity in senior management teams, particularly in non-sensitive industries where CEOs may have a high degree of strategic discretion. Mechanisms, such as formal mentorship and sponsorship programs, gender neutral succession planning and leadership pipelines for sustainability-minded female managers, may translate diversity into continuing environmental performance improvements.
We acknowledge that the exclusion of certain CEO characteristics (such as tenure, education) and firm-level environmental governance practices could lead to omitted variable bias. Although these variables could have enhanced the model, data limitations across the sample precluded the consideration of their inclusion. Future research could incorporate such variables, where data availability allows, to further refine the understanding of executive influence on carbon emissions. Moreover, to mitigate the risk of omitted variable bias, our models include a robust set of firm-level control variables (e.g., size, profitability, leverage, and industry fixed effects) that are commonly associated with emissions performance and partially account for unobserved heterogeneity.
As CEO impact is multidimensional, we propose that future studies should combine other demographic (e.g., age, education) and cognitive or behavioral characteristics (e.g., risk tolerance, managerial myopia) in order to gain additional insights on sustainability performance-related factors at the top management level. Furthermore, future studies could examine specific national cultural factors using frameworks introduced by [
99] or [
17] to better predict and explain the cross-cultural effects.
Author Contributions
Conceptualization, M.A.K.B.; Data curation, N.K. and H.E.; Formal analysis, N.K., M.A.K.B. and H.E.; Funding acquisition, N.K.; Investigation, A.F.E.; Methodology, M.A.K.B. and M.B.; Project administration, M.A.K.B. and A.F.E.; Resources, N.K. and H.E.; Software, M.B.; Supervision, M.A.K.B. and A.F.E.; Validation, M.B.; Visualization, N.K. and M.B.; Writing—original draft, N.K. and H.E.; Writing—review and editing, M.B. and A.F.E. All authors have read and agreed to the published version of the manuscript.
Funding
This research is funded by the American University in Cairo. Agreement Number: BUS-ACCT-N.K-FY25-MG-2025-May-21-08-55-37.
Institutional Review Board Statement
Not applicable.
Informed Consent Statement
Not applicable.
Data Availability Statement
The data used in our research were obtained from third-party commercial databases, specifically Refinitiv DataStream and BoardEx. These databases are subscription-based and require a licensing agreement to access their content. As such, the data are not publicly available, and we are legally restricted from sharing it directly with others.
Acknowledgments
The authors gratefully acknowledge the support received from the American University in Cairo and the German University in Cairo that made this study possible. We deeply appreciate the institution’s commitment to fostering academic research and innovation.
Conflicts of Interest
The authors declare no conflicts of interest.
Abbreviations
The following abbreviations are used in this manuscript:
| ESG | Environment, Social and Governance |
| CEO | Chief Executive Officer |
| UK | United Kingdom |
| CO2 | Carbon Dioxide |
References
- Sørensen, O.B.; Pfeifer, S. Climate Change Issues in Fund Investment Practices. Int. Soc. Secur. Rev. 2011, 64, 57–71. [Google Scholar] [CrossRef]
- Peters, G.F.; Romi, A.M. Does the Voluntary Adoption of Corporate Governance Mechanisms Improve Environmental Risk Disclosures? Evidence from Greenhouse Gas Emission Accounting. J. Bus. Ethics 2014, 125, 637–666. [Google Scholar] [CrossRef]
- Haque, F. The Effects of Board Characteristics and Sustainable Compensation Policy on Carbon Performance of UK Firms. Br. Account. Rev. 2017, 49, 347–364. [Google Scholar] [CrossRef]
- Walls, J.L.; Berrone, P. The Power of One to Make a Difference: How Informal and Formal CEO Power Affect Environmental Sustainability. J. Bus. Ethics 2017, 145, 293–308. [Google Scholar] [CrossRef]
- Huang, S.K. The Impact of CEO Characteristics on Corporate Sustainable Development. Corp. Soc. Responsib. Environ. Manag. 2013, 20, 234–244. [Google Scholar] [CrossRef]
- Le, S.A.; Fuller, B.; Muriithi, S.G.; Walters, B. The Influence of Top Managers’ Values and Power on Corporate Social Performance: A Meta-Analysis. Acad. Manag. Proc. 2013, 2013, 9–27. [Google Scholar] [CrossRef]
- Kang, J. Unobservable CEO Characteristics and CEO Compensation as Correlated Determinants of CSP. Bus. Soc. 2017, 56, 419–453. [Google Scholar] [CrossRef]
- Kanashiro, P.; Rivera, J. Do Chief Sustainability Officers Make Companies Greener? The Moderating Role of Regulatory Pressures. J. Bus. Ethics 2019, 155, 687–701. [Google Scholar] [CrossRef]
- Lewis, B.W.; Walls, J.L.; Dowell, G.W.S. Difference in Degrees: CEO Characteristics and Firm Environmental Disclosure. Strateg. Manag. J. 2014, 35, 712–722. [Google Scholar] [CrossRef]
- Su, F.; Guan, M.; Liu, Y.; Liu, J. ESG Performance and Corporate Fraudulence: Evidence from China. Int. Rev. Financ. Anal. 2024, 93, 103180. [Google Scholar] [CrossRef]
- Darmadi, S. Do Women in Top Management Affect Firm Performance? Evidence from Indonesia. Corp. Gov. Int. J. Bus. Soc. 2013, 13, 288–304. [Google Scholar] [CrossRef]
- Hambrick, D.C.; Mason, P.A. Upper Echelons: The Organization as a Reflection of Its Top Managers. Acad. Manag. Rev. 1984, 9, 193–206. [Google Scholar] [CrossRef]
- Harjoto, M.A.; Laksmana, I.; Yang, Y. wen Board Nationality and Educational Background Diversity and Corporate Social Performance. Corp. Gov. Int. J. Bus. Soc. 2019, 19, 217–239. [Google Scholar] [CrossRef]
- Junior, R.M.; Best, P.J.; Cotter, J. Sustainability Reporting and Assurance: A Historical Analysis on a World-Wide Phenomenon. J. Bus. Ethics 2014, 120, 1–11. [Google Scholar] [CrossRef]
- He, P.; Shen, H.; Zhang, Y.; Ren, J. External Pressure, Corporate Governance, and Voluntary Carbon Disclosure: Evidence from China. Sustainability 2019, 11, 2901. [Google Scholar] [CrossRef]
- Liao, L.; Luo, L.; Tang, Q. Gender Diversity, Board Independence, Environmental Committee and Greenhouse Gas Disclosure. Br. Account. Rev. 2015, 47, 409–424. [Google Scholar] [CrossRef]
- Hofstede, G. Culture’s Consequences: Comparing Values, Behaviors, Institutions and Organizations across Nations, 2nd ed.; SAGE Publications: Thousand Oaks, CA, USA, 2001. [Google Scholar]
- Nadeem, M.; Gyapong, E.; Ahmed, A. Board Gender Diversity and Environmental, Social, and Economic Value Creation: Does Family Ownership Matter? Bus. Strategy Environ. 2020, 29, 1268–1284. [Google Scholar] [CrossRef]
- Orazalin, N.; Mahmood, M. Toward Sustainable Development: Board Characteristics, Country Governance Quality, and Environmental Performance. Bus. Strategy Environ. 2021, 30, 3569–3588. [Google Scholar] [CrossRef]
- Islam, R.; French, E.; Ali, M. Evaluating Board Diversity and Its Importance in the Environmental and Social Performance of Organizations. Corp. Soc. Responsib. Environ. Manag. 2022, 29, 1134–1145. [Google Scholar] [CrossRef]
- Alonso-Almeida, M.d.M.; Marimon, F.; Llach, J. Difusión de Las Memorias de Sostenibilidad En Latinoamérica: Análisis Territorial y Sectorial. Estud. Gerenciales 2015, 31, 139–149. [Google Scholar] [CrossRef]
- Bear, S.; Rahman, N.; Post, C. The Impact of Board Diversity and Gender Composition on Corporate Social Responsibility and Firm Reputation. J. Bus. Ethics 2010, 97, 207–221. [Google Scholar] [CrossRef]
- Harjoto, M.; Laksmana, I.; Lee, R. Board Diversity and Corporate Social Responsibility. J. Bus. Ethics 2015, 132, 641–660. [Google Scholar] [CrossRef]
- Landry, E.E.; Bernardi, R.A.; Bosco, S.M. Recognition for Sustained Corporate Social Responsibility: Female Directors Make a Difference. Corp. Soc. Responsib. Environ. Manag. 2016, 23, 27–36. [Google Scholar] [CrossRef]
- Li, J.; Zhao, F.; Chen, S.; Jiang, W.; Liu, T.; Shi, S. Gender Diversity on Boards and Firms’ Environmental Policy. Bus. Strategy Environ. 2017, 26, 306–315. [Google Scholar] [CrossRef]
- Lu, J.; Herremans, I.M. Board Gender Diversity and Environmental Performance: An Industries Perspective. Bus. Strategy Environ. 2019, 28, 1449–1464. [Google Scholar] [CrossRef]
- Post, C.; Rahman, N.; McQuillen, C. From Board Composition to Corporate Environmental Performance Through Sustainability-Themed Alliances. J. Bus. Ethics 2015, 130, 423–435. [Google Scholar] [CrossRef]
- Ferrero-Ferrero, I.; Fernández-Izquierdo, M.Á.; Muñoz-Torres, M.J. Integrating Sustainability into Corporate Governance: An Empirical Study on Board Diversity. Corp. Soc. Responsib. Environ. Manag. 2015, 22, 193–207. [Google Scholar] [CrossRef]
- Kassinis, G.; Panayiotou, A.; Dimou, A.; Katsifaraki, G. Gender and Environmental Sustainability: A Longitudinal Analysis. Corp. Soc. Responsib. Environ. Manag. 2016, 23, 399–412. [Google Scholar] [CrossRef]
- Hussain, N.; Rigoni, U.; Orij, R.P. Corporate Governance and Sustainability Performance: Analysis of Triple Bottom Line Performance. J. Bus. Ethics 2018, 149, 411–432. [Google Scholar] [CrossRef]
- Oussii, A.A.; Jeriji, M. Female Directors’ Representation and Firm Carbon Emissions Performance: Does Family Control Matter? J. Fam. Bus. Manag. 2024. ahead-of-print. [Google Scholar] [CrossRef]
- Zaid, M.; Wang, M.; Adib, M.; Sahyouni, A.T.F.; Abuhijleh, S. Boardroom Nationality and Gender Diversity: Implications for Corporate Sustainability Performance. J. Clean. Prod. 2020, 251, 119652. [Google Scholar] [CrossRef]
- Al-Qahtani, M.; Elgharbawy, A. The Effect of Board Diversity on Disclosure and Management of Greenhouse Gas Information: Evidence from the United Kingdom. J. Enterp. Inf. Manag. 2020, 33, 1557–1579. [Google Scholar] [CrossRef]
- Elsayih, J.; Tang, Q.; Lan, Y.-C. Corporate Governance and Carbon Transparency: Australian Experience. Account. Res. J. 2018, 31, 405–422. [Google Scholar] [CrossRef]
- EmadEldeen, R.; Elbayuomi, A.F.; Elmoursy, H.; Bouaddi, M.; Basuony, M.A.K. Does Board Diversity Drive Sustainability? Evidence from UK-Listed Companies. Sustainability 2025, 17, 1177. [Google Scholar] [CrossRef]
- Jensen, M. Value Maximisation, Stakeholder Theory, and the Corporate Objective Function. Eur. Financ. Manag. 2001, 7, 297–317. [Google Scholar] [CrossRef]
- Freeman, S.; O’Connor, E.; Parks, J.W.; Cunningham, M.; Hurley, D.; Haak, D.; Dirks, C.; Wenderoth, M.P. Prescribed Active Learning Increases Performance in Introductory Biology. CBE—Life Sci. Educ. 2007, 6, 132–139. [Google Scholar] [CrossRef]
- Hollindale, J.; Kent, P.; Routledge, J.; Chapple, L. Women on Boards and Greenhouse Gas Emission Disclosures. Account. Financ. 2019, 59, 277–308. [Google Scholar] [CrossRef]
- Rjiba, H.; Thavaharan, T. Female Representation on Boards and Carbon Emissions: International Evidence. Financ. Res. Lett. 2022, 49, 103079. [Google Scholar] [CrossRef]
- Fan, P.; Qian, X.; Wang, J. Does Gender Diversity Matter? Female Directors and Firm Carbon Emissions in Japan. Pac.-Basin Financ. J. 2023, 77, 101931. [Google Scholar] [CrossRef]
- Irwhantoko, I.; Basuki, B. Carbon Emission Disclosure: Studi Pada Perusahaan Manufaktur Indonesia. J. Akunt. Dan. Keuang. 2016, 18, 92–104. [Google Scholar] [CrossRef]
- Damanik, G.S.M.; Dewayanto, T. Analisis Pengaruh Diversitas Dewan Komisaris Terhadap Corporate Social Responsibility Disclosure. Diponegoro J. Account. 2021, 10, 1–14. [Google Scholar]
- Ummah, Y.R.; Setiawan, D. Do Board of Commissioners Characteristic and International Environmental Certification Affect Carbon Disclosure? Evidence from Indonesia. J. Din. Akunt. Dan. Bisnis 2021, 8, 215–228. [Google Scholar] [CrossRef]
- Nurmadi Harsa Sumarta; Muhammad Agung Prabowo; Prihatnolo Gandhi Amidjaya; Edy Supriyono. Agista Putri Prameswari CEO Characteristics and Environmental Performance: Evidence from Indonesian Banks. Int. J. Bus. Soc. 2021, 22, 1015–1033. [Google Scholar] [CrossRef]
- Muttakin, M.B.; Khan, A.; Subramaniam, N. Firm Characteristics, Board Diversity and Corporate Social Responsibility. Pac. Account. Rev. 2015, 27, 353–372. [Google Scholar] [CrossRef]
- Kılıç, M.; Kuzey, C. Determinants of Forward-Looking Disclosures in Integrated Reporting. Manag. Audit. J. 2018, 33, 115–144. [Google Scholar] [CrossRef]
- Depoers, F.; Jeanjean, T.; Jérôme, T. Voluntary Disclosure of Greenhouse Gas Emissions: Contrasting the Carbon Disclosure Project and Corporate Reports. J. Bus. Ethics 2016, 134, 445–461. [Google Scholar] [CrossRef]
- Mardini, G.H.; Elleuch Lahyani, F. Impact of Foreign Directors on Carbon Emissions Performance and Disclosure: Empirical Evidence from France. Sustain. Account. Manag. Policy J. 2022, 13, 221–246. [Google Scholar] [CrossRef]
- Turker, D. What Are the Drivers of Social Responsibility? In Managing Social Responsibility; Springer: Cham, Switzerland, 2018; pp. 17–39. [Google Scholar]
- Odum, C.G. Corporate Board Diversity Effect on Environmental Sustainability Disclosure Evidence from Nigeria. Asian J. Econ. Bus. Account. 2023, 23, 146–156. [Google Scholar] [CrossRef]
- Ramasamy, B.; Ling, N.H.; Ting, H.W. Corporate Social Performance and Ethnicity. Int. J. Cross Cult. Manag. 2007, 7, 29–45. [Google Scholar] [CrossRef]
- Lee, K.; Lee, C. Are Multiple Directorships Beneficial in East Asia? Account. Financ. 2014, 54, 999–1032. [Google Scholar] [CrossRef]
- Bravo, F.; Reguera-Alvarado, N. The Effect of Board of Directors on R&D Intensity: Board Tenure and Multiple Directorships. RD Manag. 2017, 47, 701–714. [Google Scholar] [CrossRef]
- Ferris, S.P.; Jayaraman, N.; Liao, M.-Y. (Stella) Better Directors or Distracted Directors? An International Analysis of Busy Boards. Glob. Financ. J. 2020, 44, 100437. [Google Scholar] [CrossRef]
- Hillman, A.J.; Withers, M.C.; Collins, B.J. Resource Dependence Theory: A Review. J. Manag. 2009, 35, 1404–1427. [Google Scholar] [CrossRef]
- Jensen, M.C.; Meckling, W.H. Theory of the Firm: Managerial Behavior, Agency Costs and Ownership Structure. J. Financ. Econ. 1976, 3, 305–360. [Google Scholar] [CrossRef]
- Ong, T.; Djajadikerta, H.G. Corporate Governance and Sustainability Reporting in the Australian Resources Industry: An Empirical Analysis. Soc. Responsib. J. 2018, 16, 1–14. [Google Scholar] [CrossRef]
- Reguera-Alvarado, N.; Bravo-Urquiza, F. The Influence of Board Social Capital on Corporate Social Responsibility Reporting. J. Intellect. Cap. 2022, 23, 913–935. [Google Scholar] [CrossRef]
- Sun, W.; Li, X.; Geng, Y.; Yang, J.; Zhang, Y. Board Interlocks and the Diffusion of CSR Reporting Practices: The Role of Market Development. Corp. Soc. Responsib. Environ. Manag. 2020, 27, 1333–1343. [Google Scholar] [CrossRef]
- Liang, X.; Dai, L.; Xie, S. Examining the Social Pressures on Voluntary CSR Reporting: The Roles of Interlocking Directors. Sustain. Account. Manag. Policy J. 2022, 13, 653–679. [Google Scholar] [CrossRef]
- Ahn, S.; Jiraporn, P.; Kim, Y.S. Multiple Directorships and Acquirer Returns. J. Bank. Financ. 2010, 34, 2011–2026. [Google Scholar] [CrossRef]
- G20/OECD Principles of Corporate Governance; OECD: Paris, France, 2016; ISBN 9789264257436.
- Matuszak, Ł.; Różańska, E. Online Corporate Social Responsibility (CSR) Disclosure in the Banking Industry: Evidence from Poland. Soc. Responsib. J. 2019, 16, 1191–1214. [Google Scholar] [CrossRef]
- Walls, J.L.; Hoffman, A.J. Exceptional Boards: Environmental Experience and Positive Deviance from Institutional Norms. J. Organ. Behav. 2013, 34, 253–271. [Google Scholar] [CrossRef]
- Lu, J.; Yu, D.; Mahmoudian, F.; Nazari, J.A.; Herremans, I.M. Board Interlocks and Greenhouse Gas Emissions. Bus. Strategy Environ. 2021, 30, 92–108. [Google Scholar] [CrossRef]
- Ding, H.; Hu, Y.; Yang, X.; Zhou, X. Board Interlock and the Diffusion of Corporate Social Responsibility among Chinese Listed Firms. Asia Pac. J. Manag. 2022, 39, 1287–1320. [Google Scholar] [CrossRef]
- Ortiz-de-Mandojana, N.; Aragon-Correa, J.A. Boards and Sustainability: The Contingent Influence of Director Interlocks on Corporate Environmental Performance. Bus. Strategy Environ. 2015, 24, 499–517. [Google Scholar] [CrossRef]
- Al-Dah, B. Director Interlocks and the Strategic Pacing of CSR Activities. Manag. Decis. 2019, 57, 2782–2798. [Google Scholar] [CrossRef]
- Gull, A.A.; Hussain, N.; Khan, S.A.; Khan, Z.; Saeed, A. Governing Corporate Social Responsibility Decoupling: The Effect of the Governance Committee on Corporate Social Responsibility Decoupling. J. Bus. Ethics 2023, 185, 349–374. [Google Scholar] [CrossRef]
- Emma, G.-M.; Jennifer, M.-F. Is SDG Reporting Substantial or Symbolic? An Examination of Controversial and Environmentally Sensitive Industries. J. Clean. Prod. 2021, 298, 126781. [Google Scholar] [CrossRef]
- Ruiz-Blanco, S.; Romero, S.; Fernandez-Feijoo, B. Green, Blue or Black, but Washing–What Company Characteristics Determine Greenwashing? Environ. Dev. Sustain. 2022, 24, 4024–4045. [Google Scholar] [CrossRef]
- Bouaddi, M.; Basuony, M.A.K.; Noureldin, N. The Heterogenous Effects of Carbon Emissions and Board Gender Diversity on a Firm’s Performance. Sustainability 2023, 15, 14642. [Google Scholar] [CrossRef]
- Clarkson, P.M.; Li, Y.; Pinnuck, M.; Richardson, G.D. The Valuation Relevance of Greenhouse Gas Emissions under the European Union Carbon Emissions Trading Scheme. Eur. Account. Rev. 2015, 24, 551–580. [Google Scholar] [CrossRef]
- Delmas, M.A.; Nairn-Birch, N.; Lim, J. Dynamics of Environmental and Financial Performance: The Case of Greenhouse Gas Emissions. Organ. Environ. 2015, 28, 374–393. [Google Scholar] [CrossRef]
- Choi, B.; Luo, L. Does the Market Value Greenhouse Gas Emissions? Evidence from Multi-Country Firm Data. Br. Account. Rev. 2021, 53, 100909. [Google Scholar] [CrossRef]
- Liu, Y.S.; Zhou, X.; Yang, J.H.; Hoepner, A.G.F.; Kakabadse, N. Carbon Emissions, Carbon Disclosure and Organizational Performance. Int. Rev. Financ. Anal. 2023, 90, 102846. [Google Scholar] [CrossRef]
- Chu, H.-L.; Liu, N.-Y.; Chiu, S.-C. CEO Power and CSR: The Moderating Role of CEO Characteristics. China Account. Financ. Rev. 2023, 25, 101–121. [Google Scholar] [CrossRef]
- Houqe, M.N.; Opare, S.; Zahir-Ul-Hassan, M.K. Carbon Emissions, Female CEOs and Earnings Management. Int. J. Account. Inf. Manag. 2024, 32, 593–621. [Google Scholar] [CrossRef]
- Ezhilarasi, G.; Kabra, K.C. The Impact of Corporate Governance Attributes on Environmental Disclosures: Evidence from India. Indian. J. Corp. Gov. 2017, 10, 24–43. [Google Scholar] [CrossRef]
- Booth, J.R.; Deli, D.N. Factors Affecting the Number of Outside Directorships Held by CEOs. J. Financ. Econ. 1996, 40, 81–104. [Google Scholar] [CrossRef]
- Saleh, M.W.A.; Shurafa, R.; Shukeri, S.N.; Nour, A.I.; Maigosh, Z.S. The Effect of Board Multiple Directorships and CEO Characteristics on Firm Performance: Evidence from Palestine. J. Account. Emerg. Econ. 2020, 10, 637–654. [Google Scholar] [CrossRef]
- Abang’a, A.O.; Simbi, C. Board Interlocks and Carbon Emissions Performance: Empirical Evidence from India. In Green House Gas Emissions Reporting and Management in Global Top Emitting Countries and Companies (Advances in Environmental Accounting & Management, Vol. 11); Emerald Publishing Limited: Leeds, UK, 2023; pp. 81–106. [Google Scholar] [CrossRef]
- Moussa, T.; Allam, A.; Elbanna, S.; Bani-Mustafa, A. Can Board Environmental Orientation Improve U.S. Firms’ Carbon Performance? The Mediating Role of Carbon Strategy. Bus. Strategy Environ. 2020, 29, 72–86. [Google Scholar] [CrossRef]
- Nguyen, D.V.; Nguyen, N.H.K.; Dinh, T.T. CEO Attributes and Firm Performance: Evidence from Companies Listed on Ho Chi Minh Stock Exchange. Cogent Econ. Financ. 2023, 11, 2282838. [Google Scholar] [CrossRef]
- Zang, A.Y. Evidence on the Trade-off between Real Activities Manipulation and Accrual-Based Earnings Management. Account. Rev. 2012, 87, 675–703. [Google Scholar] [CrossRef]
- Malik, F.; Wang, F.; Naseem, M.A.; Ikram, A.; Ali, S. Determinants of Corporate Social Responsibility Related to CEO Attributes: An Empirical Study. Sage Open 2020, 10, 1–12. [Google Scholar] [CrossRef]
- Cordeiro, J.J.; Profumo, G.; Tutore, I. Board Gender Diversity and Corporate Environmental Performance: The Moderating Role of Family and Dual-class Majority Ownership Structures. Bus. Strategy Environ. 2020, 29, 1127–1144. [Google Scholar] [CrossRef]
- Jackson, G.; Apostolakou, A. Corporate Social Responsibility in Western Europe: An Institutional Mirror or Substitute? J. Bus. Ethics 2010, 94, 371–394. [Google Scholar] [CrossRef]
- Wang, L.; Li, S.; Gao, S. Do Greenhouse Gas Emissions Affect Financial Performance?—An Empirical Examination of Australian Public Firms. Bus. Strategy Environ. 2014, 23, 505–519. [Google Scholar] [CrossRef]
- Tingbani, I.; Chithambo, L.; Tauringana, V.; Papanikolaou, N. Board Gender Diversity, Environmental Committee and Greenhouse Gas Voluntary Disclosures. Bus. Strategy Environ. 2020, 29, 2194–2210. [Google Scholar] [CrossRef]
- Koenker, R.; Bassett, G. Regression Quantiles. Econometrica 1978, 46, 33. [Google Scholar] [CrossRef]
- Buchinsky, M. Recent Advances in Quantile Regression Models: A Practical Guideline for Empirical Research. J. Hum. Resour. 1998, 33, 88. [Google Scholar] [CrossRef]
- Koenker, R.; Hallock, K.F. Quantile Regression. J. Econ. Perspect. 2001, 15, 143–156. [Google Scholar] [CrossRef]
- Koenker, R. Quantile Regression; Cambridge University Press: Cambridge, UK, 2005; ISBN 9780511754098. [Google Scholar]
- Walls, J.L.; Berrone, P.; Phan, P.H. Corporate Governance and Environmental Performance: Is There Really a Link? Strateg. Manag. J. 2012, 33, 885–913. [Google Scholar] [CrossRef]
- Glass, C.; Cook, A.; Ingersoll, A.R. Do Women Leaders Promote Sustainability? Analyzing the Effect of Corporate Governance Composition on Environmental Performance. Bus. Strategy Environ. 2016, 25, 495–511. [Google Scholar] [CrossRef]
- Cook, A.; Glass, C. Women and Top Leadership Positions: Towards an Institutional Analysis. Gend. Work. Organ. 2014, 21, 91–103. [Google Scholar] [CrossRef]
- Traversi, M.; Bannò, M.; Coller, G.; Filippi, E. Gender Diversity, Institutional Context, and Environmental Innovation: A European Patent Analysis. Acad. Manag. Proc. 2022, 2022, 17198. [Google Scholar] [CrossRef]
- House, R.J.; Hanges, P.J.; Javidan, M.; Dorfman, P.W.; Gupta, V. Culture, Leadership and Organizations: The GLOBE Study of 62 Societies; Sage Publications: California, CA, USA, 2004; ISBN 0761924019/9780761924012. [Google Scholar]
- Bae Choi, B.; Lee, D.; Psaros, J. An Analysis of Australian Company Carbon Emission Disclosures. Pac. Account. Rev. 2013, 25, 58–79. [Google Scholar] [CrossRef]
- Efendy, D.G.; Ulum, I.; Widyastuti, A. The Effect of Company Profitability, Leverage, and Size on Carbon Emission Disclosure with Environmental Performance as a Moderating Variable (Empirical Study on Manufacturing Companies Listed on the Stock Exchange in 2020). In Environmental Issues and Social Inclusion in a Sustainable Era; Routledge: London, UK, 2023. [Google Scholar]
- Saptiwi, N.W.T. Pengungkapan Emisi Karbon: Menguji Peranan Tipe Industri, Kinerja Lingkungan, Karakteristik Perusahaan Dan Komite Audit. J. Akunt. Bisnis 2019, 17, 227. [Google Scholar] [CrossRef]
- Anggraini, S.P. Handayani Susi Pengaruh Tekanan Stakeholders, Sertifikasi Iso 14001, Profitabilitas Dan Leverage Terhadap Pengungkapan Emisi Karbon. J. Ilmu Komput. Ekon. Dan Manaj. (JIKEM) 2021, 1, 153–168. [Google Scholar]
- Oware, K.M.; Awunyo-Vitor, D. CEO Characteristics and Environmental Disclosure of Listed Firms in an Emerging Economy: Does Sustainability Reporting Format Matter? Bus. Strategy Dev. 2021, 4, 399–410. [Google Scholar] [CrossRef]
| Disclaimer/Publisher’s Note: The statements, opinions and data contained in all publications are solely those of the individual author(s) and contributor(s) and not of MDPI and/or the editor(s). MDPI and/or the editor(s) disclaim responsibility for any injury to people or property resulting from any ideas, methods, instructions or products referred to in the content. |
© 2025 by the authors. Licensee MDPI, Basel, Switzerland. This article is an open access article distributed under the terms and conditions of the Creative Commons Attribution (CC BY) license (https://creativecommons.org/licenses/by/4.0/).


 ,
, 
