
Low-Carbon Restructuring, R&D Investment, and Supply Chain Resilience: A U-Shaped Relationship


Abstract
:1. Introduction
2. Literature Review and Research Hypothesis
2.1. Low-Carbon Restructuring and Supply Chain Resilience
2.2. Relationship Between R&D Investment and Supply Chain Resilience
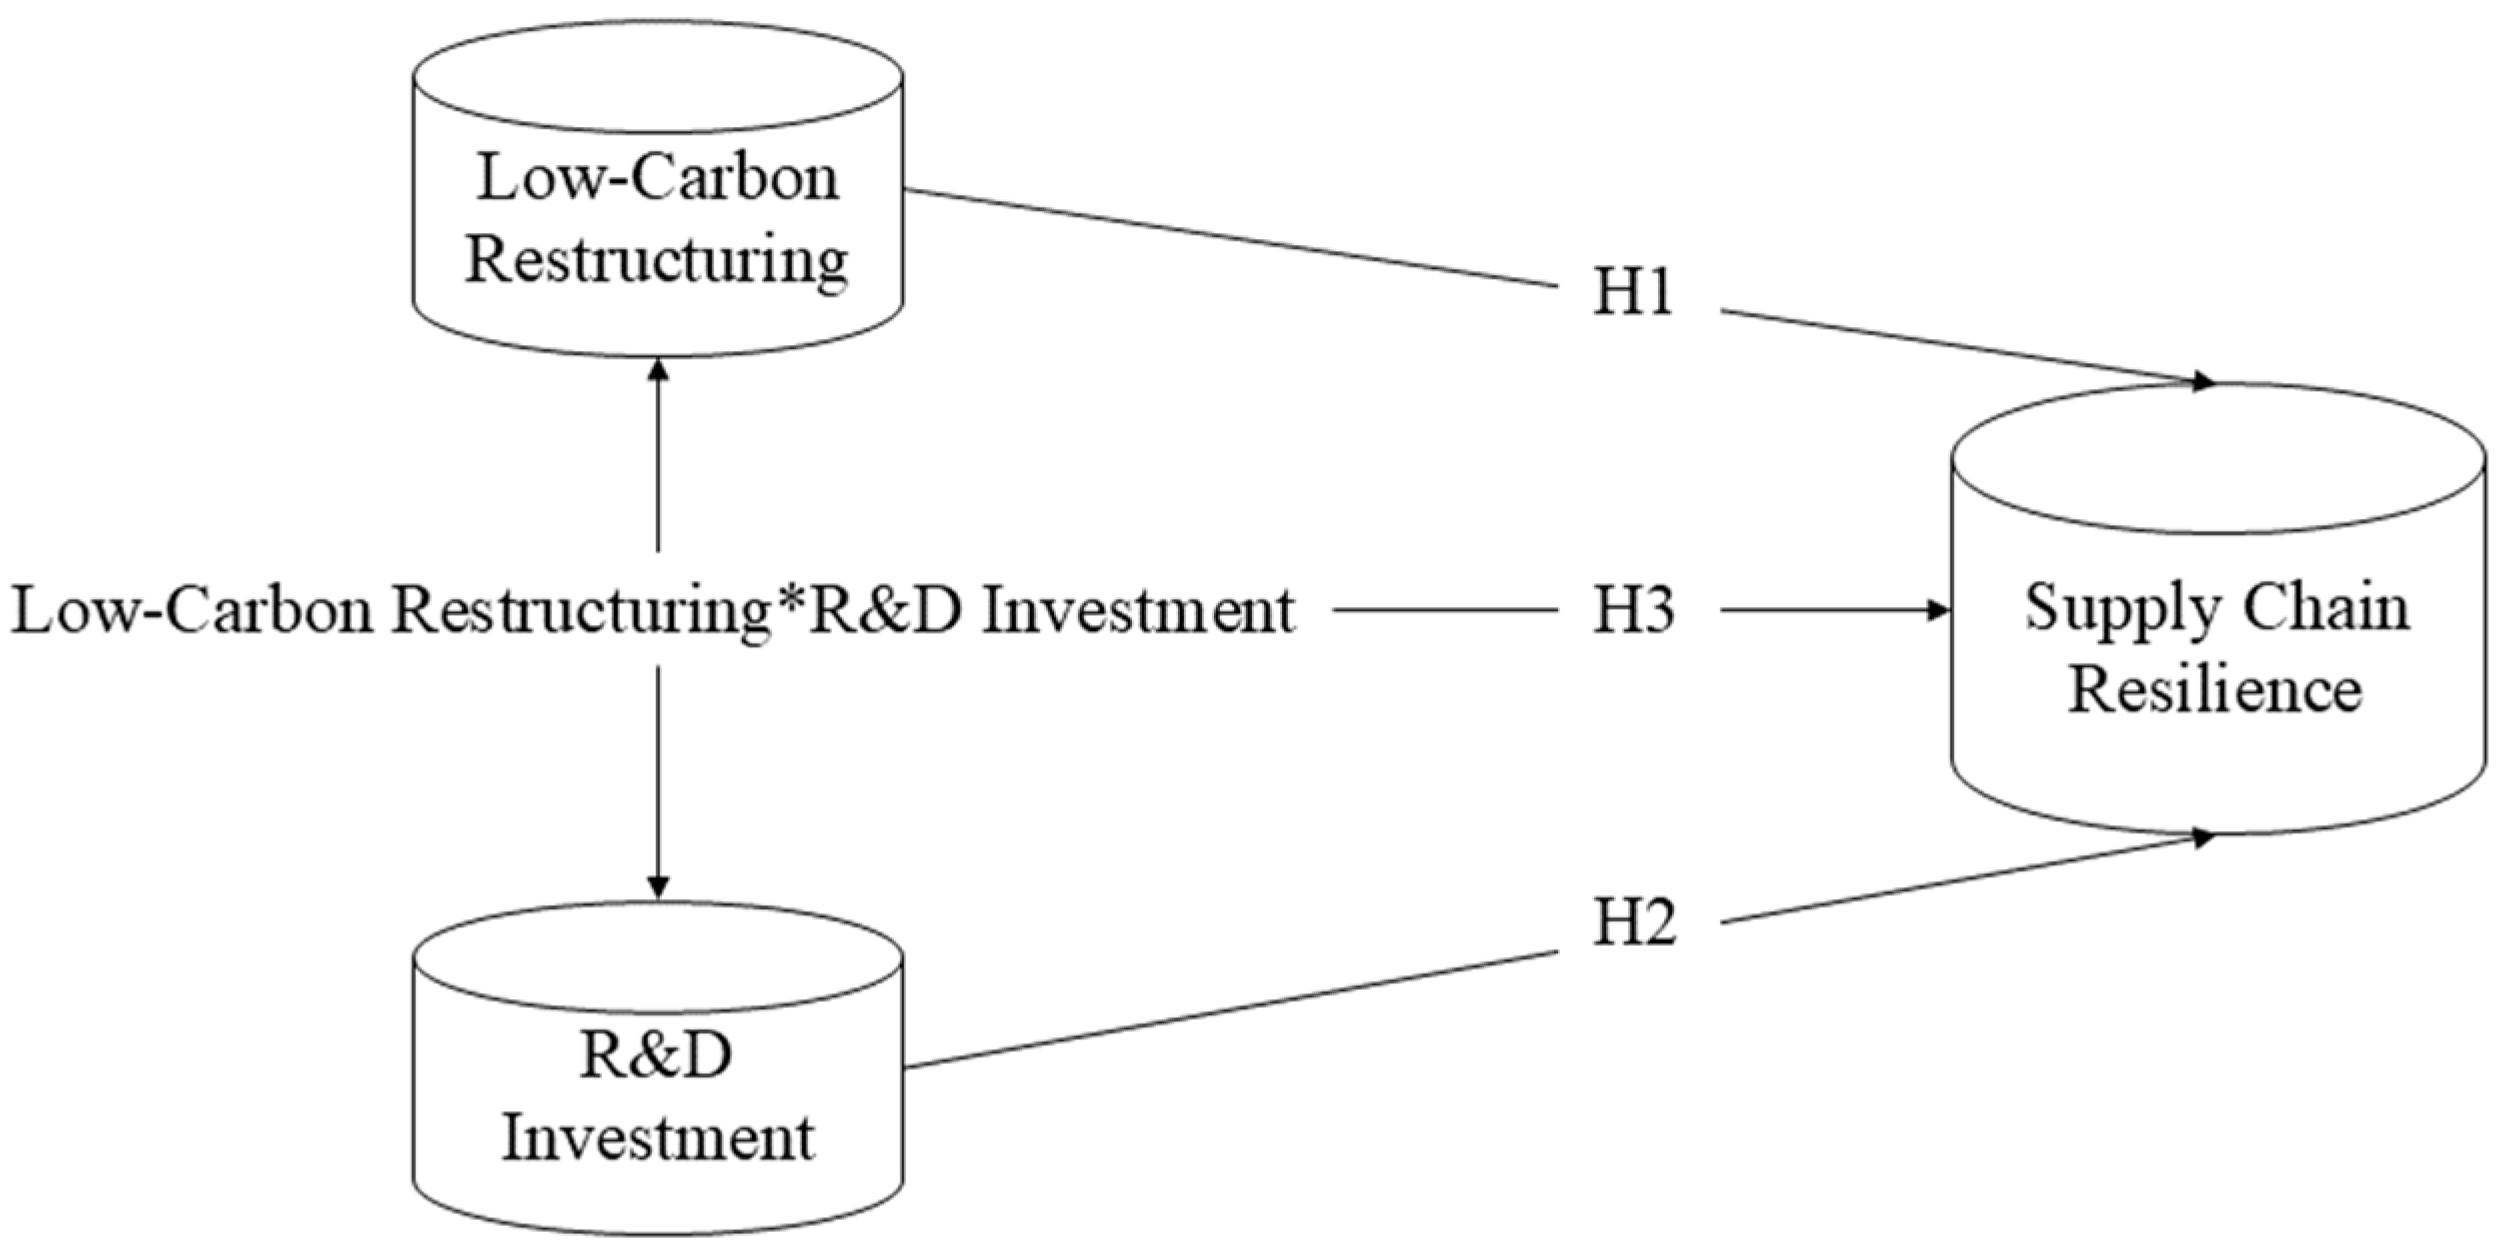
2.3. The Moderating Role of R&D Investment in the Relationship Between LCR and Supply Chain Resilience
3. Methodology
3.1. Sample Selection and Data Sources
3.2. Variable Definitions
3.2.1. Dependent Variable
3.2.2. Independent Variable
3.2.3. Controlled Variables
3.3. Model Construction
4. Empirical Results and Analysis
4.1. Descriptive Statistic and Correlation Analysis
4.2. Benchmark Regression
4.2.1. Analysis of Model Regression Results of the Relationship Between Low-Carbon Restructuring and SCR
4.2.2. Analysis of Model Regression Results of the Relationship Between R&D and Supply Chain Resilience
4.2.3. Regression Analysis of the Moderating Effect of R&D Investment on the Relationship Between Low-Carbon Restructuring and Supply Chain Resilience
4.3. U-Turn Analysis
4.4. Further Analysis
4.5. Projections of the Extent of Low-Carbon Reconfiguration
4.6. Robustness Tests
5. Discussion
5.1. Research Finding
5.2. Theoretical Significance
5.3. Practical Inspiration
- (1)
- Manufacturing enterprises should strategically coordinate LCR with technological innovation to achieve synergistic benefits between resource optimization and resilience enhancement. Specifically, for enterprises with limited low-carbon technological capabilities but strong innovation potential, priority should be given to advancing R&D efforts toward low-carbon technological breakthroughs. This approach can mitigate resource constraints during the initial transition phase through rapid technological upgrading. For firms with mature low-carbon technologies but weaker innovation systems, the focus should shift toward optimizing resource allocation and deeply embedding these technologies within existing production processes. This integration pathway accelerates the realization of resilience benefits.
- (2)
- Manufacturing enterprises should take advantage of the trend of digital transformation to realize the efficient integration of the low-carbon technology chain and supply chain. With the gradual enhancement of the enabling effect of digital technology on low-carbon transformation, enterprises should break the traditional resource allocation mode, realize the efficient collection and accurate allocation of resource data, and avoid the waste of resources and cost redundancy in LCR. By building a synergistic mechanism between the low-carbon technology chain and the supply chain, enterprises can identify and resolve the key bottlenecks in resilience enhancement, further enhancing the sustainability of low-carbon transformation.
- (3)
- Manufacturing enterprises should classify and manage the demand for low-carbon transformation, and develop differentiated resilience enhancement strategies. The core objective of LCR is to achieve long-term steady improvement of the enterprise resilience level through technological synergy and resource allocation optimization. To this end, enterprises should, according to their own resource endowment and low-carbon technology base, clarify the key links and priorities in the transformation process, and form a virtuous cycle of efficient resource allocation and continuous enhancement of resilience, oriented by dynamic capabilities.
6. Conclusions
6.1. Main Conclusions
- (1)
- LCR and SCR have a U-shaped relationship, with significant industry heterogeneity. The effect of LCR on SCR shows a nonlinear U-shaped relationship of inhibition followed by promotion, with an inflection point value of about 2.34. Initially, supply chain efficiency declines due to technological transformation and resource reorganization, but as low-carbon technology matures, synergistic effects gradually emerge, and long-term resilience is significantly improved. The U-shaped inflection point for heavily polluting industries (2.28) is earlier than that for non-heavily polluting industries (2.60), indicating that high environmental regulatory pressures force them to overcome the transition pains faster, but also to face more severe technological and resource challenges.
- (2)
- R&D directly enhances SCR. R&D improves flexibility and risk resistance through low-carbon technology breakthroughs and supply chain digitization. R&D optimizes the efficiency of resource integration and strengthens the synergy between supply chain nodes.
- (3)
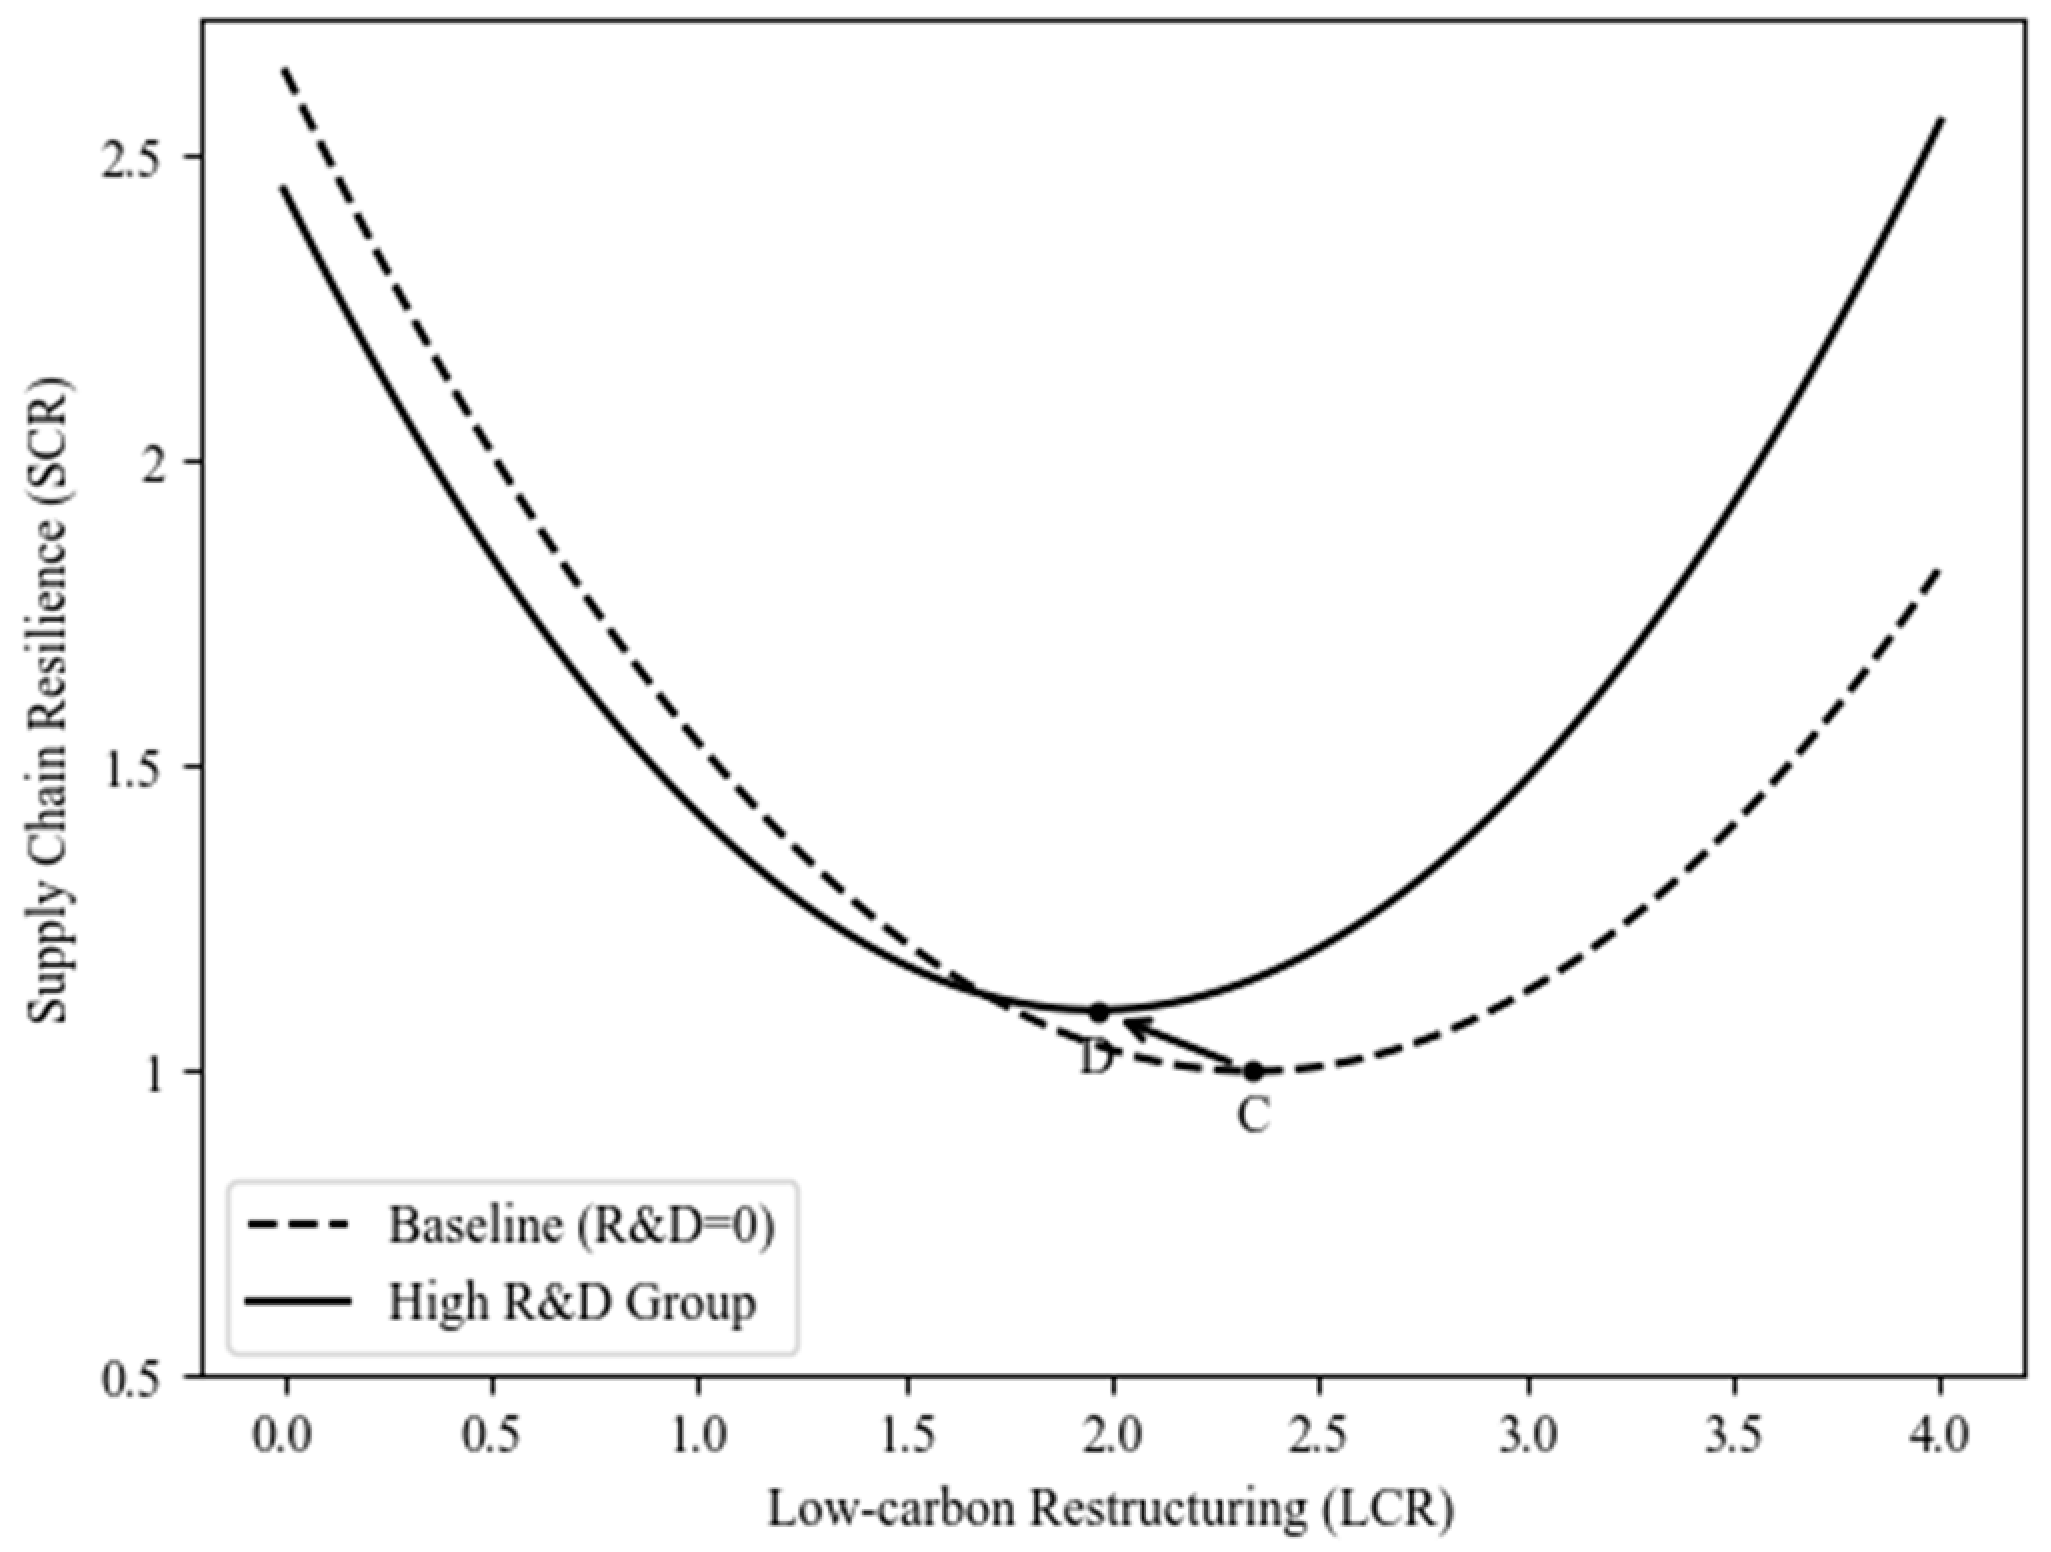
- R&D significantly moderates the U-shaped relationship between LCR and SCR through technological innovation and resource allocation optimization: it not only mitigates the negative impacts in the early stage of transformation, but also strengthens the positive effects in the later stage, and shifts the inflection point to the left, accelerating the resilience improvement.
6.2. Limitations and Future Research
- (1)
- This paper does not explore the segmentation of R&D. R&D inputs during LCR may encompass multiple dimensions, such as technology R&D, equipment upgrades, and low-carbon product development. Future research could investigate the varying impacts of different R&D types on the “LCR–SCR” relationship, providing more precise guidance for firms to formulate fine-grained innovation strategies.
- (2)
- The sample primarily focuses on listed companies in the Chinese manufacturing sector. Due to differences in resource endowments, technological capabilities, and transformation goals between listed and unlisted firms, the generalizability of the findings may be limited. Future studies could expand the sample to include unlisted manufacturing firms, enhancing the broader applicability and relevance of the results.
- (3)
- The deterministic demand assumption adopted in this study, while simplifying the modeling process, cannot fully reflect the stochastic fluctuation characteristics of demand in the real market, thus bringing limitations. In the future, we can combine the institutional theory to quantify the impact of SCR demand fluctuations through stochastic process modeling, explore the heterogeneous impact of LCR on SCR under different policy environments, or use complex system simulation to simulate the dynamics of the supply chain disruption scenarios under the adaptive mechanism to improve the LCR prediction framework under uncertainty.
Supplementary Materials
Author Contributions
Funding
Data Availability Statement
Acknowledgments
Conflicts of Interest
References
- Ma, F.; Wang, H.; Tzachor, A.; Hidalgo, C.A.; Schandl, H.; Zhang, Y.; Zhang, J.; Chen, W.-Q.; Zhao, Y.; Zhu, Y.-G.; et al. The disparities and development trajectories of nations in achieving the sustainable development goals. Nat. Commun. 2025, 16, 1107. [Google Scholar] [CrossRef]
- Joachim, C.; Maes, S.; Sander, J.; Jacobs, L. Nature-based solutions for Europe’s sustainable development. Conserv. Lett. 2017, 12, 121–124. [Google Scholar] [CrossRef]
- Fang, K.; Tang, Y.; Zhang, Q.; Song, J.; Xu, A. Will China peak its energy-related carbon emissions by 2030? Lessons from 30 Chinese provinces. Appl. Energy 2019, 255, 113852. [Google Scholar] [CrossRef]
- Wang, N.; Chang, Y.C. The evolution of low-carbon development strategies in China. Energy 2014, 68, 61–70. [Google Scholar] [CrossRef]
- Jiang, H.; He, B.; Mubarik, M.S.; Shi, S. Role of supply chain digitalization and global supply chain in decarbonization of natural resources sector supply chain. J. Environ. Manag. 2024, 370, 122689. [Google Scholar] [CrossRef] [PubMed]
- Zhang, Z. China in the transition to a low-carbon economy. Energy Policy 2010, 38, 6638–6653. [Google Scholar] [CrossRef]
- Christopher, M.; Peck, H. Building the resilient supply chain. Int. J. Logist. Manag. 2004, 15, 1–13. [Google Scholar] [CrossRef]
- Gu, M.; Yang, L.; Huo, B. Patterns of information technology use: Their impact on supply chain resilience and performance. Int. J. Prod. Econ. 2020, 232, 107956. [Google Scholar] [CrossRef]
- Shi, H.; Chai, J.; Lu, Q.; Zheng, J.; Wang, S. The impact of China’s low-carbon transition on economy, society and energy in 2030 based on CO2 emissions drivers. Energy 2022, 239, 122336. [Google Scholar] [CrossRef]
- Gao, Z.; Zhou, P.; Wen, W. What drives urban low-carbon transition? Findings from China. Environ. Impact Assess. Rev. 2025, 110, 107679. [Google Scholar] [CrossRef]
- Gebhardt, M.; Spieske, A.; Kopyto, M.; Birkel, H. Increasing global supply chains’ resilience after the COVID-19 pandemic: Empirical results from a Delphi study. J. Bus. Res. 2022, 150, 59–72. [Google Scholar] [CrossRef]
- Hosseini, S.; Ivanov, D. A new resilience measure for supply networks with the ripple effect considerations: A Bayesian network approach. Ann. Oper. Res. 2019, 319, 581–607. [Google Scholar] [CrossRef]
- Abdi, F.; Farughi, H.; Sadeghi, H.; Arkat, J. Using common redundancy components for suppliers in a supply chain network design problem considering energy costs and environmental effects. Expert Syst. Appl. 2024, 245, 122989. [Google Scholar] [CrossRef]
- Jüttner, U.; Maklan, S. Supply chain resilience in the global financial crisis: An empirical study. Supply Chain. Manag. Int. J. 2011, 16, 246–259. [Google Scholar] [CrossRef]
- Yin, W.; Ran, W. Supply chain diversification, digital transformation, and supply chain resilience: Configuration analysis based on FSQCA. Sustainability 2022, 14, 7690. [Google Scholar] [CrossRef]
- Fritsch, M. The theory of economic development–An inquiry into profits, capital, credit, interest, and the business cycle. Reg. Stud. 2017, 51, 654–655. [Google Scholar] [CrossRef]
- Pata, S.K.; Pata, U.K.; Wang, Q. Ecological power of energy storage, clean fuel innovation, and energy-related research and development technologies. Renew. Energy 2025, 241, 122377. [Google Scholar] [CrossRef]
- Alvarenga, M.; Oliveira, M.P.V.D.; de Oliveira, T.A.G.F. The impact of using digital technologies on supply chain resilience and robustness: The role of memory under the COVID-19 outbreak. Supply Chain. Manag. Int. J. 2023, 28, 825–842. [Google Scholar] [CrossRef]
- Hejazi, M.T.; Habani, M.A.; Wright, L.T.; Nisar, T. Impact of green supply chain integration management on business performance: A mediating role of supply chain resilience and innovation the case of Saudi Arabian manufacturing sector. Cogent Bus. Manag. 2024, 11, 2392256. [Google Scholar] [CrossRef]
- Benjaafar, S.; Li, Y.; Daskin, M. Carbon footprint and the management of supply chains: Insights from simple models. IEEE Trans. Autom. Sci. Eng. 2013, 10, 99–116. [Google Scholar] [CrossRef]
- Chen, J. Research on low-carbon supply chain management. J. Syst. Manag. 2012, 21, 9. [Google Scholar] [CrossRef]
- Zhao, J.; Feng, C.; Sun, W. The impact of low-carbon transformation on firm performance: Evidence from China. Energy Econ. 2021, 93, 104997. [Google Scholar] [CrossRef]
- Sun, J.; Zhai, N.; Miao, J.; Sun, H. Can green finance effectively promote the carbon emission reduction in “local-neighborhood” areas?—Empirical evidence from China. Agriculture 2022, 12, 1550. [Google Scholar] [CrossRef]
- He, Y. Response mechanism and evolution trend of carbon effect in the farmland ecosystem of the middle and lower reaches of the Yangtze River. Agronomy 2024, 14, 2354. [Google Scholar] [CrossRef]
- Nazir, M.J.; Li, G.; Nazir, M.M.; Zulfiqar, F.; Siddique, K.H.M.; Iqbal, B.; Du, D. Harnessing soil carbon sequestration to address climate change challenges in agriculture. Soil Tillage Res. 2024, 237, 105959. [Google Scholar] [CrossRef]
- Tao, F.; Wang, X.; Xu, Y.; Zhu, P. Digital transformation, resilience of industrial chain and supply chain, and enterprise productivity. China Ind. Econ. 2023, 5, 118–136. [Google Scholar] [CrossRef]
- Tukamuhabwa, B.R.; Stevenson, M.; Busby, J.; Zorzini, M. Supply chain resilience: Definition, review and theoretical foundations for further study. Int. J. Prod. Res. 2015, 53, 5592–5623. [Google Scholar] [CrossRef]
- Chowdhury, M.M.H.; Quaddus, M. Supply chain resilience: Conceptualization and scale development using dynamic capability theory. Int. J. Prod. Econ. 2017, 188, 185–204. [Google Scholar] [CrossRef]
- Zouari, D.; Ruel, S.; Viale, L. Does digitalising the supply chain contribute to its resilience? Int. J. Phys. Distrib. Logist. Manag. 2020, 51, 149–180. [Google Scholar] [CrossRef]
- Behzadi, G.; O’Sullivan, M.J.; Olsen, T.L. On metrics for supply chain resilience. Eur. J. Oper. Res. 2020, 287, 145–158. [Google Scholar] [CrossRef]
- Rajesh, R. Forecasting supply chain performance resilience using grey prediction. Electron. Commer. Res. Appl. 2016, 20, 42–58. [Google Scholar] [CrossRef]
- Christopher, M.; Lee, H. Mitigating supply chain risk through improved confidence. Int. J. Phys. Distrib. Logist. Manag. 2004, 34, 388–396. [Google Scholar] [CrossRef]
- Ma, X.; Huang, M.; Yang, M. Research on the influencing factors of supply chain resilience: Based on SEM and fsQCA. Syst. Eng.-Theory Pract. 2023, 43, 2484–2501. [Google Scholar] [CrossRef]
- Birkel, H.; Hohenstein, N.O.; Hahner, S. How have digital technologies facilitated supply chain resilience in the COVID-19 pandemic? An exploratory case study. Comput. Ind. Eng. 2023, 183, 109538. [Google Scholar] [CrossRef]
- Rezapour, S.; Farahani, R.Z.; Pourakbar, M. Resilient supply chain network design under competition: A case study. Eur. J. Oper. Res. 2017, 259, 1017–1035. [Google Scholar] [CrossRef]
- Neely, A.; Benedettini, O.; Visnjic, I. Exploring the financial consequences of servitization of manufacturing. Oper. Manag. Res. 2008, 1, 103–118. [Google Scholar] [CrossRef]
- Fainshmidt, S.; Pezeshkan, A.; Lance Frazier, M.; Nair, A.; Markowski, E. Dynamic Capabilities and Organizational Performance: A Meta-Analytic Evaluation and Extension. J. Manag. Stud. 2016, 53, 1348–1380. [Google Scholar] [CrossRef]
- Harju, A.; Hallikas, J.; Immonen, M.; Lintukangas, K. The impact of procurement digitalization on supply chain resilience: Empirical evidence from Finland. Supply Chain Manag. Int. J. 2023, 28, 62–76. [Google Scholar] [CrossRef]
- Guo, X.L.; Li, K. Supply chain concentration, market status and R&D investment—Research from horizontal and vertical perspectives. Ind. Econ. Rev. 2019, 10, 15. [Google Scholar] [CrossRef]
- Huang, Q.Y.; Song, Y.F. An empirical study on the impact of supply chain concentration on enterprises’ R&D investment intensity—Moderation role of ownership. RD Manag. 2019, 31, 13–26. [Google Scholar]
- Kazancoglu, Y.; Sagnak, M.; Mangla, S.K.; Sezer, M.D.; Pala, M.O.; Phillips, F. A fuzzy based hybrid decision framework to circularity in dairy supply chains through big data solutions. Technol. Forecast. Soc. Change 2021, 170, 120927. [Google Scholar] [CrossRef]
- Yang, M.; Hou, A.; Wang, P.; Chai, L. Customer Environmental Performance and Supplier Green Innovation: A Sustainable Supply Chain Perspective. Sustainability 2025, 17, 1248. [Google Scholar] [CrossRef]
- Sarjana, S.; Najib, M.A.A.; Hanun, J. Digitalization of supply chain technology to encourage green supply chain. E3S Web Conf. 2024, 577, 03005. [Google Scholar] [CrossRef]
- Yousefi, S.; Tosarkani, B.M. An analytical approach for evaluating the impact of blockchain technology on sustainable supply chain performance. Int. J. Prod. Econ. 2022, 246, 108429. [Google Scholar] [CrossRef]
- Stroumpoulis, A.; Kopanaki, E.; Chountalas, P.T. Enhancing Sustainable Supply Chain Management through Digital Transformation: A Comparative Case Study Analysis. Sustainability 2024, 16, 6778. [Google Scholar] [CrossRef]
- Parast, M.M. The impact of R&D investment on mitigating supply chain disruptions: Empirical evidence from U.S. firms. Int. J. Prod. Econ. 2020, 227, 107671. [Google Scholar] [CrossRef]
- Kurpjuweit, S.; Schmidt, C.G.; Klckner, M.; Wagner, S.M. Blockchain in additive manufacturing and its impact on supply chains. J. Bus. Logist. 2019, 42, 46–70. [Google Scholar] [CrossRef]
- Li, Y.; Li, D.; Liu, Y.; Shou, Y. Digitalization for supply chain resilience and robustness: The roles of collaboration and formal contracts. Front. Eng. Manag. 2023, 10, 5–19. [Google Scholar] [CrossRef]
- Yoshikuni, A.C.; Dwivedi, R.; Kamal, M.M.; Zhou, D.; Dwivedi, P.; Apolinário, S. A dynamic information technology capability model for fostering innovation in digital transformation. J. Innov. Knowl. 2024, 9, 100589. [Google Scholar] [CrossRef]
- Zheng, T.; Ardolino, M.; Bacchetti, A.; Perona, M. The applications of Industry 4.0 technologies in manufacturing context: A systematic literature review. Int. J. Prod. Res. 2021, 59, 1922–1954. [Google Scholar] [CrossRef]
- Zarpelon Neto, G.; Pereira, G.M.; Borchardt, M. What problems manufacturing companies can face when providing services around the world? J. Bus. Ind. Mark. 2015, 30, 461–471. [Google Scholar] [CrossRef]
- Tao, W.; Weng, S.; Chen, X.; Alhussan, F.B.; Song, M. Artificial intelligence-driven transformations in low-carbon energy structure: Evidence from China. Energy Econ. 2024, 136, 107719. [Google Scholar] [CrossRef]
- Guo, H.; Shen, Z.; Chen, Y.; Dong, M. Analyzing the impact of government R&D subsidy and digital transformation on supply chain risk dynamics management and firm performance in the China’s chip industry. Int. J. Prod. Econ. 2025, 281, 109524. [Google Scholar] [CrossRef]
- Geels, F.W. Low-carbon transition via system reconfiguration? A socio-technical whole system analysis of passenger mobility in Great Britain (1990–2016). Energy Res. Soc. Sci. 2018, 46, 86–102. [Google Scholar] [CrossRef]
- Wang, L.; Chen, Y.; Ramsey, T.S.; Hewings, G.J. Will researching digital technology really empower green development? Technol. Soc. 2021, 66, 101638. [Google Scholar] [CrossRef]
- Razak, G.M.; Hendry, L.C.; Stevenson, M. Supply chain traceability: A review of the benefits and its relationship with supply chain resilience. Prod. Plan. Control. 2023, 34, 1114–1134. [Google Scholar] [CrossRef]
- Yang, G.; Nie, Y.; Li, H.; Wang, H. Digital transformation and low-carbon technology innovation in manufacturing firms: The mediating role of dynamic capabilities. Int. J. Prod. Econ. 2023, 263, 108969. [Google Scholar] [CrossRef]
- Khurana, S.; Mannan, B.; Bhardwaj, V.; Ahuja, J. Enhancing supply chain resilience through Industry 4.0 for zero carbon industry. In Zero Carbon Industry, Eco-Innovation and Environmental Sustainability; Springer Nature: Cham, Switzerland, 2025; pp. 21–34. [Google Scholar] [CrossRef]
- Afraz, M.F.; Bhatti, S.H.; Ferraris, A.; Couturier, J. The impact of supply chain innovation on competitive advantage in the construction industry: Evidence from a moderated multi-mediation model. Technol. Forecast. Soc. Change 2021, 162, 120370. [Google Scholar] [CrossRef]
- Lee, V.-H.; Ooi, K.-B.; Chong, A.Y.-L.; Seow, C. Creating technological innovation via green supply chain management: An empirical analysis. Expert Syst. Appl. 2014, 41, 6983–6994. [Google Scholar] [CrossRef]
- Zhang, R. Digital technology and supply chain efficiency: Theoretical mechanisms and empirical evidence. Res. Econ. Manag. 2022, 5, 60–76. [Google Scholar] [CrossRef]
- Zhao, Y.Z.; Qiao, Y.J.; Zhou, L.; Zhao, J.M. How to improve financial performance of high energy consumption enterprises by emission reduction measures—Mediating role of carbon performance. Syst. Eng. 2021, 39, 14–24. Available online: http://www.xitonggongcheng.cn/thread-4561-1.html (accessed on 21 February 2025).
- Hirshleifer, D.; Low, A.; Teoh, S.H. Are overconfident CEOs better innovators? J. Financ. 2012, 67, 1457–1498. [Google Scholar] [CrossRef]
- Luo, H.; Huang, W.H. The cash dividend in national enterprises, the in-service consumption, and the company’s performance. Manag. World 2008, 9, 139–148. [Google Scholar] [CrossRef]
- Li, B.; Zhang, J.R. Ownership property difference, cash dividends, and company performance. J. Shanxi Financ. Econ. Univ. 2013, 35, 95–103. [Google Scholar] [CrossRef]
- Xu, S.F.; Xu, L.B. Cash dividend policy, agency costs, and corporate performance. Manag. Sci. 2015, 28, 96–110. [Google Scholar] [CrossRef]
- Wang, X.Y.; Kong, D.M.; Li, S.A. Continuous payment of cash dividend, investment efficiency, and corporate value: PSVAR model-based empirical research. China. J. Manag. Sci. 2014, 22, 103–114. [Google Scholar] [CrossRef]
- Winters, P.R. Forecasting sales by exponentially weighted moving averages. Manag. Sci. 1960, 6, 324–342. [Google Scholar] [CrossRef]
- Hyndman, R.J.; Athanasopoulos, G. Forecasting: Principles and Practice, 2nd ed.; OTexts: Melbourne, Australia, 2018; Available online: https://otexts.com/fpp2/ (accessed on 6 January 2025).
- Busch, J.; Foxon, T.J.; Taylor, P.G. Designing industrial strategy for a low carbon transformation. Environ. Innov. Soc. Transit. 2018, 29, 114–125. [Google Scholar] [CrossRef]
- Xie, Q.X. Environmental regulation disturbance, government-enterprise relationship and R&D input. Stud. Sci. Sci. 2016, 34, 713–719, 764. [Google Scholar] [CrossRef]

| Variable Name | Variable Indicator | Variable Definition | |
|---|---|---|---|
| Dependent variable | Supply chain resilience | SCR | The average of supply chain efficiency and supply chain stability indicators |
| Independent variable | Low-Carbon Restructuring | LCR | Revenue per unit of carbon emissions; the larger the value, the higher the degree of low-carbon restructuring |
| R&D investment | R&D | R&D investment as a percentage of revenue; the larger the value, the higher the R&D investment | |
| Controlled variables | Return on Assets | ROA | Operating profit/Total assets |
| Return on Equity | ROE | Operating profit/Net assets | |
| Gross Profit Margin | Gross Profit | Gross profit/Revenue | |
| Cash Flow Ratio | Cashflow | Net cash flow from operating activities/Total assets | |
| Accounts Receivable Ratio | REC | Accounts receivable/Total assets | |
| Inventory Ratio | INV | Inventory/Total assets | |
| Fixed Assets Ratio | FIXED | Fixed assets/Total assets | |
| Intangible Assets Ratio | Intangible | Intangible assets/Total assets | |
| Revenue Growth Rate | Growth | Company revenue growth rate | |
| Other Variables | Seasonality-Free Holt–Winters Additive exponential model | SF–Holt–Winters Additive | The seasonality-free Holt–Winters additive exponential model is a time-series forecasting method that explicitly excludes seasonal components, de-composing only the level and trend terms of the data. |
| Sample Size | N | The sample size is the total number of sample elements drawn from the total population. | |
| R-squared | R2 | The proportion of variance in the dependent variable explained by the independent variables in the linear regression model. | |
| λ, α, β, φ, γ, ω, θ | λ, α, β, φ, γ, ω, θ | Model parameters to be estimated. |
| Variable | Mean | SD | SCR | LCR | LCR2 | R&D | ROA | ROE | Gross Profit | Cashflow | REC | INV | FIXED | Intangible | Growth |
|---|---|---|---|---|---|---|---|---|---|---|---|---|---|---|---|
| SCR | 1.0163 | 0.1631 | 1.000 | ||||||||||||
| LCR | 2.4404 | 0.17 | 0.288 *** | 1.000 | |||||||||||
| LCR2 | 5.9846 | 0.8118 | 0.283 *** | 0.999 *** | 1.000 | ||||||||||
| R&D | 1.1663 | 0.8006 | 0.261 *** | 0.486 *** | 0.490 *** | 1.000 | |||||||||
| ROA | 0.0357 | 0.1677 | −0.048 *** | 0.045 *** | 0.044 *** | 0.012 | 1.000 | ||||||||
| ROE | 0.0382 | 1.9521 | −0.022 ** | 0.005 | 0.005 | 0.013 | 0.030 *** | 1.000 | |||||||
| Gross Profit | 0.2626 | 0.1749 | 0.323 *** | 0.251 *** | 0.249 *** | 0.244 *** | 0.322 *** | 0.039 *** | 1.000 | ||||||
| Cash flow | 0.0496 | 0.0778 | −0.140 *** | −0.050 *** | −0.049 *** | −0.024 ** | 0.155 *** | 0.066 *** | 0.215 *** | 1.000 | |||||
| REC | 0.126 | 0.0973 | 0.080 *** | 0.291 *** | 0.295 *** | 0.227 *** | −0.026 ** | 0.012 | −0.036 *** | −0.200 *** | 1.000 | ||||
| INV | 0.1344 | 0.0884 | 0.496 *** | 0.102 *** | 0.096 *** | −0.035 *** | −0.020 * | 0.012 | −0.095 *** | −0.145 *** | 0.089 *** | 1.000 | |||
| FIXED | 0.2573 | 0.1546 | −0.284 *** | −0.472 *** | −0.469 *** | −0.268 *** | −0.069 *** | 0.007 | −0.249 *** | 0.159 *** | −0.354 *** | −0.207 *** | 1.000 | ||
| Intangible | 0.0506 | 0.0528 | 0.008 | −0.015 | −0.021 ** | −0.067 *** | −0.043 *** | 0.006 | 0.043 *** | −0.006 | −0.140 *** | −0.111 *** | −0.008 | 1.000 | |
| Growth | 0.2892 | 3.142 | −0.088 *** | 0.024 ** | 0.024 ** | −0.016 | 0.051 *** | 0.013 | 0.010 | 0.019 * | 0.010 | −0.017 | −0.015 | −0.001 | 1.000 |
| (1) | (2) | (3) | (4) | (5) | (6) | (7) | |
|---|---|---|---|---|---|---|---|
| SCR | SCR | SCR | SCR | SCR | SCR | SCR | |
| LCR | −0.0291 * | −0.0426 ** | −1.823 *** | −0.984 *** | −1.142 *** | ||
| (0.0175) | (0.0186) | (0.314) | (0.353) | (0.357) | |||
| LCR2 | 0.390 *** | 0.193 ** | 0.227 *** | ||||
| (0.0661) | (0.0755) | (0.0763) | |||||
| R&D | 0.0205 *** | −0.456 *** | |||||
| (0.00200) | (0.152) | ||||||
| LCR*R&D | 0.00919 *** | −0.0297 ** | 0.346 *** | ||||
| (0.000859) | (0.0136) | (0.126) | |||||
| LCR2 *R&D | 0.0156 *** | −0.0617 ** | |||||
| (0.00552) | (0.0263) | ||||||
| ROA | −0.0486 *** | −0.0481 *** | −0.0445 *** | −0.0444 *** | −0.0470 *** | −0.0432 *** | −0.0427 *** |
| (0.00670) | (0.00671) | (0.00667) | (0.00667) | (0.00669) | (0.00666) | (0.00666) | |
| ROE | −0.00162 *** | −0.00162 *** | −0.00163 *** | −0.00163 *** | −0.00162 *** | −0.00162 *** | −0.00162 *** |
| (0.000496) | (0.000496) | (0.000493) | (0.000493) | (0.000495) | (0.000492) | (0.000492) | |
| Gross | 0.134 *** | 0.131 *** | 0.123 *** | 0.126 *** | 0.128 *** | 0.123 *** | 0.123 *** |
| Profit | (0.0114) | (0.0116) | (0.0114) | (0.0115) | (0.0116) | (0.0115) | (0.0115) |
| Cash | −0.0731 *** | −0.0726 *** | −0.0701 *** | −0.0704 *** | −0.0736 *** | −0.0713 *** | −0.0702 *** |
| flow | (0.0151) | (0.0151) | (0.0150) | (0.0150) | (0.0151) | (0.0150) | (0.0150) |
| REC | −0.0407 ** | −0.0384 ** | −0.0389 ** | −0.0424 ** | −0.0525 *** | −0.0525 *** | −0.0547 *** |
| (0.0194) | (0.0195) | (0.0193) | (0.0193) | (0.0196) | (0.0194) | (0.0194) | |
| INV | 0.676 *** | 0.678 *** | 0.699 *** | 0.699 *** | 0.687 *** | 0.703 *** | 0.702 *** |
| (0.0196) | (0.0196) | (0.0196) | (0.0196) | (0.0196) | (0.0196) | (0.0196) | |
| FIXED | 0.0166 | 0.0188 | 0.0199 * | 0.0176 | 0.0219 * | 0.0194 * | 0.0199 * |
| (0.0116) | (0.0117) | (0.0116) | (0.0116) | (0.0117) | (0.0116) | (0.0116) | |
| Intangible | 0.0932 *** | 0.0920 *** | 0.0950 *** | 0.0978 *** | 0.108 *** | 0.111 *** | 0.109 *** |
| (0.0272) | (0.0272) | (0.0270) | (0.0270) | (0.0273) | (0.0271) | (0.0271) | |
| Growth | −0.00500 *** | −0.00502 *** | −0.00496 *** | −0.00493 *** | −0.00508 *** | −0.00497 *** | −0.00493 *** |
| (0.000392) | (0.000392) | (0.000389) | (0.000389) | (0.000391) | (0.000389) | (0.000389) | |
| _cons | 0.893 *** | 0.822 *** | 0.868 *** | 0.969 *** | 3.006 *** | 2.108 *** | 2.294 *** |
| (0.00627) | (0.0434) | (0.00671) | (0.0452) | (0.372) | (0.413) | (0.417) | |
| Hausman test p-value | 0.000 | 0.000 | 0.000 | 0.000 | 0.000 | 0.000 | 0.000 |
| N | 8967 | 8967 | 8967 | 8967 | 8967 | 8967 | 8967 |
| R2 | 0.164 | 0.164 | 0.175 | 0.176 | 0.168 | 0.178 | 0.180 |
| adj. R2 | 0.021 | 0.022 | 0.035 | 0.036 | 0.166 | 0.177 | 0.178 |
| Heavily Polluting Industries | Non-Heavily Polluting Industries | Heavily Polluting Industries | Non-Heavily Polluting Industries | Heavily Polluting Industries | Non-Heavily Polluting Industries | |
|---|---|---|---|---|---|---|
| SCR | SCR | SCR | SCR | SCR | SCR | |
| LCR | 0.0704 | −0.0948 * | −3.001 ** | −4.423 *** | ||
| (0.0540) | (0.0536) | (1.174) | (1.135) | |||
| LCR2 | 0.668 *** | 0.884 *** | ||||
| (0.253) | (0.227) | |||||
| ROA | −0.121 *** | −0.0379 * | −0.121 ** | −0.0378 * | −0.115 ** | −0.0344 * |
| (0.0222) | (0.0201) | (0.0508) | (0.0200) | (0.0503) | (0.0176) | |
| ROE | −0.00130 ** | −0.0217 ** | −0.00129 *** | −0.0215 ** | −0.00125 *** | −0.0209 ** |
| (0.000542) | (0.00859) | (0.000454) | (0.00851) | (0.000448) | (0.00842) | |
| Gross | 0.107 *** | 0.162 *** | 0.0967 | 0.167 *** | 0.0777 | 0.164 *** |
| Profit | (0.0179) | (0.0364) | (0.0628) | (0.0357) | (0.0589) | (0.0344) |
| Cash | −0.0264 | −0.0780 *** | −0.0230 | −0.0784 *** | −0.0229 | −0.0797 *** |
| flow | (0.0263) | (0.0235) | (0.0350) | (0.0233) | (0.0347) | (0.0233) |
| REC | −0.0189 | −0.0690 | −0.00593 | −0.0716 | -0.0252 | −0.0868 * |
| (0.0343) | (0.0512) | (0.0604) | (0.0499) | (0.0598) | (0.0447) | |
| INV | 0.702 *** | 0.596 *** | 0.700 *** | 0.579 *** | 0.699 *** | 0.584 *** |
| (0.0295) | (0.0460) | (0.0628) | (0.0440) | (0.0631) | (0.0432) | |
| FIXED | −0.0348 ** | 0.0850 *** | −0.0328 | 0.0792 *** | −0.0310 | 0.0808 *** |
| (0.0174) | (0.0271) | (0.0402) | (0.0271) | (0.0402) | (0.0259) | |
| Intangible | 0.155 *** | −0.0312 | 0.147 * | −0.0302 | 0.160 * | −0.000529 |
| (0.0414) | (0.0648) | (0.0842) | (0.0641) | (0.0841) | (0.0646) | |
| Growth | −0.00319 *** | −0.00741 *** | −0.00320 | −0.00738 *** | −0.00328 | −0.00743 *** |
| (0.000567) | (0.00153) | (0.00197) | (0.00153) | (0.00202) | (0.00153) | |
| _cons | 0.889 *** | 0.910 *** | 0.727 *** | 1.152 *** | 4.246 *** | 6.433 *** |
| (0.0102) | (0.0128) | (0.123) | (0.136) | (1.360) | (1.416) | |
| N | 3941 | 5026 | 3941 | 5026 | 3941 | 5026 |
| R2 | 0.162 | 0.181 | 0.163 | 0.183 | 0.170 | 0.199 |
| adj. R2 | 0.026 | 0.179 | 0.161 | 0.182 | 0.168 | 0.197 |
| Heavily Polluting Industries | Non-Heavily Polluting Industries | Heavily Polluting Industries | Non-Heavily Polluting Industries | Heavily Polluting Industries | Non-Heavily Polluting Industries | |
|---|---|---|---|---|---|---|
| SCR | SCR | SCR | SCR | SCR | SCR | |
| LCR | 0.0191 | −0.196 *** | −3.127 ** | −3.732 *** | ||
| (0.0546) | (0.0579) | (1.402) | (1.222) | |||
| LCR2 | 0.687 ** | 0.718 *** | ||||
| (0.307) | (0.248) | |||||
| R&D | 0.0182 *** | 0.0191 *** | −1.257 | −0.362 ** | ||
| (0.00343) | (0.00343) | (1.124) | (0.161) | |||
| LCR*R&D | 0.00768 *** | 0.0102 *** | 1.082 | 0.263 ** | ||
| (0.00222) | (0.00153) | (0.966) | (0.130) | |||
| LCR2 *R&D | −0.229 | −0.0437 | ||||
| (0.207) | (0.0277) | |||||
| ROA | −0.117 *** | −0.0361 * | −0.116 ** | −0.0349 * | −0.116 ** | −0.0313 * |
| (0.0221) | (0.0199) | (0.0508) | (0.0193) | (0.0509) | (0.0167) | |
| ROE | −0.00131 ** | −0.0205 ** | −0.00131 *** | −0.0198 ** | −0.00125 *** | −0.0194 ** |
| (0.000540) | (0.00818) | (0.000436) | (0.00786) | (0.000433) | (0.00779) | |
| Gross | 0.0956 *** | 0.153 *** | 0.0916 | 0.160 *** | 0.0780 | 0.157 *** |
| Profit | (0.0179) | (0.0359) | (0.0617) | (0.0348) | (0.0592) | (0.0330) |
| Cash | −0.0234 | −0.0772 *** | −0.0222 | −0.0776 *** | −0.0251 | −0.0769 *** |
| flow | (0.0262) | (0.0232) | (0.0345) | (0.0227) | (0.0343) | (0.0227) |
| REC | −0.00748 | −0.0700 | −0.00407 | −0.0756 | −0.0249 | −0.0880 ** |
| (0.0343) | (0.0505) | (0.0612) | (0.0477) | (0.0606) | (0.0433) | |
| INV | 0.714 *** | 0.625 *** | 0.713 *** | 0.602 *** | 0.711 *** | 0.605 *** |
| (0.0295) | (0.0475) | (0.0632) | (0.0450) | (0.0638) | (0.0444) | |
| FIXED | −0.0357 ** | 0.0857 *** | −0.0350 | 0.0743 *** | −0.0316 | 0.0758 *** |
| (0.0174) | (0.0268) | (0.0400) | (0.0266) | (0.0402) | (0.0255) | |
| Intangible | 0.153 *** | −0.0343 | 0.152 * | −0.0319 | 0.162 * | −0.00568 |
| (0.0413) | (0.0616) | (0.0839) | (0.0593) | (0.0835) | (0.0589) | |
| Growth | −0.00313 *** | −0.00730 *** | −0.00313 | −0.00720 *** | −0.00320 | −0.00719 *** |
| (0.000564) | (0.00146) | (0.00194) | (0.00142) | (0.00199) | (0.00143) | |
| _cons | 0.873 *** | 0.882 *** | 0.830 *** | 1.373 *** | 4.424 *** | 5.713 *** |
| (0.0106) | (0.0140) | (0.125) | (0.144) | (1.598) | (1.503) | |
| N | 3941 | 5026 | 3941 | 5026 | 3941 | 5026 |
| R2 | 0.169 | 0.193 | 0.170 | 0.203 | 0.178 | 0.217 |
| adj. R2 | 0.033 | 0.191 | 0.167 | 0.201 | 0.175 | 0.214 |
| Year | 2024 | 2025 | 2026 | 2027 | 2028 | 2029 | 2030 |
|---|---|---|---|---|---|---|---|
| Degree of low-carbon reconfiguration | 2.572 | 2.593 | 2.614 | 2.635 | 2.656 | 2.678 | 2.699 |
| SCR | SCR | SCR | |
|---|---|---|---|
| (3) | (4) | (6) | |
| YFRY | 0.00402 *** | 0.00220 ** | 0.00164 * |
| (0.000838) | (0.000917) | (0.000929) | |
| LCR | −0.0482 ** | −0.826 ** | |
| (0.0190) | (0.362) | ||
| LCR2 | 0.158 ** | ||
| (0.0774) | |||
| R&D | 0.00196 *** | ||
| (0.000250) | |||
| LCR*R&D | 0.00870 *** | −0.0385 *** | |
| (0.000902) | (0.0140) | ||
| LCR2 *R&D | 0.0190 *** | ||
| (0.00565) | |||
| ROE | −0.00163 *** | −0.00164 *** | −0.00163 *** |
| (0.000495) | (0.000494) | (0.000493) | |
| Gross Profit | 0.0949 *** | 0.0937 *** | 0.0922 *** |
| (0.0103) | (0.0105) | (0.0104) | |
| Cashflow | −0.0645 *** | −0.0711 *** | −0.0721 *** |
| (0.0151) | (0.0151) | (0.0150) | |
| REC | −0.0356 * | −0.0389 ** | −0.0483 ** |
| (0.0193) | (0.0194) | (0.0195) | |
| INV | 0.697 *** | 0.702 *** | 0.703 *** |
| (0.0199) | (0.0198) | (0.0198) | |
| FIXED | 0.0220 * | 0.0190 | 0.0202 * |
| (0.0116) | (0.0117) | (0.0117) | |
| Intangible | 0.0830 *** | 0.102 *** | 0.113 *** |
| (0.0272) | (0.0271) | (0.0271) | |
| Growth | −0.00513 *** | −0.00508 *** | −0.00511 *** |
| (0.000390) | (0.000389) | (0.000389) | |
| _cons | 0.885 *** | 0.987 *** | 1.940 *** |
| (0.00643) | (0.0459) | (0.421) | |
| N | 8967 | 8967 | 8967 |
| R2 | 0.169 | 0.172 | 0.175 |
| adj. R2 | 0.028 | 0.032 | 0.035 |
Disclaimer/Publisher’s Note: The statements, opinions and data contained in all publications are solely those of the individual author(s) and contributor(s) and not of MDPI and/or the editor(s). MDPI and/or the editor(s) disclaim responsibility for any injury to people or property resulting from any ideas, methods, instructions or products referred to in the content. |
© 2025 by the authors. Licensee MDPI, Basel, Switzerland. This article is an open access article distributed under the terms and conditions of the Creative Commons Attribution (CC BY) license (https://creativecommons.org/licenses/by/4.0/).
Share and Cite
Wang, W.; Sun, L. Low-Carbon Restructuring, R&D Investment, and Supply Chain Resilience: A U-Shaped Relationship. Sustainability 2025, 17, 5723. https://doi.org/10.3390/su17135723
Wang W, Sun L. Low-Carbon Restructuring, R&D Investment, and Supply Chain Resilience: A U-Shaped Relationship. Sustainability. 2025; 17(13):5723. https://doi.org/10.3390/su17135723
Chicago/Turabian StyleWang, Wanping, and Licheng Sun. 2025. "Low-Carbon Restructuring, R&D Investment, and Supply Chain Resilience: A U-Shaped Relationship" Sustainability 17, no. 13: 5723. https://doi.org/10.3390/su17135723
APA StyleWang, W., & Sun, L. (2025). Low-Carbon Restructuring, R&D Investment, and Supply Chain Resilience: A U-Shaped Relationship. Sustainability, 17(13), 5723. https://doi.org/10.3390/su17135723