1. Introduction
The Sixth Assessment Report of the Intergovernmental Panel on Climate Change (IPCC) indicates that, as global warming intensifies, climate hazards are projected to become more frequent and severe, posing greater health risks to urban populations [
1]. Low temperatures have increasingly led to challenges such as surging energy demand, strained infrastructure, and heightened health risks for vulnerable groups [
2,
3]. For example, on 12 February 2021, Winter Storm Yuri struck the United States, causing extreme cold conditions and icy roads that resulted in numerous fatalities [
4]. On 7 January 2021, China experienced a cold wave that triggered a sharp increase in electricity demand, with the State Grid’s load reaching a historic peak of 960 GW and daily transmission exceeding 20.2 TWh [
5]. This underscores the need for a scientifically grounded vulnerability assessment model that identifies contributing factors and supports timely interventions to mitigate cold wave impacts.
The concept of vulnerability was initially introduced in the field of natural hazards to describe the degree to which a system is susceptible to irreversible damage and impact, and it has since been extensively adopted in disciplines such as ecology, social sciences, geosciences, and sustainability science [
6]. Scientific assessments of system vulnerability, along with the identification of threshold values for key influencing factors, are essential for providing a sound basis to address climate change, enhance system functionality, and promote sustainable development [
7].
Various models have been employed to study urban vulnerability, each addressing different aspects of the issue. Yi Ge et al. incorporated inter-city linkages into vulnerability assessments by adding “connectivity” as a new dimension to the traditional social vulnerability framework. They developed a composite social vulnerability index and applied it to the Yangtze River Delta region in China [
8]. Hong Lv et al. proposed a framework to assess urban dynamic vulnerability based on real-time population mobility. By integrating exposure, sensitivity, and coping capacity, they characterized the dynamic vulnerability to urban flooding. Using Zhengzhou City as a case study, they concluded that population mobility significantly influences vulnerability to flood-related disasters [
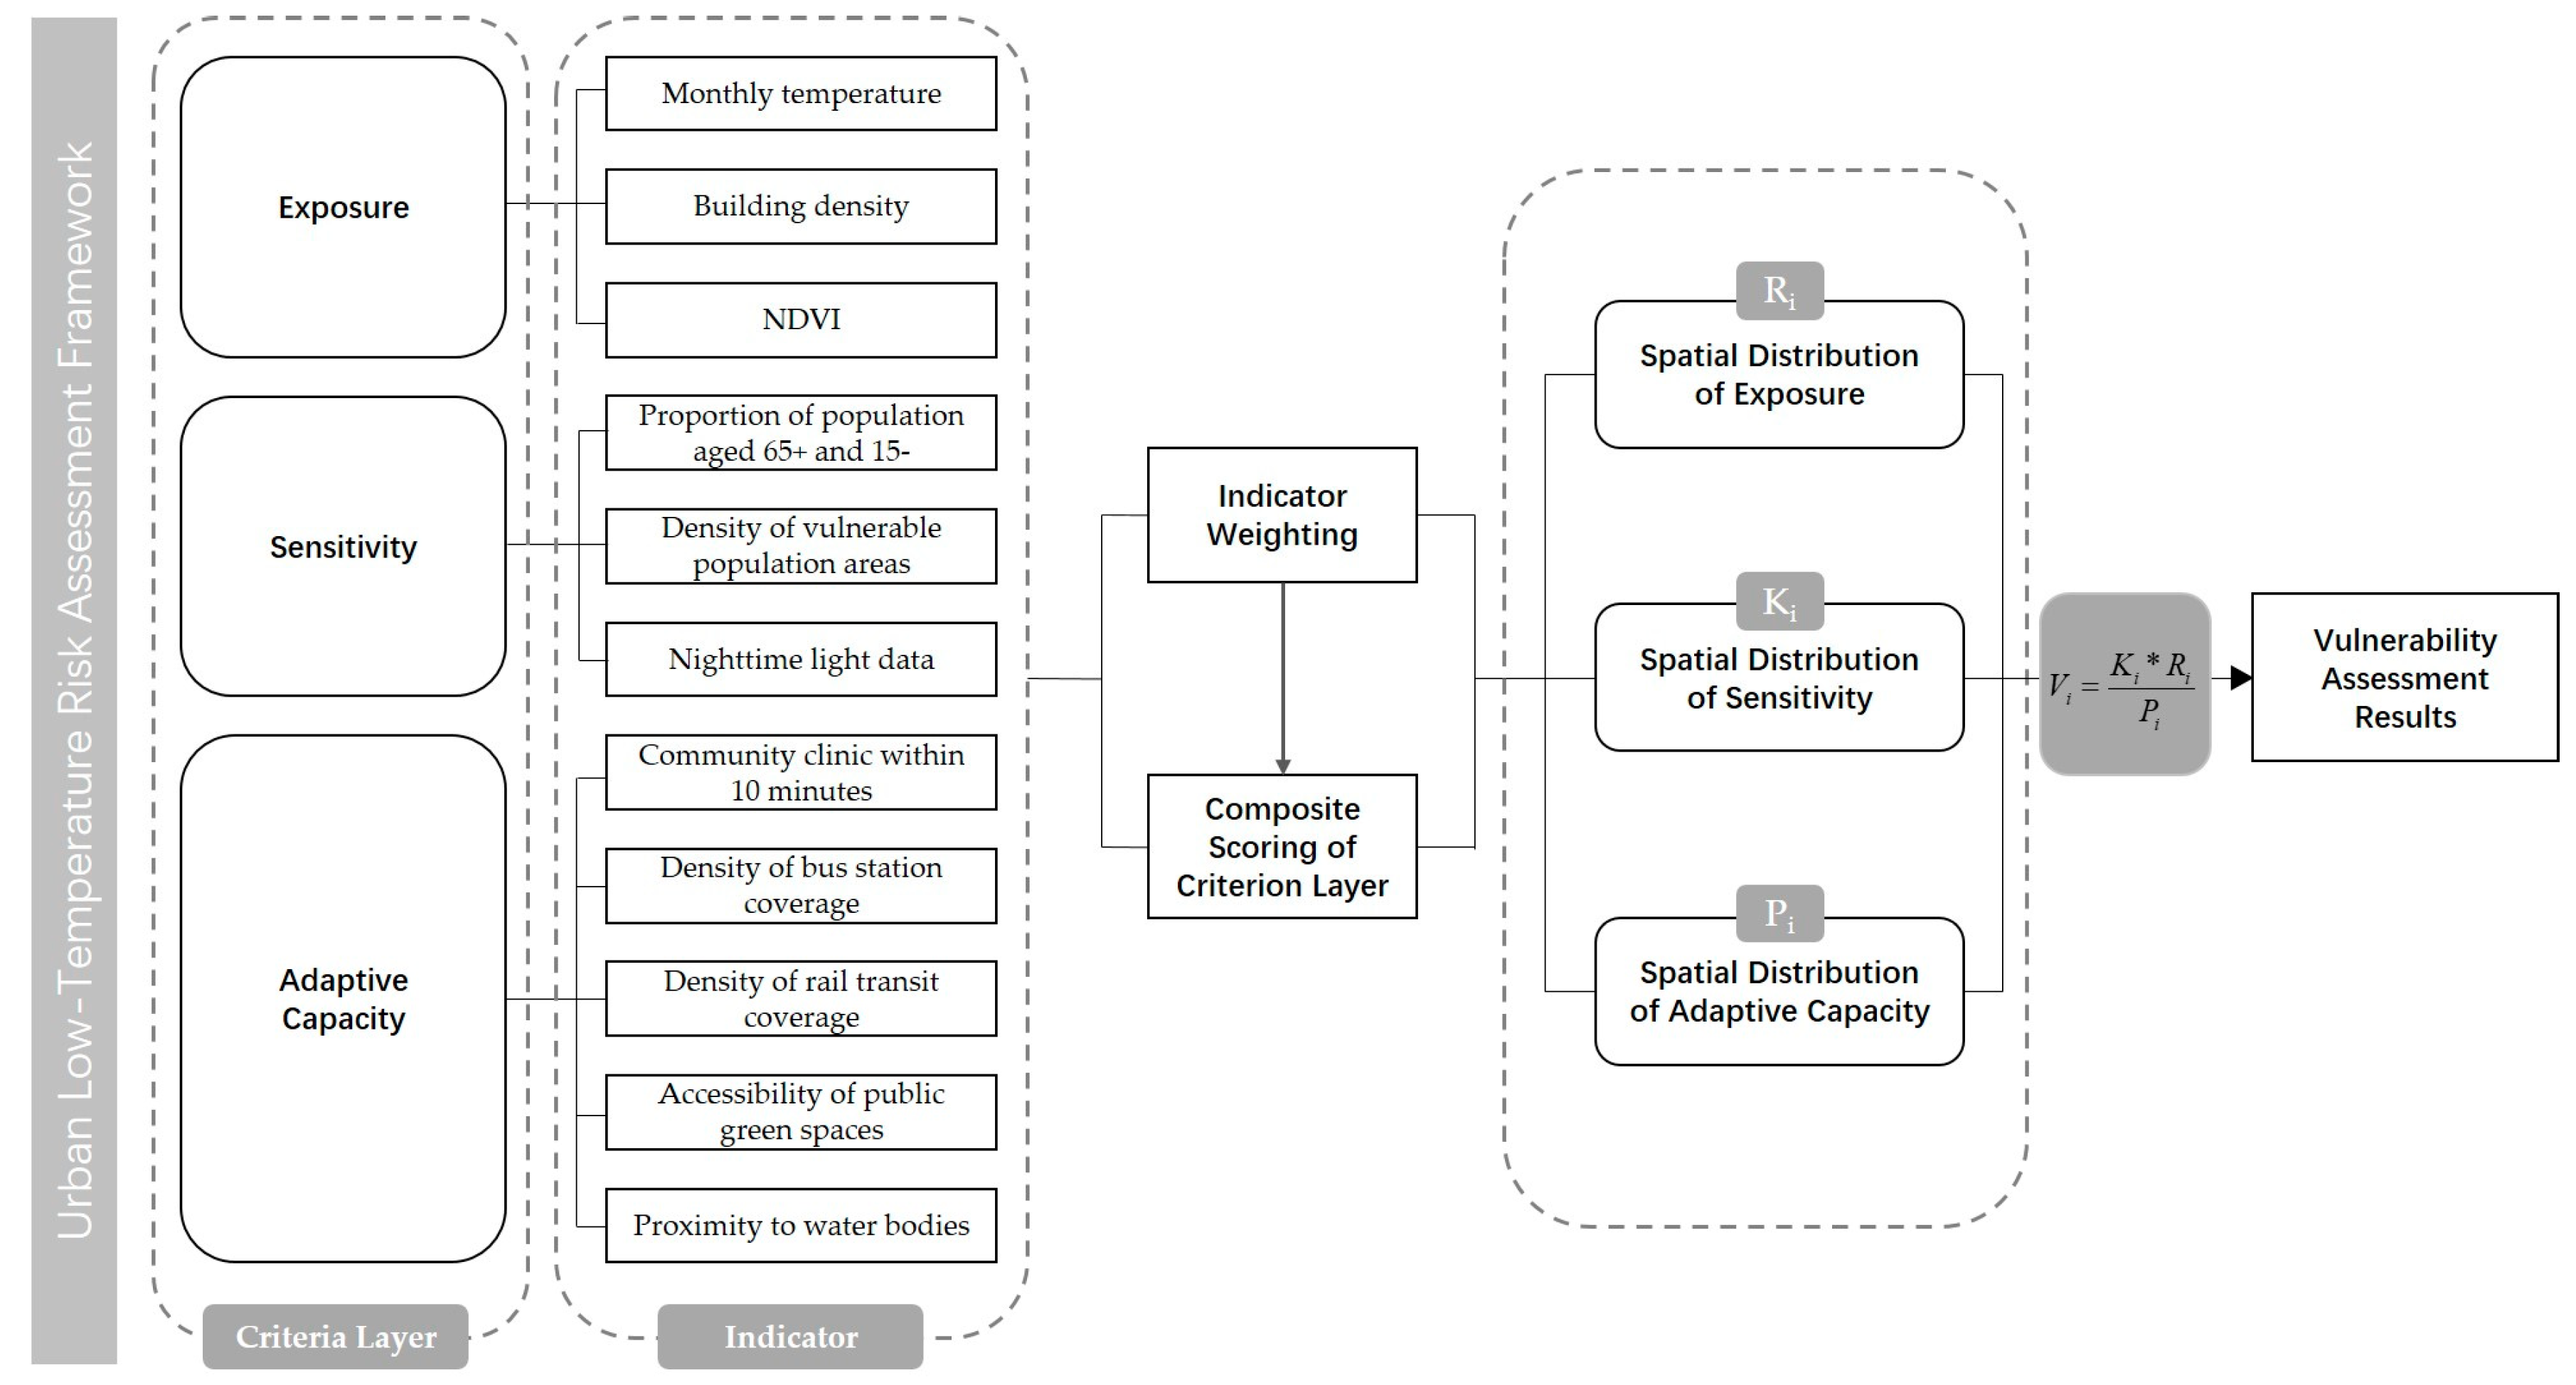
9]. The most widely adopted model is the three-dimensional “Exposure–Sensitivity–Adaptive Capacity” (ESA) framework proposed by the IPCC, which emphasizes a comprehensive assessment of urban vulnerability through the evaluation of exposure levels, system sensitivity, and adaptive capacity. Subham Roy et al. introduced the Urban Social Vulnerability Index (USoVI), which integrates these three components [
10]. They applied this index to 146 urban centers in West Bengal, revealing varying levels of vulnerability and socio-economic disparities through the use of diverse indicators and advanced GIS mapping techniques. Yufeng Yao et al. applied the ESA model to evaluate the vulnerability and adaptive capacity of global cities in the context of climate change. Their findings indicate that economic factors play a critical role in shaping adaptive capacity and overall vulnerability, exhibiting significant spatial heterogeneity across urban regions [
11].
With the intensification of global climate change, vulnerability assessment models have been increasingly applied to the identification and analysis of climate-related risks. In the ESA three-dimensional model used to assess climate-related risks, each indicator represents a distinct component of vulnerability. The “exposure” component refers to the extent to which an affected entity is in contact with a hazard during the occurrence of a disaster [
12]. Factors such as disaster frequency, land cover characteristics, and spatial organization are all considered to influence exposure levels. Residents are generally regarded as the primary affected entities; hence, higher population density is typically associated with an increased level of exposure.
The sensitivity indicator considers the varying degrees of impact on different demographic groups, recognizing that vulnerable populations in urban areas are more susceptible to climate change due to physiological limitations. Research indicates that differences in physiological characteristics affect individuals’ self-regulation abilities, making certain groups—such as the elderly, individuals with pre-existing health conditions, and children—more sensitive to low temperatures [
13,
14]. A higher proportion of vulnerable populations increases the health risks a city may face when responding to climate change. Additionally, the relationship between a region’s economic development level and sensitivity is also significant. Studies suggest that stronger socio-economic conditions facilitate better risk management [
15], meaning that regions with higher GDP levels tend to exhibit lower sensitivity to climate change.
The “adaptive capacity” indicator refers to the ability of societies and individuals to adjust to, cope with, and mitigate the impacts of disasters [
16]. Adaptive capacity has been widely interpreted in two dimensions: (1) externally driven capacity, which depends on the allocation of public resources such as healthcare access and regional GDP levels [
17]; and (2) internally driven capacity, which relates to individual resource possession, behavioral awareness, and proactive response capabilities [
18]. A greater abundance of public facilities enhances both routine and post-disaster emergency response capacity. For instance, community service centers, libraries, and gymnasiums can serve as emergency shelters for residents, particularly for vulnerable groups such as the elderly and children [
19]. Moreover, improved infrastructure contributes to lower rates of public health emergencies, encourages physical activity, and reduces risks associated with mental health disorders. The educational and economic status of a population also influences its capacity to respond to climate-related health risks. For example, higher levels of risk perception are associated with greater proactive behavior in avoiding hazards, thereby reducing both disaster impacts and disease risks [
20]. Additionally, richer ecosystems enhance microclimate regulation and improve the ability to buffer against climate change impacts [
21,
22].
Existing applications of the ESA model in climate risk assessment have primarily concentrated on high-temperature and flood-related hazards. Researchers have employed the ESA framework to evaluate such risks and have proposed corresponding planning strategies. For instance, Chen Cheng et al. [
23] developed a meteorological disaster risk assessment model based on the “Exposure–Sensitivity–Adaptive Capacity” framework, incorporating hazard factors, population exposure, and subsurface susceptibility. The model was applied to assess heavy rainfall and heatwave hazards in Beijing and to inform territorial spatial planning strategies. Similarly, Denis Maragno et al. [
24] developed a neighborhood-scale ESA model and applied it to Padua, Italy, to quantify and map the city’s exposure, sensitivity, and adaptive capacity, thereby identifying the most vulnerable areas.
One of the few applications of ESA modeling to cold-weather hazards is the study by Li Tao et al. [
25], which assessed extreme cold risk along the China–Pakistan Economic Corridor (CPEC). However, as the CPEC represents a regional-scale context, the scope of that study was too broad, resulting in coarse-scale risk delineation and limiting the capacity to evaluate how factors such as population density, building density, infrastructure, and public services influence cold risk at the local scale. Nor does it allow for the development of localized planning strategies to mitigate cold-weather vulnerability.
Most fine-scale studies on cold-temperature risk have focused either on the health impacts of extreme cold weather or on specific urban infrastructure components. For instance, M. Yang et al. [
26] examined the association between ambient temperature and myocardial infarction, finding that the risk of mortality was higher in rural areas due to cold exposure. Paulina Tedesco et al. [
27] found that winter cold is associated with increased electricity demand, with extreme low temperatures affecting both energy consumption peaks and production capacity. Garmabaki et al. [
28] studied the effects of extreme temperatures on urban rail infrastructure, noting that cold conditions can cause rail defects and fractures, which in turn disrupt transportation system operations.
However, these studies tend to overlook the fact that cities are integrated and complex systems, comprising population, infrastructure, public services, and ecological elements such as green spaces and water bodies. Therefore, cold-risk assessment should move beyond isolated components and adopt a holistic, system-based perspective.
In summary, although there is a growing body of research on urban cold-temperature risk, notable gaps and limitations remain. This study addresses these gaps by applying the Exposure–Sensitivity–Adaptive Capacity (ESA) model to cold-temperature vulnerability assessment, thereby extending the model’s scope of application. Unlike prior studies that focus on single factors, it integrates multi-source data to conduct a comprehensive cold risk assessment and identifies highly vulnerable areas to provide a scientific basis for developing climate-resilient urban planning strategies.
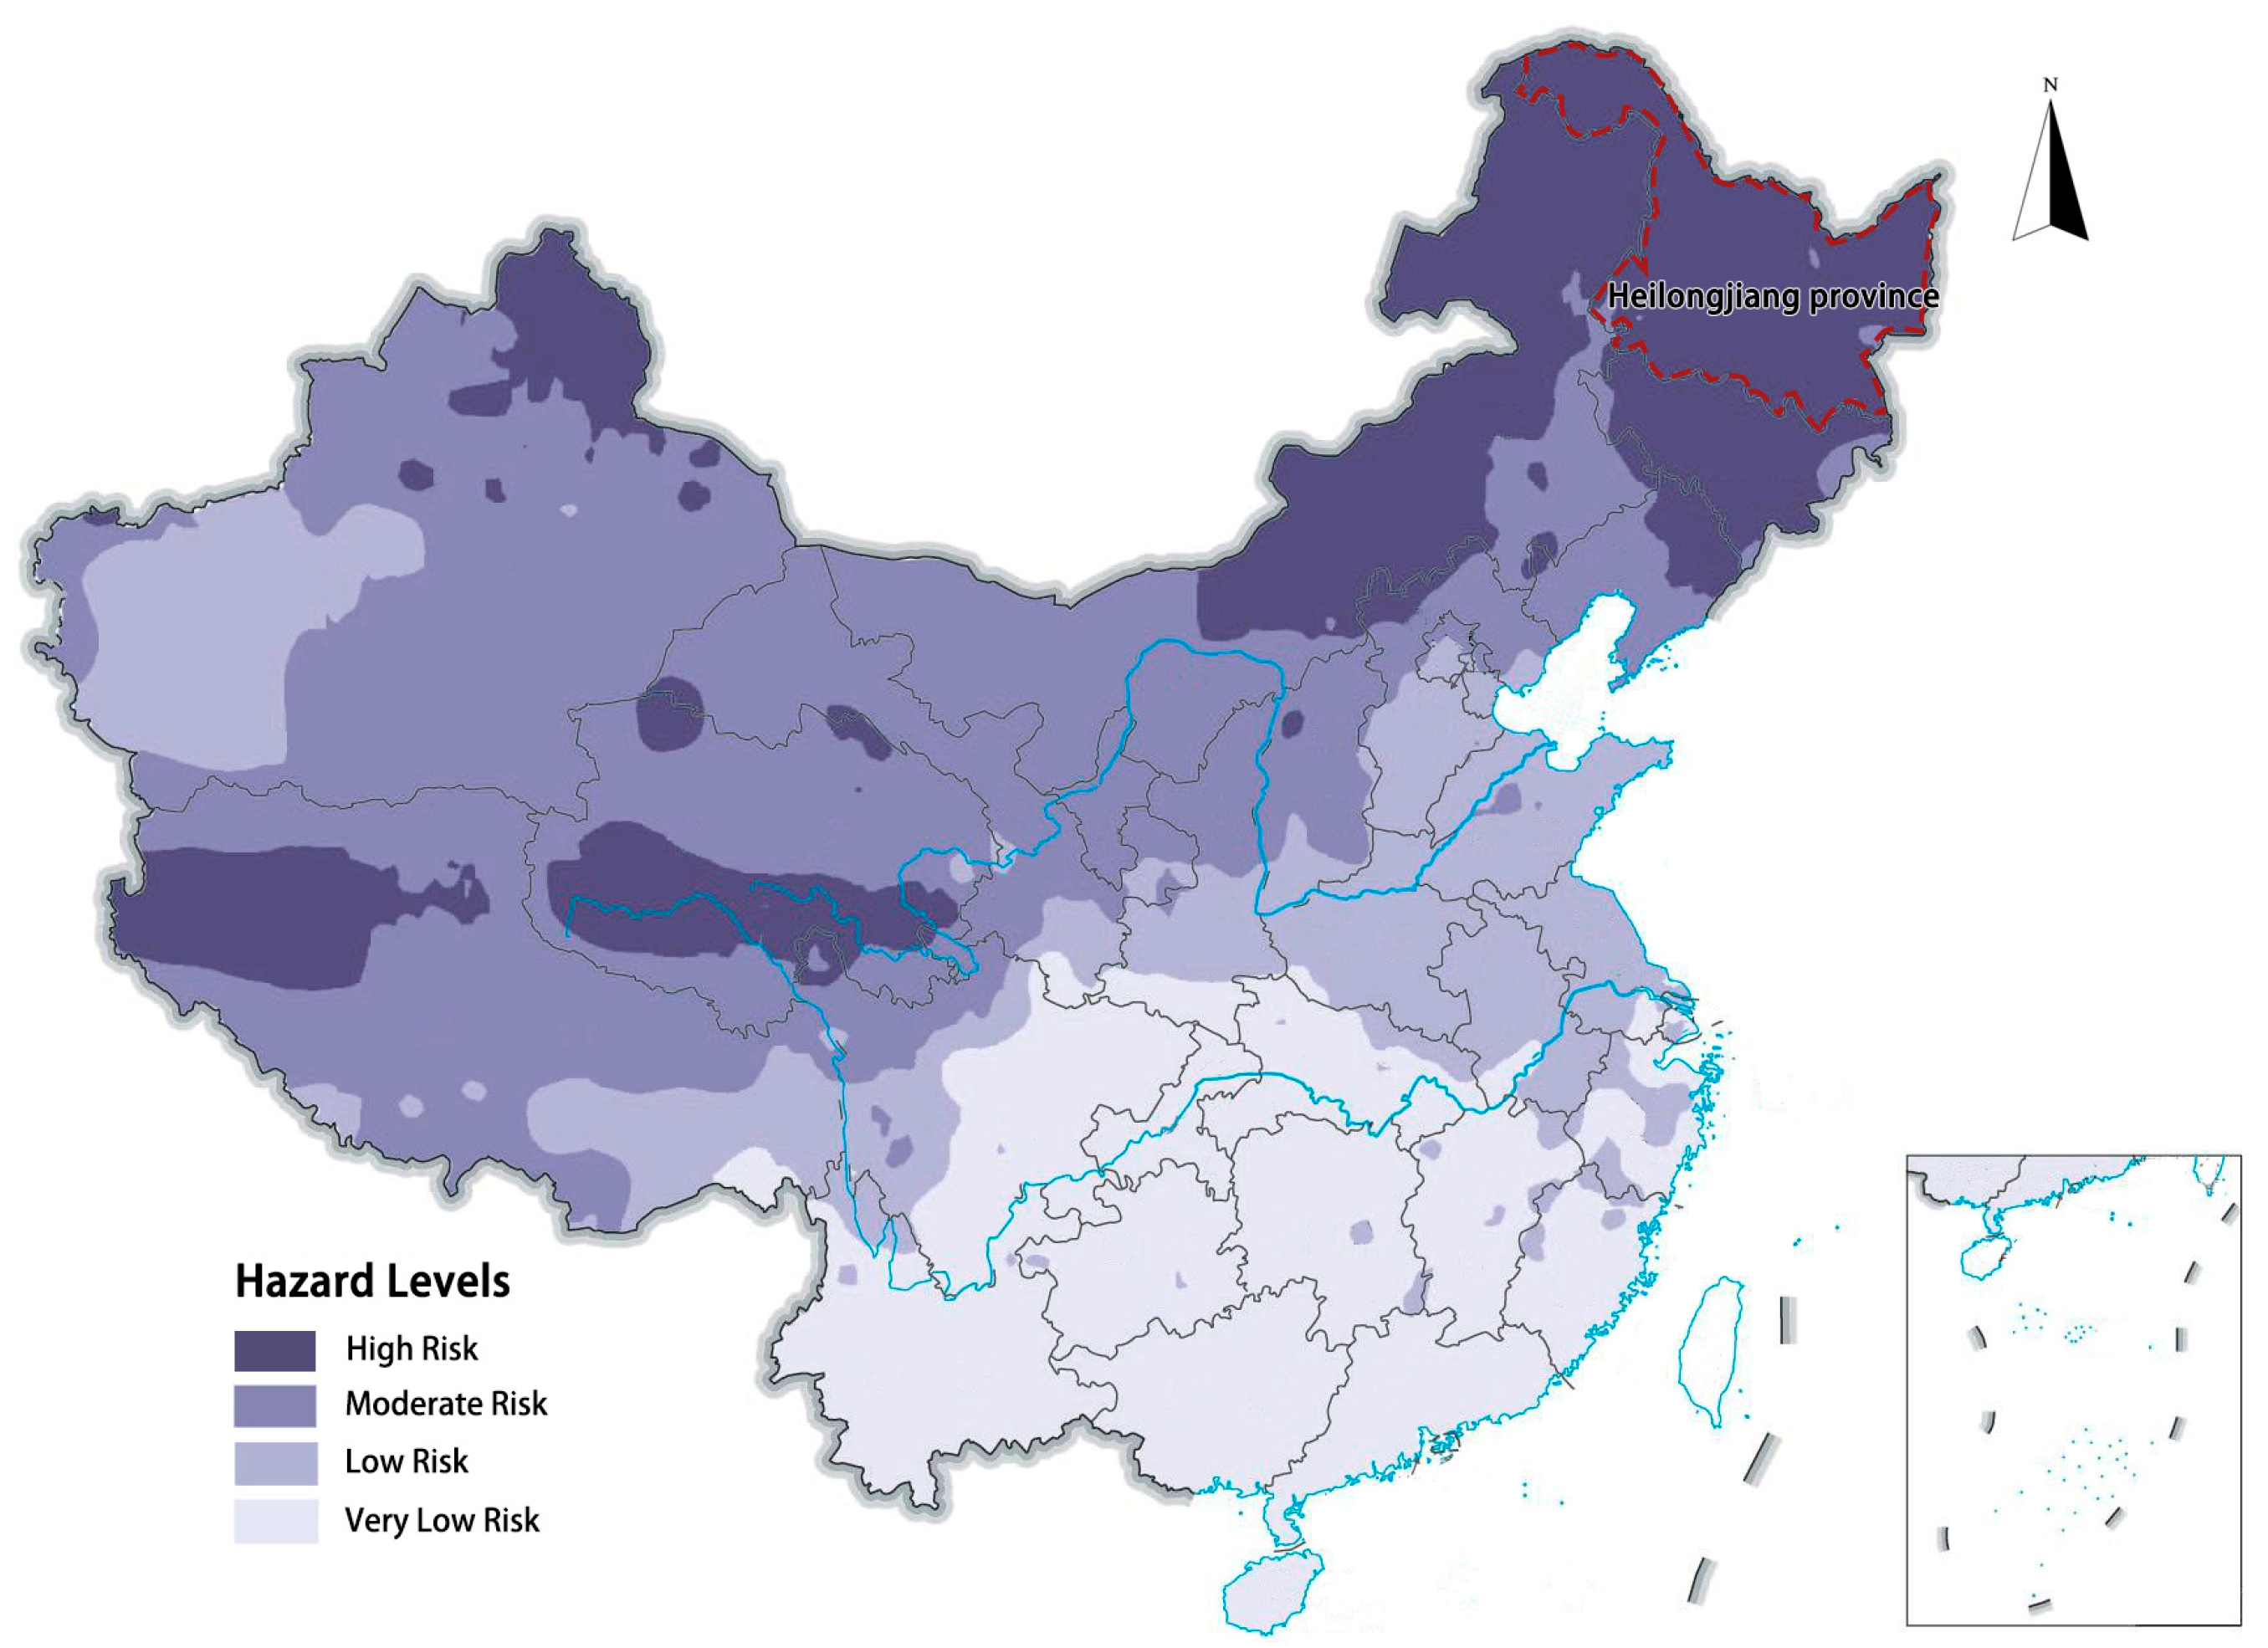
According to the First National Comprehensive Natural Disaster Risk Census Bulletin released in May 2024, Heilongjiang Province has been classified as a high-risk area for low-temperature and cold wave disasters [
29] (
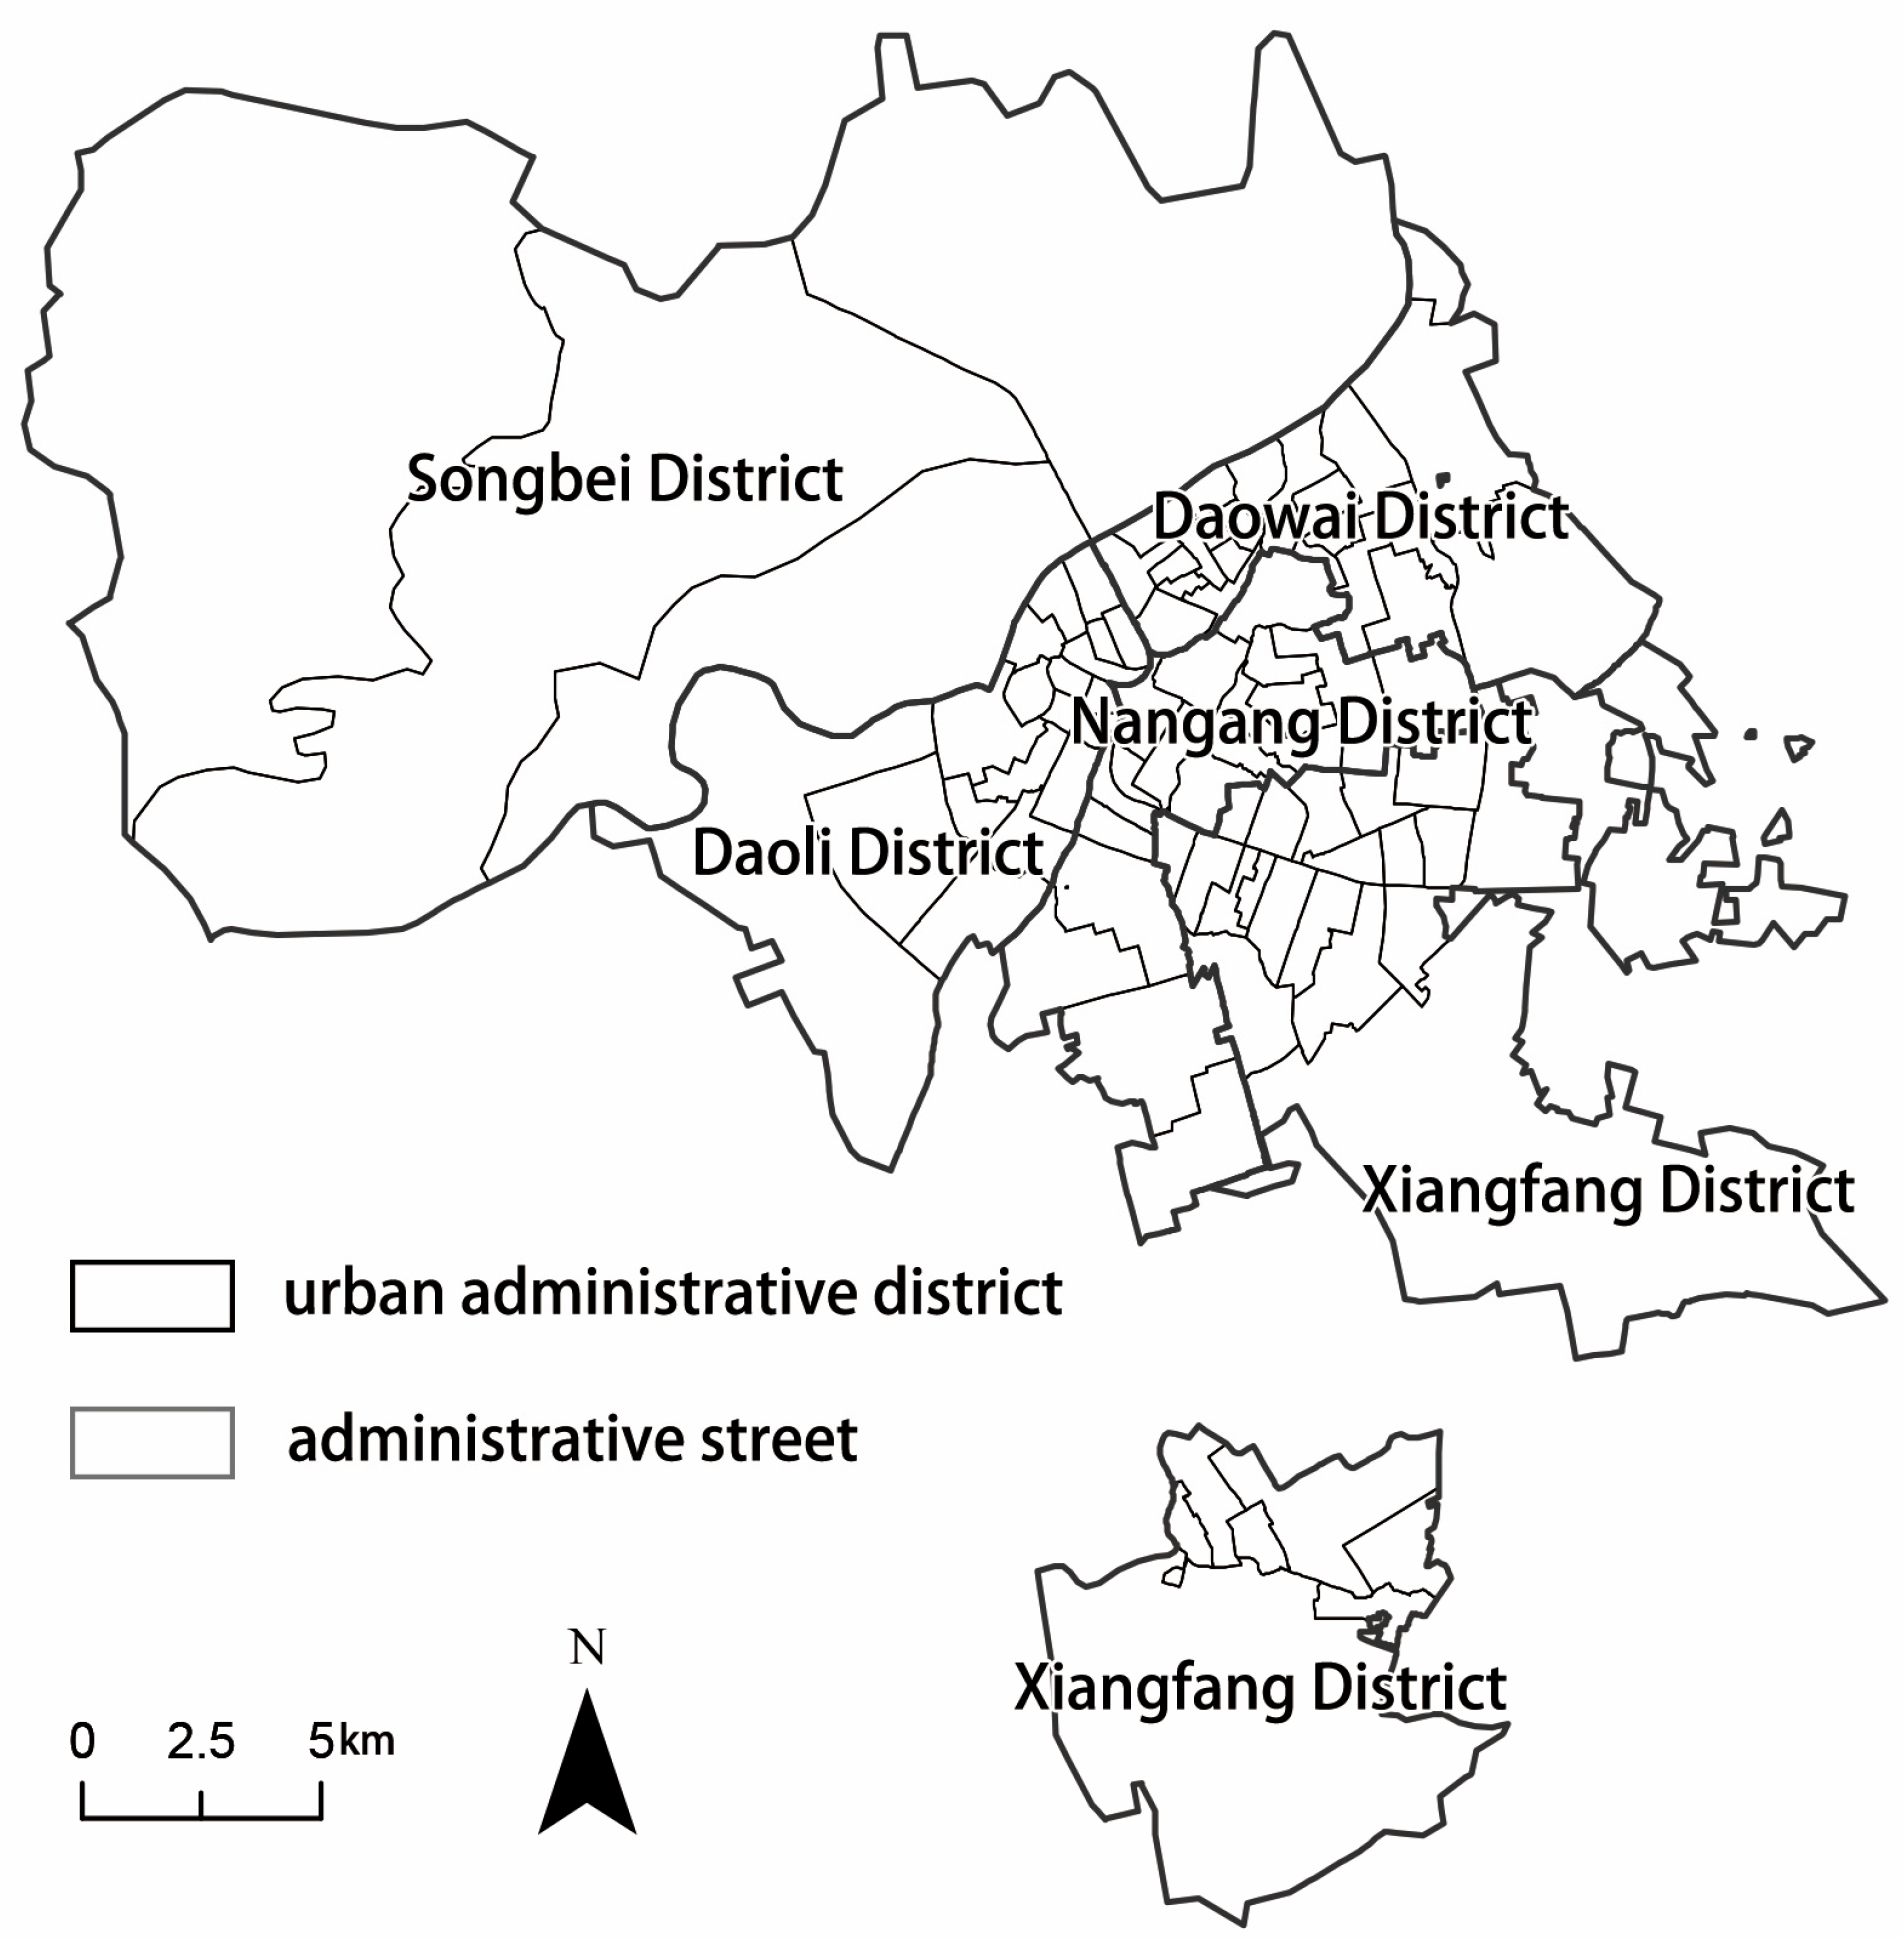
Figure 1). Harbin, the provincial capital, is a representative cold-region city, where the combination of a unique climatic environment and rapid urbanization has increased the complexity of low-temperature disaster risks. Traditional disaster response strategies are increasingly insufficient to meet the diverse and evolving demands of climate adaptation. Therefore, this study focuses on the central urban area of Harbin and develops a vulnerability assessment system for cold-related risks, integrating multivariate data to quantify the vulnerability of urban human settlements. The spatial distribution of vulnerable subdistricts susceptible to low-temperature hazards during winter is identified with improved precision. The main contributing factors to vulnerability are analyzed, and targeted planning and response strategies are proposed.
3. Results
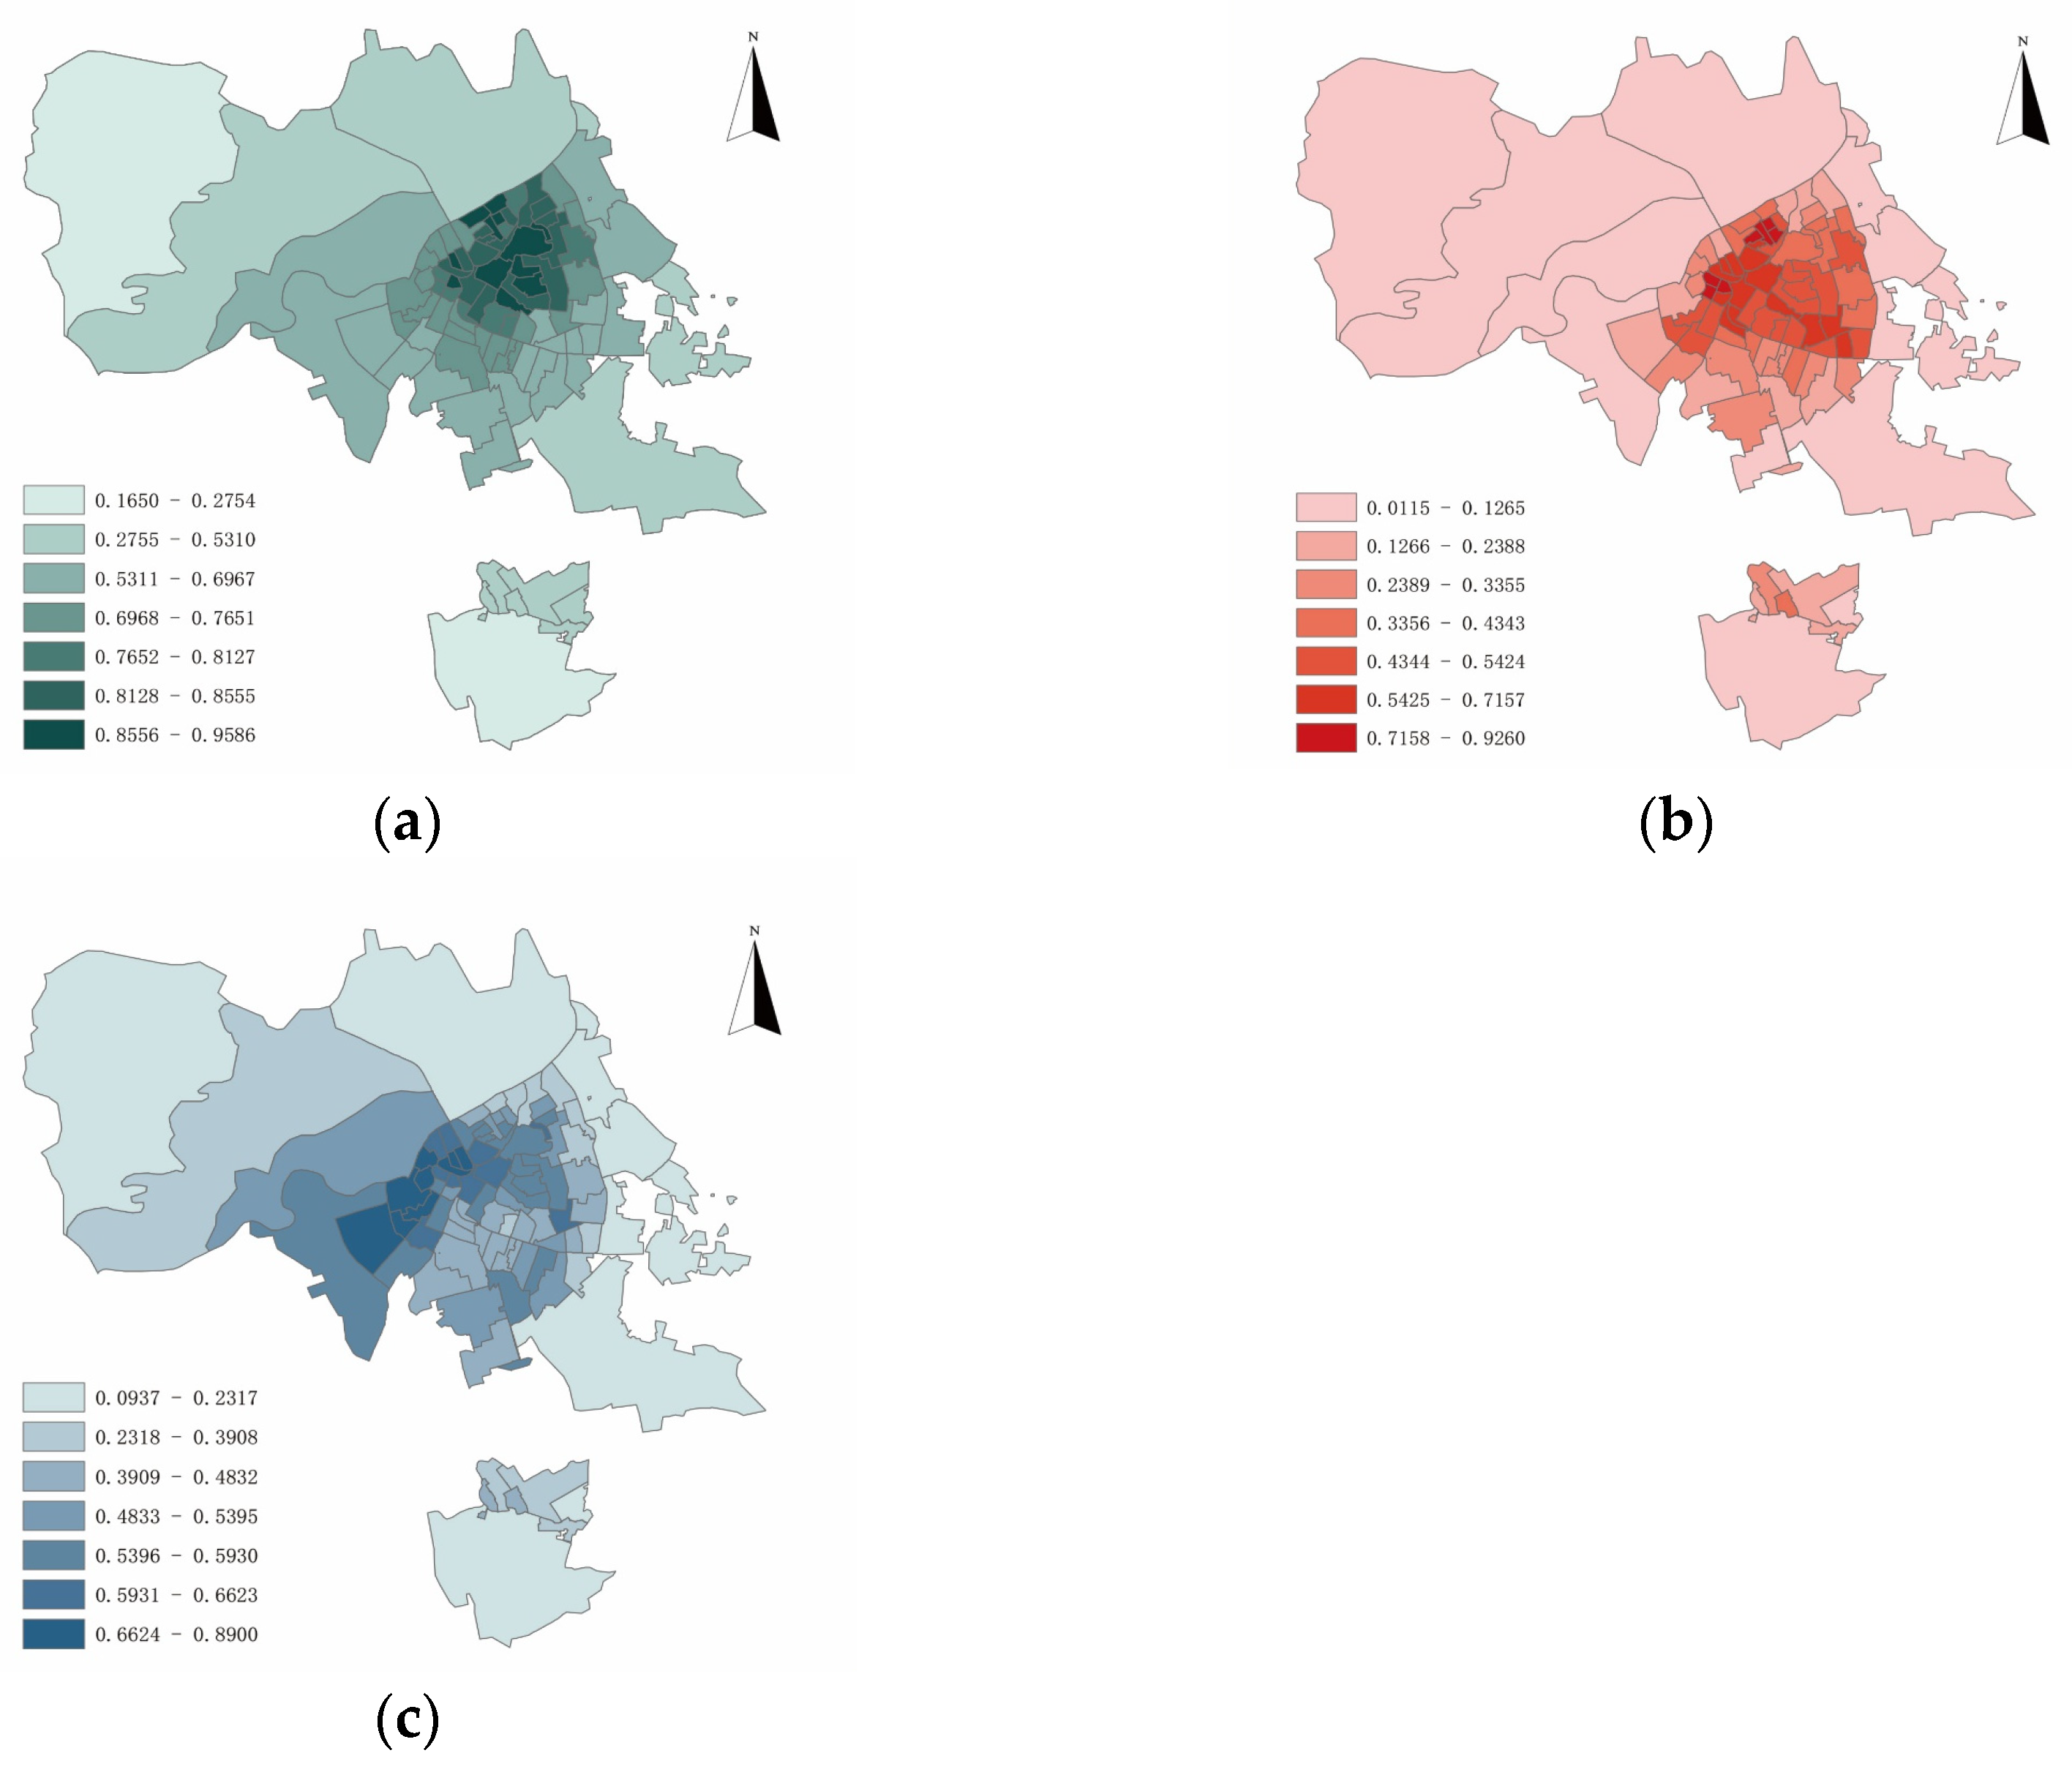
By applying the aforementioned methodology to calculate the vulnerability index of low-temperature risk for each subdistrict in the central urban area of Harbin, the results reveal the following significant characteristics (
Figure 4).
3.1. Exposure
Exposure in the study area exhibited a central-high and peripheral-low spatial pattern (
Figure 4a). These centrally located areas are densely built and primarily consist of older residential neighborhoods, characterized by a high proportion of impervious surfaces and limited green space. As a result, vegetation such as shrubs and trees are insufficient to mitigate cold exposure during low-temperature events.
Exposure values were classified into seven categories, namely very high (0.8556–0.9586), high (0.8128–0.8555), moderately high (0.7652–0.8127), medium (0.6968–0.7651), moderately low (0.5311–0.6967), low (0.2755–0.5310), and very low (0.1650–0.2754). The proportion of subdistricts falling within each exposure category was 13.19%, 16.48%, 9.89%, 23.08%, 24.18%, 10.99%, and 2.20%, respectively. The highest exposure value (0.9586) was observed in Dongyuan Subdistrict, Daowai District, while the lowest value (0.1650) was recorded in Pingxin Subdistrict, Pingfang District.
3.2. Sensitivities
Highly sensitive subdistricts in the study area are primarily concentrated in the city center, particularly within Daoli and Daowai Districts (
Figure 4b). These areas are characterized as old urban neighborhoods with aging, long-term resident populations. Elderly individuals and children are physiologically more vulnerable to low temperatures compared to younger age groups, and these subdistricts also contain a high density of kindergartens, elementary schools, and nursing homes, which further contributes to their elevated sensitivity.
Sensitivity values were classified into seven categories using the natural breaks method, namely very high (0.7158–0.9260), high (0.5425–0.7157), moderately high (0.4344–0.5424), medium (0.3356–0.4343), moderately low (0.2389–0.3355), low (0.1266–0.2388), and very low (0.0115–0.1265). The proportions of subdistricts in each category were 7.69%, 15.38%, 18.68%, 15.38%, 14.29%, 13.19%, and 15.38%, respectively. The highest sensitivity value (0.9260) was recorded in Quiet Subdistrict, Daoli District, while the lowest value (0.0115) was observed in Wanbao Subdistrict, Songbei District.
3.3. Adaptive Capacity
Adaptive capacity exhibited a U-shaped spatial distribution, with subdistricts exhibiting high adaptive capacity primarily located around the historical city center (
Figure 4c). Numerous subdistricts with low adaptive capacity are found in the southern section of the city center, mainly due to the lack of rail transit coverage, which limits access to relatively warmer modes of public transportation during cold winters. In addition, these areas are characterized by limited park green space and inadequate ten-minute walkable access to healthcare facilities, which further reduces their adaptive capacity. Furthermore, subdistricts with low and very low adaptive capacity are predominantly located in peripheral areas, where infrastructure and public services remain underdeveloped.
Adaptive capacity values were classified into seven categories using the natural breaks method, namely very high (0.6624–0.8900), high (0.5931–0.6623), moderately high (0.5396–0.5930), medium (0.4833–0.5395), moderately low (0.3909–0.4832), low (0.2318–0.3908), and very low (0.0937–0.2317). The proportions of subdistricts in each adaptive capacity category were 9.89%, 10.99%, 19.78%, 13.19%, 20.88%, 14.29%, and 10.99%, respectively. The highest adaptive capacity value (0.8900) was recorded in Gongnong Subdistrict, Daoli District, while the lowest value (0.0937) was observed in Cement Road Subdistrict, Daowai District.
3.4. Vulnerability and Dominant Drivers of Fragility
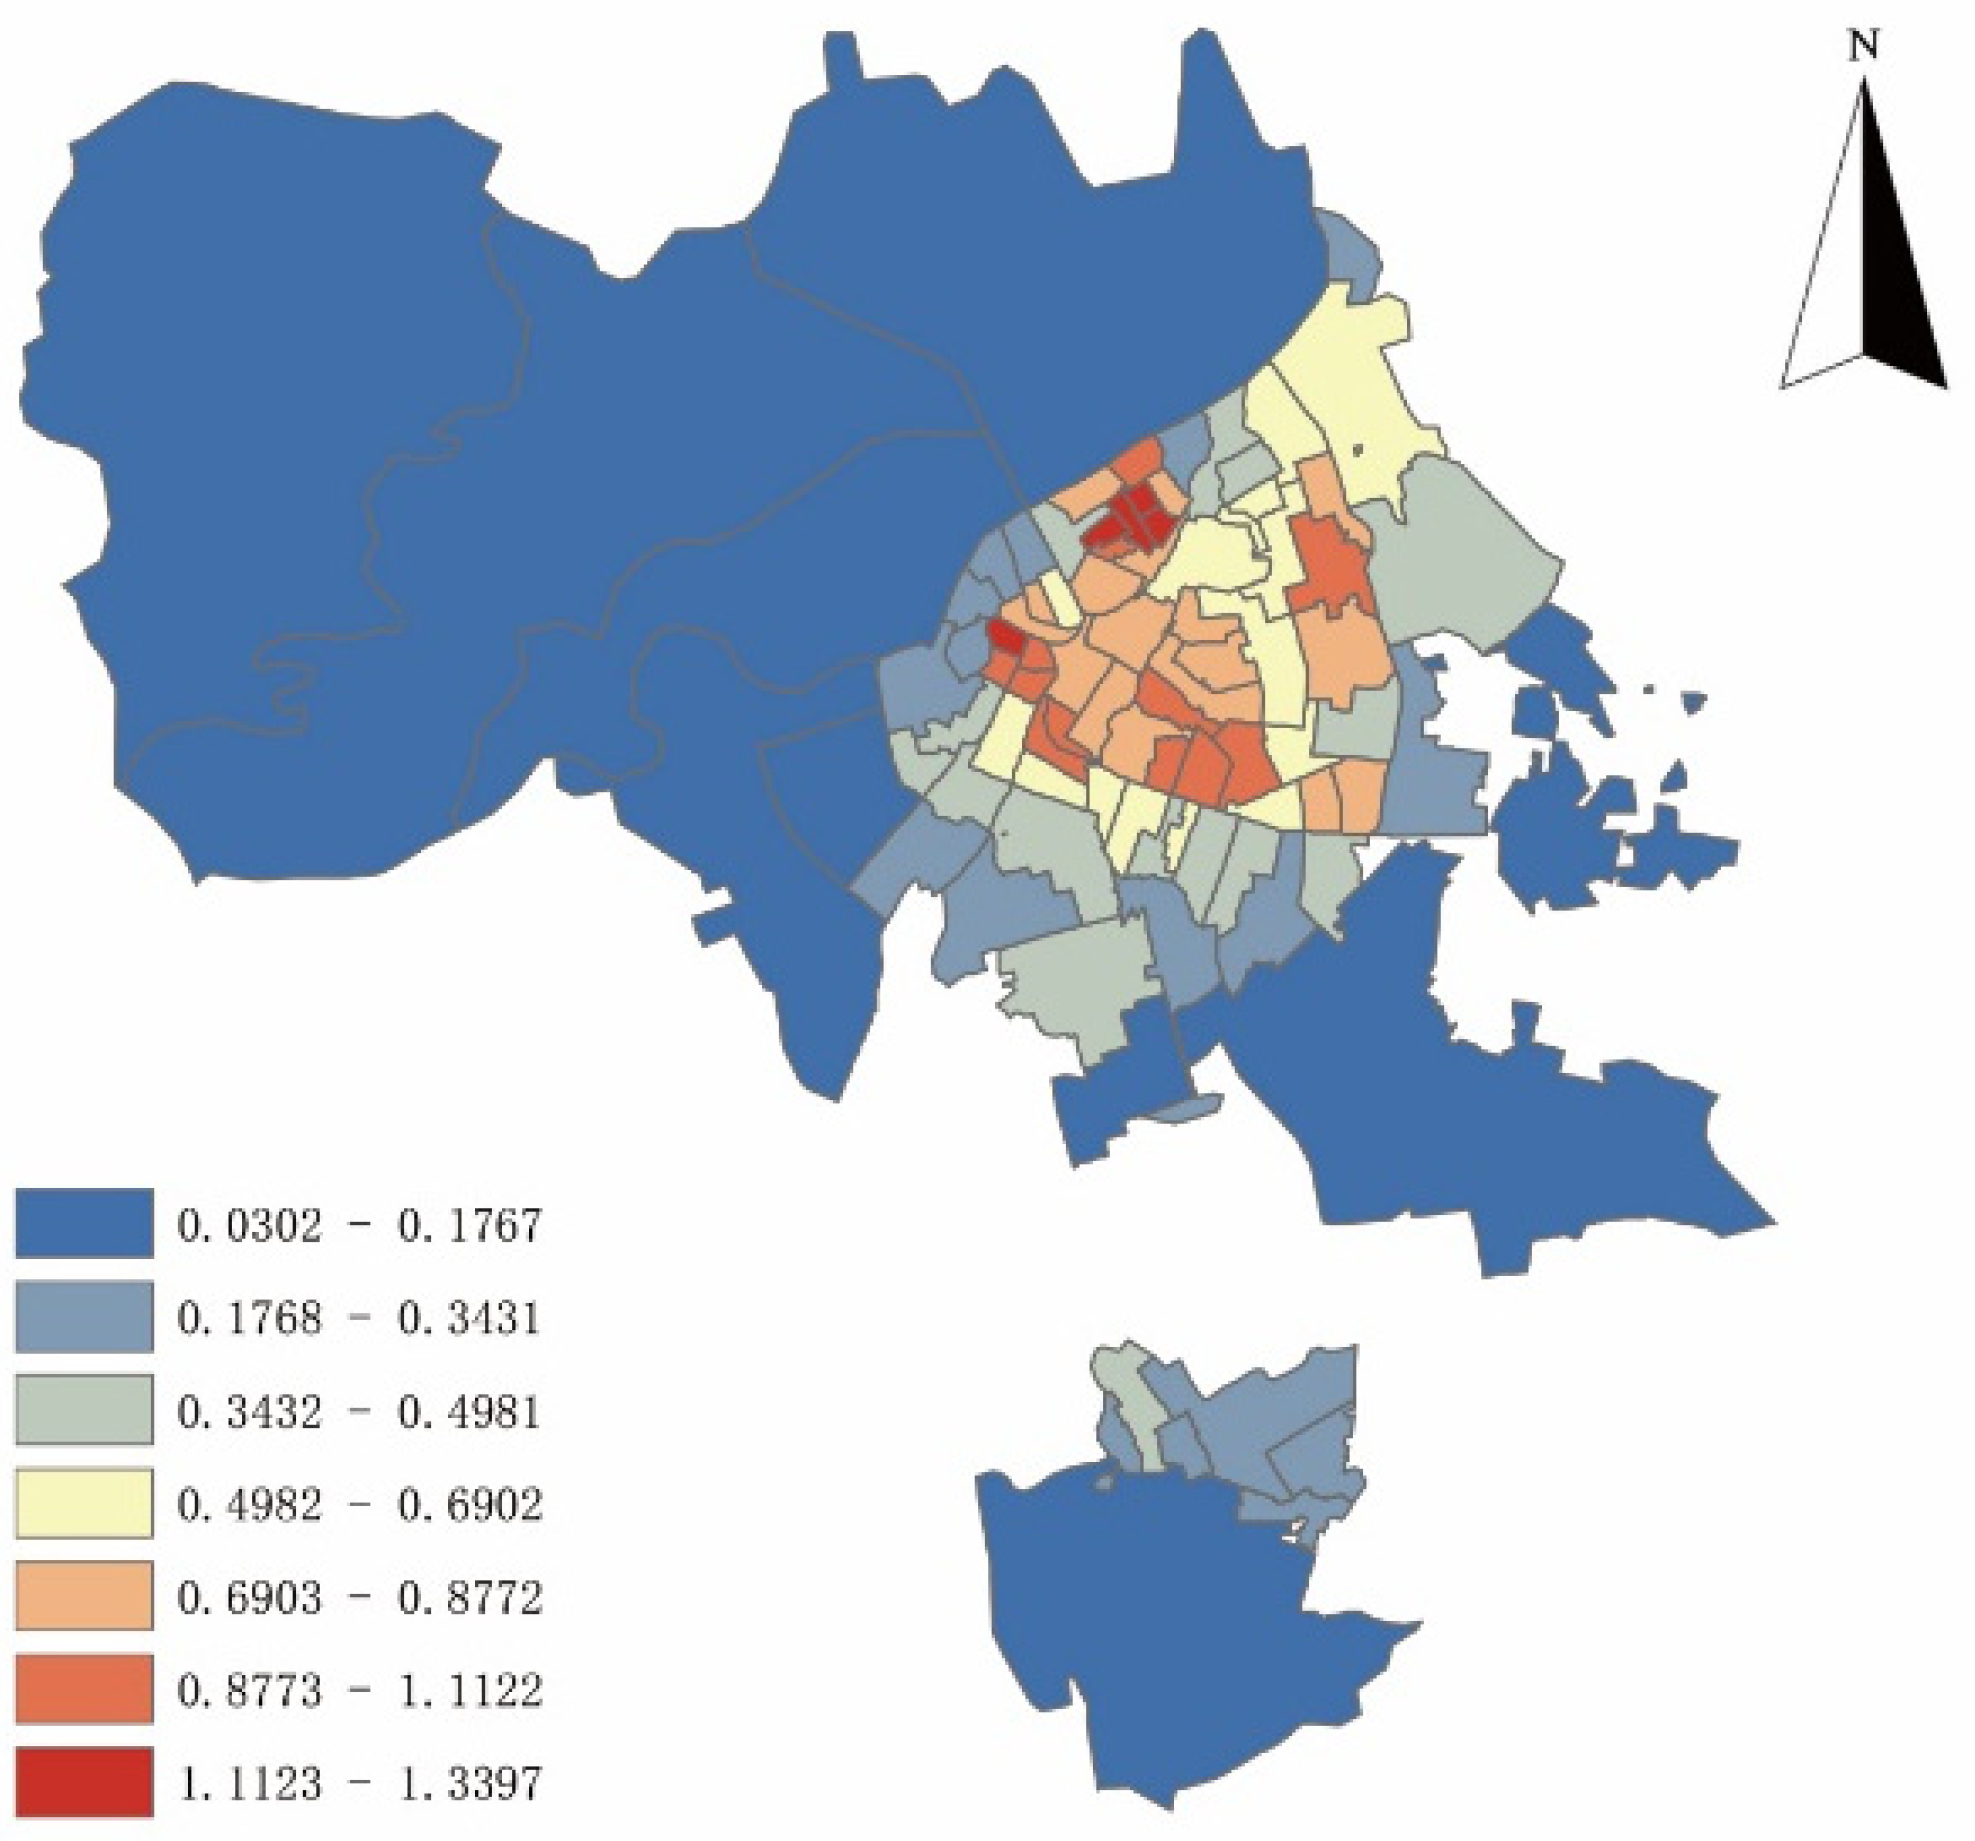
The combined effects of the three components—Exposure, Sensitivity, and Adaptive Capacity—constitute the overall low-temperature vulnerability pattern in Harbin’s main urban area, which exhibits a spatial pattern characterized by high values in the central districts and lower values toward the periphery (
Figure 5).
Subdistricts with high vulnerability are predominantly concentrated in the city center, with vulnerability levels decreasing progressively toward the periphery. Based on the natural breaks method, vulnerability values were divided into seven categories, namely very high (1.1123–1.3397), high (0.8773–1.1122), moderately high (0.6903–0.8772), medium (0.4982–0.6902), moderately low (0.3432–0.4981), low (0.1768–0.3431), and very low (0.0302–0.1767). The proportions of subdistricts in each vulnerability category were 5.49%, 13.19%, 18.68%, 16.48%, 16.48%, 18.68%, and 10.99%, respectively.
The ranking of subdistrict-level vulnerability across districts is presented in
Table 3. Overall, the highest vulnerability value (1.3397) was recorded in Taigu Subdistrict, Daowai District, while the lowest value (0.0302) was observed in Wanbao Subdistrict, Songbei District.
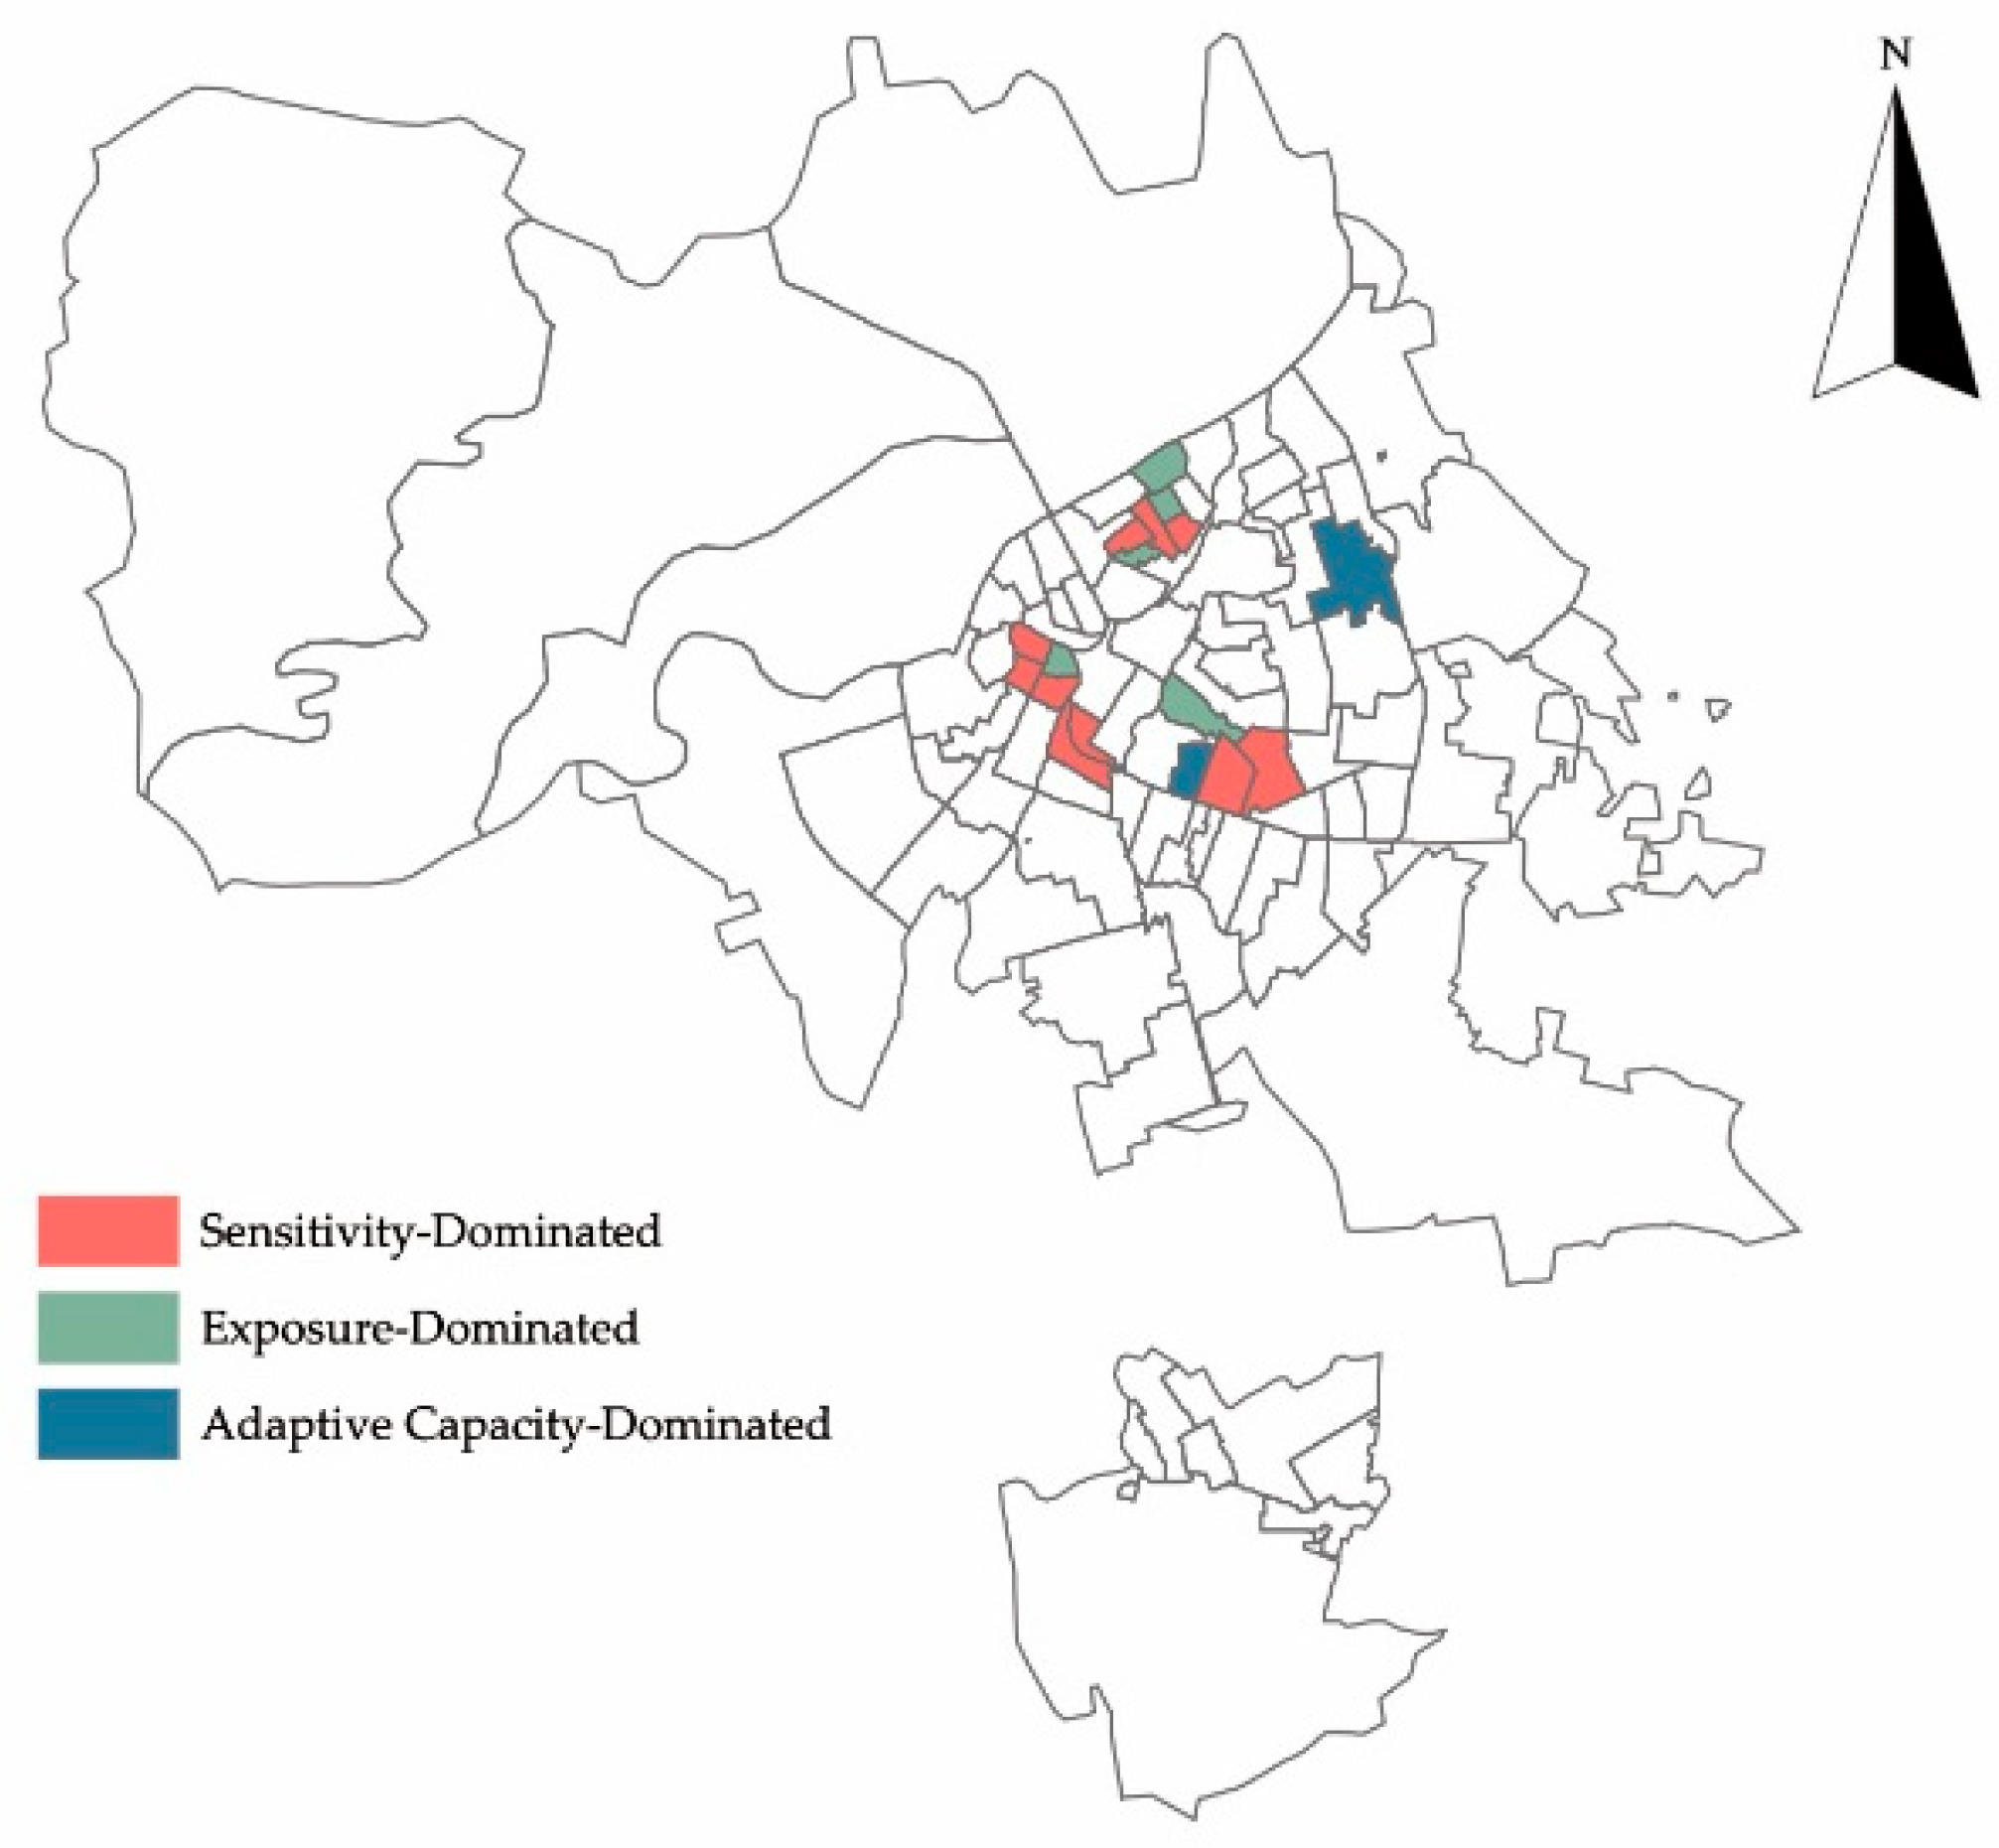
After identifying the spatial distribution characteristics of vulnerability in the urban center, this study further investigates the contributing factors of vulnerability at the subdistrict level to support targeted, subdistrict-scale climate-resilient urban planning. Subdistricts with very high and high vulnerability were classified based on whether they exhibited high sensitivity, high exposure, or low adaptive capacity (
Figure 6).
The results indicate that highly sensitive subdistricts constitute the largest proportion of vulnerable subdistricts, accounting for 58.82%, followed by highly exposed subdistricts at 29.41%, while subdistricts with low adaptive capacity accounted for the lowest proportion, at only 11.76% (see
Table 4 for details).
4. Discussion
4.1. Analysis of the Spatial Causes of Each Type of Vulnerability
- 1.
High-Exposure Subdistricts:
Among the indicators influencing subdistrict-level exposure, air temperature is largely beyond human control, whereas building density and vegetation cover are more influential and manageable. Urban parks and community spaces typically exhibit higher vegetation coverage, contributing to reduced exposure (
Table 5).
Urban green space mitigates the risks associated with low temperatures through both subjective thermal perception and objective environmental regulation. Subjectively, studies have shown that greening levels significantly influence thermal perception and psychological comfort [
34]. Insufficient vegetation coverage can reduce residents’ perceived thermal comfort in cold environments. Objectively, public green spaces play an important role in regulating the urban microclimate during winter. For example, vegetation in parks can regulate temperature through transpiration and longwave radiation exchange, helping to moderate temperature differences between ground surfaces and ambient air. Additionally, tree canopies act as windbreaks and provide partial insulation, thereby reducing ground-level heat loss.
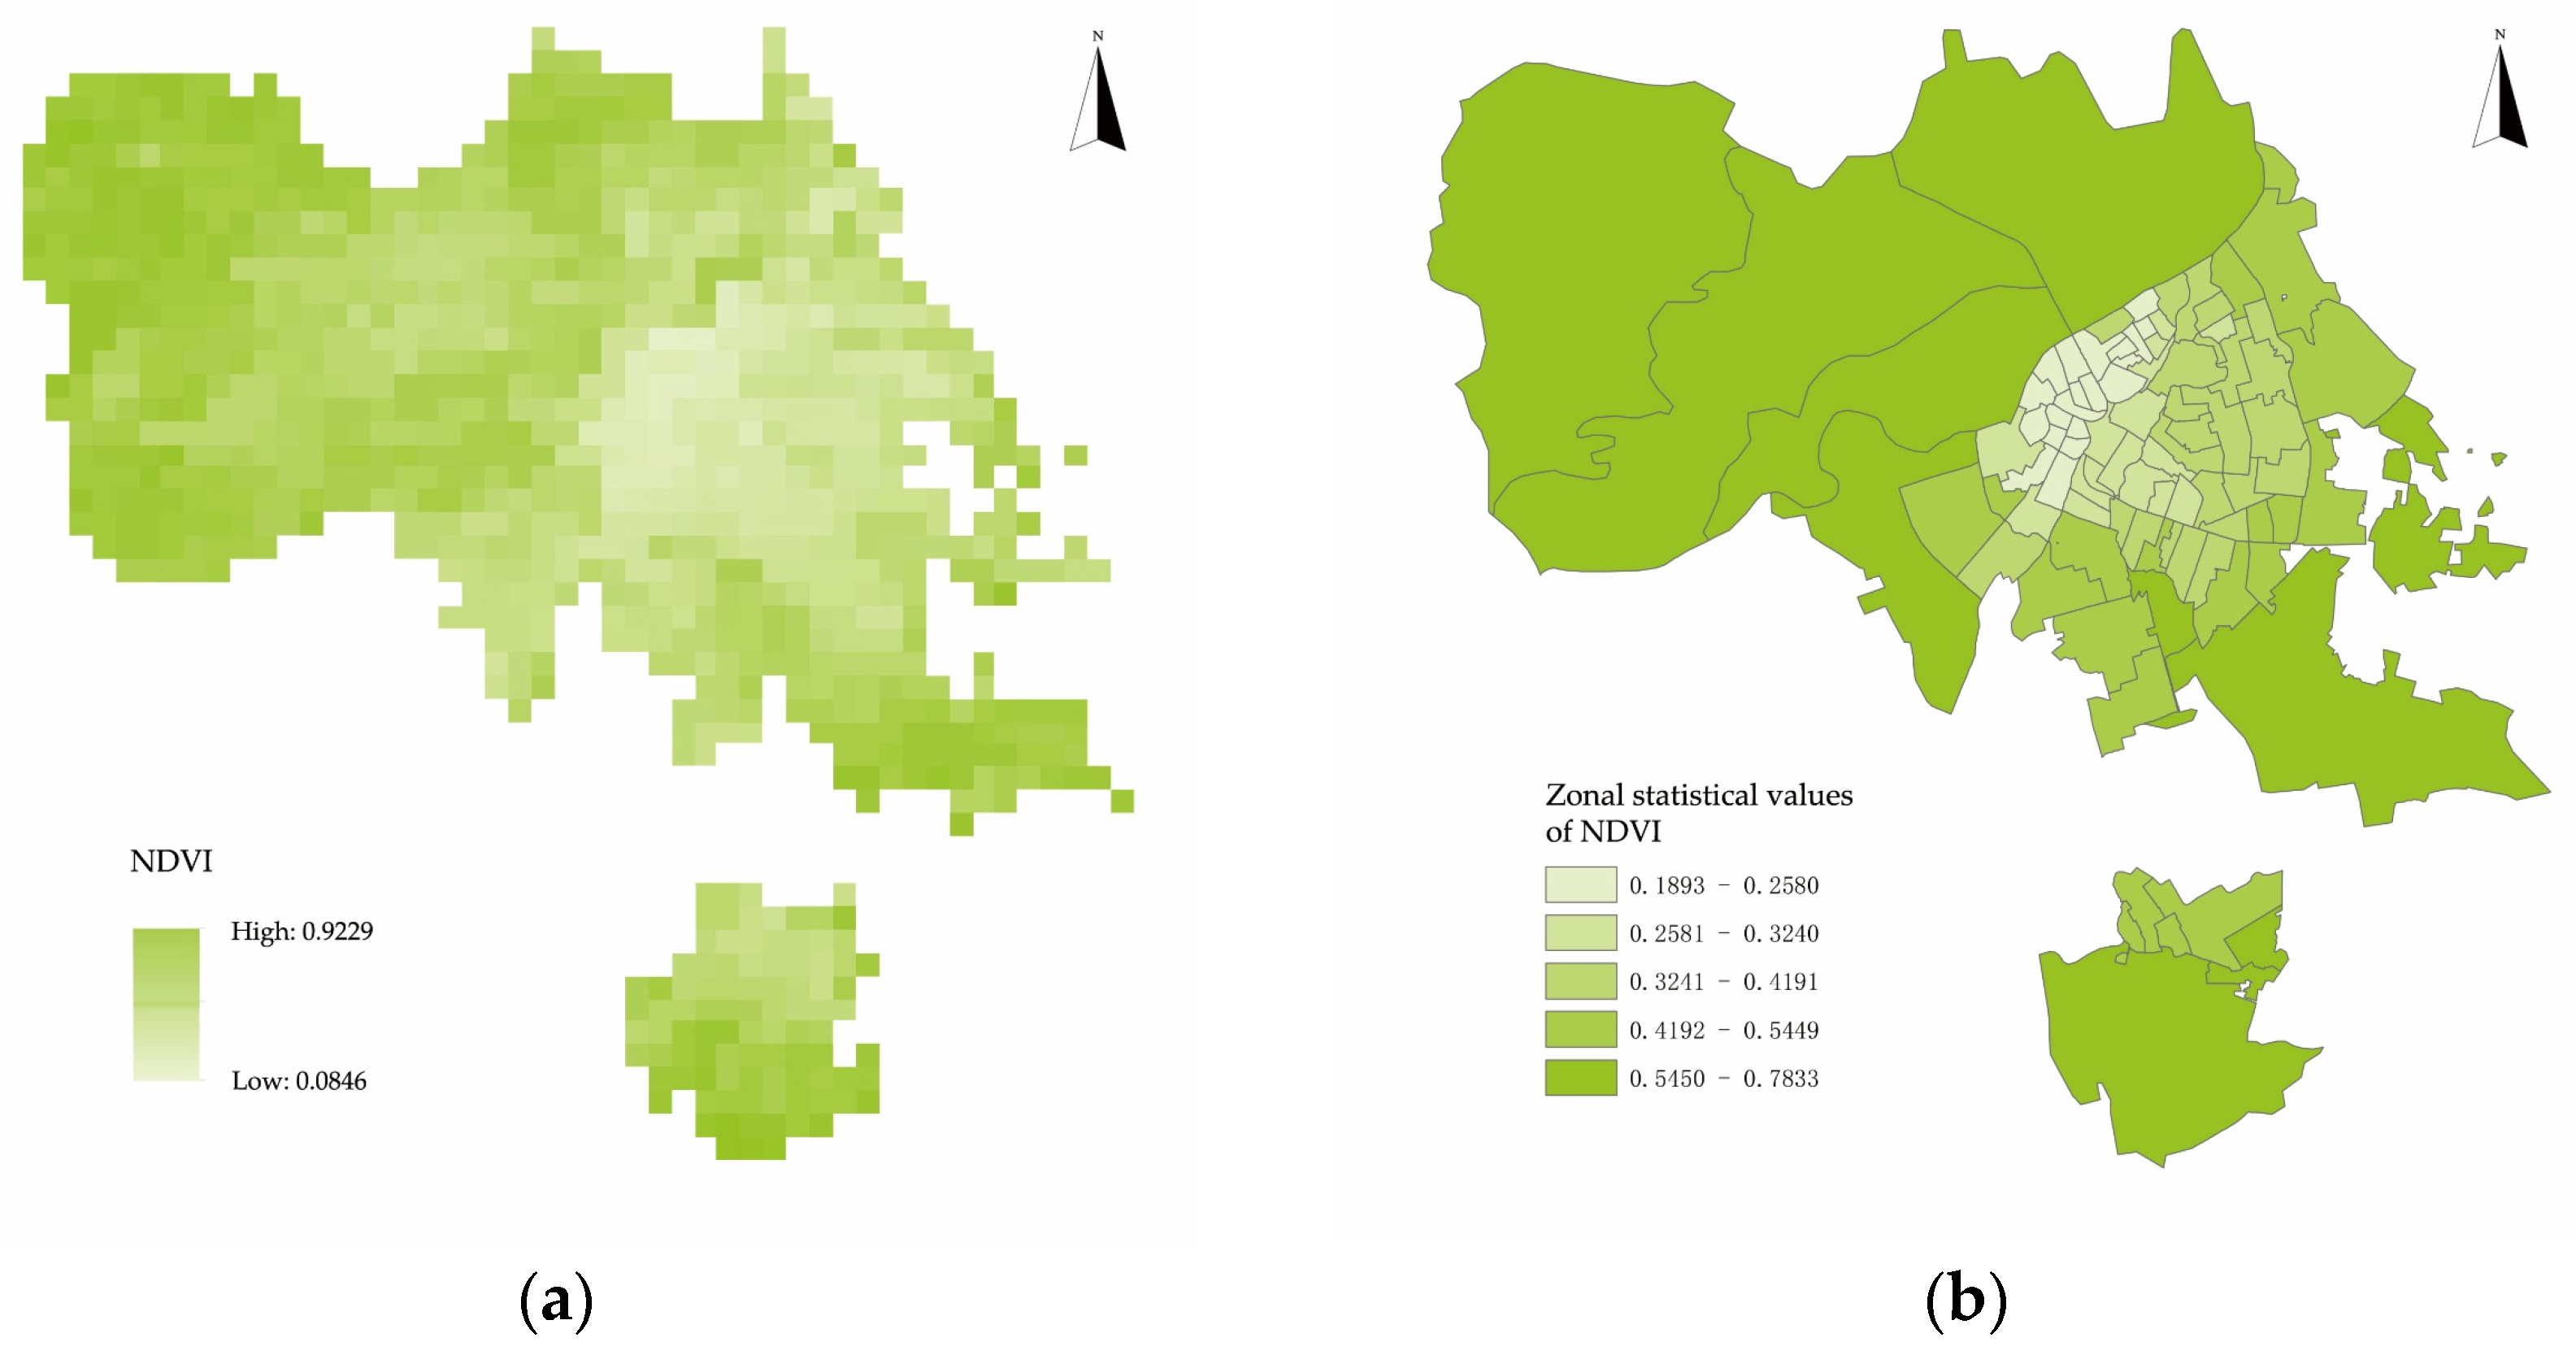
Vegetation cover is generally low on high-exposure subdistricts (see
Figure 7).
Several factors contribute to this condition: (1) Large areas of underutilized bare land are often found at subdistrict corners, limiting effective microclimate regulation. (2) Green spaces are frequently encroached upon by informal uses such as private car parking, the accumulation of miscellaneous items, and even temporary garbage storage—further reducing vegetation coverage within already limited urban space.
- 2.
High-sensitivity subdistricts:
Among the three indicators influencing subdistrict-level sensitivity, the most significant factor is the density of facilities frequented by elderly individuals and children, indicating that areas with higher concentrations of vulnerable populations tend to exhibit greater sensitivity (
Table 6).
These subdistricts are located in the old city of Harbin, where numerous kindergartens, elementary schools, senior citizen apartments, and elderly activity centers are concentrated, attracting large numbers of elderly individuals and children. As vulnerable groups, the elderly and children are particularly sensitive to cold temperatures and more susceptible to thermal fluctuations.
Studies have shown that appropriate and regular physical activity during winter contributes positively to both physical and mental health [
35]. However, outdoor public spaces tend to be underutilized during winter, with less than 30% of elderly individuals and children venturing outdoors [
36], which limits their ability to build resilience against low temperatures. This, in turn, exacerbates vulnerability in areas already classified as highly sensitive. Ultimately, the environmental design of public spaces in these subdistricts lacks the accessibility and attractiveness needed to encourage use by both elderly and young populations.
In addition, due to factors such as age and educational background, elderly individuals and children tend to exhibit lower awareness and acceptance of emerging technologies [
37]. Meanwhile, infrastructure availability plays a key role in shaping an area’s sensitivity to low-temperature hazards. As a result, infrastructure-related technologies often face greater barriers to adoption in these areas, which undermines the timeliness and effectiveness of responses to urban low-temperature hazards.
- 3.
Low-adaptive-capacity subdistricts:
The results indicate that the most influential indicators of subdistrict-level adaptive capacity are metro (rail transit) coverage and access to healthcare facilities (
Table 7).
Unlike buses, metro systems operate in underground spaces, which reduces exposure to cold air and enhances thermal comfort during transit. Enclosed metro stations protect waiting passengers from cold winds and can serve as temporary shelters for outdoor workers, sometimes offering access to cold-weather supplies. As a result, subdistricts served by metro lines tend to exhibit higher levels of adaptive capacity.
The accessibility of healthcare facilities also plays a critical role in shaping subdistrict-level adaptive capacity. Timely access to medical services is essential when cold weather events pose risks to public health. Subdistricts with limited healthcare coverage may fail to support the well-being of local residents and workers, thereby reducing their resilience to cold-related hazards.
4.2. Coping Strategies for Different Types of Vulnerability Zones
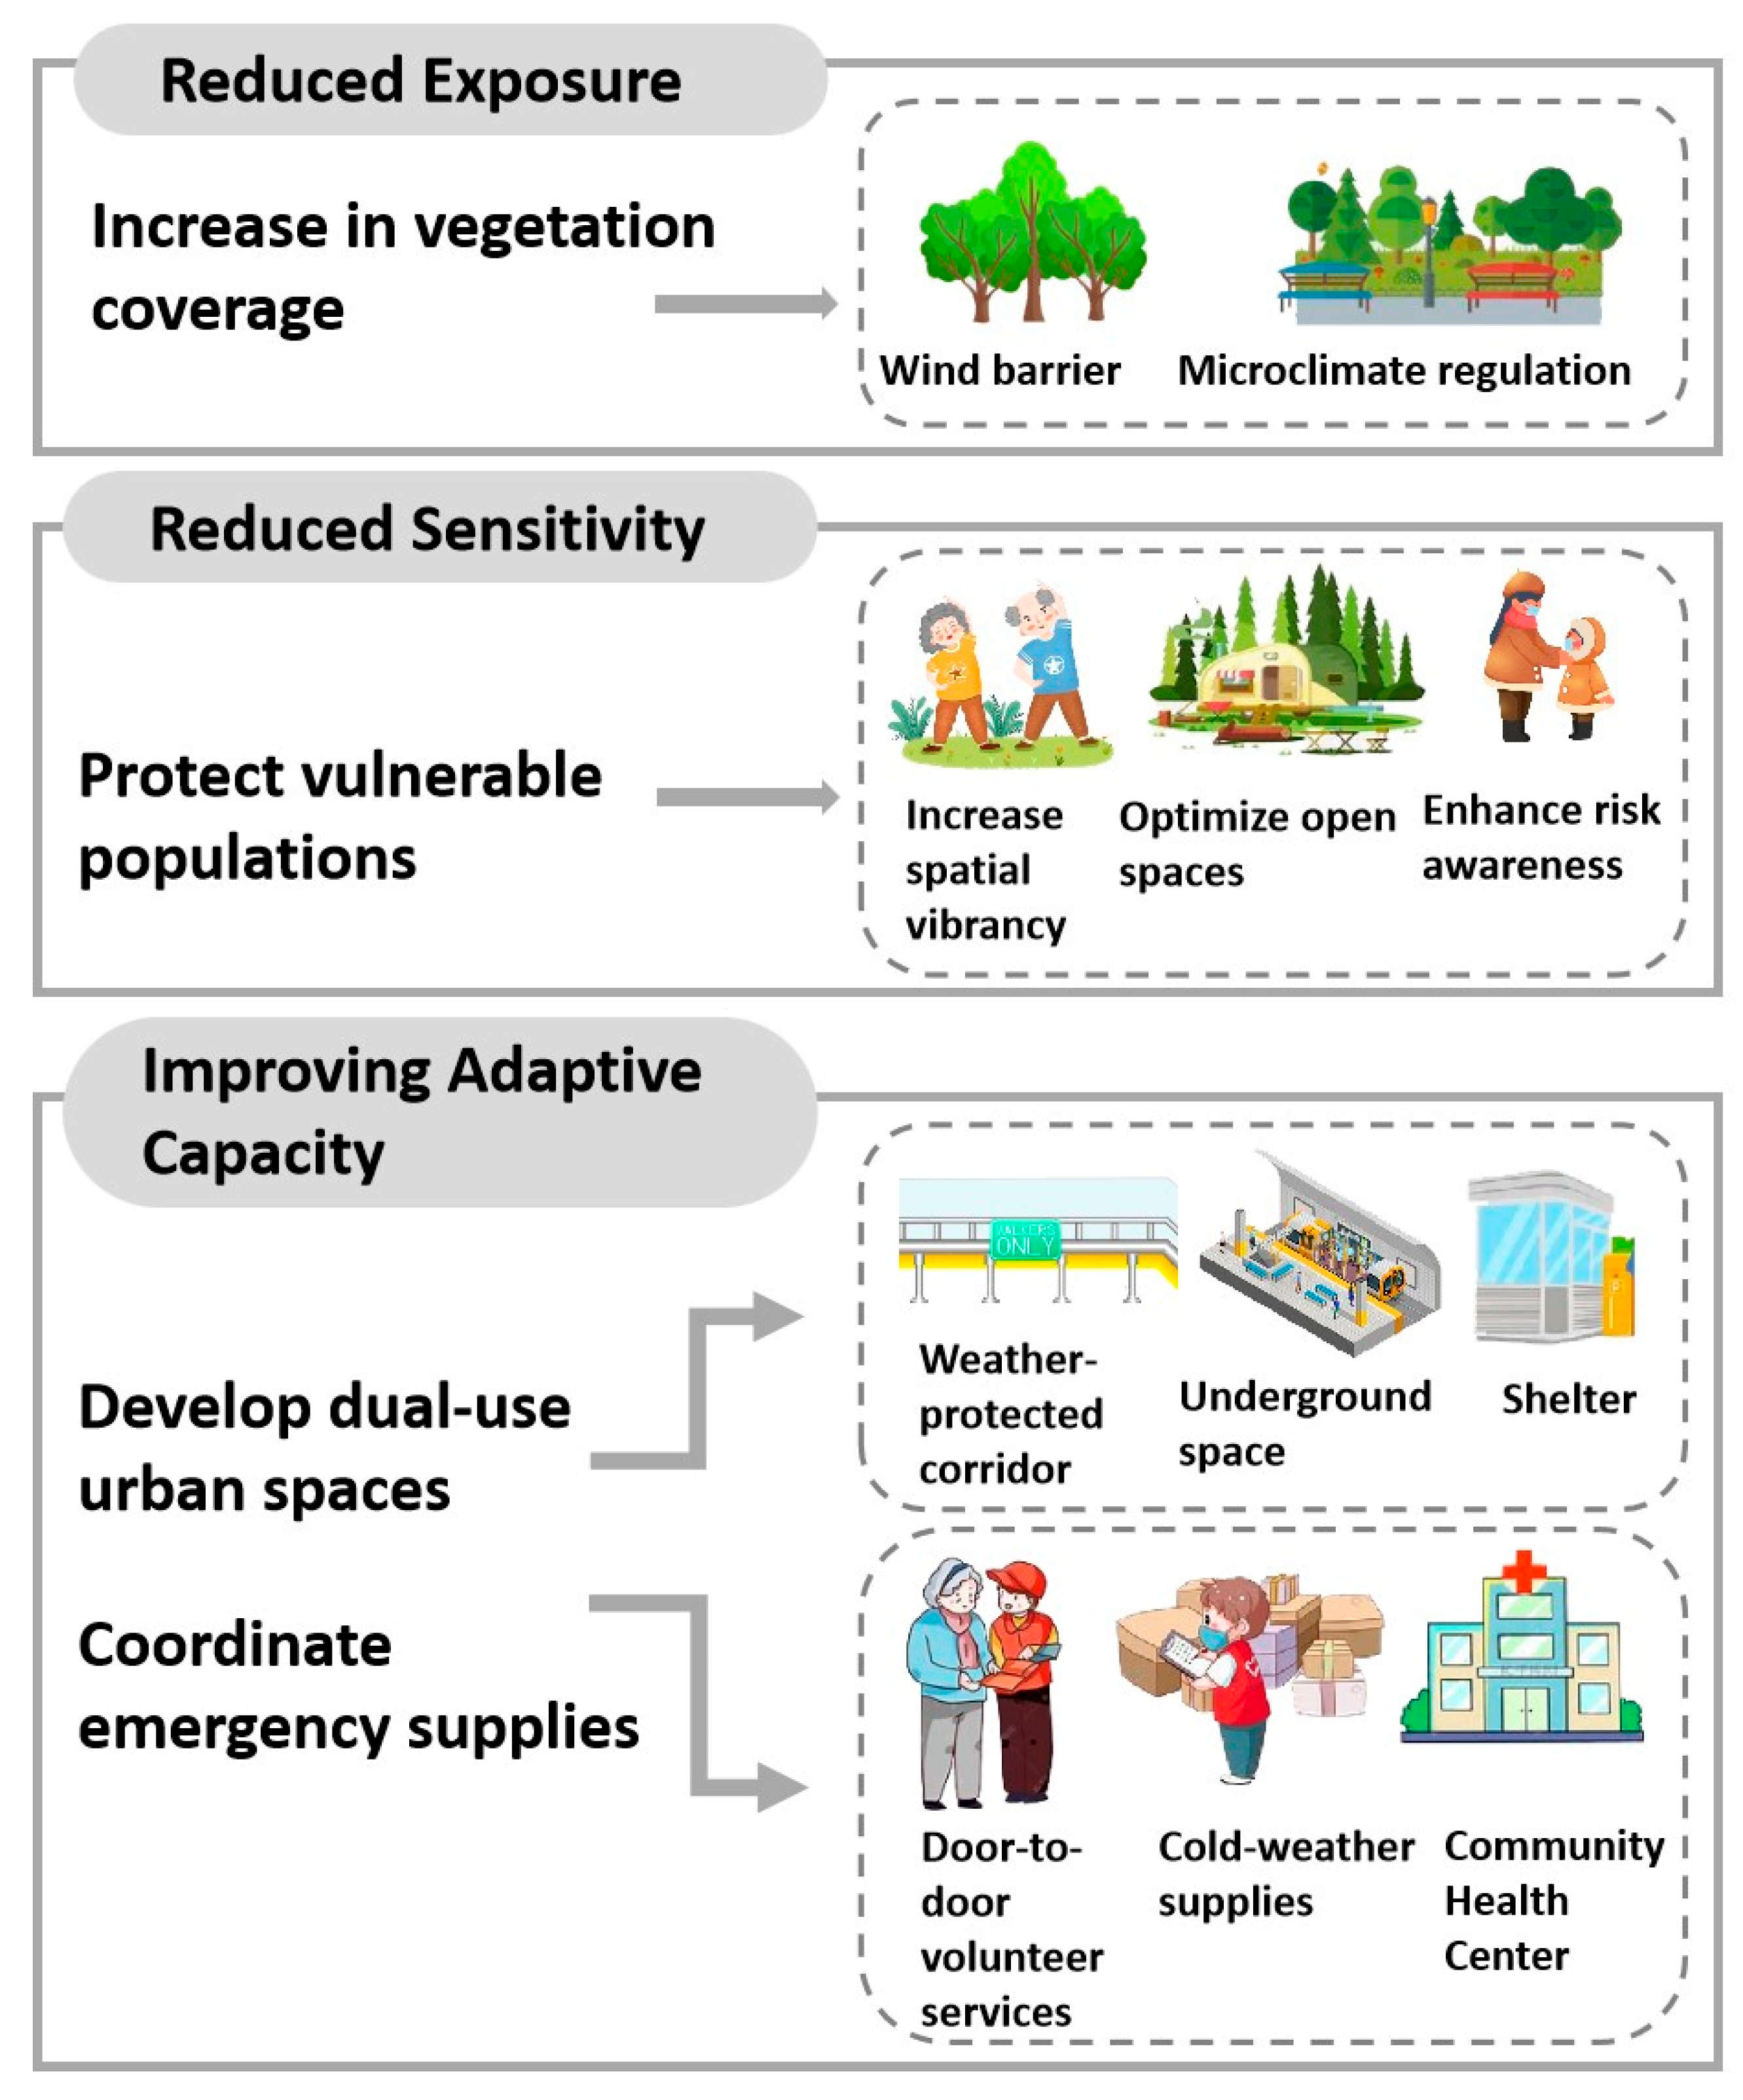
In formulating response strategies, subdistricts classified as having very high and high vulnerability should be prioritized. Coping strategies should be tailored to the dominant vulnerability factors identified for each subdistrict, in order to enhance climate resilience in a targeted and effective manner (see
Figure 8 for a classification-based strategy framework).
For highly exposed subdistricts, increasing vegetation coverage is an effective way to reduce exposure to cold conditions. Previous studies have demonstrated that “green walls” composed of trees and shrubs can effectively reduce wind intensity during winter, while well-designed green space systems can enhance ground-level thermal insulation in cold seasons [
38,
39]. Subdistrict-level green belts should be established using a combination of trees and shrubs to form a natural “green wind wall,” which can reduce wind penetration and buffer cold air during winter. Vacant subdistrict corners should be utilized to create pocket parks and small-scale green spaces with appropriate layout and form, in order to enhance their role in regulating the subdistrict-level microclimate. Rooftop spaces should also be fully utilized, with residents encouraged to participate in courtyard and rooftop greening to establish a layered “green barrier” for improved microclimate regulation.
For highly sensitive subdistricts, the primary objective is to protect vulnerable populations, particularly the elderly and children. Protection can be achieved both through external support to improve cold resistance, and through promoting physical health to reduce individual sensitivity [
40,
41,
42]. Outdoor spaces frequently used by elderly individuals and children should be optimized with design interventions such as covered areas, low walls, and semi-enclosed seating to offer temporary shelter and protect against sudden cold air intrusions. In addition, the vitality of public gathering spaces should be enhanced through urban planning and seasonal programs that encourage winter-appropriate physical activity among older adults and children. Moreover, awareness campaigns should be implemented to educate vulnerable groups about the risks associated with cold waves. These campaigns should be delivered via both online and offline platforms, including bulletin boards, community meetings, public WeChat accounts, and easy-to-understand informational brochures explaining the causes, hazards, and coping strategies related to extreme low temperatures.
For subdistricts with low adaptive capacity, it is essential to enhance resilience both through preventative measures against cold exposure and through timely emergency responses during extreme low-temperature events. First, physical space should be optimized to support emergency needs. Multi-functional spaces that can serve both daily and emergency uses—such as level public squares and communal open spaces—should be reserved and equipped for winter conversion. Shared indoor warming centers can be established within service facilities such as community centers and senior activity venues, providing warm, safe, and accessible shelters during cold spells. The connectivity of public buildings should be enhanced through enclosed corridors and subdistrict bridges, which not only reduce pedestrian exposure to cold weather but also act as wind and snow buffers. Second, underground infrastructure should be fully utilized. Subway station halls, underground passages, and subterranean commercial areas can serve as emergency shelters for commuters during severe cold. In areas not covered by metro lines, simple aboveground structures—such as windbreak shelters or heated waiting kiosks—should be placed at regular intervals along public transit routes to provide rest stops and protection for pedestrians and transit users. Third, a comprehensive cold-weather emergency response system should be established. Subdistrict-level administrative offices should coordinate the issuance of weather alerts, the designation of emergency shelters, and the distribution of cold-resistant supplies. Adequate material reserves and logistical planning should be in place to meet residents’ basic needs during extreme weather events. Finally, social engagement and community resilience must be strengthened. Public welfare organizations and volunteers should be mobilized to form neighborhood mutual aid groups capable of delivering in-home care, material assistance, and emergency support during low-temperature disasters.
4.3. Reflections on ESA-Based Analysis in Cold Regions
The results indicate that the low-temperature risk assessment successfully fulfilled the study objectives by identifying high-vulnerability areas within the central city of Harbin and analyzing the spatial distribution of three distinct vulnerability types: high-exposure subdistricts are primarily located in areas with limited vegetation cover; high-sensitivity subdistricts in neighborhoods with concentrations of elderly residents and children; and low-adaptive-capacity subdistricts in zones lacking adequate infrastructure and public services. These findings suggest that urban green space systems, infrastructure networks, and building configurations significantly influence a neighborhood’s capacity to cope with cold-weather hazards. Harbin, as an established industrial city in China, underwent a period of rapid expansion that prioritized development speed over the quality of urban growth. In the current context of stock-based urban development, significant disparities have emerged among neighborhoods in their capacity to withstand low-temperature climate risks, primarily due to uneven resource allocation and deficiencies in ecological design. The assessment of cold-vulnerable areas highlights the need for differentiated spatial retrofitting policies. To promote climate-responsive urban development, targeted planning strategies should be proposed, particularly for densely populated older urban districts and areas with inadequate public service provision.
This study introduced evaluation indicators tailored to low-temperature conditions and established a comprehensive assessment framework. Compared with existing urban thermal risk assessment systems, the selected indicators in this study are similar, but their assigned weights differ. For example, in the thermal vulnerability assessment framework for Chengdu’s urban core developed by Gu Weiqi et al. [
43], the two indicators with the highest weights under the adaptive capacity dimension were the proportion of subway stations and the proportion of parks and green spaces accessible within a 10 min walking distance. By contrast, in this study, the indicators with higher weights are rail transit coverage and the 10 min accessibility of healthcare facilities, while the weight of park and green space accessibility is comparatively lower. This distinction arises because parks function effectively as cooling spaces during periods of high temperature, whereas in cold conditions, they offer only limited wind protection and cannot serve as long-term thermal shelters like enclosed or semi-enclosed spaces. In contrast, proximity to healthcare facilities significantly enhances adaptive capacity during cold spells by ensuring timely medical support, particularly for vulnerable populations.
This study successfully evaluates low-temperature risk in Harbin by applying a context-specific assessment model at the subdistrict scale. In contrast to previous ESA models, which primarily address high-temperature or flood-related risks, this study extends the framework to the underexplored domain of urban low-temperature risk, thereby broadening its application scenarios and methodological pathways while addressing a critical research gap. Furthermore, this study advances low-temperature risk assessment to a finer spatial resolution, facilitating more context-sensitive strategy formulation by urban planners and policymakers. The subdistrict-level scale of analysis enables the proposal of actionable strategies, such as constructing enclosed pedestrian overpasses as temporary cold shelters and organizing community-based volunteer groups to assist vulnerable populations. These efforts represent a preliminary yet meaningful step toward bridging theory and practice, offering a practical pathway to enhance urban climate resilience and promote climate-friendly urban environments.
Naturally, this study has several limitations. First, this study employs the entropy method to assign weights to indicators. While the entropy method offers an objective and data-driven approach to indicator weighting, it also presents certain limitations. Some studies [
44] have noted that EWM may produce distorted results when indicator data exhibit limited variation or contain outliers, as the method relies solely on data dispersion to infer importance. To mitigate this limitation, we ensured a diverse set of indicators with sufficient variability and preprocessed the data using normalization and outlier detection prior to weight computation. Nonetheless, future work could consider comparing the EWM with hybrid or ensemble weighting methods to further validate the reliability of the results. Secondly, the evaluation factors selected in this study are limited and do not fully capture the diverse determinants influencing urban cold-climate risk. To ensure the accurate calculation of indicator weights, the study primarily relies on easily accessible quantitative indicators. However, qualitative indicators—such as the extent of winter snow removal and frost prevention on roads, or the development level of urban ventilation corridors—also significantly influence spatial vulnerability to low temperatures. Future research should consider incorporating a broader range of evaluation factors and exploring more diverse data sources to develop a more comprehensive and robust assessment framework. Finally, the current model focuses primarily on the static spatial characteristics of low-temperature events, without considering dynamic elements such as fluctuations in cold wave intensity and duration, or incorporating residents’ subjective experiences into the evaluation framework. Future studies should consider integrating temporal dynamics and resident participation to construct a more holistic and dynamic cognitive framework for low-temperature vulnerability.
5. Conclusions
As a primary climatic hazard in cold-region cities, low temperatures present significant challenges to residents’ livelihoods, urban infrastructure, and ecological systems. Cities function as complex systems characterized by a high degree of coupling between natural and anthropogenic factors, and enhancing their capacity to withstand climate risks requires a long-term and systematic approach. This study developed a cold-climate vulnerability assessment framework based on the ESA model and applied it at the subdistrict scale in Harbin—a representative cold-region city—to identify spatial patterns of vulnerability and inform more targeted planning interventions.
Unlike previous studies that primarily focused on high-temperature or flood-related risks, this study establishes a climate risk assessment system tailored to cold-climate conditions. By identifying highly vulnerable areas and analyzing their spatial distribution patterns, it contributes to climate resilience in cold-region cities from both theoretical and practical perspectives. Moreover, the study demonstrates that conducting spatial identification at a finer subdistrict-scale resolution can offer a more actionable and context-sensitive pathway for urban governance and the development of climate-resilient cities.
Future research on climate resilience in cold-region cities should move beyond single-event analysis and aim to develop integrated assessment and decision-making systems capable of addressing compound climate risks. In parallel, urban systems should transition from passive emergency response toward proactive forecasting and preparedness by formulating action plans encompassing pre-disaster assessment and early warning, real-time disaster response, and rapid post-disaster recovery. This approach fosters an integrated “nature–society–space” framework that facilitates coordinated action across environmental, social, and spatial dimensions. Such a resilience planning framework enhances synergy among natural, social, and spatial systems, thereby strengthening the adaptive capacity of cold-region cities.


