
Influence Graph-Based Method for Sustainable Energy Systems


Abstract
1. Introduction
1.1. Background and Motivation
1.2. State-of-the Art Literature
1.3. Contribution
- Unified Fault Chain Modeling: Different from previous studies, where the fault chain modeling is only used for the power or gas system separately, we leverage fault chain theory based on the overload mechanism of branches in the IPGS to develop unified fault chain modeling for the entire IPGS, which can further be transformed into an influence graph to characterize the interactions among failed components in the IPGS.
- Dual-Metric Edge Weighting: To characterize the interactions among failed components in the IPGS, unified fault chain modeling is further transformed into an influence graph with dual-metric edge weighting: energy not supplied (ENS) and repetitive failures, which capture the physical and operational aspects of failure propagation in the IPGS.
- Vulnerability Component Identification: With the formulated influence graph, eigenvector centrality is used as a statistical index to identify critical components that not only fail frequently but also significantly impact the ENS in the IPGS. This provides a system-wide view of vulnerability that complements and extends traditional topological and flow-based indices.
2. Fault Chain Fundamentals
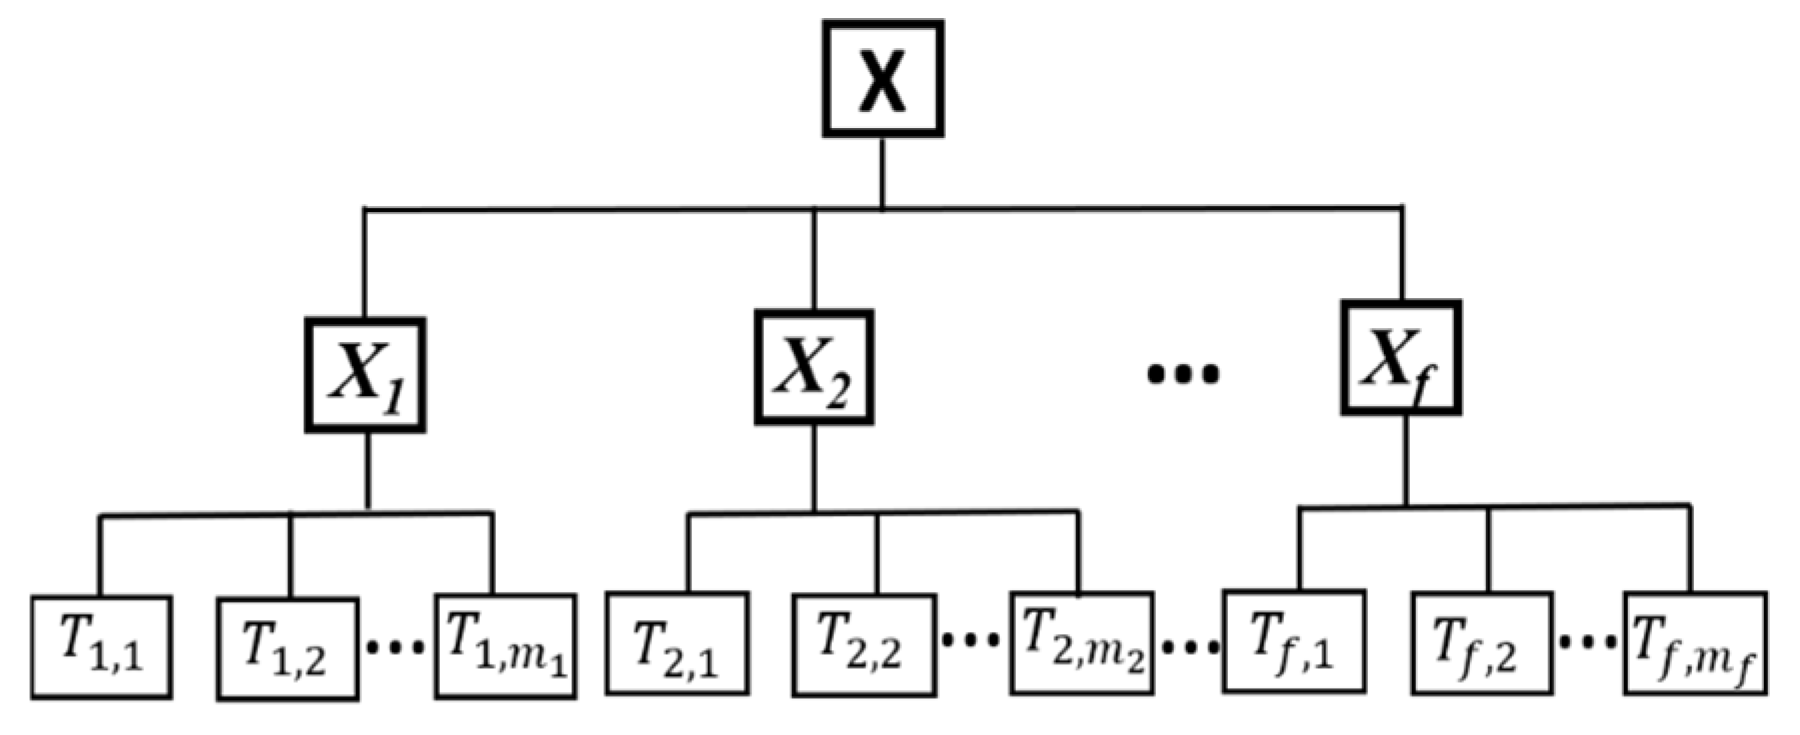
2.1. Fault Chains
2.2. Branch Selection in Fault Chains
- When the power flow/gas flow Ppq on branch A between the nodes p and q is less than the maximum operation limit of branch A, i.e., when Ppq < Pmax, then branch A is not selected as the candidate branch, and its failure probability P(A) = 0.
- When Ppq ≥ 1.3Pmax, the failure probability P(A) of branch A is P(A) = 1, and it is selected as the candidate branch showing maximum overload and certain failure.
- When Pmax ≤ Ppq < 1.3Pmax, the failure probability P(A) of branch A increases linearly, showing overloading but not definite failure. Then, the flow Ppq in branch A is compared to the flow Ppr in the next candidate branch, branch B, between node i and node k. If Ppq > Ppr, then branch A will be selected as the next faulted branch. Otherwise, branch B will be selected as the next fault branch for the event Ti,j+1.
3. Fault Chains for IPGS
3.1. IPGS Modeling
3.1.1. Power Flow Model
3.1.2. Gas Flow Model
3.1.3. Generator Ramping and Tripping
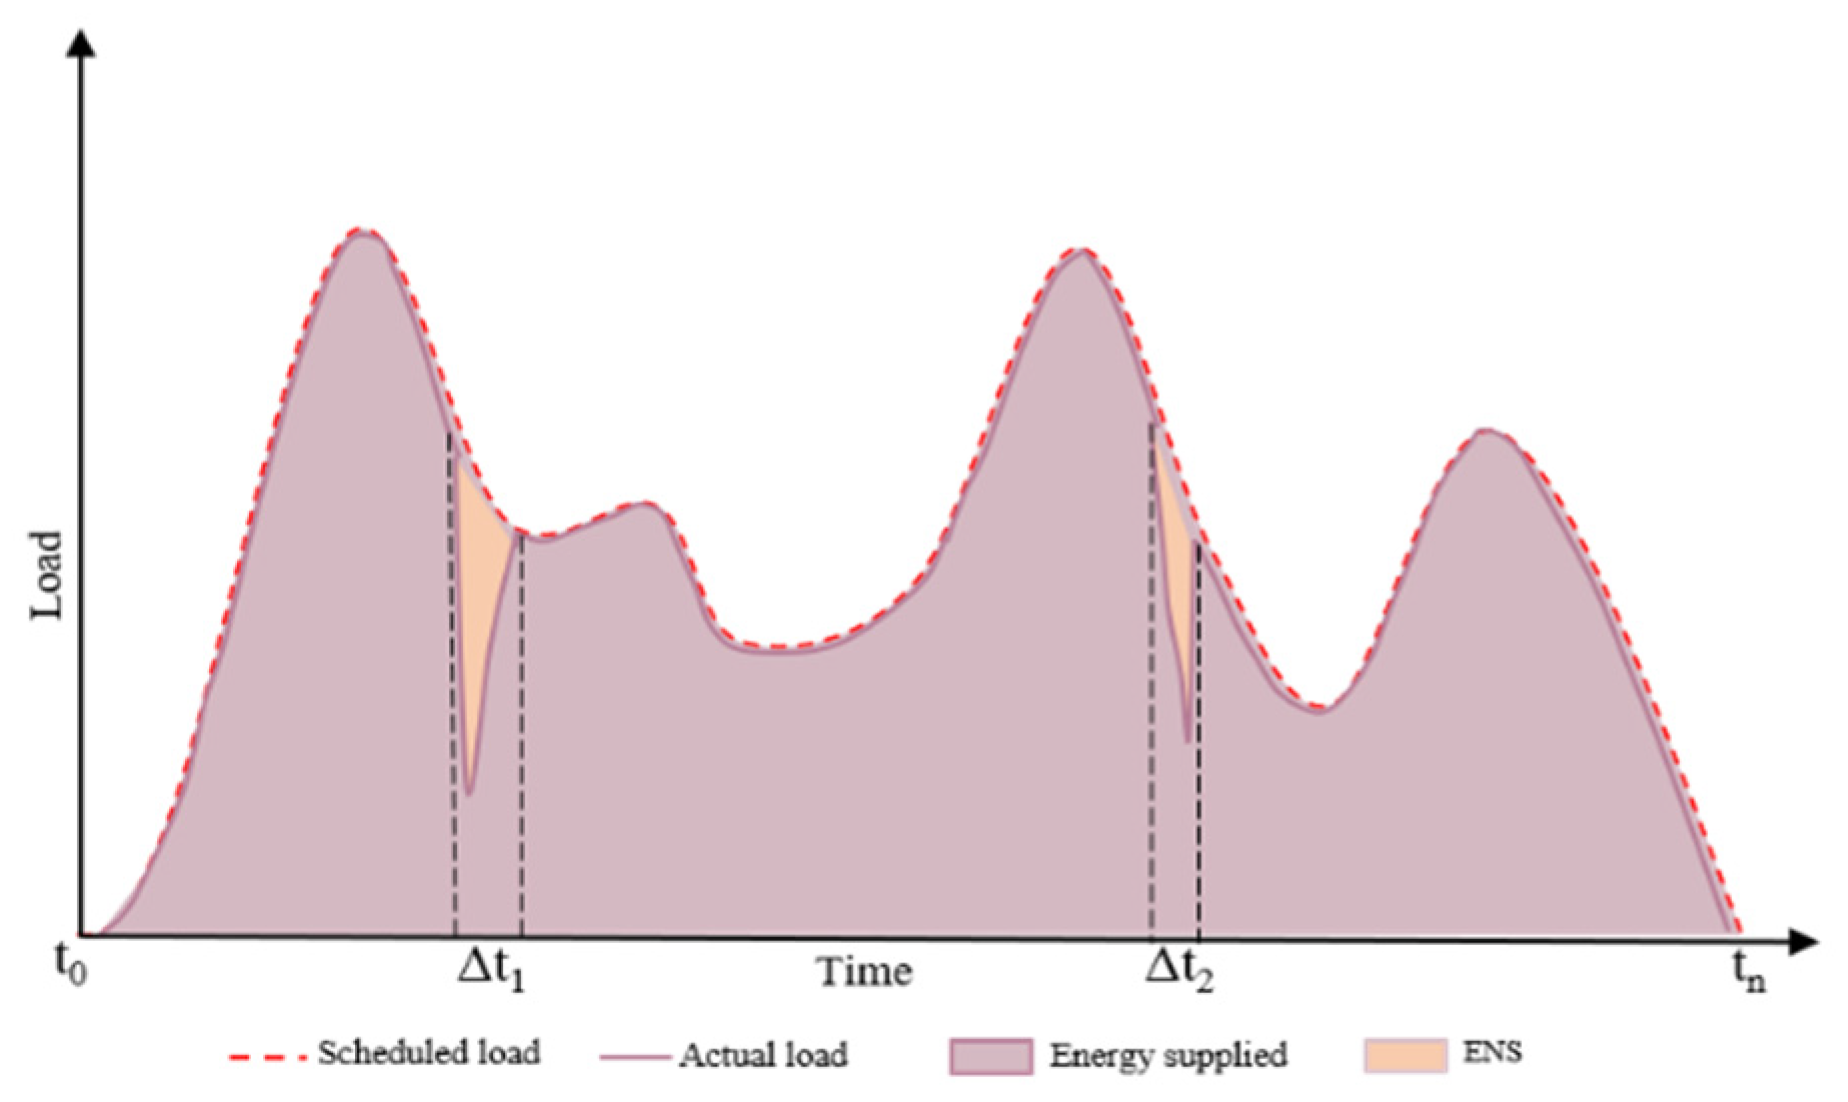
3.1.4. Energy Not Supplied (ENS)
3.2. Construction of Fault Chains Based on IPGS Modeling
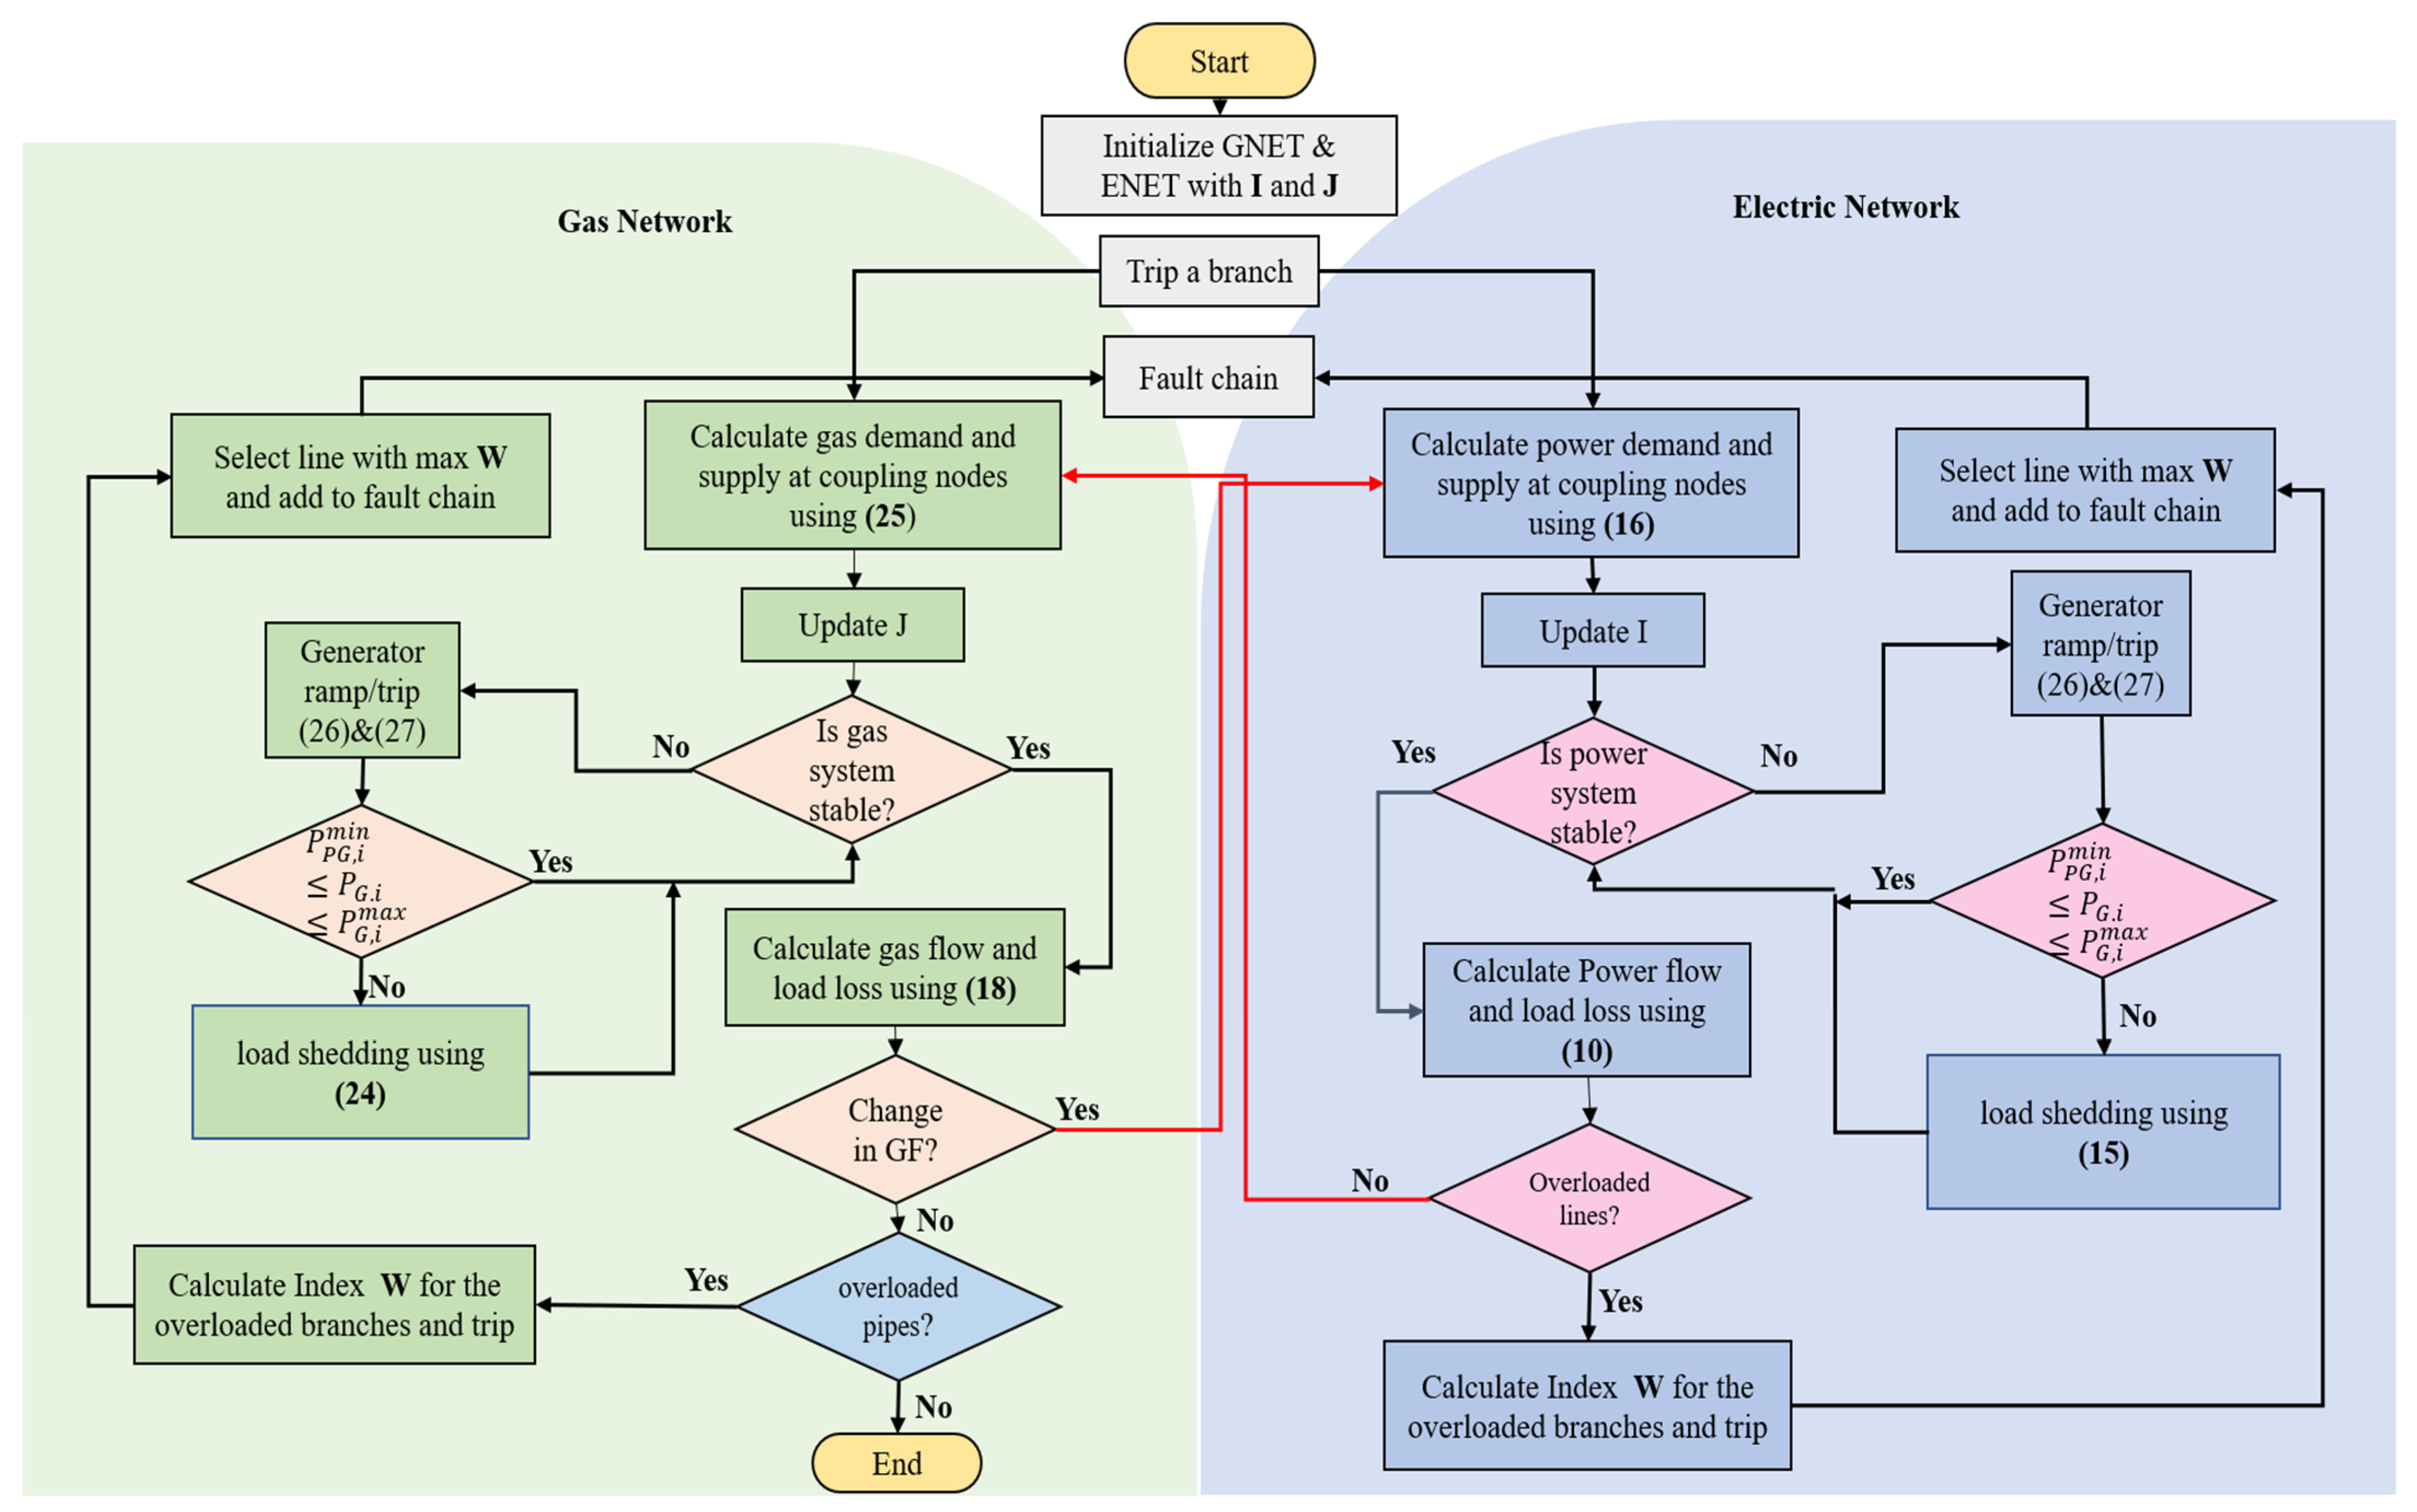
- Initialize the electric network (ENET) and gas network (GNET) with initial state matrix I and J using the terminal state parameters of a previous combined steady-state simulation.
- Select a branch and trip it to initiate the first fault event. Add it to the first fault chain of the fault chain set.
- Calculate the change in demand and supply changes on the coupling nodes using Equations (16) and (25). Update I and J. Calculate the stability of the ENET and GNET using Equations (10) and (18).
- If there is power imbalance, the generators ramp up or ramp down between the maximum and minimum limit set in Equations (26) and (27). The power balance is checked at every step until the ramping of the generators is within the set limits; otherwise, the generator trips and loads are shed in accordance with priority, using Equation (15).
- In case of power flow balance, calculate load losses using Equations (7) and (8) to identify the overloaded lines. The line with the maximum index W in Equation (6) is selected to be added as a faulted segment to the fault chain. In case no overloaded lines exist, go to Step 3. The algorithm calculates the gas supply and demand at the coupling nodes to establish a new gas balance by updating the parameters in J.
- If gas is stable, calculate gas flow using Equation (18) to identify the overloaded lines. The line with the maximum index W in Equation (6) is selected to be added as a faulted segment to the fault chain.
- If there is a gas imbalance, gas generator ramping aids to overcome the imbalance, adhering to the set limits of the generators, or else tripped and prioritized gas load shedding takes place according to Equation (24). The process goes on until gas balance is achieved.
- If the gas network is stable, the gas flow and load losses are calculated using Equations (26) and (27), and the change in gas flow on the coupling nodes is determined. If the gas flow is not the same as calculated in Step 4, repeat Step 3 to analyze a new cascading failure in the power system. Otherwise, go to Step 9.
- In case of no change in the gas flow, check the gas flow limit in each pipeline; the overloaded pipelines are tripped, and the pipelines with the maximum index W are added to the fault chain.
- Calculate load shedding throughout the process using Equation (30). If total load shedding of the IPGS is greater than the set threshold, end the algorithm; otherwise, go to Step 3.
4. Influence Graph Construction Based on Fault Chains in IPGS
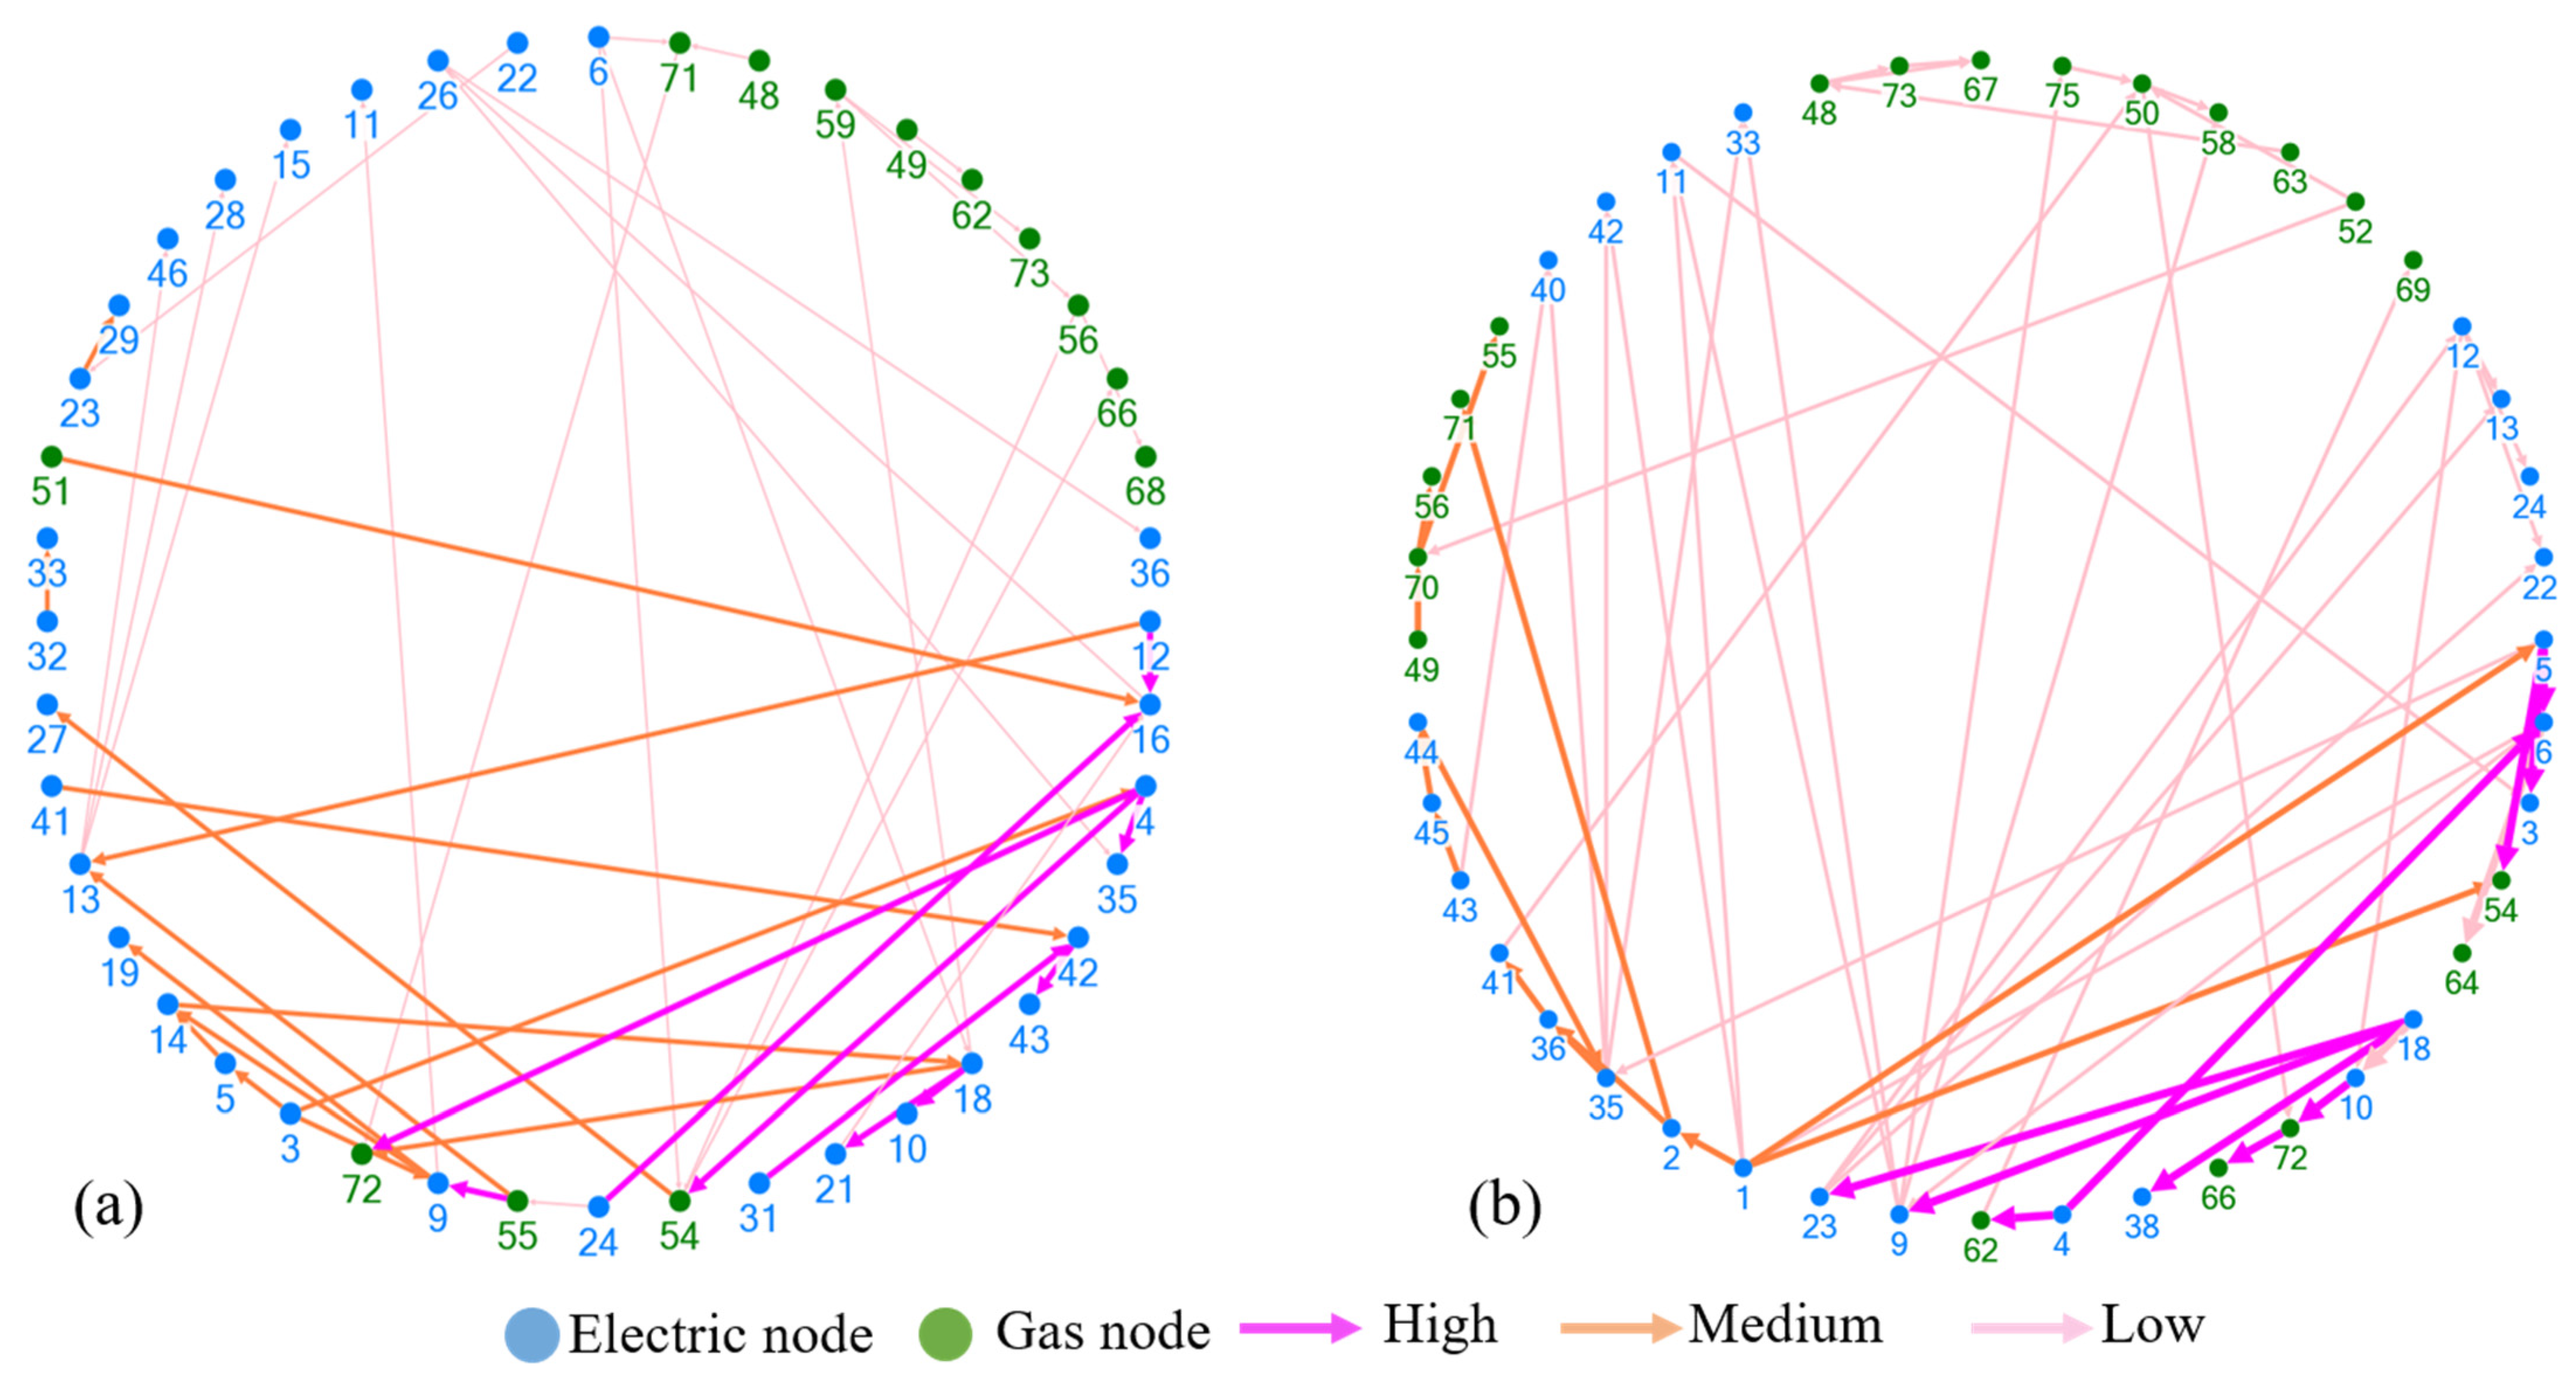
- Edge weight based on ENS: The first vulnerability network metric based on ENS is proposed to measure the impact of cascading failures by quantifying the amount of load that is lost due to system disruptions and how much energy is not supplied due to the failure of components during a cascading failure. A higher load loss leads to a high value of ENS, indicating more power loss and hence greater instability. ENS is calculated for the fault chains and weights of edges, assigned using the following equation:where δpq is the weight of the edge between node p and node q in the graph G; δq is the ENS at node q due to the failure of node p; δ(Ti,j) is the total ENS of the fault chain Xi and is calculated using Equation (30).
- Edge weight based on repetitive failures: The second metric evaluates vulnerability based on the repetitive failures of the branches in all the fault chains of the IPGS, which reflects the number of times each branch fails during various random fault scenarios. Components that fail more frequently are considered more vulnerable, as their failure can lead to widespread disruptions in the system. The edge weight between two nodes in the graph G is given bywhere βpq represents the weight between the nodes p and q, np is the number of times the branch p occurs in all fault chains; and f is the total number of fault chains in the IPGS. The weight of the edges shows the statistical association of vulnerability among the affected nodes in the influence graph. Together, these two metrics offer a comprehensive assessment to quantify the vulnerability of the system by considering both the consequences of failure and the reliability of individual components.
- For the fault chain X1, we first create a directed graph H1 with three nodes, as shown in Figure 5a, where nodes represent faulted branches b1, b2, and b6 in the six-node IPGS. The directed edge from b1 to b2 represents the fault propagating from branch b1 to branch b2 in X1, and the directed edge from b2 to b6 represents the fault further spreading from branch b2 to b6 in X1.
- For the fault chain X2, the directed graph H1 will be extended to graph H2 by adding additional node b4 to graph H1 as shown in Figure 5b. Similarly, to the nodes and edges in graph H1, additional b4 nodes represent a faulted branch in the six-bus IPGS, and the directed edges among these nodes represent the fault propagating from branch b6 to b4 in X2.
- Graph G in Figure 5c is generated by repeating step 2 to include the fault branches in fault chain X3.
5. Identification of Critical Branches in the IPGS Based on Influence Graph
6. Results
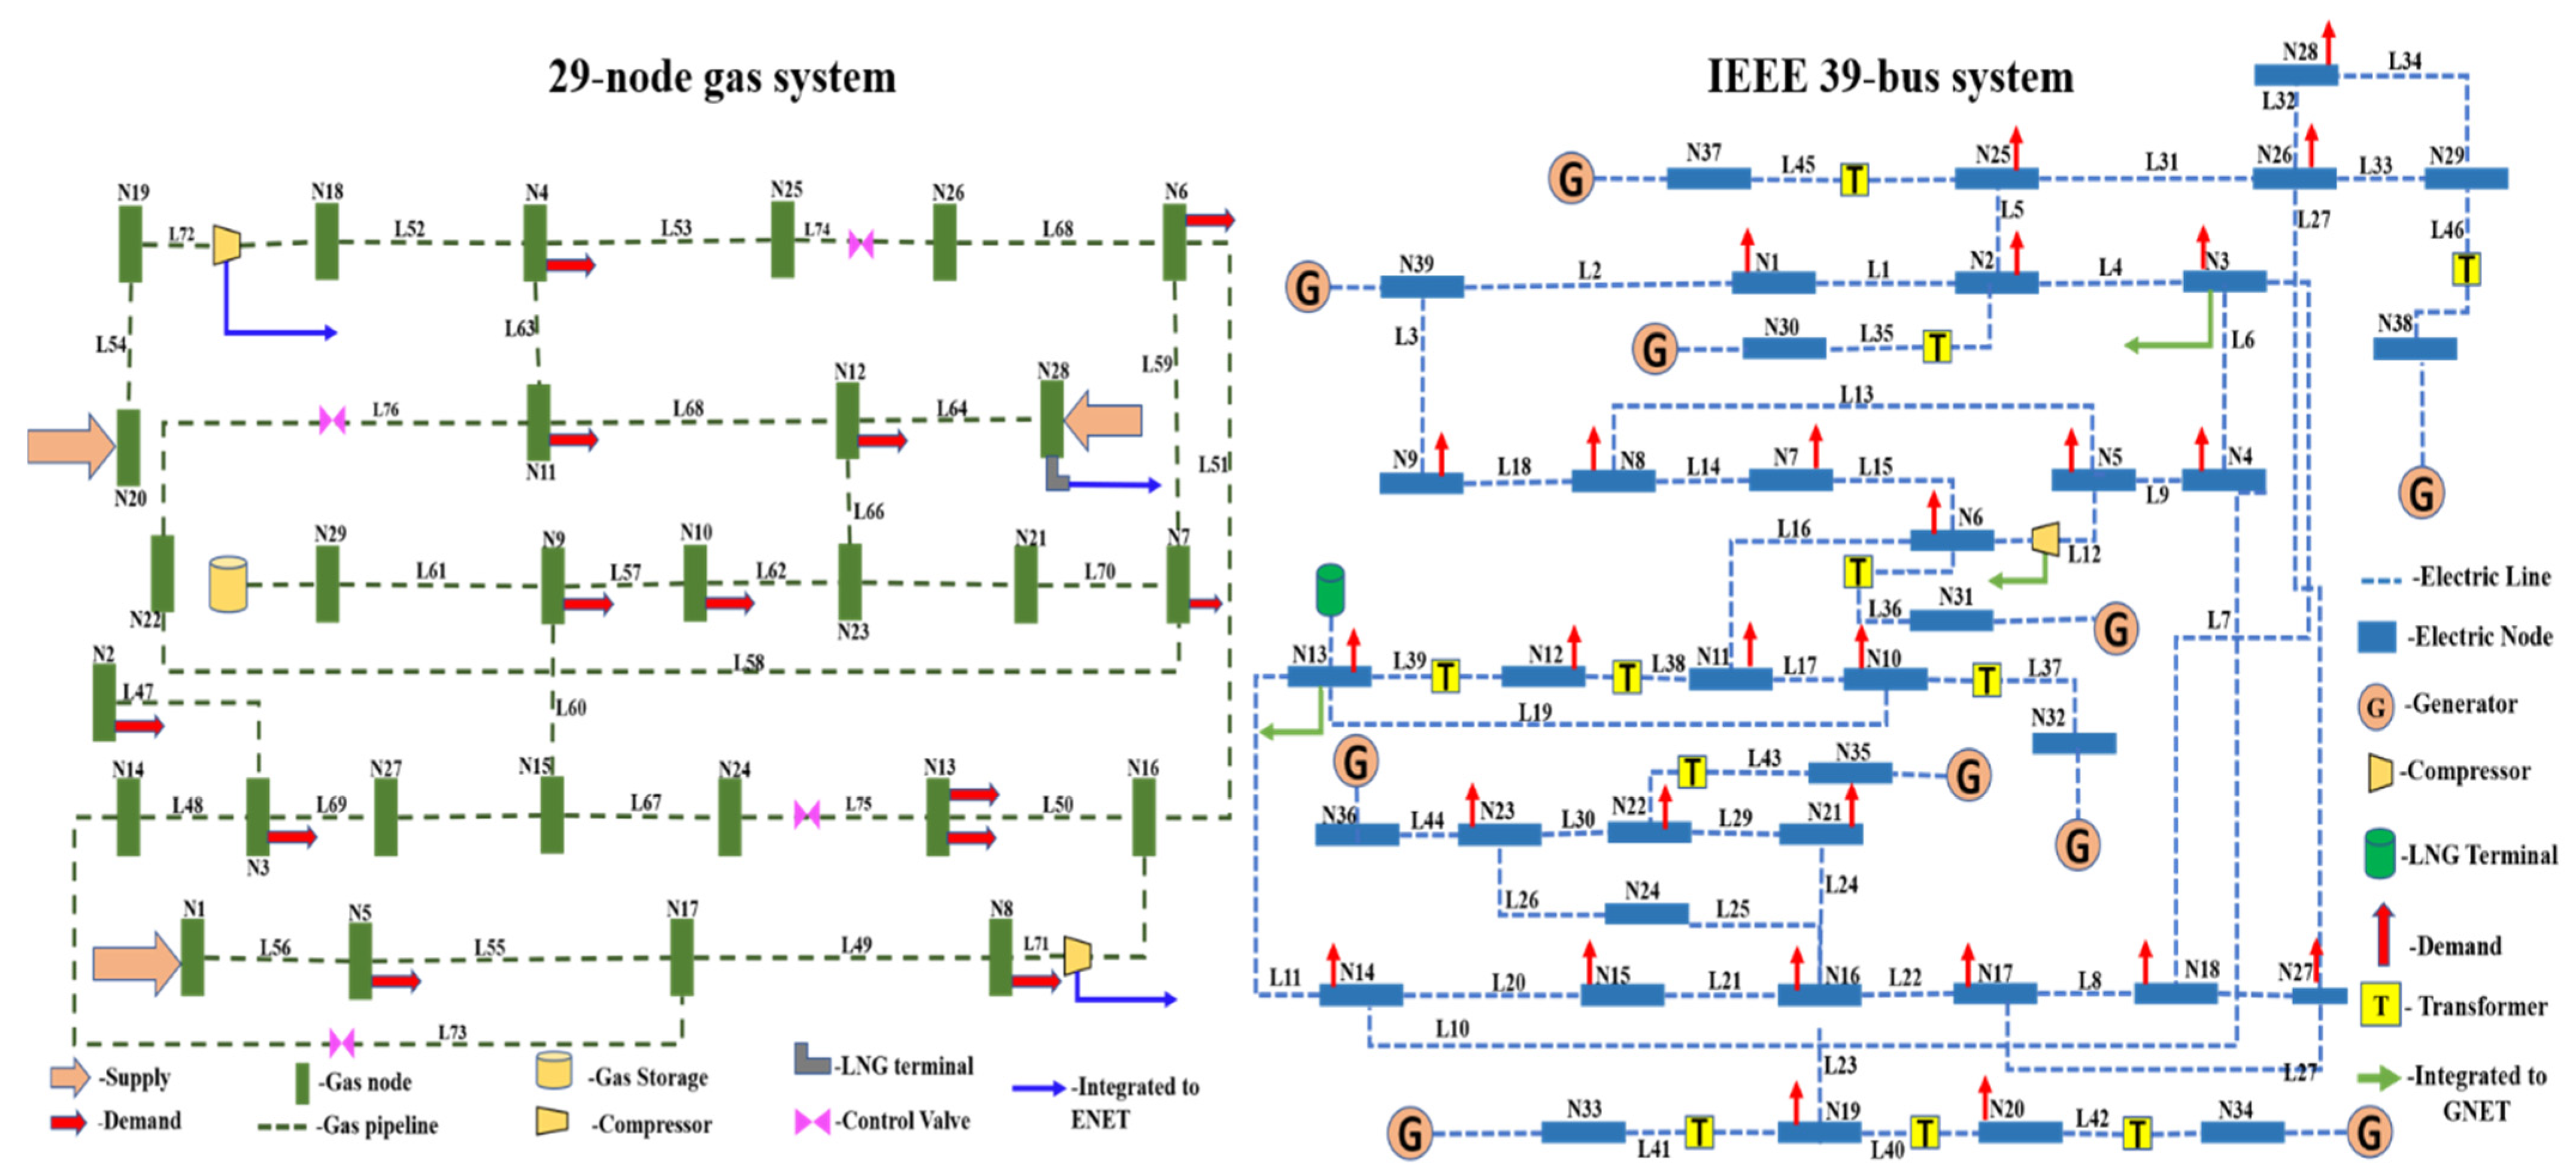
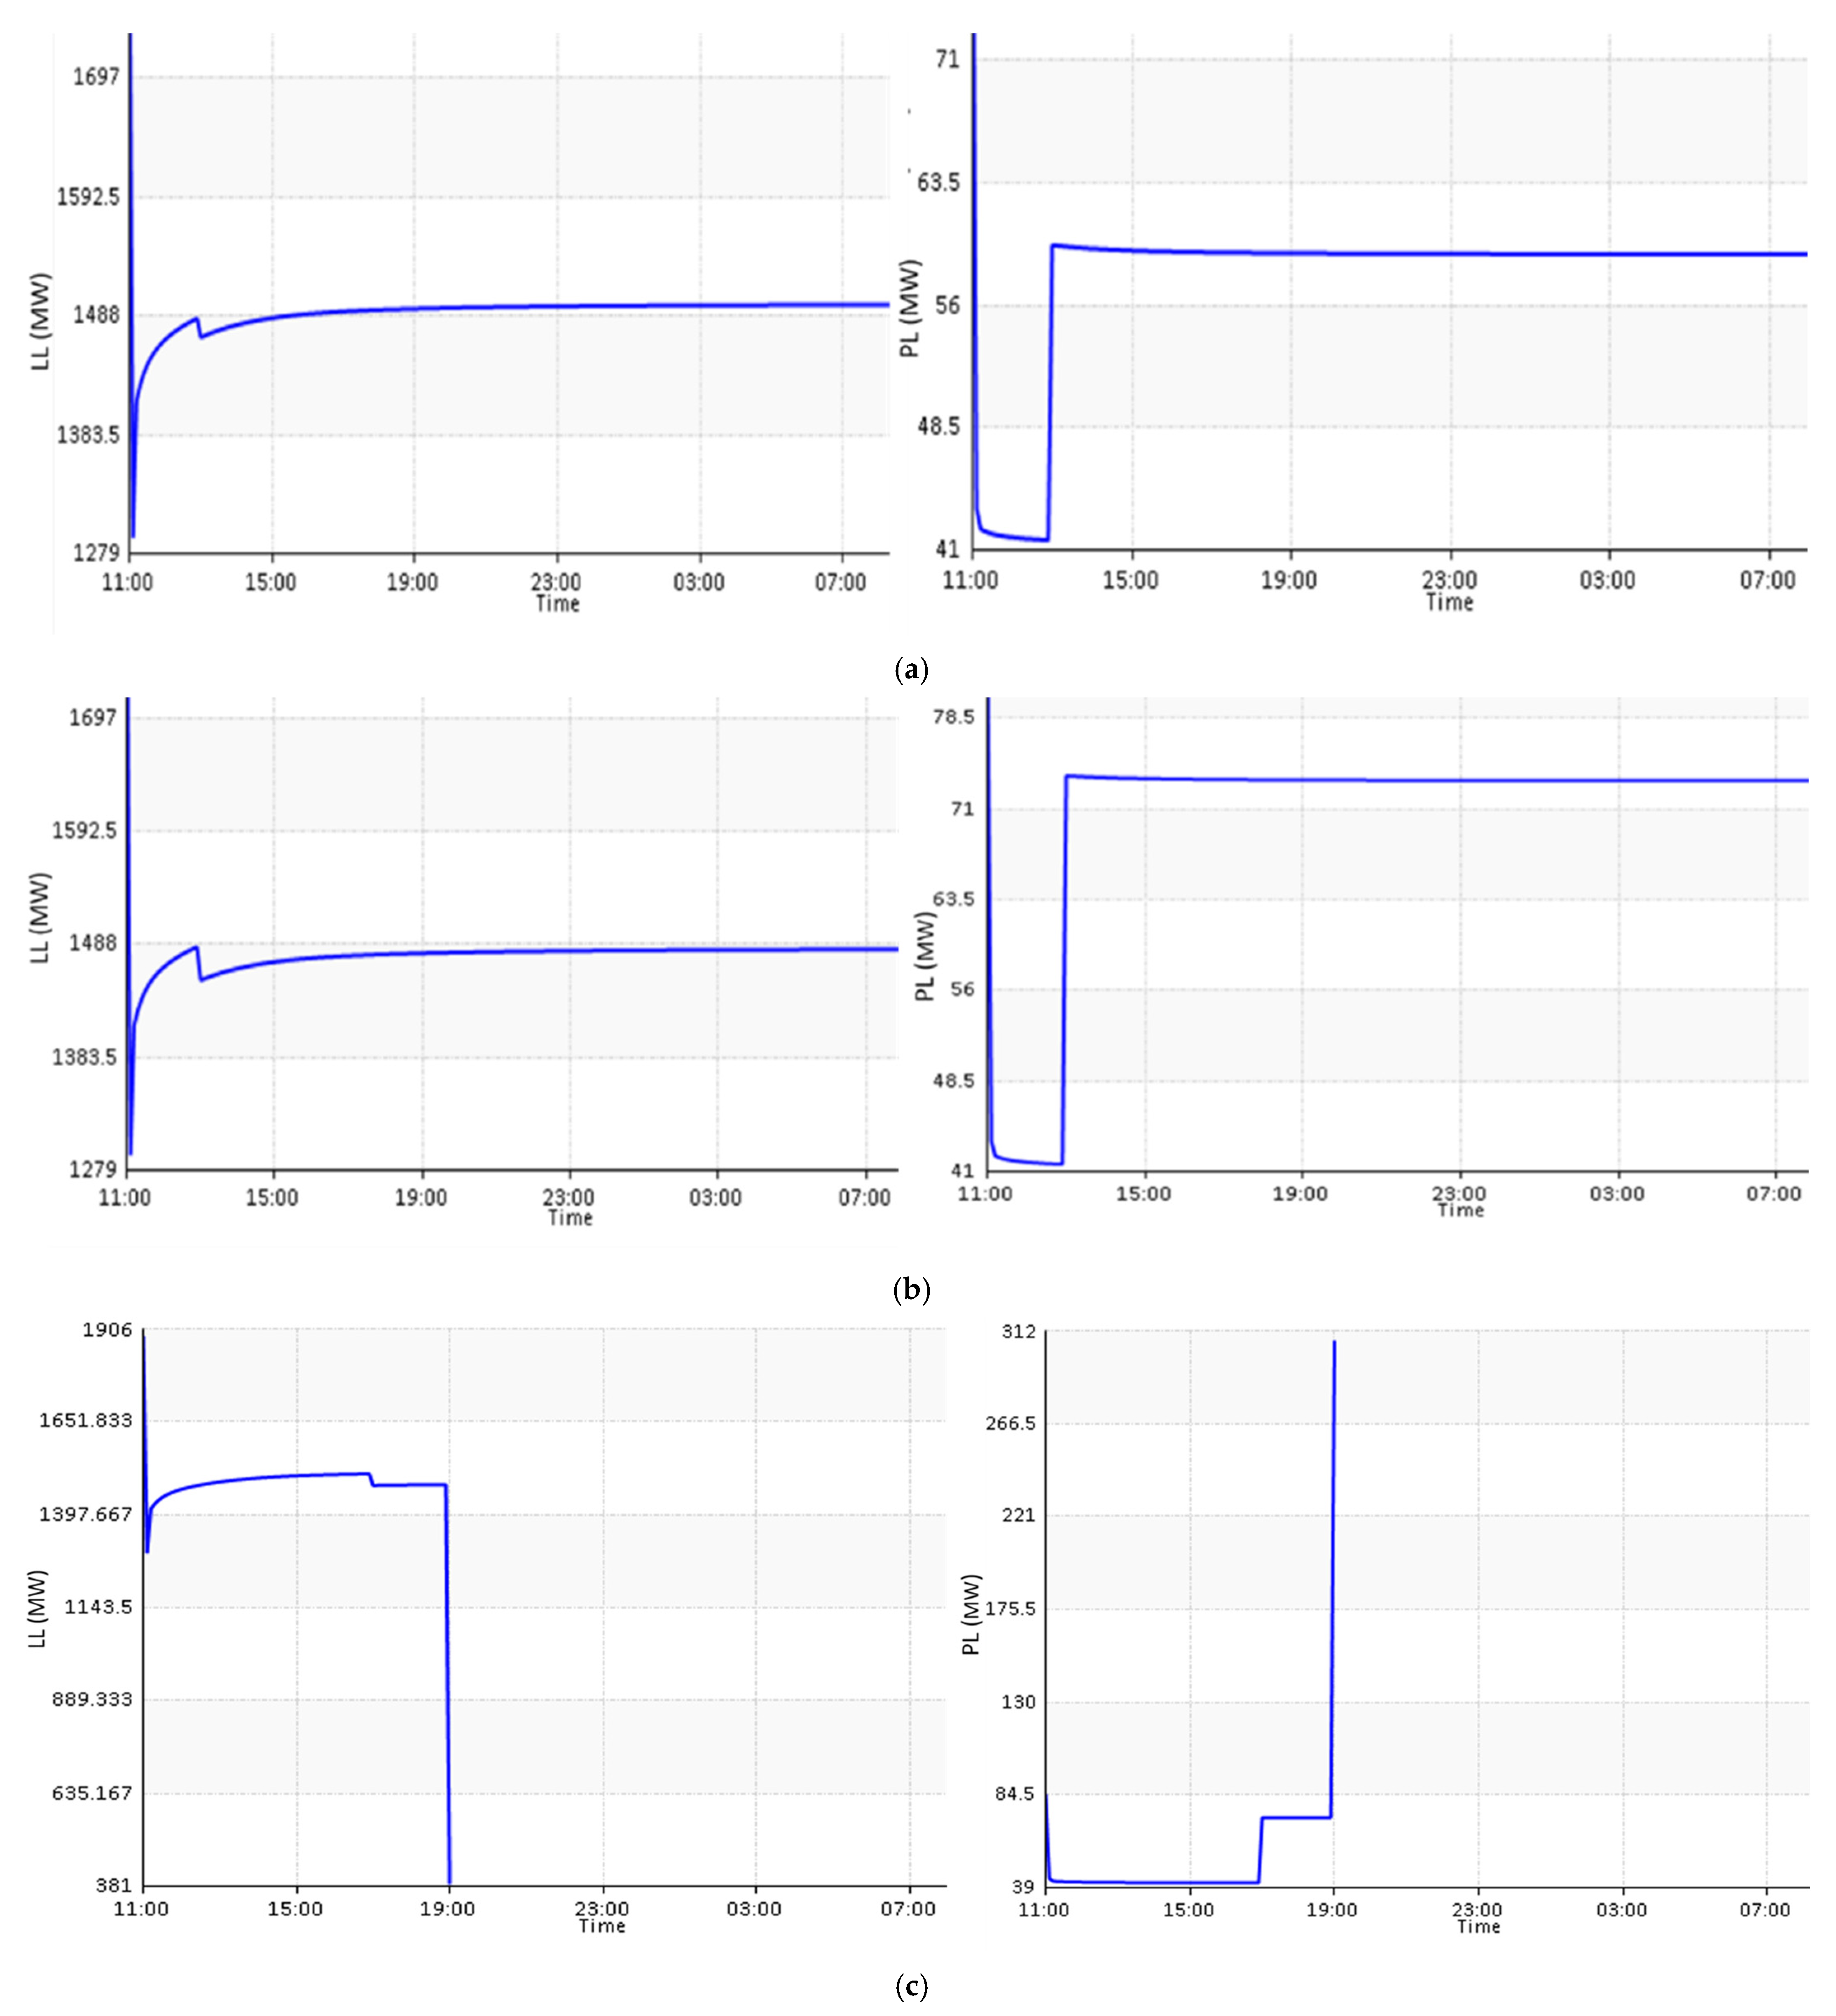
6.1. 39-Bus 29-Node IPGS
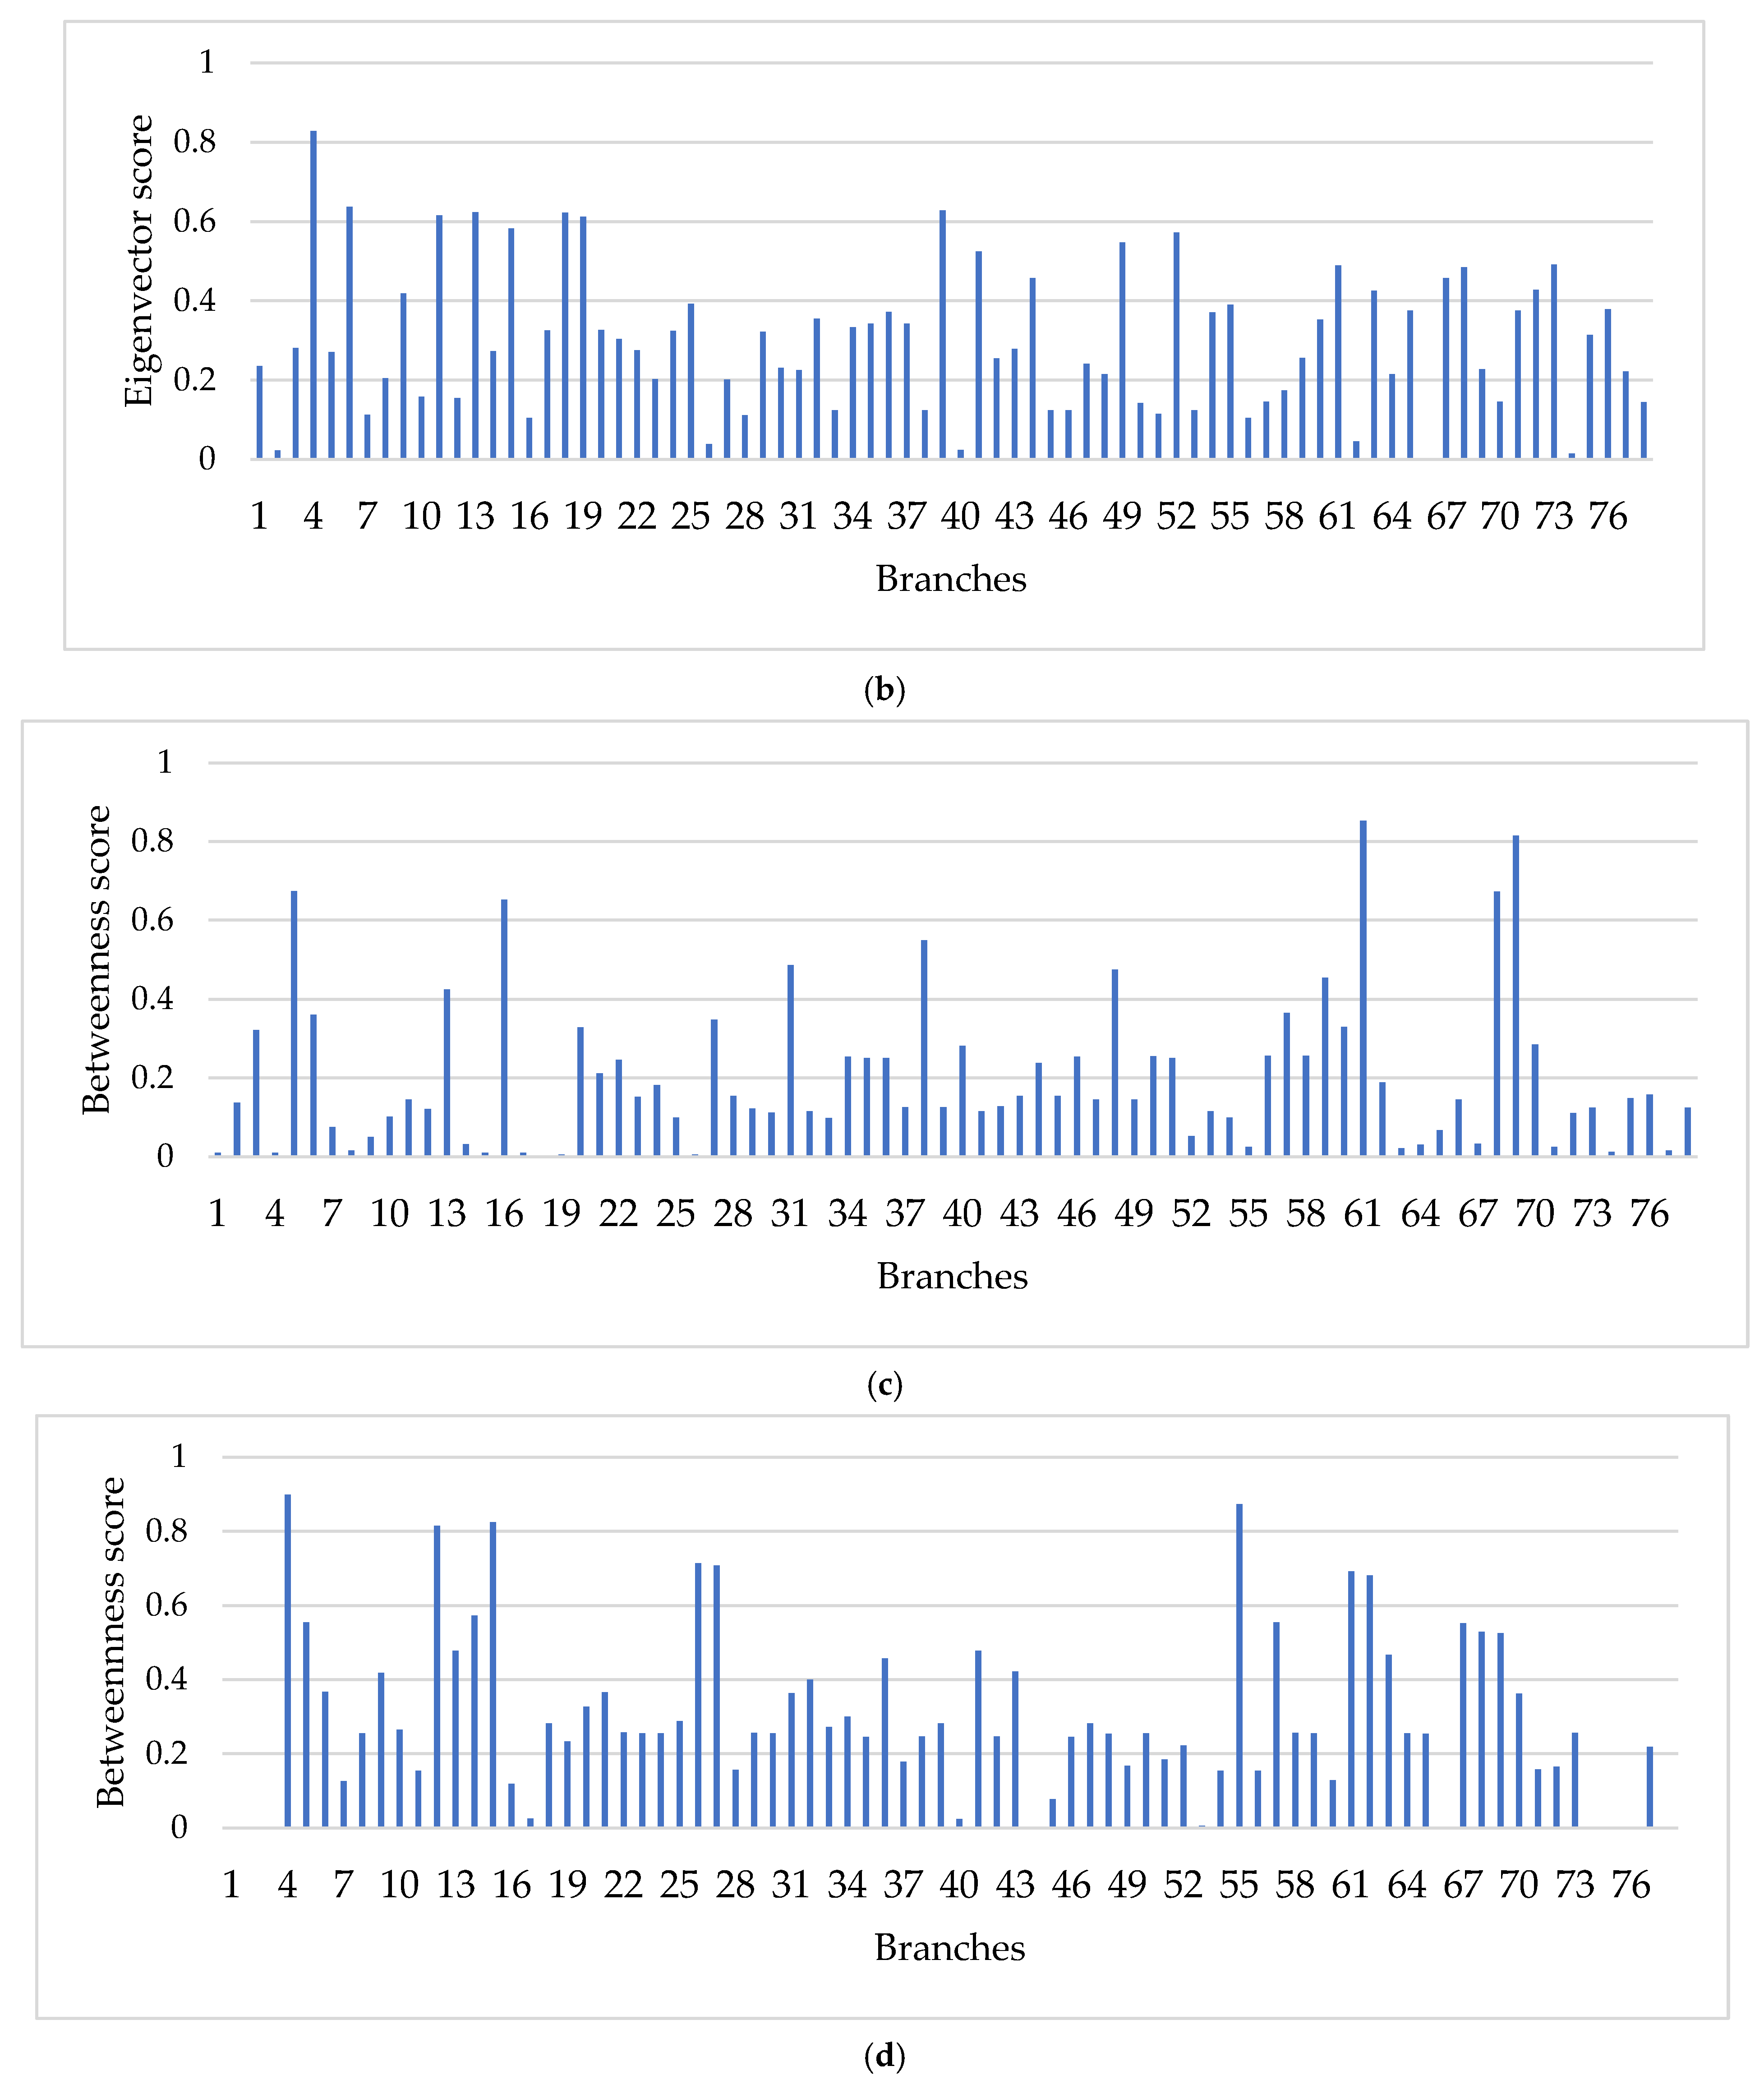
6.2. Influence Graph Analysis for IPGS
6.3. Identification of Critical Branches
7. Discussion
7.1. Discussion on Influence Graph Analysis for IPGS Based on ENS and Repititive Failures
7.2. Discussion on Identification of Critical Branches Using Eigenvector Centrality
7.3. Performance of Proposed Method
8. Conclusions and Future Work
Author Contributions
Funding
Data Availability Statement
Acknowledgments
Conflicts of Interest
References
- Zhou, Y.; He, C. A Review on Reliability of Integrated Electricity-Gas System. Energies 2022, 15, 6815. [Google Scholar] [CrossRef]
- Khatibi, M.; Rabiee, A.; Bagheri, A. Integrated Electricity and Gas Systems Planning: New Opportunities, and a Detailed Assessment of Relevant Issues. Sustainability 2023, 15, 6602. [Google Scholar] [CrossRef]
- Agarwal, A.; Sharma, T. Integrated energy system modeling perspectives for future decarbonization pathways based on sector coupling, life-cycle emissions and vehicle-to-grid integration. Renew. Sustain. Energy Rev. 2025, 215, 115620. [Google Scholar] [CrossRef]
- Li, J.; Liu, J.; Yan, P.; Li, X.; Zhou, G.; Yu, D. Operation Optimization of Integrated Energy System under a Renewable Energy Dominated Future Scene Considering Both Independence and Benefit: A Review. Energies 2021, 14, 1103. [Google Scholar] [CrossRef]
- Wang, Y.; Yang, Y.; Xu, Q. Integrated planning of power-gas systems considering N-1 constraint. Energy Rep. 2023, 9, 1274–1281. [Google Scholar] [CrossRef]
- Correa-Posada, C.; Sánchez-Martín, P. Integrated Power and Natural Gas Model for Energy Adequacy in Short-Term Operation. IEEE Trans. Power Syst. 2015, 30, 3347–3355. [Google Scholar] [CrossRef]
- Shahidehpour, M.; Fu, Y.; Wiedman, T. Impact of natural gas infrastructure on electric power systems. Proc. IEEE 2005, 93, 1042–1056. [Google Scholar] [CrossRef]
- Portante, E.; Kavicky, J.; Craig, B.; Talaber, L.; Folga, S. Modeling Electric Power and Natural Gas System Interdependencies. J. Infrastruct. Syst. 2017, 23. [Google Scholar] [CrossRef]
- Wang, Y.; Yang, Y.; Xu, Q. Reliability Assessment for Integrated Power-gas Systems Considering Renewable Energy Uncertainty and Cascading Effects. CSEE J. Power Energy Syst. 2023, 9, 1214–1226. [Google Scholar] [CrossRef]
- Shrestha, S.; Panchalogaranjan, V.; Moses, P. The February 2021 US Southwest power crisis. Electr. Power Syst. Res. 2023, 217, 109124. [Google Scholar] [CrossRef]
- Chen, S.; Conejo, A.; Sioshansi, R.; Wei, Z. Equilibria in Electricity and Natural Gas Markets with Strategic Offers and Bids. IEEE Trans. Power Syst. 2020, 35, 1956–1966. [Google Scholar] [CrossRef]
- Koltsaklis, N.; Dagoumas, A. State-of-the-art generation expansion planning: A review. Appl. Energy 2018, 230, 563–589. [Google Scholar] [CrossRef]
- Zeng, Z.; Ding, T.; Xu, Y.; Yang, Y.; Dong, Z. Reliability Evaluation for Integrated Power-Gas Systems with Power-to-Gas and Gas Storages. IEEE Trans. Power Syst. 2020, 35, 571–583. [Google Scholar] [CrossRef]
- Xie, H.; Sun, X.; Chen, C.; Bie, Z.; Catalao, J. Resilience Metrics for Integrated Power and Natural Gas Systems. IEEE Trans. Smart Grid 2022, 13, 2483–2486. [Google Scholar] [CrossRef]
- Duan, J.; Liu, F.; Yang, Y.; Jin, Z. Flexible Dispatch for Integrated Power and Gas Systems Considering Power-to-Gas and Demand Response. Energies 2021, 14, 5554. [Google Scholar] [CrossRef]
- Tan, Y.; Wang, X.; Zheng, Y. A new modeling and solution method for optimal energy flow in electricity-gas integrated energy system. Int. J. Energy Res. 2019, 43, 4322–4343. [Google Scholar] [CrossRef]
- Zhao, Y.; Cai, B.; Cozzani, V.; Liu, Y. Failure dependence and cascading failures: A literature review and research opportunities. Reliab. Eng. Syst. Saf. 2025, 256, 110766. [Google Scholar] [CrossRef]
- Qin, C.; Wang, L.; Han, Z.; Zhao, J.; Liu, Q. Weighted directed graph based matrix modeling of integrated energy systems. Energy 2021, 214, 118886. [Google Scholar] [CrossRef]
- Beyza, J.; Correa-Henao, G.J.; Yusta, J.M. Cascading Failures in Coupled Gas and Electricity Transmission Systems. In Proceedings of the 2018 IEEE Andescon, Santiago de Cali, Colombia, 22–24 August 2018. [Google Scholar]
- Bao, Z.; Jiang, Z.; Wu, L. Evaluation of bi-directional cascading failure propagation in integrated electricity-natural gas system. Int. J. Electr. Power Energy Syst. 2020, 121, 106045. [Google Scholar] [CrossRef]
- Xie, B.; Li, C.; Wu, Z.; Chen, W. Topological Modeling Research on the Functional Vulnerability of Power Grid under Extreme Weather. Energies 2021, 14, 5183. [Google Scholar] [CrossRef]
- Panigrahi, P.; Maity, S. Structural vulnerability analysis in small-world power grid networks based on weighted topological model. Int. Trans. Electr. Energy Syst. 2020, 30, 12401. [Google Scholar] [CrossRef]
- Xie, B.; Tian, X.; Kong, L.; Chen, W. The Vulnerability of the Power Grid Structure: A System Analysis Based on Complex Network Theory. Sensors 2021, 21, 7097. [Google Scholar] [CrossRef] [PubMed]
- Zhang, Y.; Kang, Z.; Guo, X.; Lu, Z. The Structural Vulnerability Analysis of Power Grids Based on Overall Information Centrality. IEICE Trans. Inf. Syst. 2016, E99D, 769–772. [Google Scholar] [CrossRef]
- Chopade, P.; Bikdash, M. New centrality measures for assessing smart grid vulnerabilities and predicting brownouts and blackouts. Int. J. Crit. Infrastruct. Prot. 2016, 12, 29–45. [Google Scholar] [CrossRef]
- Liu, B.; Li, Z.; Chen, X.; Huang, Y.; Liu, X. Recognition and Vulnerability Analysis of Key Nodes in Power Grid Based on Complex Network Centrality. IEEE Trans. Circuits Syst. II-Express Briefs 2018, 65, 346–350. [Google Scholar] [CrossRef]
- Kang, Z.; Zhang, Y.; Guo, X.; Lu, Z. The Structural Vulnerability Analysis of Power Grids Based on Second-Order Centrality. IEICE Trans. Fundam. Electron. Commun. Comput. Sci. 2017, E100A, 1567–1570. [Google Scholar] [CrossRef]
- Forsberg, S.; Thomas, K.; Bergkvist, M. Power grid vulnerability analysis using complex network theory: A topological study of the Nordic transmission grid. Phys. A-Stat. Mech. Its Appl. 2023, 626, 129072. [Google Scholar] [CrossRef]
- Bose, D.; Chanda, C.; Chakrabarti, A. Vulnerability assessment of a power transmission network employing complex network theory in a resilience framework. Microsyst. Technol.-Micro-Nanosyst.-Inf. Storage Process. Syst. 2020, 26, 2443–2451. [Google Scholar] [CrossRef]
- Espejo, R.; Lumbreras, S.; Ramos, A. Analysis of transmission-power-grid topology and scalability, the European case study. Phys. A-Stat. Mech. Its Appl. 2018, 509, 383–395. [Google Scholar] [CrossRef]
- Ju, W.; Sun, K.; Qi, J. Multi-Layer Interaction Graph for Analysis and Mitigation of Cascading Outages. IEEE J. Emerg. Sel. Top. Circuits Syst. 2017, 7, 239–249. [Google Scholar] [CrossRef]
- Zhu, Y.; Yan, J.; Tang, Y.; Sun, Y.; He, H. Resilience Analysis of Power Grids Under the Sequential Attack. IEEE Trans. Inf. Forensics Secur. 2014, 9, 2340–2354. [Google Scholar] [CrossRef]
- Wei, X.; Gao, S.; Huang, T.; Bompard, E.; Pi, R.; Wang, T. Complex Network-Based Cascading Faults Graph for the Analysis of Transmission Network Vulnerability. IEEE Trans. Ind. Inform. 2019, 15, 1265–1276. [Google Scholar] [CrossRef]
- Zang, T.; Gao, S.; Huang, T.; Wei, X.; Wang, T. Complex Network-Based Transmission Network Vulnerability Assessment Using Adjacent Graphs. IEEE Syst. J. 2020, 14, 572–581. [Google Scholar] [CrossRef]
- Fang, R.; Shang, R.; Wang, Y.; Guo, X. Identification of vulnerable lines in power grids with wind power integration based on a weighted entropy analysis method. Int. J. Hydrogen Energy 2017, 42, 20269–20276. [Google Scholar] [CrossRef]
- Yang, S.; Chen, W.; Zhang, X.; Liang, C.; Wang, H.; Cui, W. A Graph-Based Model for Transmission Network Vulnerability Analysis. IEEE Syst. J. 2020, 14, 1447–1456. [Google Scholar] [CrossRef]
- Guo, Z.; Sun, K.; Su, X.; Simunovic, S. A review on simulation models of cascading failures in power systems. Ienergy 2023, 2, 284–296. [Google Scholar] [CrossRef]
- Zakariya, M.; Teh, J. A Systematic Review on Cascading Failures Models in Renewable Power Systems with Dynamics Perspective and Protections Modeling. Electr. Power Syst. Res. 2023, 214, 108928. [Google Scholar] [CrossRef]
- Zhai, C.; Nguyen, H.; Xiao, G. A robust optimization approach for protecting power systems against cascading blackouts. Electr. Power Syst. Res. 2020, 189, 106794. [Google Scholar] [CrossRef]
- Wei, X.; Zhao, J.; Huang, T.; Bompard, E. A Novel Cascading Faults Graph Based Transmission Network Vulnerability Assessment Method. IEEE Trans. Power Syst. 2018, 33, 2995–3000. [Google Scholar] [CrossRef]
- Brouwer, A.; van den Broek, M.; Seebregts, A.; Faaij, A. Operational flexibility and economics of power plants in future low-carbon power systems. Appl. Energy 2015, 156, 107–128. [Google Scholar] [CrossRef]
- Chen, S.; Wei, Z.; Sun, G.; Cheung, K.; Sun, Y. Multi-Linear Probabilistic Energy Flow Analysis of Integrated Electrical and Natural-Gas Systems. IEEE Trans. Power Syst. 2017, 32, 1970–1979. [Google Scholar] [CrossRef]
- Kumar, J.S.; Venkatesh, P.; Raja, S.C.; Nesamalar, J.J.D.; Palanichamy, C. Reliability Enhancement of Small and Medium Distribution System with Renewable Generations and Reclosers. In Proceedings of the 2018 20th National Power Systems Conference (NPSC), Tiruchirappalli, India, 14–16 December 2018. [Google Scholar]
- Pambour, K.; Erdener, B.; Bolado-Lavin, R.; Dijkema, G. SAInt—A novel quasi-dynamic model for assessing security of supply in coupled gas and electricity transmission networks. Appl. Energy 2017, 203, 829–857. [Google Scholar] [CrossRef]
- Elnour, M.; Atat, R.; Takiddin, A.; Ismail, M.; Serpedin, E. Eigenvector centrality-enhanced graph network for attack detection in power distribution systems. Electr. Power Syst. Res. 2025, 241, 111339. [Google Scholar] [CrossRef]
- Pradhan, P.; Angeliya, C.; Jalan, S. Principal eigenvector localization and centrality in networks: Revisited. Phys. A-Stat. Mech. Its Appl. 2020, 554, 124169. [Google Scholar] [CrossRef]
- A., P.K.; Ricardo, B.L.; Gerard, D. SAInt—A Simulation Tool for analyzing the Consequences of Natural Gas Supply Disruptions. In Proceedings of the 20th Pipeline Technology Conference, Berlin, Germany, 7 July 2016. [Google Scholar]


| Fault Chains | Ti, j | Ti, j+1 | Ti, j+2 | Ti, j+3 |
|---|---|---|---|---|
| X1 = {b1, b2, b6} | b1 | b2 | b6 | |
| X2 = {b2, b6, b4} | b2 | b6 | b4 | |
| X3 = {b3, b1, b2, b5} | b3 | b1 | b2 | b5 |
| Branch | Fault Chains | Branch | Fault Chains |
|---|---|---|---|
| 1 | 1-3-(5,9),9-(11,14,18,19,20) | 18 | 18-(7,8,9,13),13-(14,15,16,20),20-(21,22,27,31) |
| 2 | 2-3-(5,9), 9-(11,12,13,14), 14-(18,20) | 4,18 | 4-(1,5,6,54,55,35),17-(3,12,14) |
| 24 | 24-(25,26,30) | 53,55 | 53-(54,55,4,6,7) |
| 15 | 15-(27,29),29-31 | 67 | 67-(57,39,19) |
| 1,17 | 1-3-(5,9),9-(11,14,18,19,20,59,64),16-(37,38) | 11,13 | 11-(9,12,15,16,67), 16-(21,22),3-(1,2,4,6,13) |
| Case | Adjacent Relations | Total Load Loss MW | Total Power Loss MW |
|---|---|---|---|
| 1 | 4-(35,54,72) | 1533.91 | 84.831 |
| 2 | 18-(10,21) | 1485.99 | 76.221 |
| 3 | (12,24)-16 | 1512.76 | 49.447 |
| 4 | 31-(42,43) | 1498.73 | 63.537 |
| Case | Adjacent Relations | Total Load Loss MW | Total Power Loss MW |
|---|---|---|---|
| 1 | 5-(3,6,54) | 1467.677 | 111.102 |
| 2 | 18-(3,38,23) | 1522.179 | 40.057 |
| 3 | 10-72-66 | 1531.569 | 42.283 |
Disclaimer/Publisher’s Note: The statements, opinions and data contained in all publications are solely those of the individual author(s) and contributor(s) and not of MDPI and/or the editor(s). MDPI and/or the editor(s) disclaim responsibility for any injury to people or property resulting from any ideas, methods, instructions or products referred to in the content. |
© 2025 by the authors. Licensee MDPI, Basel, Switzerland. This article is an open access article distributed under the terms and conditions of the Creative Commons Attribution (CC BY) license (https://creativecommons.org/licenses/by/4.0/).
Share and Cite
Yasir, N.; Huang, Y.; Wu, D. Influence Graph-Based Method for Sustainable Energy Systems. Sustainability 2025, 17, 5666. https://doi.org/10.3390/su17125666
Yasir N, Huang Y, Wu D. Influence Graph-Based Method for Sustainable Energy Systems. Sustainability. 2025; 17(12):5666. https://doi.org/10.3390/su17125666
Chicago/Turabian StyleYasir, Nof, Ying Huang, and Di Wu. 2025. "Influence Graph-Based Method for Sustainable Energy Systems" Sustainability 17, no. 12: 5666. https://doi.org/10.3390/su17125666
APA StyleYasir, N., Huang, Y., & Wu, D. (2025). Influence Graph-Based Method for Sustainable Energy Systems. Sustainability, 17(12), 5666. https://doi.org/10.3390/su17125666