1. Introduction
As the global economy grows and the energy demand increases, the carbon emission problem has become increasingly prominent. Since the Industrial Revolution, the carbon emissions (CO
2 emissions) generated by human activities that consume a substantial amount of fossil energy have led to a significant increase in the concentration of greenhouse gases. According to the latest report released by the International Energy Agency (IEA), the global CO
2 emissions in 2023 have already reached an astonishing 37.4 billion tons (Gt), while in 1950, the emissions were only 6 Gt [
1]. Excessive CO
2 emissions have brought about a series of severe challenges, such as rising sea levels, the destruction of ecosystems, and the increase in extreme weather events, which seriously threaten the sustainable development of human society. China, as the country with the world’s highest CO
2 emissions and energy consumption, faces significant challenges in regard to carbon emission reduction. In 2023, China’s CO
2 emissions increased by 565 million tons (Mt), the highest growth in the world, of which carbon emissions from energy combustion alone surged by 5.2% [
1]. In the face of severe climate change and to reduce the emission of greenhouse gases, such as carbon dioxide, China has put forward the “dual carbon” goals, which aim to reach a peak in carbon dioxide emissions before 2030 and achieve carbon neutrality before 2060 [
2]. These goals are part of the implementation of the country’s commitment to the Paris Agreement and are a major strategic decision made in regard to achieving sustainable development.
The economic development in China that has occurred in the past few decades was based on a mode of extensive growth and an industrial structure dominated by industries that are high in energy consumption, emissions, and pollution. However, in the face of the escalating global climate crisis, this development model is no longer sustainable. There exists an imperative to expedite the transition towards a greener development paradigm and hasten the advancement of industrial restructuring. Notably, industrial structure upgrading (ISU) emerges as a pivotal strategy for fostering high-quality economic growth, thereby playing a crucial role in lowering CO
2 emissions. According to relevant estimates, China’s industrial restructuring could contribute by more than 70% to achieving the carbon intensity target [
3]. Accelerating the upgrading of industrial structures is an important way to achieve the “dual carbon” goals and industrial structure upgrading can minimize idle resources and structural waste [
4]. Studying the effect of ISU on CO
2 emissions is of great significance in regard to the efforts to address climate change, promote sustainable economic development, improve energy efficiency, and formulate effective policies.
The upgrading of industrial structures, as a pivotal component of economic development, has a crucial effect on CO
2 emissions. In recent years, numerous pieces of scholarly research have been dedicated to exploring the correlation between ISU and CO
2 emissions. Despite the extensive and rigorous investigations, the findings have been varied, leading to a divergence in the conclusions. A limited number of scholars contend that ISU has no significant influence on CO
2 emissions. Schipper et al. [
5] investigated the evolution of CO
2 emissions in the manufacturing sector across 13 IEA countries and found that these emissions are predominantly influenced by energy intensity, with the effect of the industrial structure being minimal. Xu et al. [
6] employed the Logarithmic Mean Divisia Index (LMDI) decomposition method to quantitatively assess the effect of industrial structure adjustments on CO
2 emissions in Shandong Province, China, revealing that the contribution of the industrial structure to the growth of CO
2 emissions was relatively low. Zhang et al. [
7] developed a non-dynamic spatial panel model, based on data on prefecture-level cities in China, and found that neither the upgrading nor the optimization of the industrial structure had a significant effect on CO
2 emissions. Du et al. [
8] adopted the LMDI method and the Tapio decoupling model to analyze the decoupling relationship between China’s energy-related CO
2 emissions and economic growth from the perspective of the industrial structure. The research found that the adjustment of China’s industrial structure did not lead to a significant increase in CO
2 emissions.
However, most researchers believe that ISU exerts a remarkable impact on CO
2 emissions. Chen et al. [
9] examined the impact of ISU on carbon emission intensity, based on Chinese provincial panel data, in terms of the direct, indirect, and spatial spillover effects and found that ISU significantly suppresses the carbon emission intensity through the direct effects and indirect effects of the economy and technology. Zhao et al. [
10] used a spatial econometric model to explore the impact of ISU in China on carbon emission reduction and the results showed that ISU can lower CO
2 emissions by improving energy efficiency. Wang et al. [
11] conducted an in-depth study on the effect of ISU in developing countries on CO
2 emissions when they participate in the global industrial chain and they discovered that developing countries, such as China and India, face the dilemma of “low-end locking” in regard to their industrial structure when participating in global value chains, making the need for domestic carbon emission reduction more pressing. Liao et al. [
12] used spatial Durbin econometrics to investigate the carbon emission reduction effect of ISU in the Beijing–Tianjin–Hebei region of China and found that the carbon emissions produced by the urban agglomeration in the region have obvious spatial spillover effects and that ISU is conducive to reducing CO
2 emissions. Zhao et al. [
13] divided industrial structure optimization into two aspects, industrial structure rationalization and advancedization, and studied the relationship between industrial structure optimization and carbon emissions from the perspective of economic development, and the study showed that both industrial structure rationalization and advancedization have significant inhibition effects on carbon emissions.
Furthermore, certain scholars believe that there is a complex nonlinear link, rather than just a simple linear one, between CO
2 emissions and ISU. Utilizing provincial-level panel data in China, Hu et al. [
14] discovered that the industrial structure’s rationalization index had a significant impact on CO
2 emissions, characterized by an asymmetric effect involving short-term enhancement and long-term mitigation. Li et al. [
15] used a VAR model to examine the dynamic relationship between industrial structure optimization and carbon emissions in Xinjiang, China, and the impulse response results revealed that the stage of the industrial structure optimization has an effect on CO
2 emissions, which may involve an increase in CO
2 emissions during the initial stage and a reduction in CO
2 emissions in the long run. Cao et al. [
16], employing static regression analysis, discovered that improving the industrial structure had a substantial impact on carbon emissions, with an “inverted U-shaped” growth pattern, characterized by an initial promotion of emissions, followed by suppression. Yang et al. [
17] took 2012 as the time node to divide industrial structure upgrading into two development stages and conduct regression analysis on the relationship between ISU and CO
2 emissions at different stages. It was found that ISU has rather obvious stage-related characteristics and, when taking 2012 as the time node, its effect on carbon emissions showed an inverted “V”-shaped trend, which firstly involves the promotion and then the inhibition of emissions. Liang et al. [
18] used the double fixed-effects model to study the relationship between the digital economy, the optimization of the manufacturing industry’s structure, and carbon emissions, and found that the optimization of the manufacturing industry’s structure has a significant effect of promoting and then inhibiting carbon emissions.
Reviewing the aforementioned literature reveals that the effect of ISU on CO2 emissions is complex and diverse. There are differences in the research conclusions regarding the relationship between the two and the underlying mechanisms still need further exploration. Moreover, most of the existing literature is focused on the static relationship between industrial structure and carbon emissions, whereas in fact the impact of ISU on CO2 emissions may not simply be static, but rather a dynamic process that evolves over time for a variety of reasons.
What were the trends in terms of the effect of ISU on CO2 emissions in the past few decades? What are the underlying reasons for these trends? Given these reasons, how should the government optimize industrial structure upgrading policies? To address the abovementioned questions, this study constructs a time-varying coefficient two-way fixed-effects panel model and empirically analyzes the situation using Chinese provincial-level data from 2002 to 2021. This study explores the impact of ISU on CO2 emissions at various times and analyzes the driving force behind the time-varying trend, so as to offer evidence to the government to formulate relevant policies and expedite the achievement of global CO2 emission reduction targets. Compared with the existing literature, this research presents the following potential, marginal contributions:
- (1)
Existing studies mostly rely on the traditional static panel data model, ignoring the complex dynamic relationship and nonlinear nature of the relationship between ISU and CO2 emissions. In this paper, based on the characteristics of the data, a non-parametric panel data model, with time-varying coefficients, is established. It can more accurately capture the differences in the impact of ISU on CO2 emissions at each time point and grasp the dynamic evolutionary process and long-term development trend in the variable relationship. This research will provide new perspectives and potential directions for future research in related fields;
- (2)
Previous studies, when analyzing the internal influence mechanism of ISU on CO2 emissions, have mostly described the relationship between the two in a simple way and lack in-depth analysis of the underlying reasons for this influence, in combination with other background factors. In contrast, this paper comprehensively considers various factors, such as the policy background and economic development status, and comprehensively combines the development stage of the industrial structure to analyze the deep-seated reasons for the impact of ISU on CO2 emissions. This study helps to grasp the internal logic and dynamic change law in terms of the relationship change between the two and provides a basis for decision-making for policy formulation;
- (3)
Most existing research confines the scope of the research to small regions when exploring the impact of ISU on CO2 emissions, which makes it difficult to effectively extend the research results to different regional contexts and means that the results lack significance in terms of offering practical guidance on the matter. In this paper, however, the research objects are divided into different regions according to certain factors, such as the geographical location and economic base. The regional heterogeneity and its causes in terms of the relationship between ISU and CO2 emissions are explored, providing a theoretical basis for formulating region-specific carbon reduction schemes, enriching the research content in this field, and offering references for subsequent research.
The remaining paper is arranged as follows:
Section 2 provides details on the research design, which contains three components: the research model, a description of the variables, and presentation of the data. Empirical analysis is included in
Section 3 and
Section 4 presents the research conclusions and related suggestions.
3. Empirical Analysis
3.1. Chinese Carbon Emissions and Industrial Structure Upgrading
To gain a better understanding of how CO
2 emissions and industrial structural upgrading have changed, in general, between 2002 and 2021, we calculated the mean values of
lnCE and
lnISU for 30 provinces, each year, and created
Figure 1 accordingly.
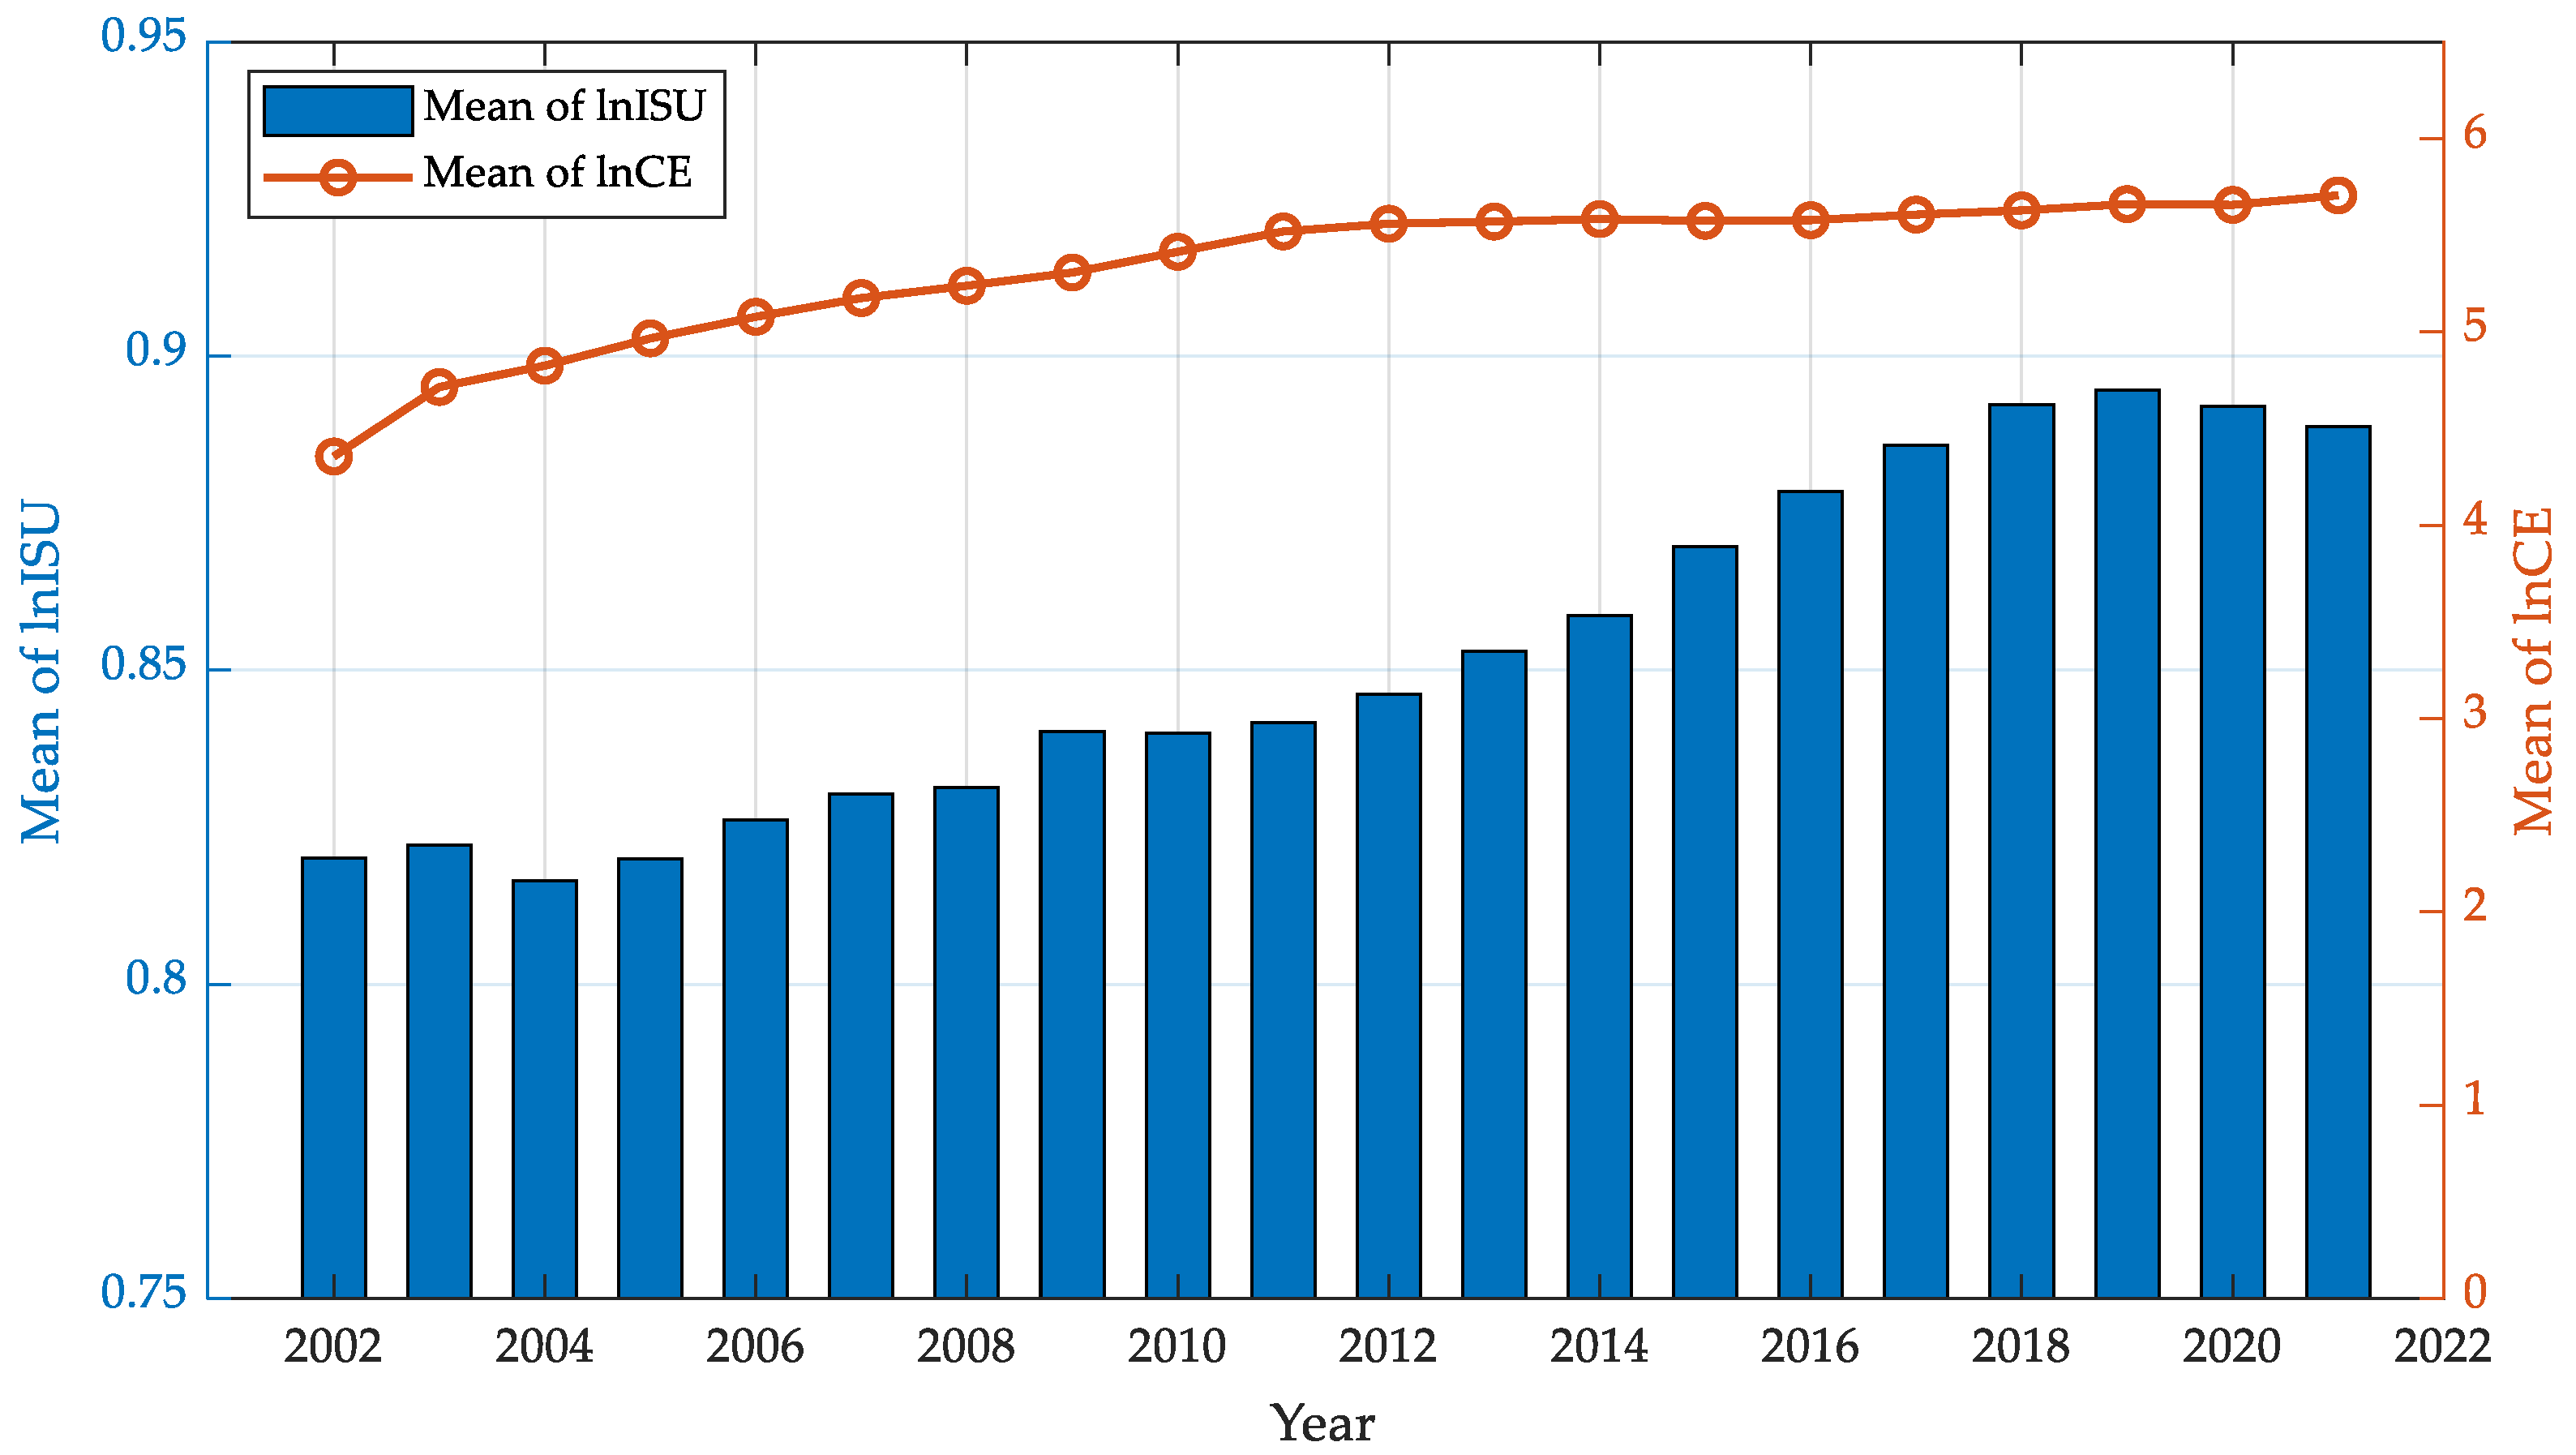
Figure 1 presents a bar chart on the mean value of
lnISU (with the coordinates on the left) and a line chart on the mean value of
lnCE (with the coordinates on the right) from 2002 to 2021.
Analysis of the data reveals a consistent upward trajectory for both variables. The mean value of lnCE has been increasing continuously from 4.3560 in 2002 to 5.7064 by 2021. Notably, the period from 2002 to 2012 witnessed a rapid escalation in CO2 emissions. After 2012, due to the implementation of environmental policies and the improvement in public awareness of carbon emission reduction, the growth rate in regard to CO2 emissions slowed down. lnISU, on the other hand, shows fluctuating growth, with a value of 0.8165 in 2004, and has been growing rapidly since 2011, influenced by strategies on industrial upgrading and the quick advancement of technology, reaching a maximum value of 0.8945 in 2019. After 2019, the global economy slows down, possibly due to the impact of the COVID-19 pandemic, and energy consumption in fields, such as industrial production and transportation, decreases. During this period, the industrial structure upgrading index decreases.
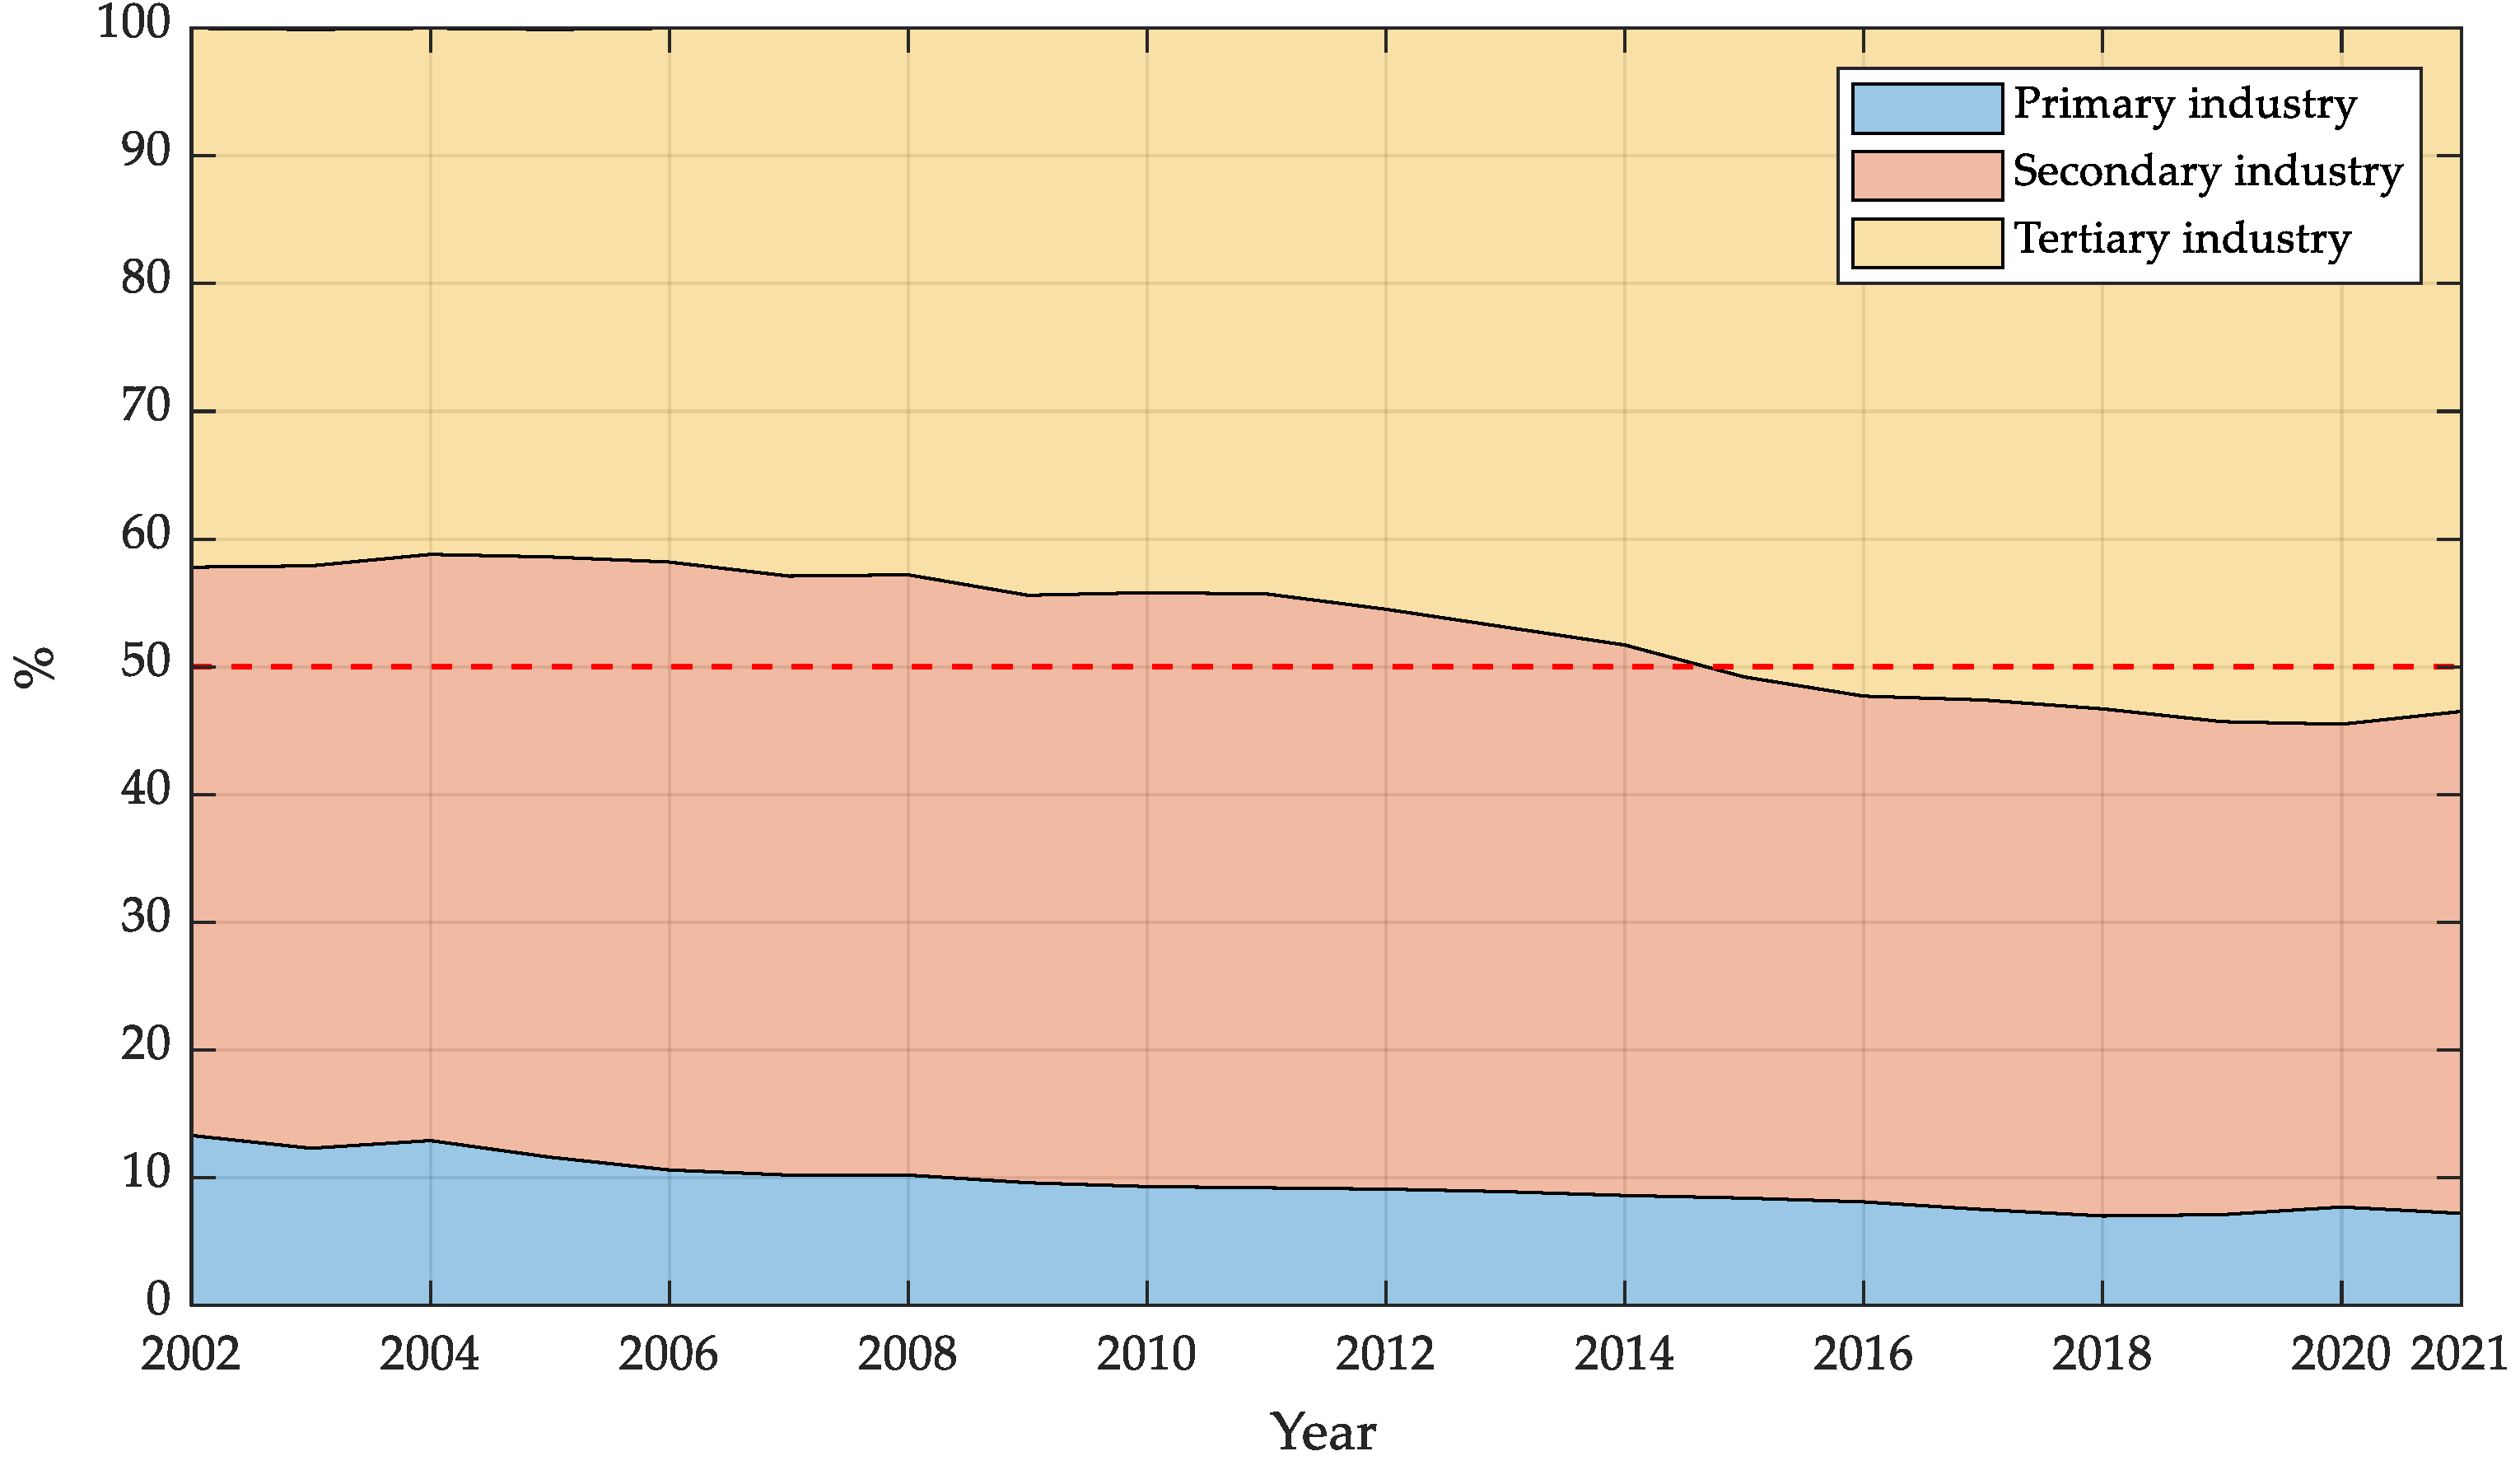
Since the effect of ISU on CO
2 emissions may be related to the percentage of the contrition of the three major industries in the industrial structure, this paper also presents
Figure 2, which shows the percentage changes in the added value of the three major industries in terms of GDP between 2002 and 2021.
Based on
Figure 2, the upgrading of the industrial structure can be partitioned into two distinct phases, as follows:
- (1)
The first phase (2002–2011): During this period, the secondary industry contributed the largest proportion to the national economy and continued to grow. With China’s 2001 entry into the World Trade Organization, international trade grew quickly and domestic market vitality significantly increased. The Chinese industrial sector swiftly integrated into the global economic system, with the secondary industry, particularly manufacturing, developing rapidly and emerging as the primary driver of economic growth;
- (2)
The second phase (after 2012): The percentage share of the tertiary industry started to surpass that of the secondary industry, as the Chinese economy shifted to a new normal. Starting in 2015, the added value of China’s tertiary industry accounted for more than 50% of GDP, becoming the dominant industry in the national economy. During this phase, China began to emphasize optimizing and upgrading its economic structure, promoting the development of modern service industries and high-tech industries, while also driving the transformation of manufacturing towards higher end and more intelligent sectors.
3.2. Motivation Analysis in Terms of Model Establishment
3.2.1. Nonlinear Relationship and Time-Varying Characteristics
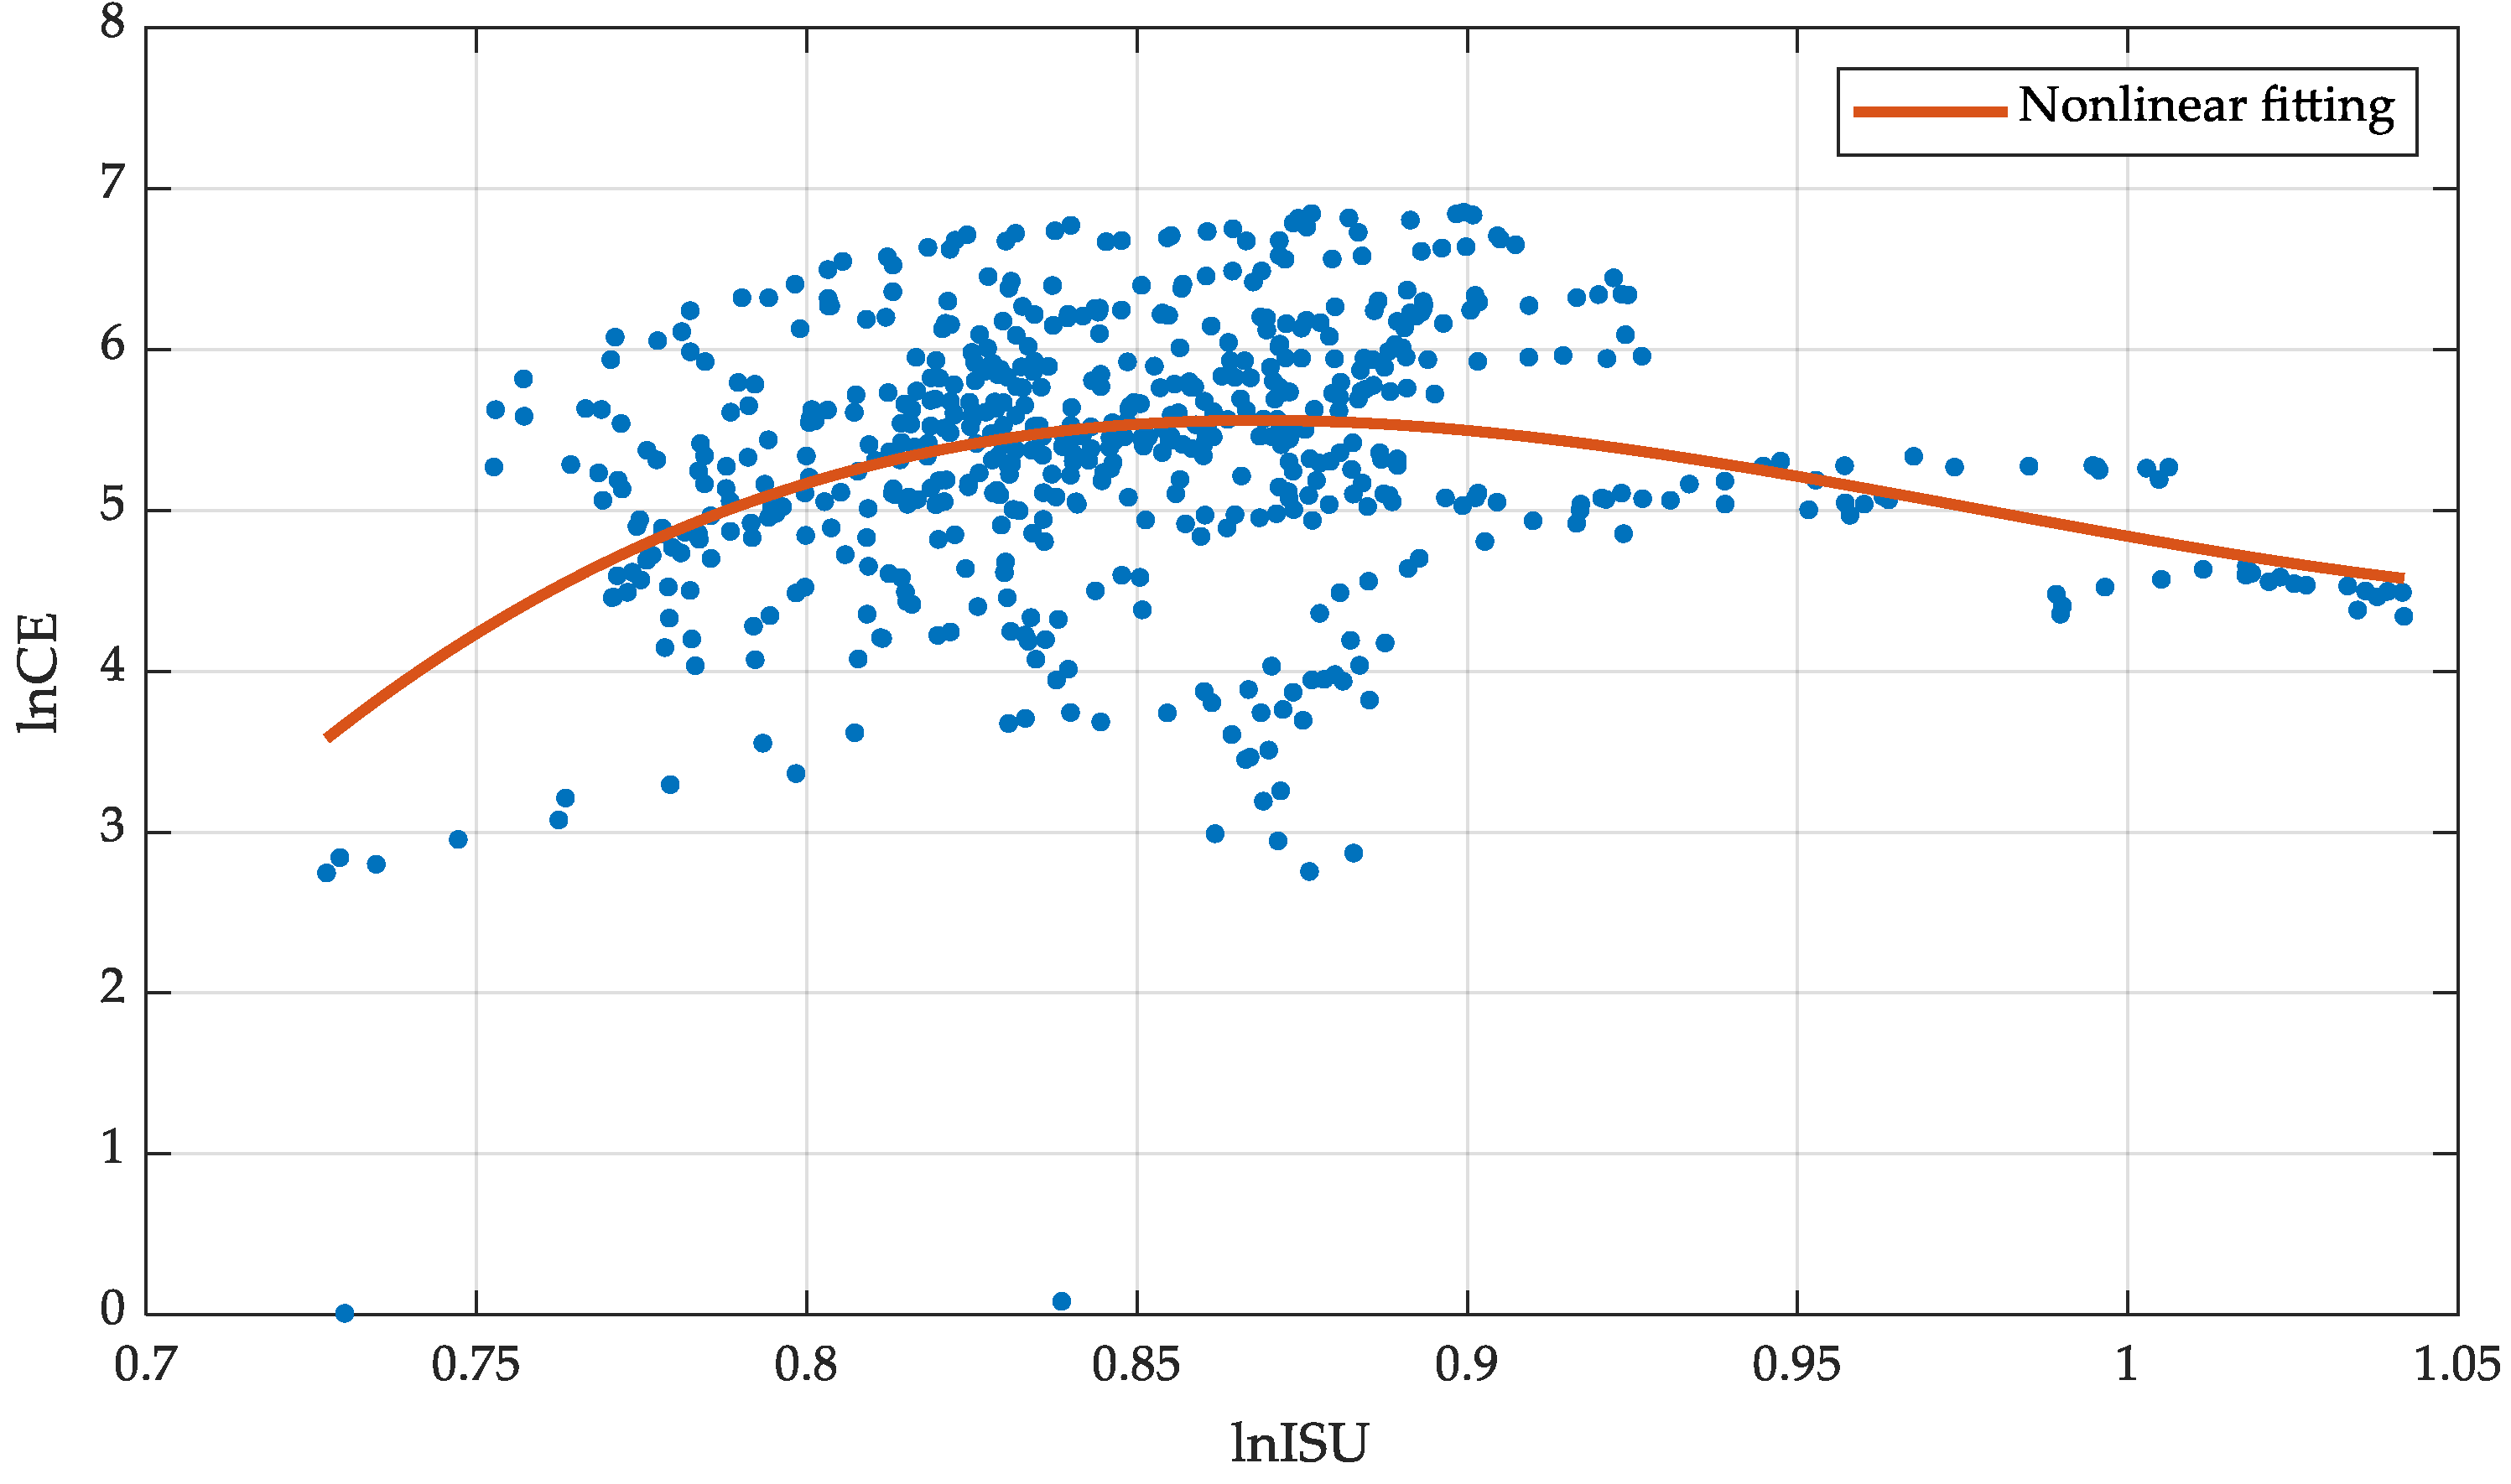
In order to study the relationship between ISU and CO
2 emission, we created scatterplots of
lnCE and
lnISU. From
Figure 3, it can be found that the scatterplot as a whole shows a cloudy distribution with no obvious linear trend, which is visual evidence that
lnCE and
lnISU may be nonlinearly related. The polynomial nonlinear fitting image is also provided in
Figure 3 and it can be seen that the CO
2 emissions increase and then decrease with the level of ISU.
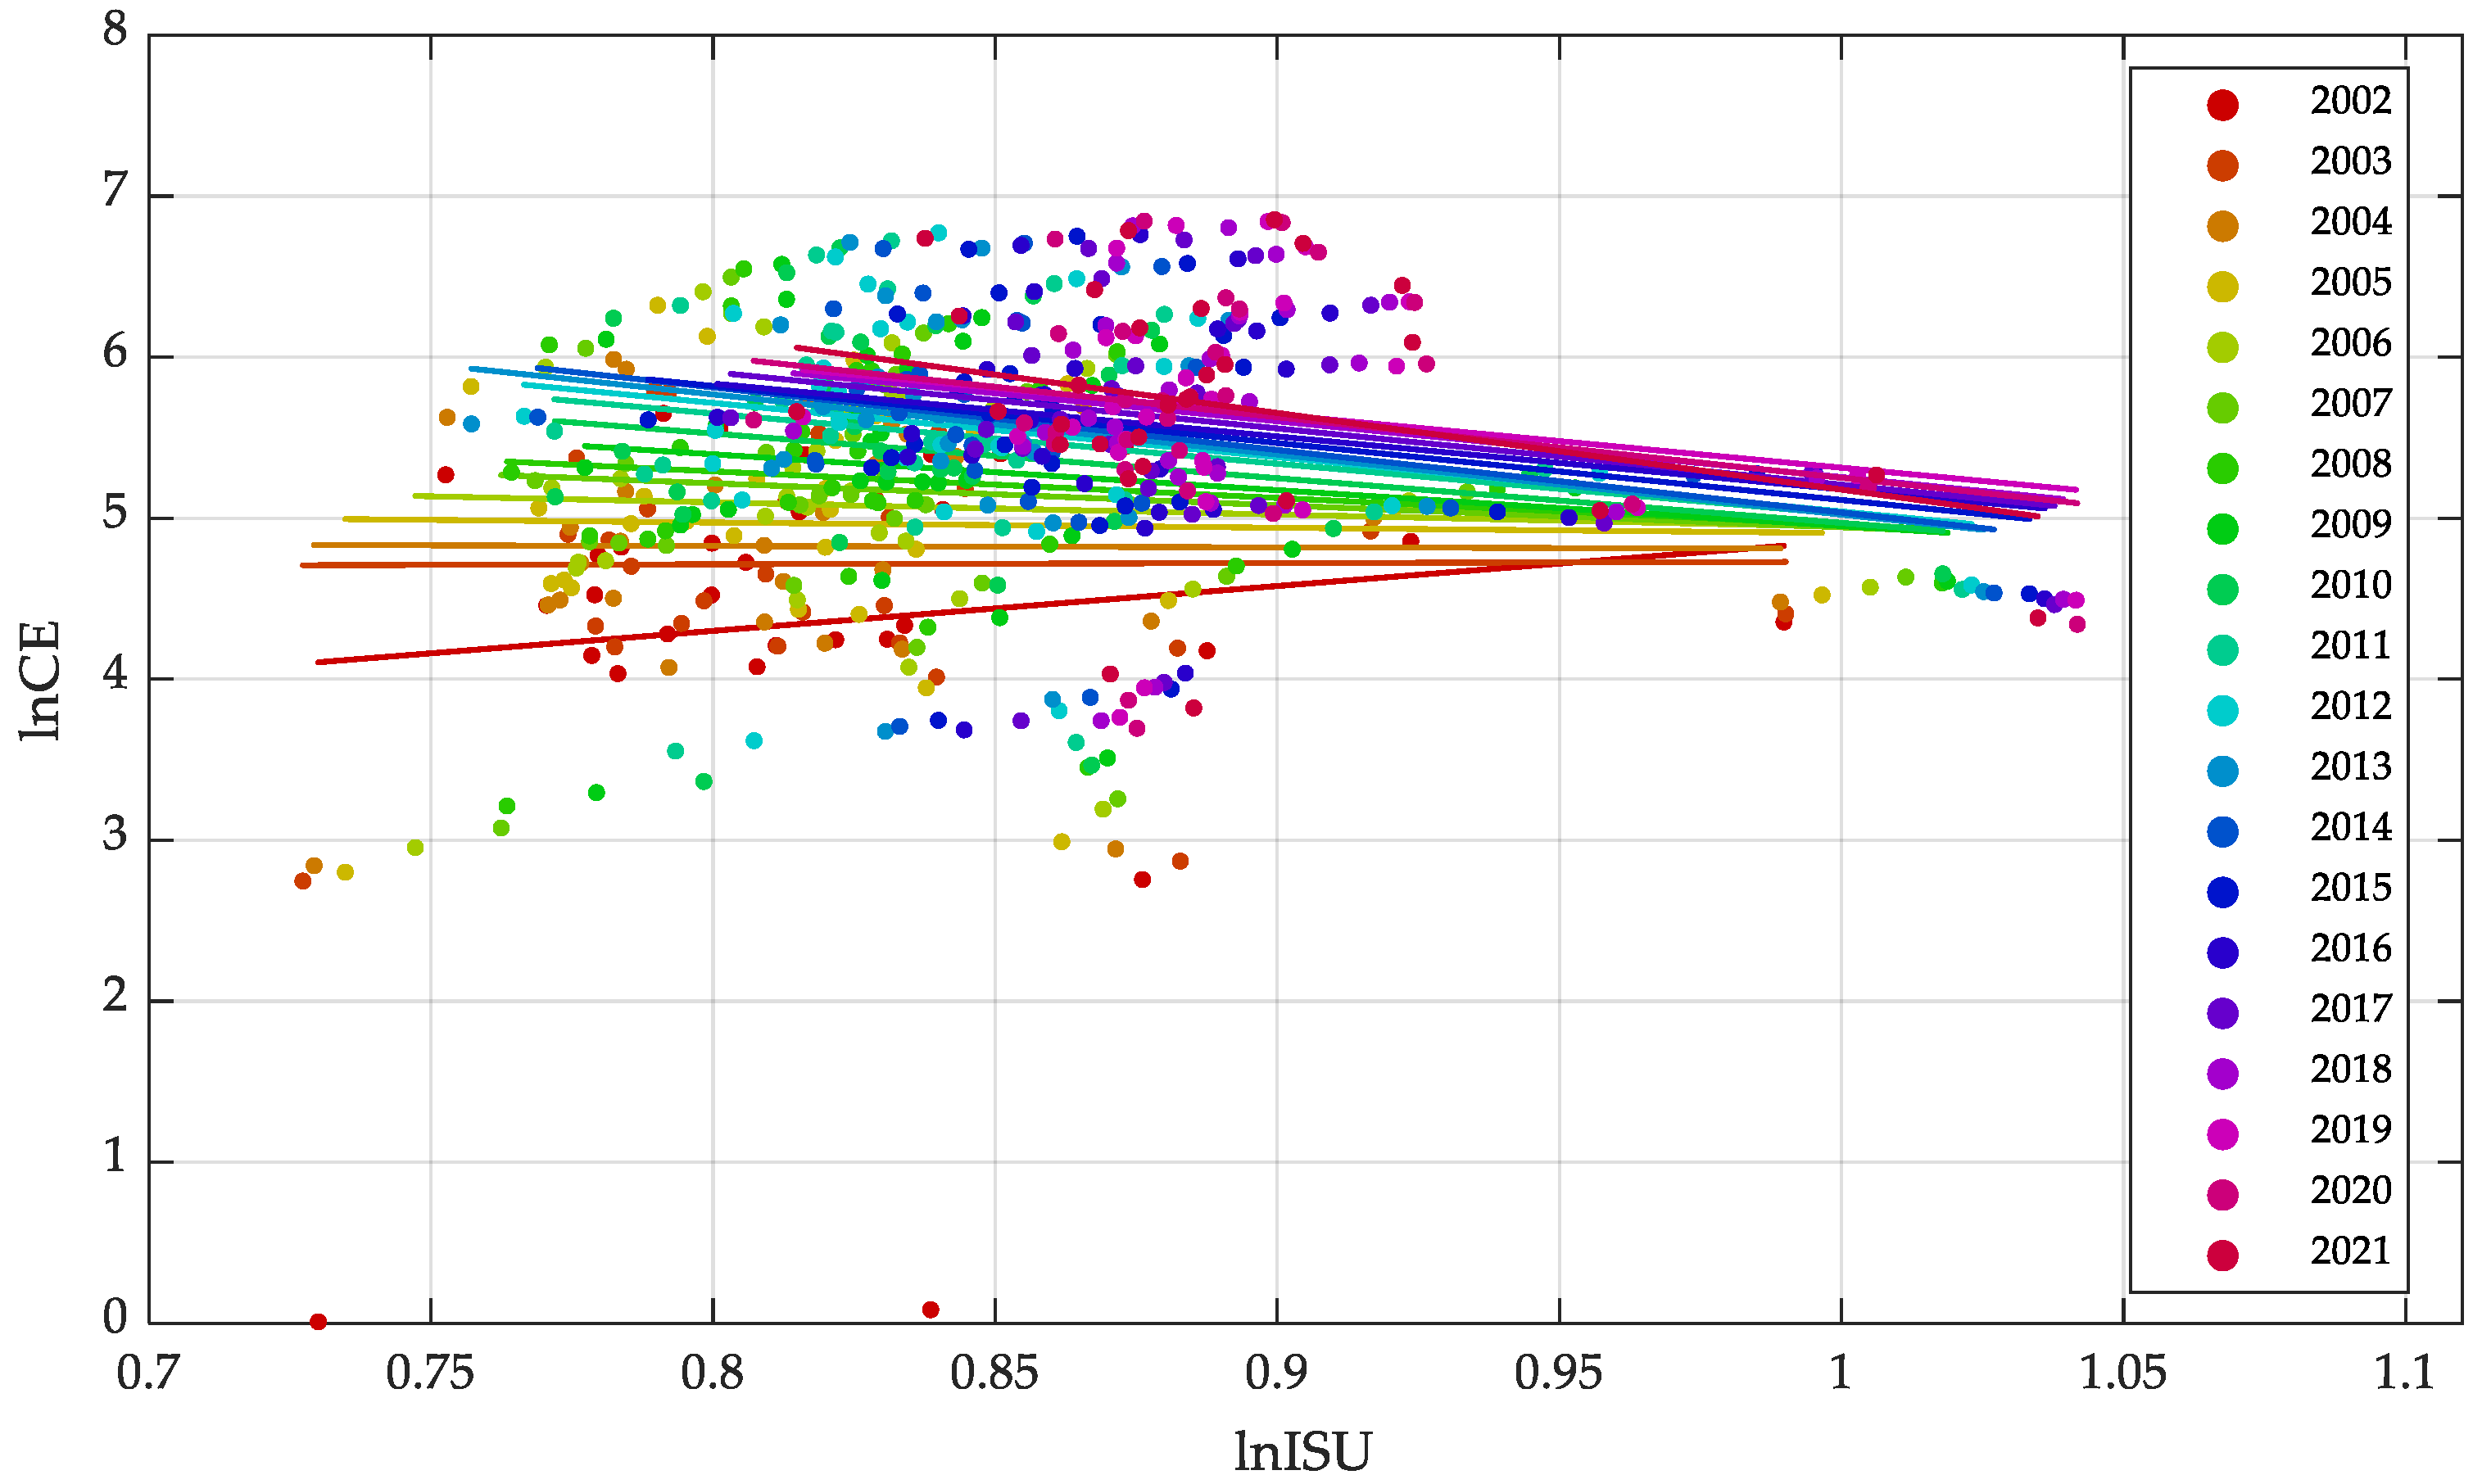
Taking into account the characteristics of the panel data, we further grouped the data according to time to draw scatterplots and performed linear fitting on the scatterplots for different time groups to obtain
Figure 4, so as to observe whether the relationship between industrial structure upgrading and carbon emissions is consistent at different times. The reason for choosing linear fitting for data grouped according to different times is that, compared with nonlinear fitting, its slope can reflect the variable change rate, is easier to interpret, which can intuitively present the relationship between
lnISU and
lnCE, and is convenient for comparing the time differences and change trends of variable relationships among different groups.
As can be seen from
Figure 4, there are obvious differences in the slopes of the fitted straight lines for different time groups and certain regularities can be observed. During the period from 2002 to 2021, the slope of the straight line continuously decreases, changing from positive (2.7851 in 2002) to negative (−4.7601 in 2021). This indicates that in the early year groups, CO
2 emissions tended to increase with the ISU. However, as time went by, this positive correlation weakened. The slope of the straight line fitted for the later year groups turn negative, suggesting that with the ISU in the later stage, CO
2 emissions will decrease and that this negative correlation is continuously strengthening.
Figure 4 shows that the relationship between ISU and CO
2 emissions is not static, but has an obvious change trend over time and the establishment of a panel model with time-varying coefficients can capture this time dynamic well.
3.2.2. Fixed-Effects Analysis
When studying the impact of ISU on CO2 emissions, different regions (individuals) possess unique geographical locations, resource endowments, industrial bases, and structural characteristics. These features may not change significantly over time, but will have an impact on the relationship between CO2 emissions and ISU. The introduction of individual fixed effects can capture the influence of these complex regional factors that are difficult to calculate. Meanwhile, time fixed effects can capture the impact of some common factors that change over time on the relationship between CO2 emissions and ISU, such as the macroeconomic environment and unified environmental policies. For example, during a period when the state vigorously promotes energy conservation and emission reduction policies and a period without such policies, the degree of impact of ISU on CO2 emissions may be different. The introduction of time fixed effects can effectively control the interference of time trends on the research.
To further determine whether it is necessary to include individual fixed effects and time fixed effects, this paper conducts an F-test. An F-test determines the actual significance of the individual and time factors in the data in this study by comparing the goodness-of-fit of the model under different settings and, thus, determines whether it is necessary to include fixed effects, which can provide a basis for the model setting in a statistical sense. The results of the test are shown in
Table 2.
It can be seen from
Table 2 that, for the given significance level of 0.05, the P-values of the three F-tests are all less than 0.05 and the null hypothesis on establishing a pooled model is rejected. Therefore, the fixed-effects model is more applicable to the data in this study. However, it is difficult to determine whether a single fixed-effects model (individual fixed-effects model or time fixed-effects model) or a two-way fixed-effects model should be established solely based on the test results in
Table 2. In this paper, the R-squared, adjusted R-squared, Akaike Information Criterion (AIC), and Bayesian Information Criterion (BIC) of the three models are presented in
Table 3.
From
Table 3, it can be found that the two-way fixed-effects model considering both individual fixed effects and time fixed effects has the largest R-squared and adjusted R-squared and the smallest AIC and BIC, which has a better fitting effect than other single fixed-effects models and can reduce the omitted-variable bias compared to the models that do not consider the fixed effects or consider the unidirectional fixed effects only. Therefore, this paper will adopt the two-way fixed-effects model to study the relationship between industrial structure upgrading and carbon emissions.
3.3. The Impact of China’s Overall ISU on CO2 Emissions
A panel data model with time-varying coefficients and two-way fixed effects is established to capture the dynamics of the effect of ISU on CO
2 emissions. Using the LLDVE approach, we estimate the unknown coefficients.
Table 4 displays the results.
The estimated coefficients of lnISU are positive and then negative and continue to decline. In 2002, industrial structure upgrading significantly increased carbon emissions, then ISU did not have a significant impact on carbon emissions during 2003–2015, but after 2016, China’s ISU has been able to significantly suppress CO2 emissions, which contributes to the realization of carbon emission reduction targets. Regarding the control variables, economic development consistently has a positive association with CO2 emissions. Urbanization has significantly reduced CO2 emissions since 2010, whereas population density consistently amplifies these emissions. Notably, foreign direct investment does not appear to have a substantial impact on CO2 emissions.
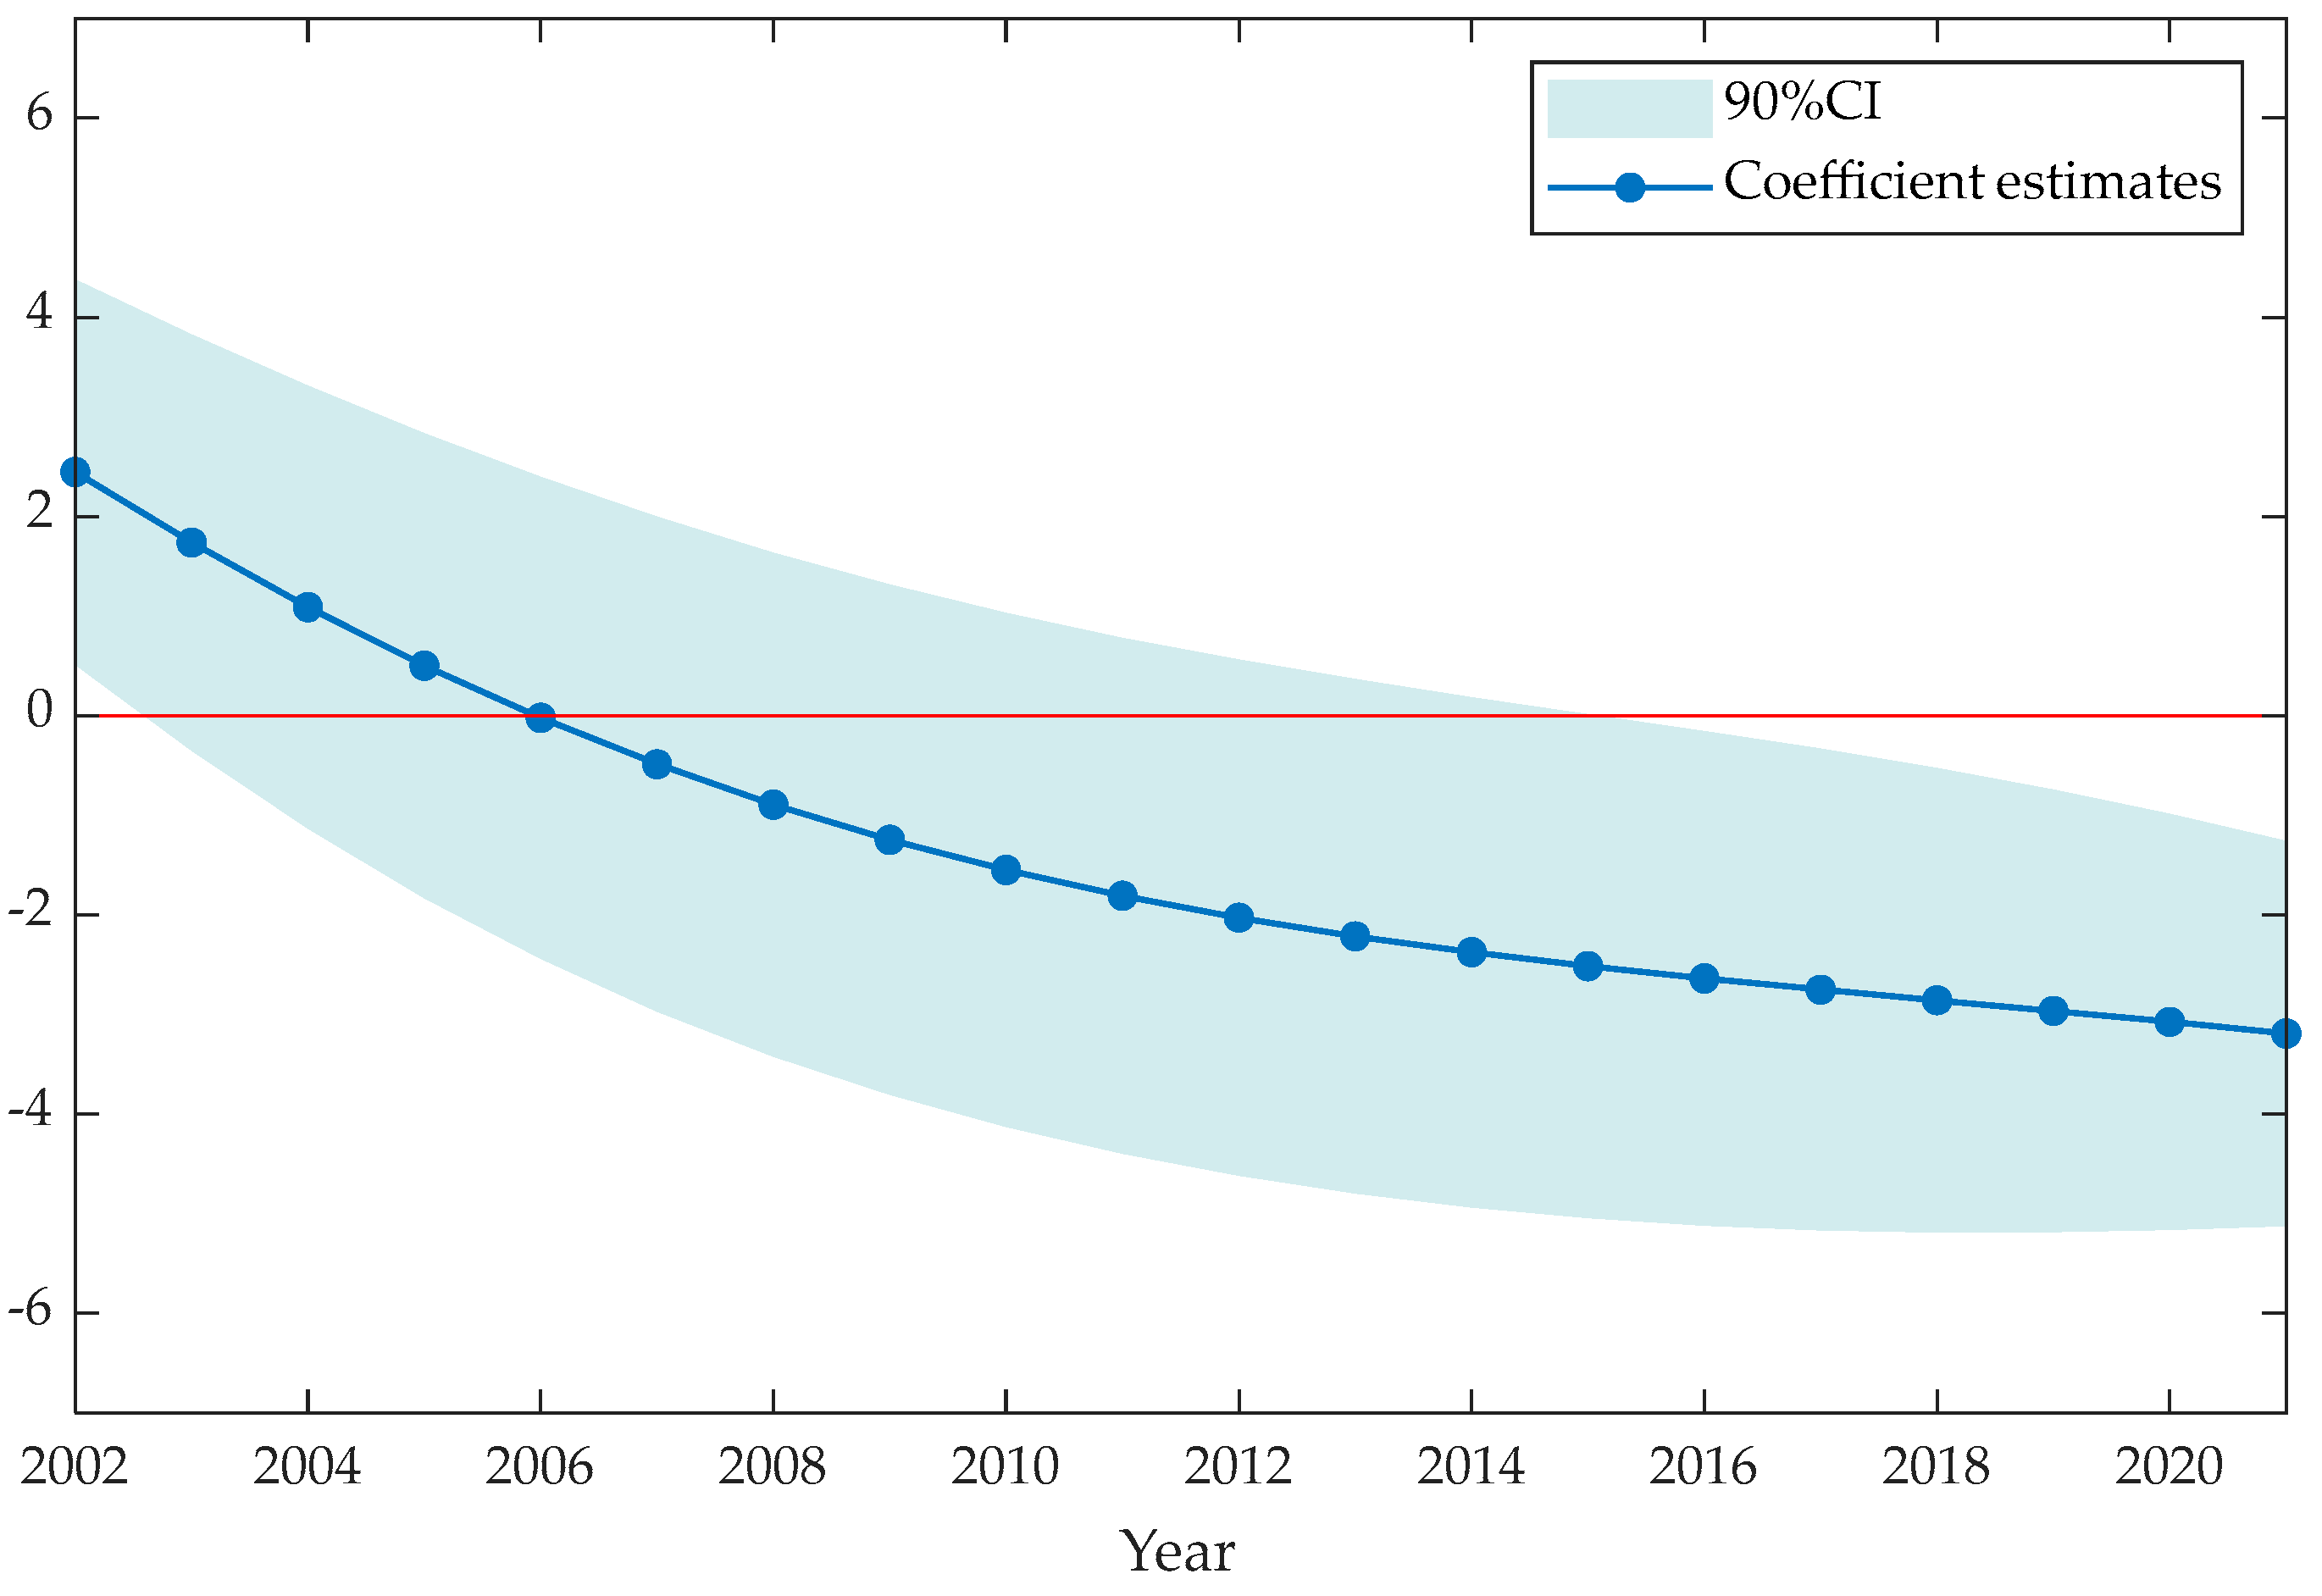
To provide a more intuitive understanding of the dynamic relationship between CO
2 emissions and ISU, the coefficient estimation findings are further visualized.
Figure 5 presents the estimated coefficients of
lnISU, along with their 90% confidence intervals.
The coefficients of
lnISU reveal an overall decreasing trend from 2002 to 2021, which reflects the weakening of the promotional effect and the strengthening of the inhibitory effect on CO
2 emissions. These two effects work together to produce this tendency. Combined with the change process of the industrial structure described in
Section 4.1, the coefficient of
lnISU can be analyzed in regard to three time periods.
From 2002 to 2005, China’s industrial structure was in the first stage, characterized by prominent structural contradictions. Specifically, in 2004, the tertiary sector’s contribution to China’s GDP was 40.7%, lagging 10.4 percentage points behind the average in peer middle-income countries [
31]. Furthermore, the swiftly expanding secondary sector was largely dominated by energy-intensive industries, such as steel and chemical sectors. Although these industries could bring about rapid economic development in the short term, they did so as a result of significant resource consumption and caused severe environmental damage, leading to increased CO
2 emissions. The promotional effect of ISU on CO
2 emissions was dominant at this point, resulting in a positive estimated coefficient.
From 2005 to 2015, China experienced a moderate level of industrial progression, coinciding with a strategic shift towards prioritizing the growth of the tertiary sector. Meanwhile, a series of policy documents were issued to emphasize the promotion of industrial–technological upgrading and the transformation of economic growth models. There was a strong push to develop the tertiary sector, especially the modern service industry, to regulate the scale of expansion of energy- and resource-intensive heavy industries and to resolve the issue of excess capacity in certain industries [
32]. During this period, the promotional impact of ISU on CO
2 emissions declined, while an inhibitory effect emerged and strengthened over time. However, the statistical analyses conducted during this period revealed that the difference between these two effects was not significant, yielding coefficient estimates that failed to achieve statistical significance.
Since 2016, the ISU in China has entered the second stage, characterized by the pattern of “tertiary–secondary–primary” industries. During this period, pivotal emerging sectors and high-tech industries in China experienced rapid growth, facilitating the transformation of industrial development towards pathways characterized by green, low carbon, and circular resource utilization. Throughout the process, the industrial structure’s inhibitory effect on CO2 emissions grew stronger and took center stage. Therefore, the estimated coefficients of lnISU after 2015 were significantly negative, indicating that ISU can significantly inhibit CO2 emissions.
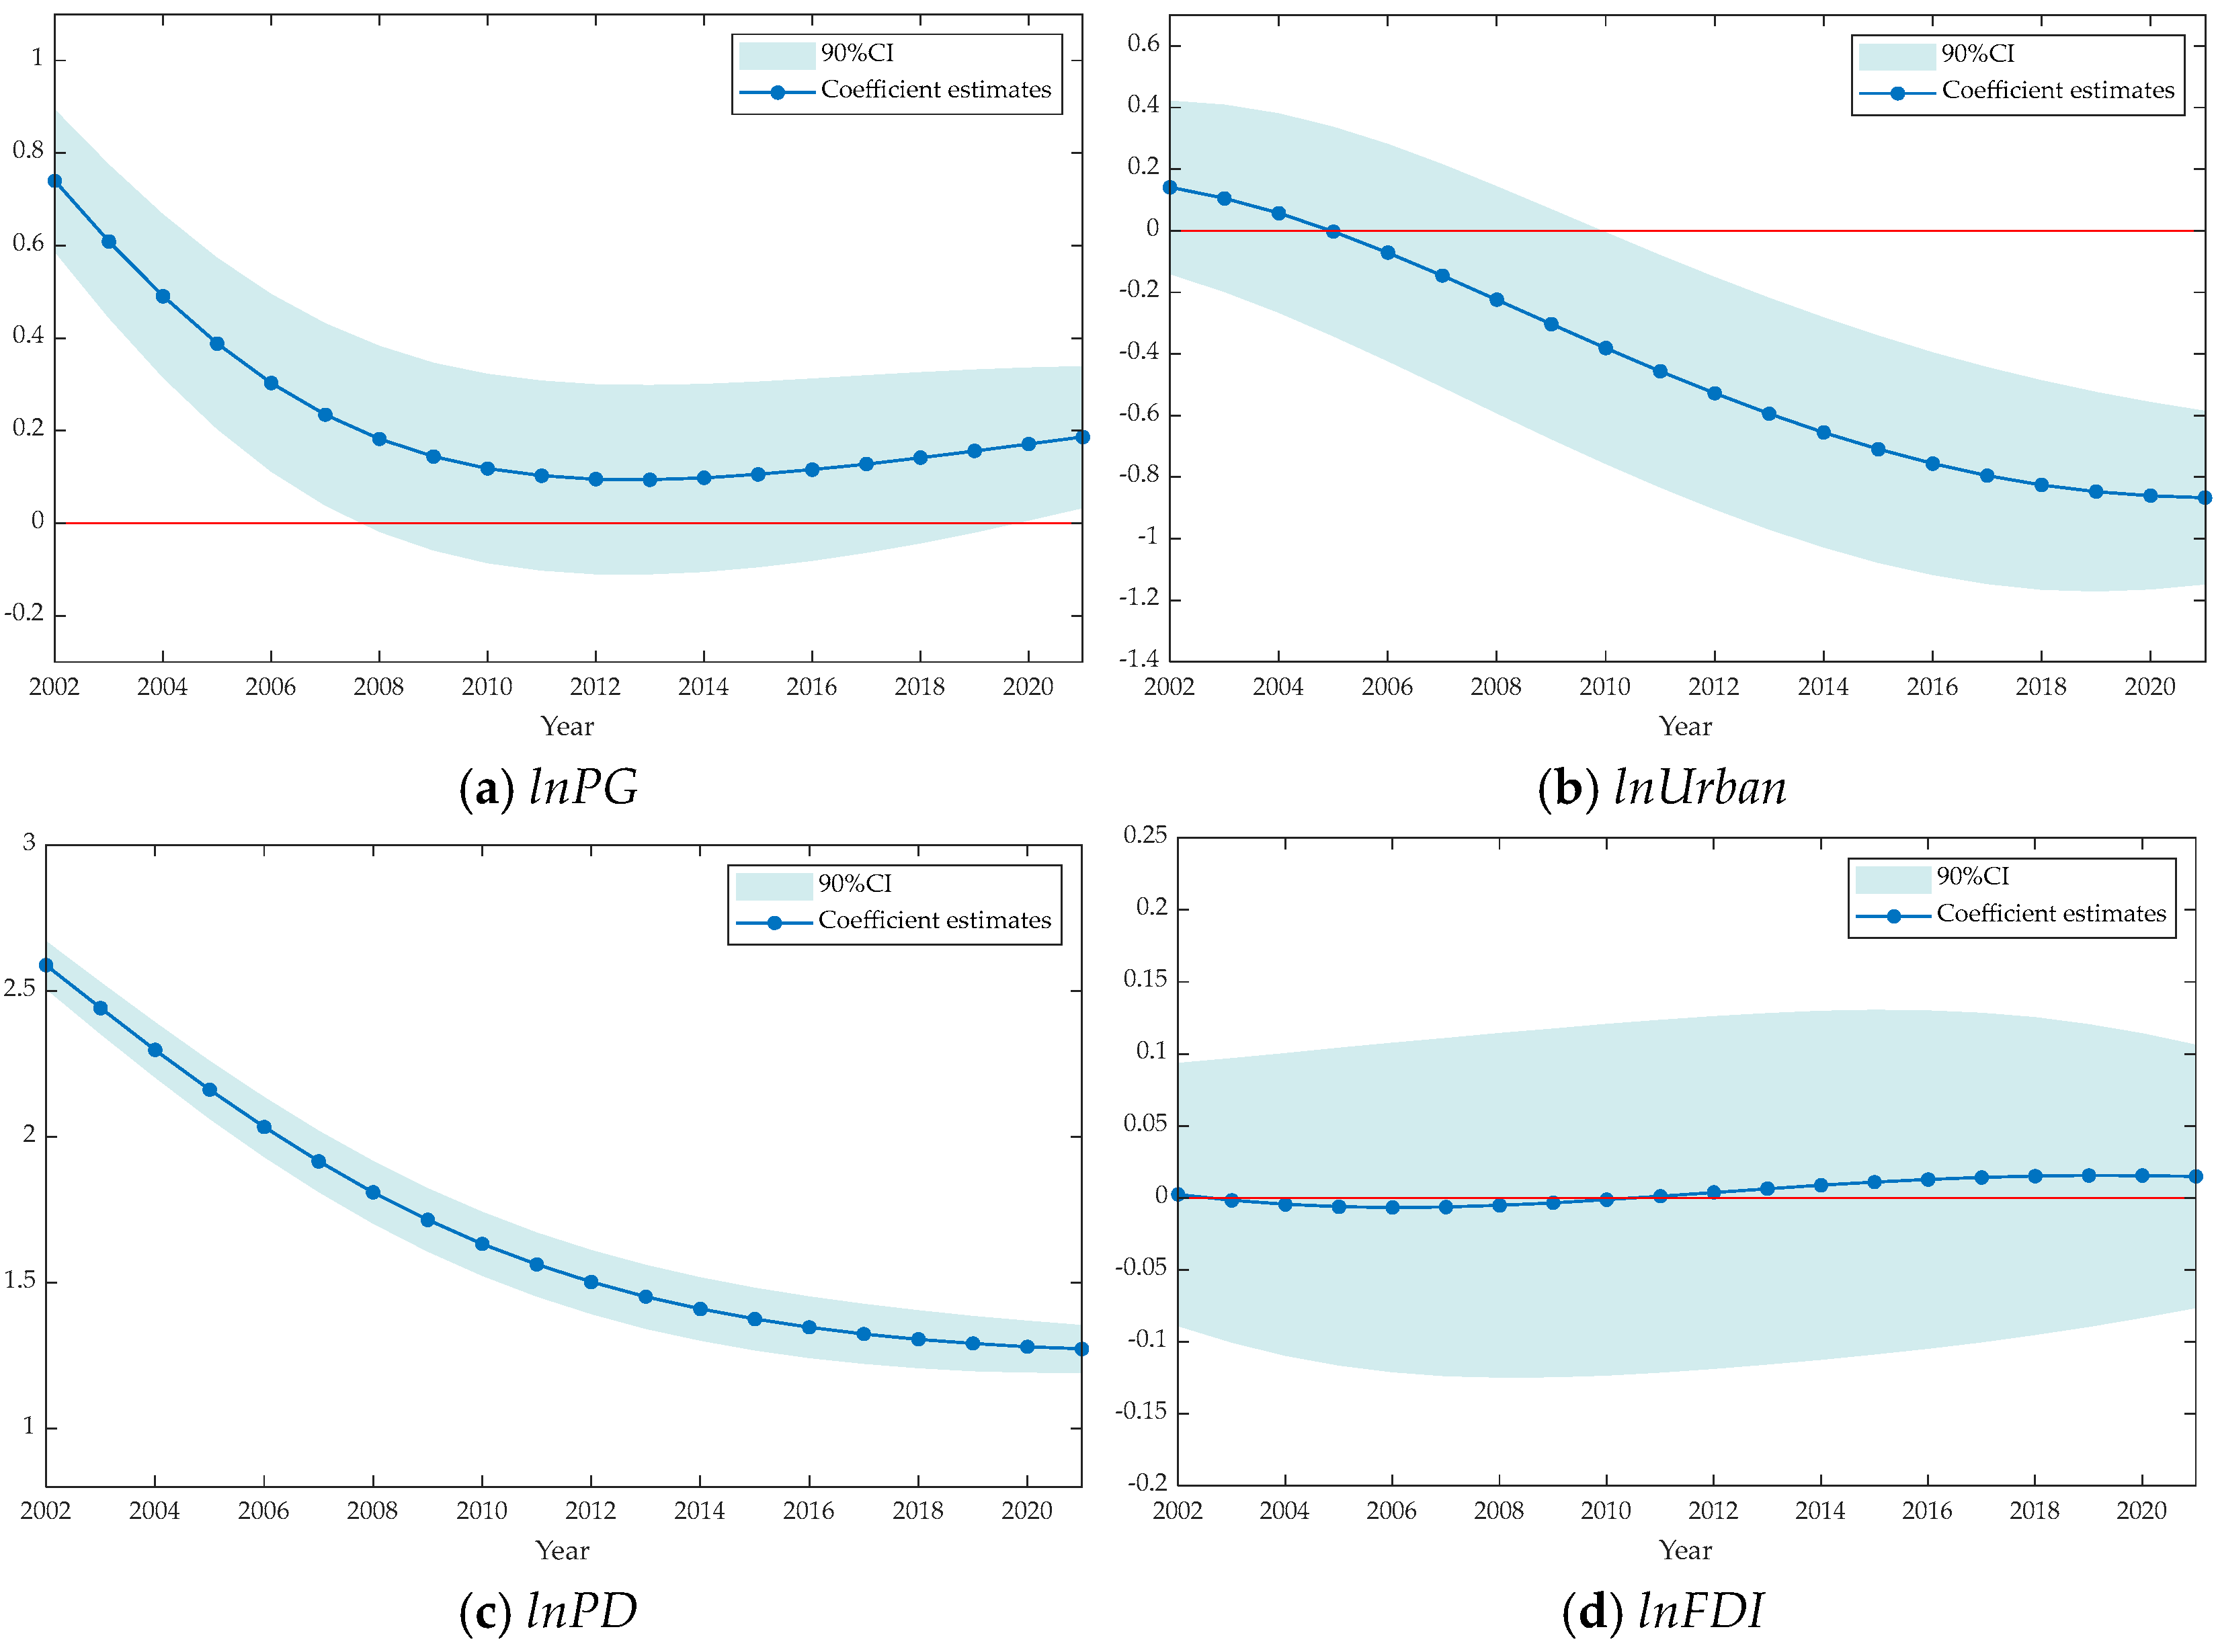
Figure 6 presents the estimated coefficients of the control variables and their 90% confidence intervals.
Between 2002 and 2021, the estimated coefficient of lnPG remained consistently positive, indicating that the expansion of China’s economy has generally led to an increase in CO2 emissions. This trend is attributable to the rapid economic growth experienced by China in the 21st century, which has resulted in heightened energy demand and corresponding increases in CO2 emissions. However, this increasing trend began to decline from 2002 to 2008 because during that time China was actively transitioning its economic development model and vigorously promoting the transformation from the original extensive economic growth model to a resource-conserving model. Coupled with policy interventions, technological innovation, and increased public awareness, the effect of the economic development level in terms of increasing CO2 emissions was significantly reduced. Then, the 2008 global financial crisis had a profound influence on the world economy, slowing down China’s economic growth and weakening PG’s increasing effect on CO2 emissions, until the Chinese economy rebounded slightly after 2013.
The estimated coefficient of
lnUrban was positive from 2002 to 2004, but the results were not significant. The estimate coefficient turned negative in 2005 and became positive after 2009, indicating that a higher level of urbanization is more conducive to reducing CO
2 emissions. This may be due to the promotion of resource sharing and optimization during the process of urbanization [
33,
34]. The improved energy efficiency resulting from scale and agglomeration effects is much higher than the increased energy consumption caused by a growing urban population, leading to a long-term significant inhibitory effect on CO
2 emissions.
The estimated coefficient of lnPD is significantly positive and shows a decreasing trend, indicating that CO2 emissions increase proportionally with the population density. This is probably due to the fact that more energy is needed to support residential, industrial, commercial, and transportation activities when the population density rises, leading to the increased consumption of fossil fuels and, thus, higher CO2 emissions. However, as environmental awareness among people increases and policy planning takes effect, individuals, businesses, and governments in heavily populated regions begin actively encouraging the growth of low-carbon economies and lifestyles in cities, which leads to a weakening of the increasing effect of population density on CO2 emissions.
The estimated coefficient of lnFDI is relatively small and insignificant overall, suggesting that FDI has no discernible effect on CO2 emissions. On the one hand, FDI brings advanced production technologies and environmental management experience, enabling enterprises in the recipient country to lower their CO2 emissions per unit of output and increase their energy consumption efficiency. On the other hand, foreign-funded enterprises generally tend to establish new factories and expand the scale of production in the recipient country, which increases energy consumption and causes CO2 emissions to rise. One possible explanation for the insignificant coefficient estimate of FDI is that the rate at which technological spillovers reduce CO2 emissions is comparable to the rate at which the growth in the industrial scale increases CO2 emissions.
3.4. Heterogeneity Analysis
Given China’s uneven regional economic growth, there are spatial disparities in regard to both the ISU and the intensity of the CO
2 emissions. The following is a regional exploration of the relationship between these two aspects. Based on the statistical system and classification standards issued by the National Bureau of Statistics of China, 30 provinces can be categorized into four major regions, namely east, central, west, and northeast, according to their geographical location and economic development level. These regions include 10, 6, 12, and 3 provinces (municipalities), respectively [
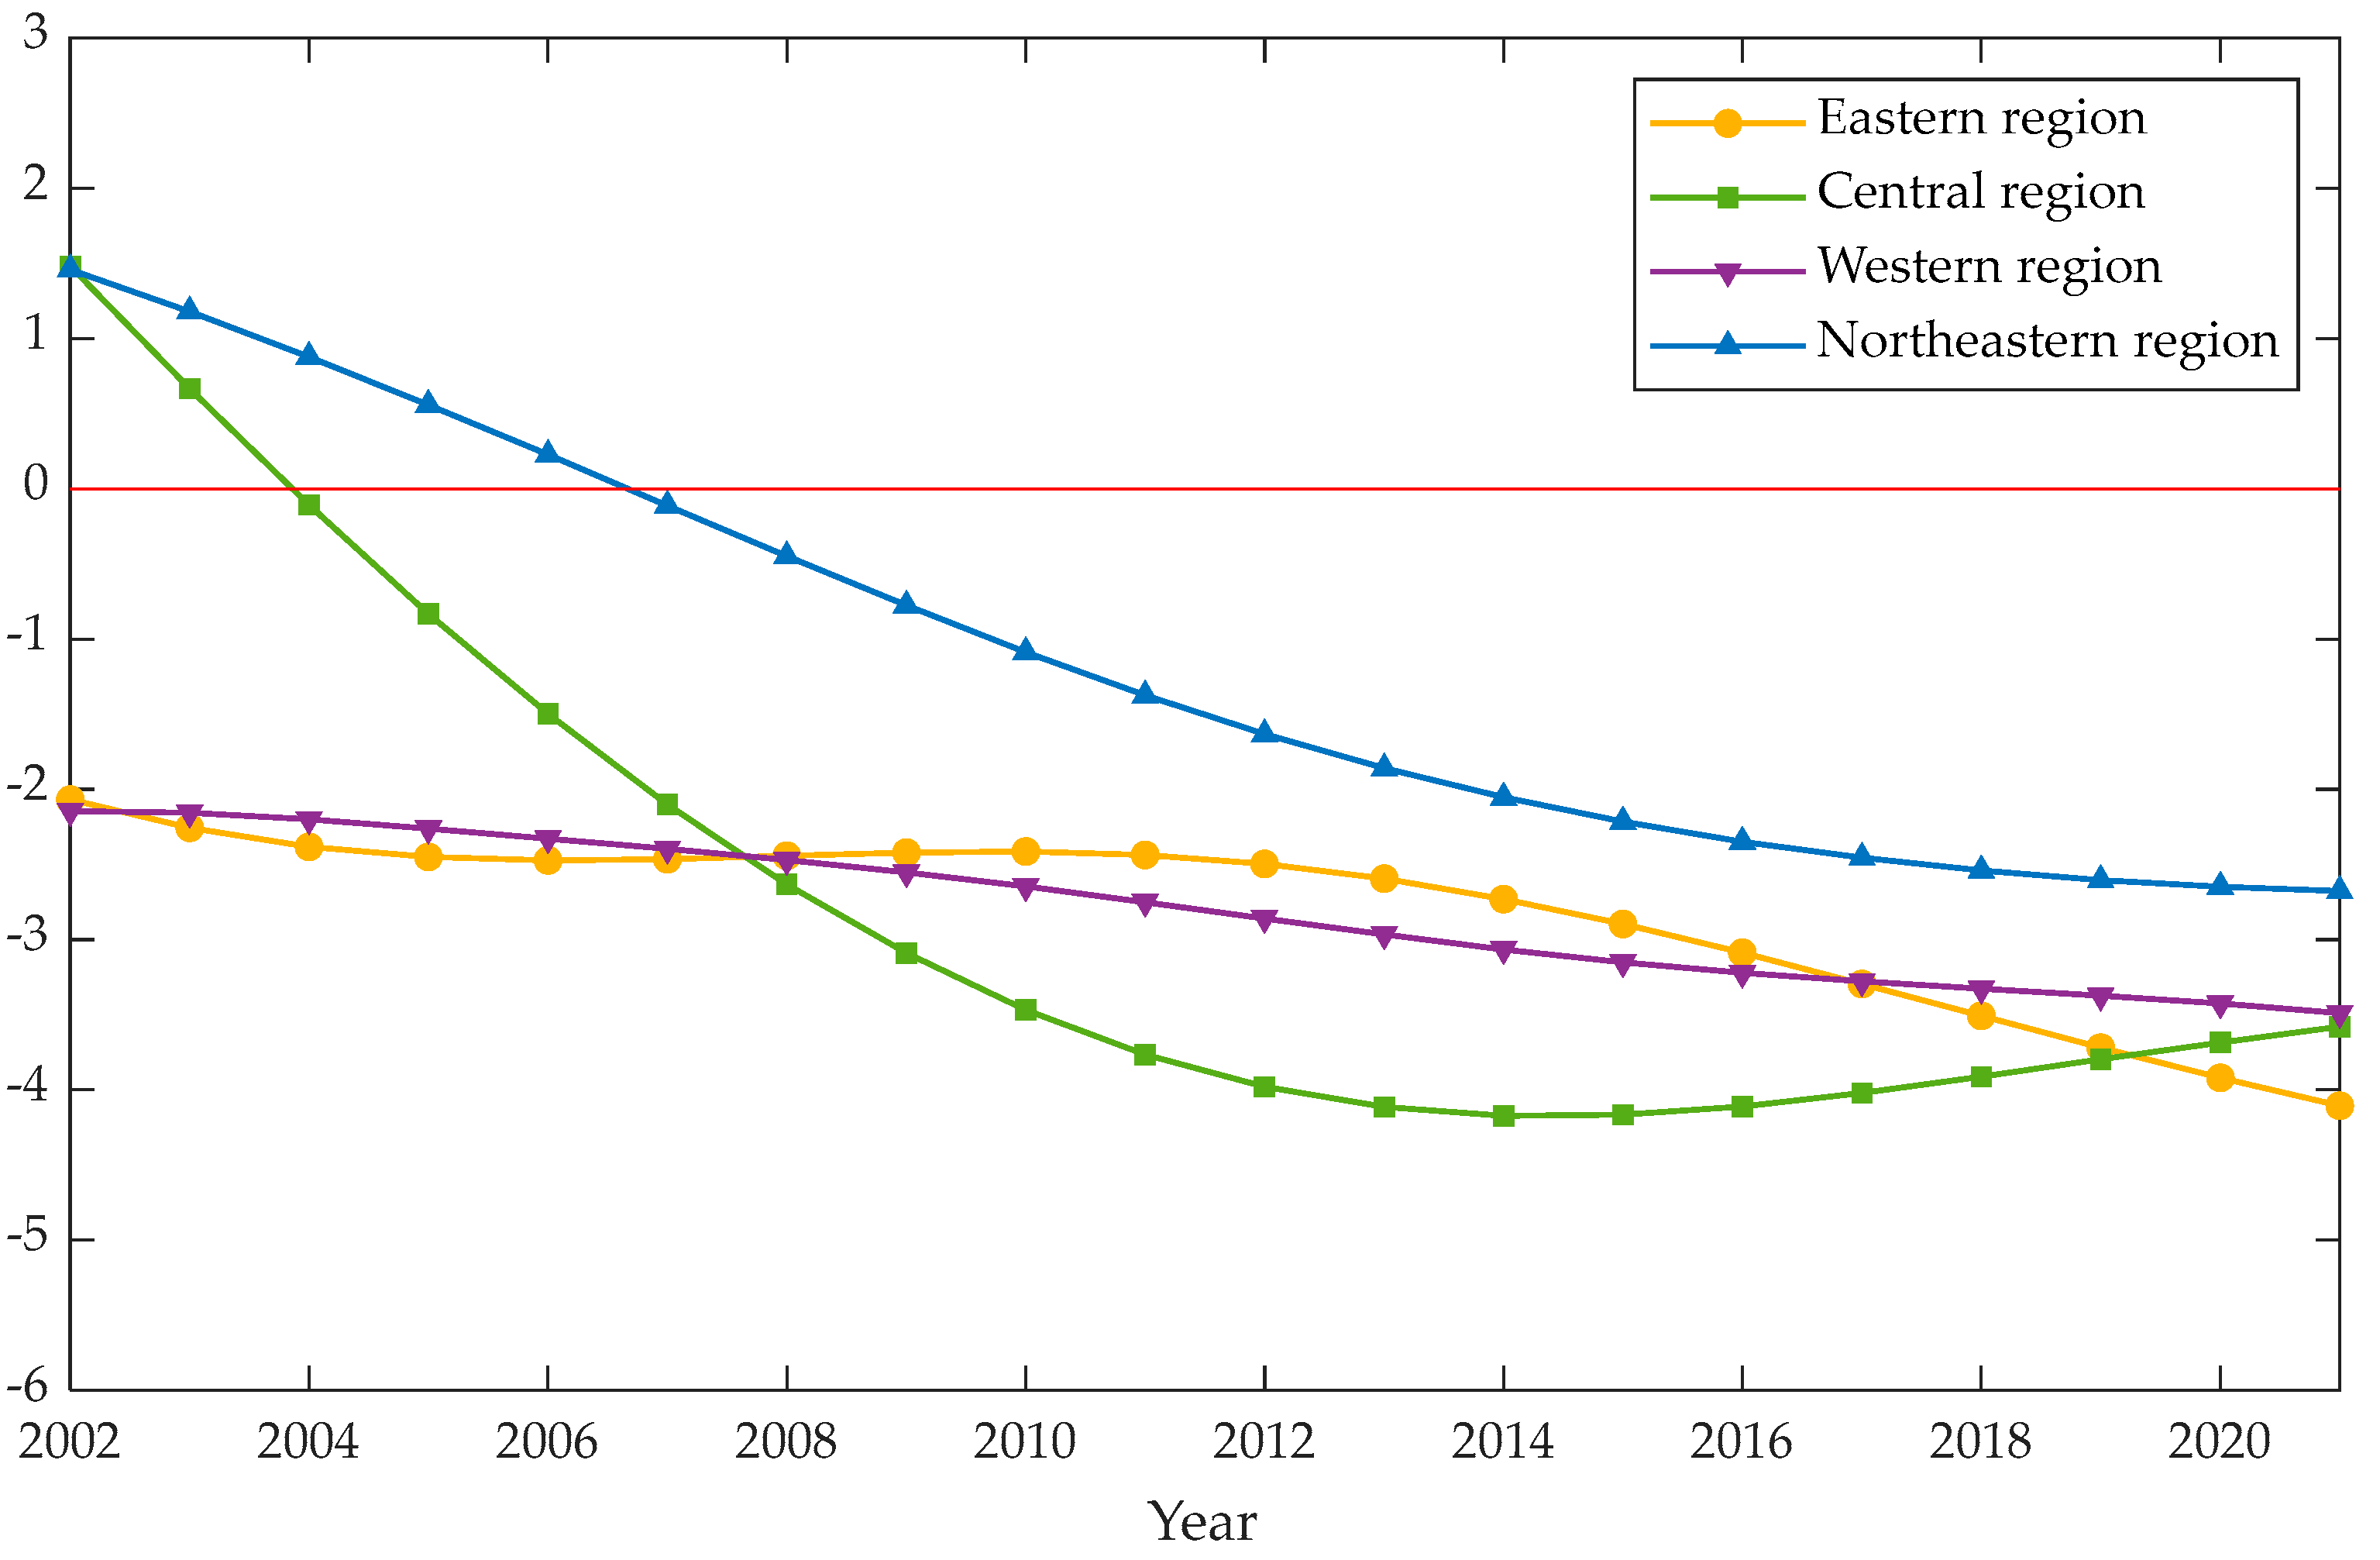
35]. Regional modeling yields the estimated coefficient change chart for
lnISU in these four major regions, as shown in
Figure 7.
The estimated coefficient of
lnISU in the eastern region fluctuated and generally decreased from 2002 to 2021, consistently remaining negative. This indicates that ISU in the eastern region has an inhibitory effect on CO
2 emissions, with the effect tending to increase over time. The eastern region, leveraging the industrial advantages of the deltas, as well as its geographical proximity to major ports, has historically been the leading province in China in regard to economic scale and industrial advancement [
36]. However, the eastern region also faces challenges, such as resource pressure, environmental pressure, and population mobility. In 2008, the global financial crisis occurred and the eastern region, which was highly involved in the international division of labor, was hit first and hardest. The manufacturing and foreign trade industries were significantly affected and the economy fell into recession, so the inhibitory effect of the ISU on CO
2 emissions also weakened after 2008. After 2011, driven by environmental policies, the downward trend in the estimated coefficients of
lnISU resumed, further propelling the economy towards sustainable development.
The estimated coefficient for the upgrading of industrial structures in the central region generally resembles an inverted “U” shape, showing a trend that initially promotes and then suppresses CO
2 emissions. In 2002 and 2003, the coefficient of the
lnISU in the central region was positive, which may be due to the fact that the central region is a major producer of grains, cotton, and oils in China, and the primary industry’s percentage in regard to other industries is more than China’s average, resulting in a relatively low overall industrial structure level. This is coupled with the situation that the central region’s industrial structure primarily concentrates on resource extraction and rough processing, which involve serious environmental pollution and resource waste. Therefore, at the initial stage of ISU, its impact on CO
2 emissions is mainly promotional. A number of policies were put into place for the six provinces in the central region after the Chinese central government’s work report from 2004 first recommended the Strategy for the Rise of Central China. This strategy achieved significant results, effectively driving economic development and industrial transformation in the central region, thus causing the estimated coefficient of the
lnISU to rapidly decrease and turn from positive to negative. The percentage share of the tertiary sector decreased in the central area around 2013, while the secondary industry overexpanded, causing issues such as industrial overcapacity, debt crises, and environmental degradation, which became significant obstacles to the upgrading of the industrial structure [
37]. Consequently, the coefficient rebounded in 2014–2021 and the inhibitory effect of the ISU on CO
2 emissions was reduced.
The overall trend of the estimated coefficient of lnISU in the western region is very similar to that of the eastern region, showing a fluctuating decline and always remaining negative. This is because of the western region’s abundance of resources and widespread market and, as early as 1999, the Strategy for Large-scale Development of Western China was implemented and the western region improved in regard to infrastructure construction, strengthened its ecological networks, and adjusted its industrial structure in accordance with its own resource endowment, so that in 2002 its industrial structure had surpassed that of the central and northeastern regions. Hit by the financial crisis in 2008, the western region took over a large number of labor-intensive industries from the east, but because of the western region’s very low degree of outward economic orientation, the impact of the financial crisis was smaller overall. Therefore, the coefficient of lnISU in the western region had a smaller fluctuation amplitude compared to the eastern region, but it still showed an overall trend of gradually strengthening and then inhibiting CO2 emissions.
The estimated coefficient of lnISU in the northeast region is the largest among the four regions and the latest to turn from positive to negative. This may be due to the fact that the northeastern region, as an old industrial base, has absolute dominance in terms of the secondary industry in regard to its industrial structure. Even though the tertiary sector’s share of the economy has grown recently, the growth rate has been slow. The region’s economic development has been excessively reliant on heavy industry and resource exploitation, making it among the regions in China with the highest CO2 emissions. The northeastern region faces significant challenges and difficulties in adjusting and transforming its industrial structure. To address these challenges, in 2003, China made a significant decision to implement a revitalization strategy for old industrial bases in the northeastern region and adopted a series of special measures to support the revitalization of enterprises in the northeastern region, including helping them transform and upgrade, introducing advanced technologies, and developing clean energy. Consequently, the estimated coefficient of lnISU in the northeast region has also been decreasing continuously and turned from positive to negative in 2007, following a similar trend to that of China as a whole.
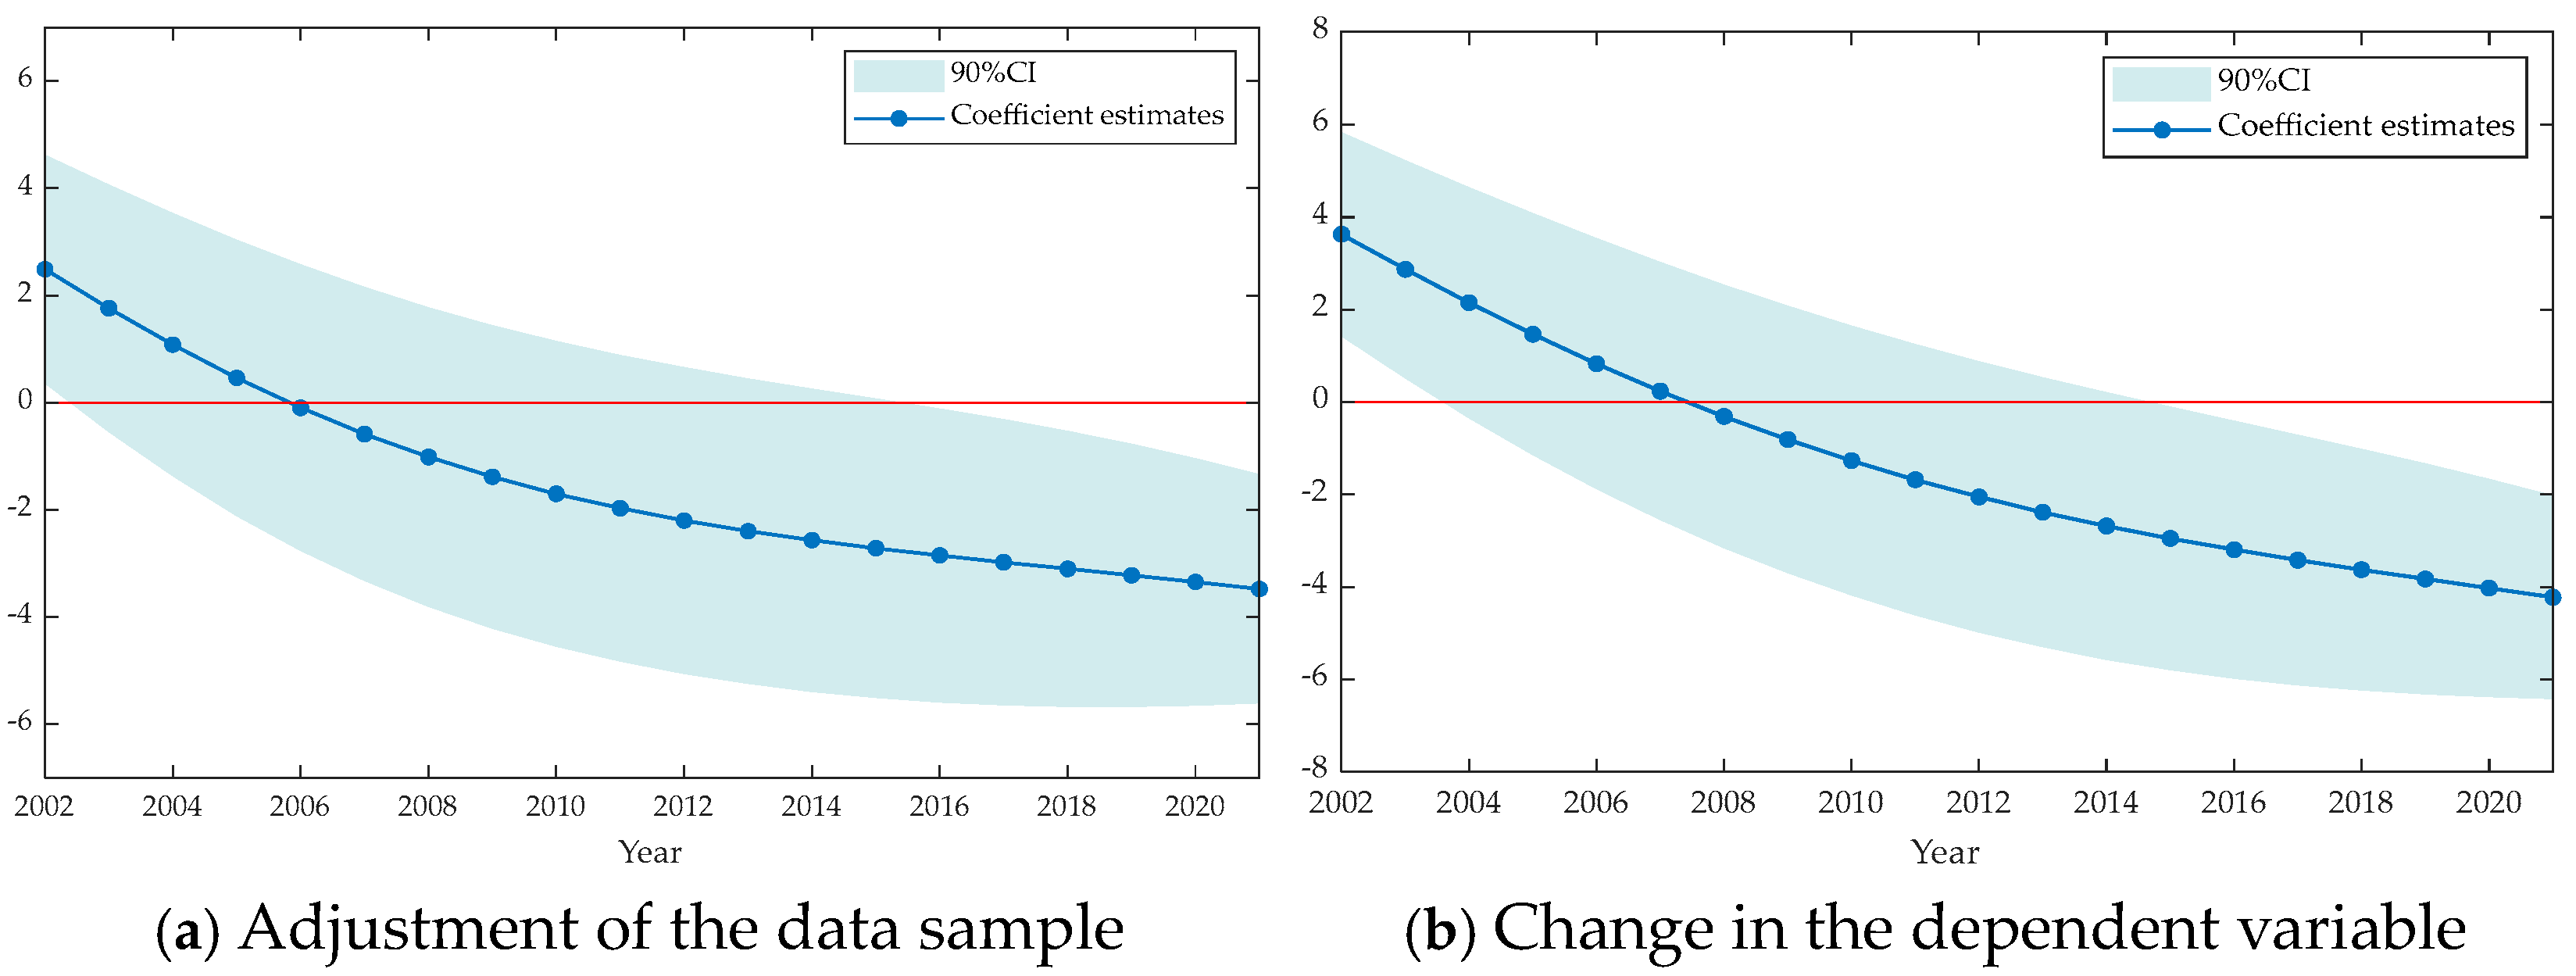
3.5. Robustness Test
The above empirical results are obtained after considering the necessary control variables and are robust to some extent. To further test the stability of this conclusion, this study conducts robustness checks from two aspects: adjusting the data sample and replacing the dependent variable.
3.5.1. Adjusting the Data Sample
Considering that the municipalities are leading in terms of the economic volume and have obvious location and economic and political advantages compared with other provinces, this research removes the samples from Tianjin, Chongqing, Beijing, and Shanghai from the municipalities and re-models the data.
Figure 8a presents the visualized graph of the estimated coefficients and the 90% confidence interval for
lnISU after adjusting the data sample. As is shown, the outcomes are generally consistent with
Figure 5. The estimated coefficient of
lnISU continues to decline from 2002 to 2021, turning from positive to negative in 2006 and becoming significantly negative after 2015. This indicates that the LLDVE results remain robust even after adjusting the data sample.
3.5.2. Replacing the Dependent Variable
The CO
2 emissions detailed above are obtained using the IPCC’s subsectoral emission accounting method. We use a performance-based accounting approach to reconstruct the dependent variable in order to further confirm the validity of our findings.
Figure 8b illustrates the estimated coefficients and 90% confidence intervals for
lnISU subsequent to this adjustment. It can be observed that the trend in the coefficient changes is also largely consistent with
Figure 5, suggesting that the estimation results remain robust after replacing the dependent variable.


