Article

Sustainability of Programming Education Through CDIO-Oriented Practice: An Empirical Study on Syntax-Level Structural Visualization for Functional Programming Languages

Department of Information and Computer Engineering, Chung Yuan Christian University, Taoyuan 320680, Taiwan
*
Author to whom correspondence should be addressed.
Sustainability 2025, 17(12), 5630; https://doi.org/10.3390/su17125630
Submission received: 26 May 2025 / Revised: 11 June 2025 / Accepted: 12 June 2025 / Published: 18 June 2025

Abstract

:
This study integrates the 2017 United Nations ESD framework and UNESCO’s ESD priorities with the Sustainable Development Goal (SDG) of “quality education” and the CDIO (Conceive, Design, Implement, Operate) framework to propose an innovative programming teaching model. A central component is an automatic architecture diagram generation system that visualizes program code structures in real-time, reducing cognitive load and enhancing comprehension of abstract programming concepts such as recursion and data structures. Students complete a project-based assignment—developing a Scheme interpreter—to simulate real-world software development. This model emphasizes system thinking, modular design, and problem solving, aligning with CDIO’s structured learning progression. The experimental results show that students using the system significantly outperformed the control group in their final project scores, demonstrating improved practical programming ability. While cognitive load remained stable, learning motivation decreased slightly, indicating the need for additional affective design support. The findings confirm that the integration of visual learning tools and project-based pedagogy under the CDIO framework supports the development of critical competencies for sustainable development. This approach offers a transformative step forward in programming education, cultivating learners who are capable, innovative, and ready to meaningfully contribute to global sustainability.

1. Introduction

In the field of programming education, the use of visual representations of program flow has been shown to be effective in helping beginners comprehend abstract grammatical structures and logical operations [1]. One early example is the TRAKLA2 system proposed by Malmi et al. [2], which enables students to interactively manipulate data structures (such as arrays, lists, and trees) and observe algorithm behavior through a graphical interface. This initiative marked a significant step in integrating visualization into programming instruction. Building upon this, Rajala et al. [3] incorporated automated feedback and real-time testing mechanisms into TRAKLA2, allowing learners to identify and correct errors during their operations. This advancement reinforced students’ conceptual understanding of algorithms and demonstrated that combining visualization with formative assessment can greatly enhance learning outcomes.
More recently, visualization technologies have advanced further. For instance, Dr. Scratch not only provides a graphical interface but also performs behavioral analysis and assesses computational thinking skills based on students’ learning processes. This development represents a shift from simple “instructional assistance” to “diagnostic feedback” [4]. In another study, Paredes-Velasco et al. [5] introduced the TutoApp platform, where students design teaching modules for their peers. This “learning-by-teaching” approach was found to improve comprehension of conditional logic and control structures, although the researchers noted that the absence of scaffolded guidance could impose additional cognitive load on learners.
Additionally, Venigalla and Chimalakonda [6] developed FlowARP, an augmented reality visualization tool designed to demonstrate program flow. A user study involving 44 undergraduate students revealed that users solved code snippet-based problems more quickly when using FlowARP. In a similar vein, Hu et al. [7] integrated a visual debugger within an IDE to allow students to observe variable changes and control flow in real time, thereby enhancing their early-stage debugging and testing abilities.
In summary, the evolution of visual programming instruction has progressed from image-assisted learning to more interactive environments featuring automatic feedback and diagnostic support. This trend continues to move toward more strategic and context-sensitive applications. In terms of learning outcomes, Visual Programming Instruction (VPI)—especially when integrating flowchart tools with robotics—has been shown to significantly enhance students’ programming performance and fluency. These benefits are observed regardless of learners’ prior programming experience and are closely linked to increased motivation to pursue further learning [8,9].
At the level of conceptual understanding, visualization tools such as augmented reality and animated control flow diagrams help learners grasp abstract concepts like variables, conditionals, and recursion more effectively. They also reduce problem-solving time and enhance mastery of algorithmic logic [6,7]. Moreover, interactive and visually oriented learning environments (e.g., robot programming and AR-based platforms) have been found to increase student engagement and motivation, making programming more accessible and appealing [6,8,9].
The aforementioned studies primarily focus on introductory programming, especially the visual representation of programming syntax [10]. However, once students move beyond the beginner stage and face more advanced courses or assignments, their challenges shift from syntax comprehension to solving complex programming problems. Even with foundational knowledge in syntax, data structures, and algorithms, students may still struggle with advanced problem solving. This indicates that, in programming education, the core challenge lies not merely in understanding syntax but in applying learned concepts to practical real-world problems. The failure to cultivate such essential skills may hinder students’ problem-solving capabilities and, by extension, impede progress toward the Sustainable Development Goals (SDGs) [11].
SDG 4, “Quality Education,” specifically aims to promote educational equity and inclusion, while enhancing learners’ skills and literacy [12]. Programming—an essential problem-solving tool—is not only a fundamental technical skill but also a catalyst for achieving other SDG goals, such as smart cities, sustainable energy, and reduced inequality. Without effective programming education, students may struggle to meet the demands of a digital and sustainability-driven future, weakening society’s overall problem-solving and innovation capacities, and thereby hindering SDG progress [13].
To advance SDG 4, a practical educational framework that fosters comprehensive competencies is essential. The CDIO (Conceive, Design, Implement, Operate) framework offers an ideal structure to meet this need. CDIO emphasizes a student-centered approach that spans the full cycle from problem conception to system operation [14]. This practice-oriented model fosters systematic thinking, critical analysis, and integrated problem solving—precisely the competencies targeted by SDG 4 [15]. Furthermore, CDIO promotes interdisciplinary knowledge application and skill development, equipping students with the agility to tackle real-world challenges and aligning education more closely with the principles of sustainable development [16,17].
Additionally, CDIO aligns naturally with programming education, as programming inherently follows a structured process as follows: defining and decomposing problems (Conceive), designing solutions (Design), implementing logic (Implement), and validating and refining functions (Operate). These stages mirror the four core phases of CDIO [18]. Programming also demands multilayered thinking, including abstraction, modularity, and logical reasoning—all of which are systematically cultivated through CDIO’s pedagogical model [19,20]. Moreover, CDIO supports project-based learning, a common practice in programming instruction. By encouraging students to design and develop real-world projects, CDIO not only supports the needs of programming education but also enhances students’ practical abilities, preparing them to meet the diverse challenges of their future careers [21,22].
In light of these considerations, this study adopts the CDIO framework as the core instructional model to promote innovative teaching in programming language courses. It integrates an automatic architecture diagram generation system as the primary tool and incorporates project-oriented learning to holistically enhance students’ programming proficiency and practical application capabilities. The application of the CDIO framework in this study is described as follows:
  • Conceive (C): In the “Conceive” phase, students are guided toward problem identification and the development of corresponding solutions. At the beginning of the course, students are introduced to the fundamental concepts, logical structures, and application scenarios of programming languages. They are encouraged to recognize real-world development challenges, such as complex program logic and the cognitive load associated with learning syntax. With the aid of the automatic architecture diagram generation system, students can intuitively comprehend the logical relationships within programs and begin to consider how to apply programming knowledge to address practical problems.
  • Design (D): The “Design” phase emphasizes students’ ability to plan and structure their projects. In this study’s experimental course, students are tasked with implementing an interpreter project. They are required to design the architecture of the project—from lexical analysis to syntax parsing—by gradually defining the functional modules of the interpreter. The automatic architecture diagram generation system serves as a visual aid, helping students better understand program structure and operational flow. During this phase, students also learn how to design efficient data structures while balancing system performance and maintainability.
  • Implement (I): After completing the design phase, students proceed to the “Implement” phase, where they transform their design into executable code. The implementation process is supported by an automatic grading system that provides real-time feedback, enabling students to identify execution errors and make necessary adjustments and optimizations.
  • Operate (O): The “Operate” phase focuses on the presentation and evaluation of the project’s application value. Upon completion of the interpreter project, students demonstrate the functionality of their implementations and critically assess their effectiveness and applicability. In-class higher order activities such as peer feedback and improvement proposals further support students in reflecting on the design and development process, thereby enhancing their capacity for continuous improvement.
The primary aim of this study is to develop a system that automatically generates architecture diagrams from source code to help students better understand the structure and logic of programming solutions more quickly and accurately. By introducing a tool that visualizes program code, this study aims to alleviate learning difficulties commonly encountered in programming courses. In addition to enhancing students’ learning outcomes and project completion rates, the system is also expected to serve as a valuable instructional aid for educators. The specific research objectives are as follows:
  • Evaluate the impact of the system on students’ learning, comprehension, and completion of the interpreter project, particularly in terms of reducing the difficulty and time associated with manually drawing architecture diagrams.
Manually generating architecture diagrams is often a challenging and time-consuming task for students, which not only increases their cognitive load but may also negatively affect their learning outcomes. The automatic diagram generation system developed in this study aims to alleviate this burden, enabling students to concentrate more on solving programming problems. To assess the impact of this tool, student feedback will be collected through a post-implementation questionnaire, allowing for a systematic evaluation of the system’s effectiveness in improving learning outcomes and project performance.
In the context of higher education programming curricula, this study specifically targets a third-year required course titled Programming Languages. This course is situated after foundational courses in C/C++ and data structures, and focuses on deeper concepts such as language semantics, interpreter development, and syntax analysis. Given the complexity of tasks involved, including implementing a Scheme-based interpreter, the course naturally aligns with the CDIO model’s emphasis on design, implementation, and problem solving. This pedagogical context differs from introductory programming education and better illustrates how CDIO can support higher level cognitive and practical learning in programming.

2. Literature Review

2.1. Application of Graphical Tools in Programming Learning

Graphical tools play an increasingly important role in programming education, particularly in helping students understand complex concepts and logical structures. These tools convert abstract program code into visual representations, enabling students to intuitively grasp key elements of programming, thereby enhancing learning outcomes [5]. Previous research has demonstrated that graphical tools can effectively reduce students’ cognitive load during the programming learning process. Compared with traditional text-based approaches, they make it easier for learners to comprehend abstract concepts such as algorithms and data structures [7].
Such tools can dynamically present the execution process of code, allowing students to observe the outcome of each operation step by step, thereby deepening their understanding of program logic and control flow [1,23]. Moreover, graphical tools assist students in tackling common learning difficulties by facilitating error detection and enabling them to visualize the execution mechanism of programs [24]. This reduces frustration during the learning process and boosts students’ confidence, making them more inclined to engage with complex programming problems.
In general, graphical programming tools offer an intuitive and user-friendly editing interface that supports learners across various age groups and experience levels [25,26]. Based on these findings, this study employs graphical tools to enhance students’ comprehension of abstract programming concepts. Specifically, given that the experimental course project involves the development of an object language that differs from conventional programming languages, students face additional challenges. Through the integration of graphical tools, this study aims to improve students’ understanding and learning outcomes in tackling such unfamiliar programming tasks.

2.2. Application of the Automatic Generation System of Architecture Diagrams

The automatic generation system for architecture diagrams serves as a valuable pedagogical aid in programming education, helping students to better comprehend the structural and logical components of a program. By providing visual representations of program architecture, such systems allow students to intuitively grasp the relationships between different components, thereby enhancing both learning efficiency and academic performance. For instance, some studies have employed DevOps-based systems to construct architecture diagrams, thereby improving the consistency and accuracy of structural representations. Such methods reduce discrepancies in diagram interpretation and enable students to develop a clearer understanding of the overall system architecture [27].
Additionally, studies have demonstrated that generating corresponding program code through graphical interfaces—such as drag-and-drop mechanisms—is another effective strategy. These systems allow users to manipulate program elements (e.g., icons, variables) via intuitive visual interfaces while observing real-time updates in the underlying code. This instant visual feedback enables learners to better understand program execution logic and generate corresponding Python code upon completing the visual configuration [28]. Such approaches not only make programming more accessible but also improve overall learning efficiency.
However, despite these advantages, many of the aforementioned systems do not fully address students’ needs in actual program writing. Most graphical programming tools focus on simplifying the coding process, for example, by allowing users to construct a visual architecture through drag-and-drop blocks. While effective for beginners, these tools may limit learners’ ability to further develop their programming syntax knowledge or tackle more complex coding tasks. For instance, platforms that integrate visual programming with hardware—such as Arduino or Raspberry Pi—are often used in programming instruction, but the content is typically limited to modifying parameters in pre-written code rather than encouraging students to develop software from scratch [29]. Even in procedural language contexts such as Python-based robotics programming, visual programming environments are commonly used as scaffolds [30]. These systems, however, offer limited support for learners who already possess foundational programming knowledge.
For intermediate or advanced learners, the primary challenge is not syntax recognition but rather the need for guidance, conceptual scaffolding, and cognitive stimulation to support deeper problem solving. In this study, the target language is Scheme—a functional language that differs significantly from the imperative languages (e.g., Python or Java) with which most students are familiar. This shift in paradigm requires students to adopt a fundamentally different way of thinking. To address this need, the system developed in this study not only facilitates the visual understanding of program structure but also enhances learners’ analytical and problem-solving abilities.
For example, when writing and analyzing Scheme expressions, students must understand how expressions are parsed and evaluated at runtime. The visual architecture diagram system developed here displays the relationships between program elements in real time, enabling students to see how each component influences the overall structure. This supports more accurate mental modeling of program behavior and allows students to identify and correct logical errors more efficiently. As a result, the system not only reduces programming time but also strengthens students’ confidence and autonomy in solving programming problems. Specifically, it was applied in the following scenarios:
  • During classroom instruction: Teachers used the system in live demonstrations to visually explain the hierarchical structure and execution flow of code examples. This visual aid replaces time-consuming manual diagram drawing on slides or whiteboards, and enables instructors to illustrate the behavior of complex structures (e.g., lists, recursive functions) in real time.
  • In student self-study: Students were encouraged to use the system as a supplementary tool to analyze assigned exercises and deconstruct sample code. It provided immediate visual feedback that helped them verify structural correctness before proceeding to implementation.
  • During project development: The system was also integrated into the project workflow, allowing students to input parts of their code and generate corresponding structure diagrams. This served as a reflective tool to examine their modular design and recursive structures, especially useful when debugging or tracing interpreter evaluation logic.
While the system does not operate as a full-fledged debugger that tracks runtime variable values, it does fulfill a “visual debugging” function by highlighting structural logic and data representation errors. For example, if a list construction or conditional structure deviated from the expected output format, students could identify the structural inconsistency through the diagram before deeper debugging. Thus, the tool supports both comprehension and verification in the programming process.

3. Methods

3.1. Experimental Course

The experimental course in this study is “Programming Language”, a compulsory course for third-year students in the Department of Information Engineering. The course aims to provide students with a deeper understanding of the fundamental concepts underlying programming languages, covering topics ranging from language design principles to practical issues encountered in language implementation.
The course begins by introducing the core elements of programming languages, including syntax, semantics, and execution mechanisms, which lay the foundation for comprehending more advanced features. Subsequently, students are introduced to the design philosophies of various languages, equipping them with the ability to evaluate and compare the advantages, disadvantages, and application contexts of different programming paradigms. In addition, the course explores key technical and conceptual challenges in programming language design, such as language expressiveness, compiler construction, and execution efficiency. Through this, students are trained to identify and resolve issues that arise in real-world programming language development.
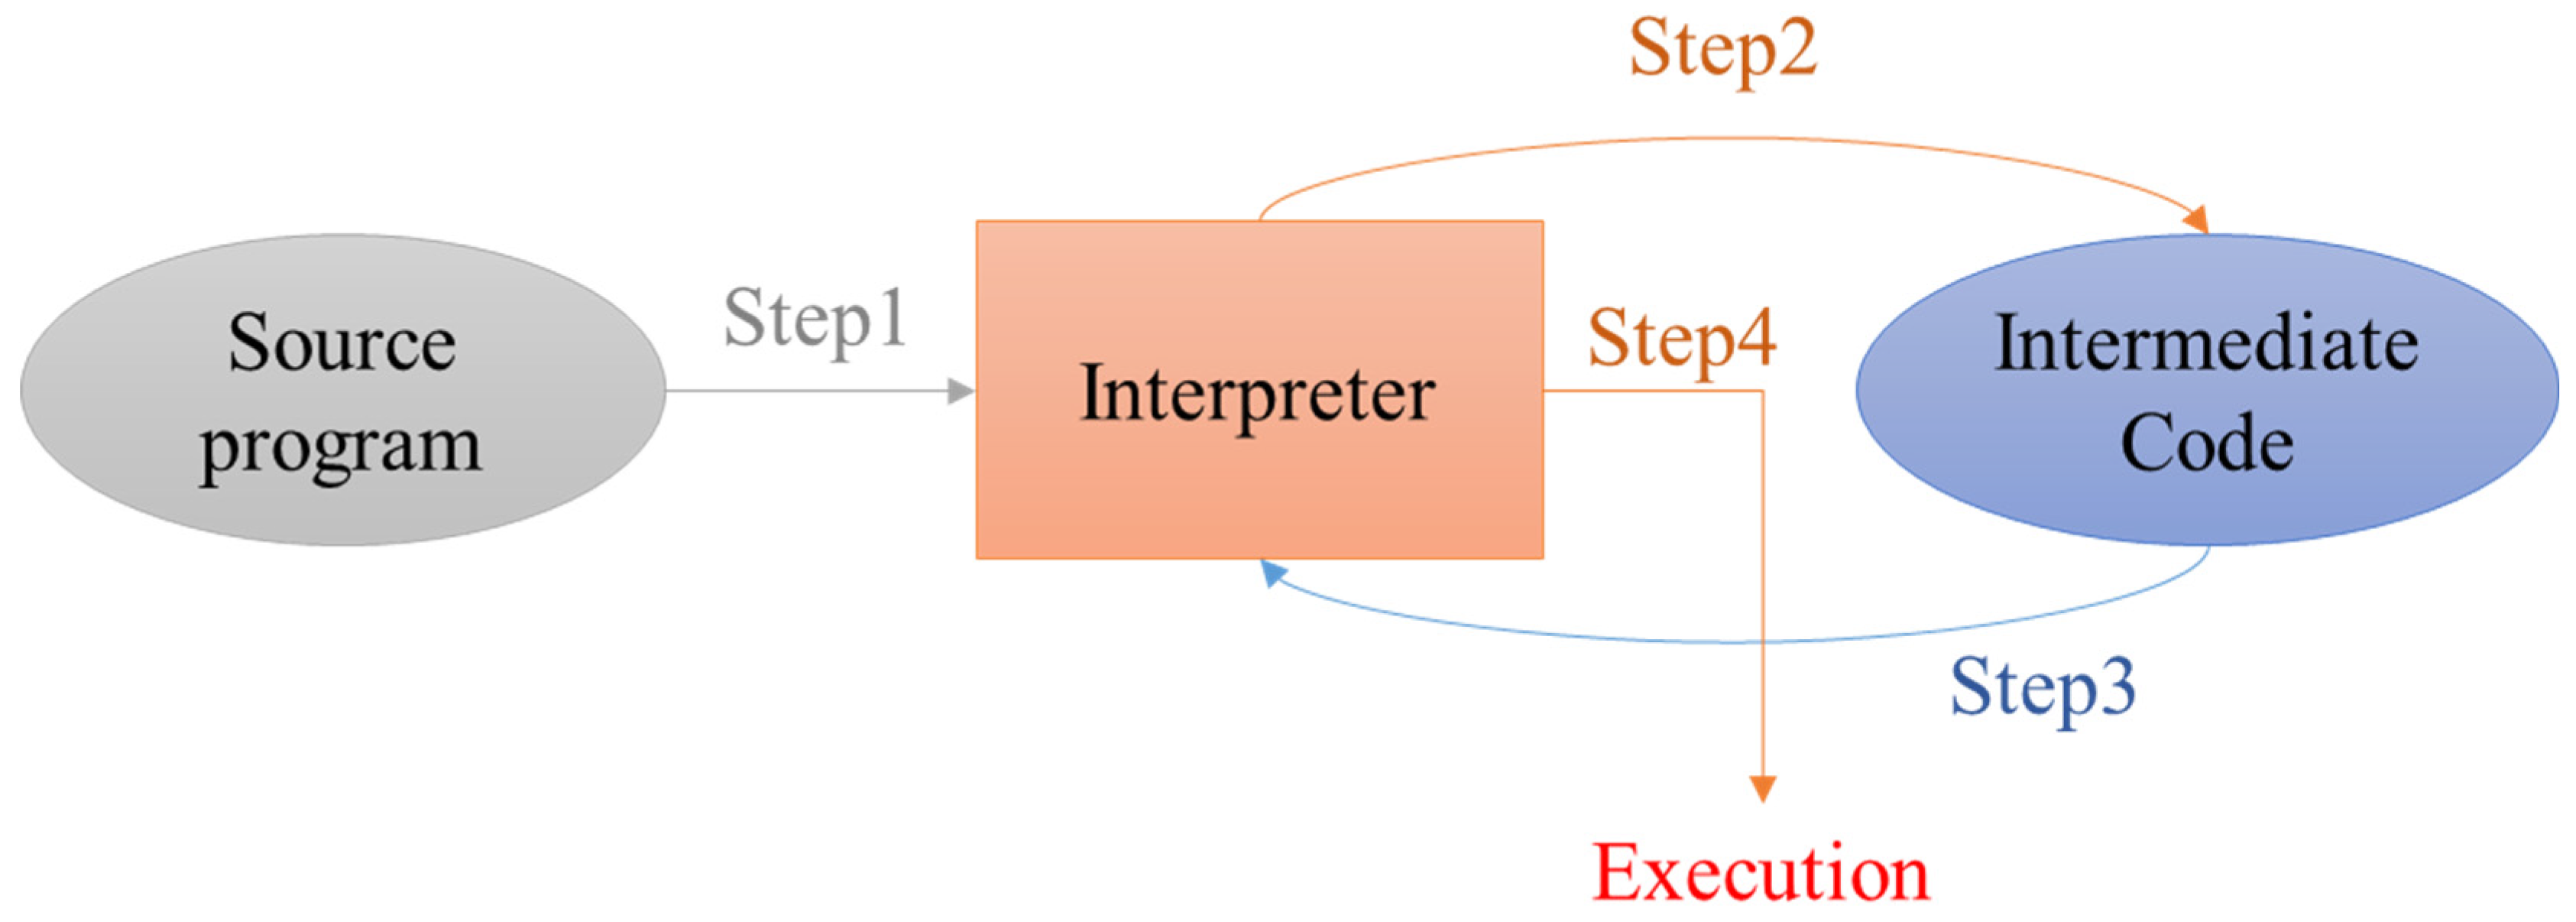
The primary assignment in this course is to implement an interpreter for the Scheme language. This implementation requires students to address both syntactic and semantic analysis (hereinafter collectively referred to as “grammar analysis”). The interpreter must be capable of executing Scheme expressions only if the grammar analysis is successful; otherwise, it should return appropriate error-handling messages.
Figure 1 illustrates the interpreter’s execution flow. First, the original Scheme program is passed to the interpreter (Step 1). The interpreter then parses and translates each line into intermediate code (Step 2), which is fed back into the interpreter (Step 3) for execution using corresponding functions (Step 4). This process repeats from Step 2 to Step 4 until the program is fully executed.
To implement such an interpreter, students must first understand the fundamental characteristics of the target language. In this course, the target is Scheme, a functional programming language that is significantly different from imperative languages such as C/C++, Java, and Python. Scheme was originally designed for artificial intelligence applications and is based on a minimalist syntax centered on atoms and lists. Unlike imperative languages that rely on explicit data types and variable declarations (e.g., int a; in C), Scheme represents the smallest unit as an atom, which can be either a symbol or a number.
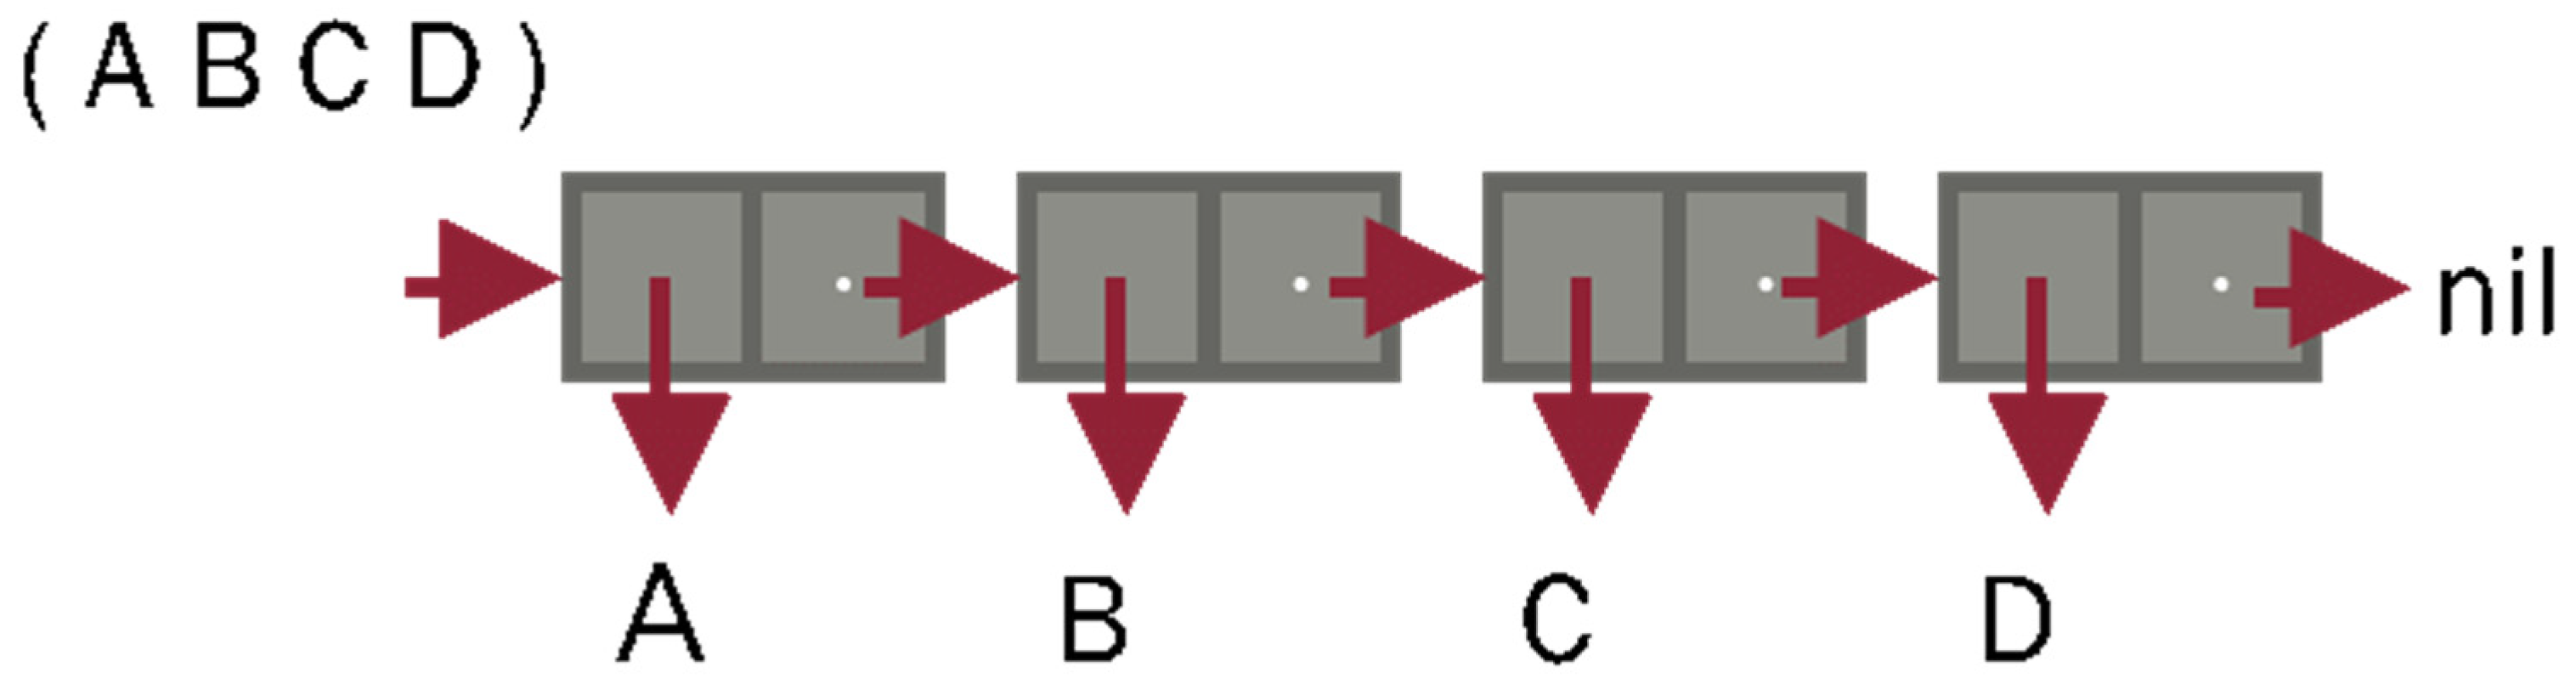
Another aspect that challenges students is Scheme’s list-based expression format. Lists in Scheme are enclosed in parentheses and represent a series of elements, such as (A B C D). If visualized as a linked list data structure, each list element corresponds to a node, where each node contains two pointers: one pointing to the content (e.g., A), and the other pointing to the next node. As shown in Figure 2, the first arrow represents the starting reference of the list, which points to the first node. Each subsequent node follows the same structure, linking together to form the entire list.
This visual interpretation of lists not only helps students understand how Scheme internally represents data but also bridges the gap between abstract functional constructs and familiar data structures like linked lists, which they have previously encountered in imperative programming.
The architecture diagram helps to make program implementation more comprehensible. Therefore, instructors often use such architectural descriptions during lectures to explain program execution. As shown in Figure 3, the Scheme language provides the built-in function list to create lists in the format of (arg1... argn). For example, when the interpreter receives the input (list 3 ‘(4 5) 6 ‘(7 8)), it should output (3 (4 5) 6 (7 8)). If visualized graphically, the structure of the output can be seen in Figure 4. In this example, since list treats each argument as an element of a new list, the number 3 becomes the first element, the list (4 5) becomes the second element, 6 the third, and (7 8) the fourth.
From the examples in Figure 2 through 4, it is evident that Scheme differs significantly from commonly used imperative programming languages in terms of syntax and expression. As a result, when students practice, they often spend a considerable amount of time just trying to understand the correct structure of the expected output for a given input. Even though instructors and teaching assistants provide a variety of examples in class, students still frequently require assistance in drawing architecture diagrams to comprehend the structure of various Scheme expressions.
To prevent students from simply tailoring their programs to pass fixed test cases—which would compromise the generality and reusability of their implementations—instructors often vary the problem requirements. However, this also causes students to feel confused or overwhelmed when attempting to create architecture diagrams before coding. This uncertainty can ultimately affect their implementation and timely submission of assignments.
To address this issue, the present study aims to develop a system that automatically generates architecture diagrams, helping students visualize abstract program structures more efficiently. This system not only alleviates the burden of manual diagram drawing but also enhances students’ understanding of program behavior and improves the practical completion rate of programming assignments.

3.2. Experimental Subjects

The participants in this study were students enrolled in the “Programming Languages” course, a required class focusing on the principles of programming language design and implementation, with a particular emphasis on the development and application of interpreters. In the spring semester of the 2025 academic year, a total of 118 students enrolled in this course and served as the experimental group. To evaluate the impact of the automatic architecture diagram generation system on students’ learning outcomes, this study compared the project completion rate of the experimental group with that of students who took the same course during the 2024 academic year (control group, n = 101), who did not use the system.
To minimize potential cohort bias, both the control group (2024) and experimental group (2025) enrolled in the same course during the post-pandemic period, where higher education in Taiwan had returned to stable in-person instruction. Therefore, no pandemic-related disruptions were present during data collection. Additionally, this course is offered in the senior year, and all students across both cohorts had completed the same required prerequisite programming and computer science courses, ensuring equivalent learning histories. To further verify equivalence in programming competence, we compared students’ grades in a core prerequisite course—Data Structures—from the previous semester and found no statistically significant difference between the two groups. These findings support the assumption that the control and experimental groups were comparable in baseline programming proficiency.
All participants were between the ages of 20 and 21 and possessed basic programming knowledge. Prior to the experiment, the research team explained this study’s purpose and procedures to all participants and obtained written informed consent in accordance with research ethics standards. Both groups were taught by the same instructor, covered identical course content, and completed the same project assignment. The only difference was that the experimental group received support from the automatic architecture diagram system.
To verify whether the sample size had adequate statistical power, this study conducted a post hoc power analysis using G*Power 3.1. Based on the mean and standard deviation of the project scores for the two groups (control: M = 11.36, SD = 9.02; experimental: M = 15.76, SD = 19.96), the Cohen’s d effect size was calculated to be approximately 0.29, indicating a small to medium effect. Using a significance level of α = 0.05 and a two-tailed test, the statistical power was found to be 0.86, exceeding the commonly accepted threshold of 0.80. This result suggests that the sample size was sufficient to detect a meaningful difference between the groups.

3.3. Experimental Procedure

The experimental procedure of this study was divided into the following stages (see Figure 5’s research procedure) to effectively evaluate the influence of the automatic architecture diagram system on student learning outcomes and instructional workload:
  • Experimental Design and Preparation
This study used the Programming Languages course as the main experimental setting. The experimental group consisted of students currently enrolled in the course, while the control group was composed of students who completed the course in the previous academic year. Students in the experimental group used the automatic architecture diagram system throughout the semester, while those in the control group learned through traditional instruction methods, such as slide presentations and blackboard explanations. Both groups received the same teaching content and were required to complete the same interpreter implementation project.
2.
Data Collection Phase
During the semester, multiple sources of data were collected to analyze the system’s effectiveness. At the beginning of the term, students in the experimental group completed a pre-test questionnaire assessing learning motivation and cognitive load. The system was then used throughout the 17-week semester. Afterward, students completed a post-test questionnaire to assess changes in their learning experience. Additionally, this study recorded the number of interpreter project tasks completed and project grades, which served as quantitative indicators of project completion.
3.
Data Analysis Phase
After the data collection, statistical analyses were conducted to compare the project performance of the experimental and control groups. In addition, paired-sample analyses were used to examine changes in learning motivation and cognitive load within the experimental group. These analyses aimed to determine whether the use of the automatic architecture diagram system significantly affected students’ learning engagement and perceived cognitive effort.

3.4. Experimental Tools

3.4.1. Automatic Architecture Diagram System

To support students in the implementation of the interpreter project, the course provided a structured model illustrating the detailed processes of instruction reading, parsing, execution, and output. Due to the syntactic structure of the Scheme language, a Skewed Binary Tree (SBT) was adopted as the core data structure for command representation. However, students often found it difficult to translate these structures into actual program code using only textual explanations. To address this challenge, this study developed a visualization system based on a front-end/back-end architecture, referred to as the SBT visualization system. Figure 6 shows that students interact with the system via a web browser by entering Scheme expressions into an input field. Upon submission, the API server handles the request and invokes the Scheme parser through a subprocess. The parser decomposes the input command and returns a structural description as a string. The server then converts this output into JSON format, which is passed to the front-end for rendering using D3.js to generate a real-time visualization of the SBT.
For instance, the input (A B C D) would be visualized as shown in Figure 7, which shows an example of how students visualize the evaluation of nested Scheme expressions, such as recursive list applications, with the system automatically generating a node-based tree structure. This visual output allows students to verify whether their expression structures align with expected recursion logic.
To ensure system scalability, the API server and Scheme parser are developed as independent components. This modular design allows for flexible parser implementation in other languages, thus enabling future support for non-Scheme programming languages in the course. The actual user interface is shown in Figure 8. Students can input any S-expression in the designated input area. For example, entering (list 3 ‘(4 5) 6 ‘(7 8)) and clicking the analyze button will immediately display the corresponding SBT structure. This system significantly reduces the instructional burden and improves students’ learning efficiency by enabling instant in-class visualizations and serving as an exploratory tool during project work. This tool is evaluated with the key objectives of assessing its impact on students’ learning, comprehension, and completion of the interpreter project, particularly by reducing the difficulty and time required for manual architecture diagram construction.
In addition, the system incorporates an input validation mechanism that checks the structural integrity of the submitted S-expressions before rendering. This feature ensures that users are notified when syntactic errors—such as unmatched parentheses or malformed list structures—are detected in their Scheme code. Instead of proceeding with incorrect visualization or execution, the system halts the rendering process and provides a real-time error message indicating the nature of the problem. This not only prevents confusion caused by erroneous outputs but also reinforces the importance of syntactic precision, thereby serving as a formative feedback tool to support students’ debugging and code-refinement skills.
From a system architecture perspective, the current implementation utilizes a Scheme expression parser that translates student-written code into S-expressions represented in JSON format, which are then rendered via a custom canvas using D3.js. This architecture allows real-time updates and tree-structured visualization of nested list expressions. Performance testing showed that the system can render structures up to 10 nested levels with acceptable latency (<500 ms), beyond which layout clarity and user interaction deteriorate.
It is important to clarify that the term “architecture diagram” in this context does not align with the conventional notion of software architecture diagrams in software engineering (e.g., UML class diagrams, call graphs, or module interaction maps). Rather, the system serves as a syntax-level structural visualization tool, aimed specifically at helping students mentally construct and analyze the internal logic of their programs. The terminology reflects the pedagogical intention of enabling learners to visualize and decompose abstract code structures in a manner that reduces cognitive load and fosters accurate mental models of recursion and list processing.
In the context of this study, the visualizations are primarily used during interpreter design and debugging stages, helping students to clarify how lists are composed, how expressions are evaluated, and how function applications are logically structured. While the current system does not yet support higher level representations such as control flow diagrams or module interaction views, it has proven effective in scaffolding students’ understanding of the data and logic structures specific to functional languages in this study. Future development aims to extend the system to support imperative constructs and broader program architecture visualizations, such as those applicable to C or Java.
It should be noted that Figure 4 illustrates the type of diagrams originally created by instructors using PowerPoint’s built-in shapes and connectors during classroom teaching. As such, the diagrams were relatively rudimentary and time-consuming to prepare, especially when dealing with deeply nested Scheme expressions. The automatic architecture diagram system developed in this study was specifically designed to alleviate this burden. By automating the visualization process, the system not only increases instructional efficiency but also ensures consistency in diagrammatic representation. Furthermore, the system supports zoom functionality, enabling users to scale and inspect complex diagrams in detail, thereby enhancing readability and interaction for both students and teachers.

3.4.2. Learning Motivation and Cognitive Load Questionnaire

To assess students’ learning experiences, this study adopted and adapted the motivation and cognitive load scales developed by Hwang et al. [31]. The learning motivation questionnaire was based on the ARCS model and included seven items measured on a six-point Likert scale. The items were revised to better reflect the context of this study. The cognitive load questionnaire was also adapted from Hwang, Yang, and Wang [31]’s study, containing eight items, likewise measured on a six-point Likert scale. Both questionnaires were reviewed by subject experts to ensure content validity, and reliability analysis was conducted using pre-test data. The Cronbach’s alpha values for the learning motivation and cognitive load scales were 0.939 and 0.904, respectively—both exceeding the commonly accepted threshold of 0.85—indicating high internal consistency reliability.

3.4.3. Project Test System

Upon completing the Scheme interpreter project, students were required to submit their work to a designated platform. The project score was determined based on the number of test cases successfully passed, with a maximum score of 70 points. This automated evaluation mechanism ensured a consistent and objective measure of students’ project implementation performance.

3.5. Educational Context

The proposed instructional model was implemented in a third-year undergraduate course, Programming Languages, offered in the Department of Computer Science. This course is positioned after introductory programming (e.g., C/C++, Java, Python) and data structures, and introduces students to the theoretical and practical foundations of language design. Topics include lexical and syntax analysis, abstract syntax tree construction, interpreter implementation, and modular evaluation strategies. The major project required students to design and implement a simplified Scheme interpreter, which involves multi-stage system thinking, functional decomposition, and structural debugging—all of which align with CDIO principles.
While this study focused on an intermediate-to-advanced programming course, the visual architecture diagram system and pedagogical model proposed have the potential to be adapted to introductory-level courses with simplified features. This will be considered in future studies.

4. Results

To evaluate the effectiveness of the instructional intervention proposed in this study, this chapter analyzes empirical findings from three perspectives: (1) the project performance of students in the experimental and control groups, (2) the pre- and post-test differences in learning motivation among students in the experimental group, and (3) the pre- and post-test differences in cognitive load. The purpose of this analysis is to determine whether the automatic program architecture diagram generation system enhances programming performance in the experimental group and to further assess its impact on students’ motivation and cognitive state throughout the learning process. Quantitative analysis methods were used to compare the learning outcomes between the two groups and examine the changes in learning motivation and cognitive load within the experimental group before and after the intervention, thereby validating the effectiveness of the proposed instructional design and support tool.

4.1. Project Scores

To assess whether the developed automatic architecture diagram generation system improved students’ project performance, an independent samples t-test was conducted to compare the project scores of the experimental and control groups (Table 1). The control group (n = 101) had a mean score of 22.72 (SD = 18.04), while the experimental group (n = 118) achieved a mean score of 29.63 (SD = 28.35).
Levene’s test indicated unequal variances between the groups (F = 44.75, p < 0.001), so the t-test without assuming equal variances was used. The results showed a statistically significant difference in project scores between the two groups (t(168.263) = −2.181, p =0.030). The experimental group’s mean score was significantly higher than that of the control group, with a mean difference of −6.91 (95% CI: [−13.16, −0.66]), suggesting that the automatic architecture diagram generation system positively influenced students’ performance on programming projects. The system not only reduced the time students spent manually creating architecture diagrams but also enabled them to concentrate more on the project’s design and implementation. Consequently, students in the experimental group demonstrated better performance in both the quality and efficiency of their project completion.

4.2. Differences in Learning Motivation: Pre-Test vs. Post-Test

Regarding learning motivation (Table 2), the pre-test mean was 5.00 (SD = 0.84), while the post-test mean dropped to 4.67 (SD = 0.86). Levene’s test confirmed equal variances (F = 0.018, p = 0.893), so the t-test assuming equal variance was applied. The results revealed a statistically significant decline in motivation (t(256) = 2.991, p = 0.003), with a mean difference of 0.33 (95% CI: [0.11, 0.54]). These findings indicate that despite the intervention system improving project performance, it did not maintain or enhance students’ motivation in the later stages of the course. This decline suggests that in a high-demand project-based learning environment, students’ engagement may fluctuate due to stress, cognitive load, or shifts in self-confidence.

4.3. Differences in Cognitive Load: Pre-Test vs. Post-Test

The cognitive load analysis was further refined by separating intrinsic and extraneous cognitive load components (Table 3). The pre-test mean for intrinsic cognitive load was 4.48 (SD = 0.97), while the post-test mean was 4.56 (SD = 1.00). An independent samples t-test assuming equal variances (F = 0.000, p = 0.995) indicated no significant difference between the pre- and post-tests (t(256) = −0.660, p = 0.510).
For extraneous cognitive load, the pre-test mean was 4.40 (SD = 0.98) and the post-test mean was 4.35 (SD = 1.03). Levene’s test again showed equal variances (F = 0.162, p = 0.687), and the t-test revealed no significant difference (t(256) = 0.346, p = 0.730). This suggests that, while the system’s visual representation of structure aids comprehension, it does not substantially alter students’ perceived cognitive load over the course of learning. This may be attributed to the inherently high intrinsic load and task complexity of the course content or to the additional cognitive demands of adapting to new learning tools in the early stages.

5. Discussion

This study investigates whether programming instruction supported by an automatic architecture diagram generation system can enhance students’ learning outcomes, integrating the Sustainable Development Goal (SDG) of “quality education” with the CDIO educational framework. The results demonstrate that students in the experimental group significantly outperformed those in the control group on the project component, indicating that the system effectively contributes to students’ practical learning performance. However, no significant differences were observed in students’ learning motivation or cognitive load between the pre- and post-tests. The following sections provide a detailed discussion of these findings.

5.1. Enhancing Learning Performance and Strengthening Practical Skills

This study found a significant improvement in learning achievement, with experimental group students achieving higher project completion scores than their peers who did not use the system. This suggests that the automatic architecture diagram system effectively supports students in constructing program logic, implementing functional modules, and solving programming problems. The project, which required the development of a Scheme-language-based interpreter, involved advanced topics such as syntactic parsing, semantic evaluation, and data structure design. Without the ability to abstract and structure logic, students can easily become overwhelmed. The real-time generation of architecture diagrams helped students visualize the logical flow and overall structural progression of their programs, improving both their design and debugging efficiency.
These findings align with prior research. Funabiki et al. [32] demonstrated that Java instruction supported by an automatic feedback system enhanced students’ abilities in logic construction and error correction, significantly improving novice performance in complex statements. The TRAKLA2 system developed by Malmi, Karavirta, Korhonen, Nikander, Seppälä, and Silvasti [2] showed that engaging students in interactive visualization of algorithms and data structures strengthened their understanding of abstract logic, thereby improving learning outcomes. Similarly, the Jeliot system highlighted that visual assistance could substantially support beginners in grasping complex program behaviors [33].
Unlike static visual tools, the system proposed in this study dynamically generates architecture diagrams based on students’ input. It visualizes the hierarchical and structural relationships between code elements using data structure nodes. This feature is especially important for representing Scheme’s highly nested S-expressions. By transforming difficult-to-understand text-based logic into an intuitive visual model, the system facilitates comprehension. This ability is transferable to learning other advanced programming languages and real-world software development, laying a strong foundation for students’ core programming literacy [20].
The effectiveness of this system can also be interpreted through the lens of the CDIO educational framework [21]. Among CDIO’s four stages, “Design” and “Implementation” directly relate to students’ practical and logical transformation skills. The system plays a critical role in both stages. During the Design stage, it aids in decomposing modules and planning logic; during the Implementation stage, it verifies structural correctness and offers real-time corrections. This dual function serves as a “visual scaffold,” enabling students to autonomously deconstruct and reconstruct complex logic. As a result, the system supports the development of higher order problem-solving and systems thinking skills—both essential competencies emphasized in SDG 4 [18].
In summary, the improved learning outcomes observed in this study highlight the system’s ability to enhance students’ logical reasoning and structural understanding throughout the programming process. These results extend previous research on graphical tools in programming education and offer a sustainable practice-oriented teaching model aligned with the CDIO framework. Furthermore, this study provides empirical support for advancing programming instruction that fosters long-term development and aligns with the goals of sustainable education [19].

5.2. Possible Reasons for the Decline in Learning Motivation and Pedagogical Implications

Although students in the experimental group demonstrated significantly improved learning outcomes, the analysis of learning motivation revealed a noteworthy decline from the pre-test to the post-test. This suggests that, while the automatic architecture diagram generation system supports comprehension and project completion, it does not necessarily translate into increased or sustained learning motivation. This outcome aligns with findings from prior research in programming education, which indicate that enhanced academic performance does not always correspond with a rise in student motivation [34].
One plausible explanation is that the tool developed in this study primarily serves a cognitive support function by simplifying the problem-solving process. It operates as a task-oriented aid and lacks features designed to elicit emotional engagement, such as gamification, competitive elements, or personalized challenge goals. According to Keller’s ARCS model of motivation, effective learning design should address not only Relevance and Satisfaction but also Attention and the learner’s perceived Confidence [35]. A purely cognitive tool that reduces complexity without integrating strategies to spark curiosity or provide motivating feedback may not produce substantial motivational gains, especially over a short instructional period [36,37,38,39].
Another contributing factor may be the inherent difficulty of the course content itself, specifically the implementation of a Scheme interpreter. The high cognitive load may lead students to adopt “survival-oriented” strategies focused on task completion rather than deep engagement driven by intrinsic interest [40]. Additionally, for students with higher levels of prior knowledge, the system may function more as a reinforcement tool than a novel instructional aid. In such cases, a ceiling effect may limit its motivational impact [41].
Within the CDIO framework, although motivation is not explicitly categorized, it is implicitly embedded in the Conceive stage, which emphasizes identifying real-world needs and generating problem awareness. This study’s findings suggest that enriching this stage with situational problem design, learner autonomy through topic selection, and personally meaningful task framing could enhance intrinsic engagement. Such strategies may foster a more positive feedback loop between motivation and learning outcomes [42].
In summary, although the current intervention did not lead to significant gains in motivation, it offers valuable insights for future course design. Technological tools should be integrated with motivational supports to achieve the SDG vision of cultivating “well-rounded self-directed learners”. Future research may consider using learning analytics to investigate how students with varying motivational profiles interact with automatic visualization systems [43]. Such an approach can uncover behavioral patterns and optimize the tool’s impact across diverse learner characteristics [44]. For instance, recent advances in educational data mining and representation learning [45], such as orientation cues-aware facial recognition for engagement detection [46], or transformer-based models for analyzing attention and affect, highlight the potential of integrating behavioral indicators into personalized programming education environments [47]. These directions are particularly relevant for understanding students’ continuance intention across learning modalities (e.g., live vs. hybrid instruction) [48], which aligns with the broader educational sustainability goals under SDG 4.

5.3. Rethinking Cognitive Load Stabilization and Learning Support

In the comparison of pre- and post-test cognitive load, this study found no significant difference in students’ cognitive load after using the automatic architecture diagram generation system, with the overall average remaining stable. This finding suggests that the introduction of the system neither increased students’ mental burden during programming learning nor substantially reduced the intrinsic cognitive load associated with understanding high-level languages such as Scheme. This outcome provides key insights into the effectiveness of instructional interventions and the role and limitations of visual aids in supporting cognitively demanding tasks [49].
According to Sweller’s Cognitive Load Theory (CLT), cognitive load consists of three components: intrinsic load, extraneous load, and germane load [50]. The primary objective of the system in this study was to reduce extraneous load, that is, to present abstract grammatical structures visually so students could better grasp logic and hierarchical relationships in the code [51,52]. Nevertheless, Scheme’s inherent complexity—characterized by its recursive, nested, and highly compact syntax—contributes to a high intrinsic load. Thus, even with reductions in extraneous load, the total cognitive effort required may not be substantially altered.
This result aligns with findings by Kräuter, König, Rutle, and Lamo [24], who demonstrated that, while visual debugging tools help students locate errors more quickly and reduce debugging time, they do not reduce the mental demands involved in understanding abstract program logic and memory models. Likewise, a meta-analysis by Hu, Chen, and Su [25] on visual programming tools showed that, while such tools reduce cognitive load among novice learners, more advanced concepts require strategic instructional support to achieve optimal outcomes.
From the perspective of SDG 4, maintaining an appropriate level of cognitive load is essential for fostering deep learning and higher order thinking. Over-reducing cognitive effort may deprive learners of the opportunity to engage in meaningful knowledge construction. Therefore, the cognitive stability observed in this study may be interpreted positively, i.e., the system provided students with an effective cognitive scaffold that helped them process complex tasks without adding unnecessary mental effort [53,54].
Within the CDIO framework, the Implement and Operate stages require students to repeatedly adjust designs, test functions, and debug errors—activities that are inherently cognitively intensive. Providing structured feedback and visual prompts at these stages can enhance students’ ability to allocate cognitive resources effectively. Future research could explore how to integrate this system with other learning strategies—such as advance organizers, worked examples, or collaborative learning—to reduce extraneous load while promoting germane load, thereby supporting more active reasoning and conceptual integration [55].
In summary, the absence of a significant shift in cognitive load should not be viewed as a shortcoming of the system. Rather, it reflects a stable tension between the cognitive demands of abstract learning tasks and the support provided by the visual tool [48]. Future directions could include hierarchically adjusting task difficulty, fine-tuning system interactivity, and embedding self-reflection modules to promote deeper learning. These improvements would further align with the goals of SDG 4 and expand the practical application of the CDIO model in programming education.

6. Conclusions, Limitations, and Future Research

6.1. Conclusions

While this study was conceptually grounded in the CDIO framework and aligned with the SDG 4 objective of promoting quality education, the findings also present several actionable insights for programming instruction in higher education. First, the integration of real-time structural visualization tools can significantly reduce students’ confusion when learning recursive or nested expression logic—an area traditionally difficult for novices. Second, embedding a staged interpreter project encourages iterative refinement and promotes deeper conceptual learning through practical engagement. Finally, the alignment of formative assessment checkpoints with visual feedback accelerates debugging skills and supports autonomous learning. These strategies are transferable across functional and imperative language courses and may serve as references for instructors aiming to enhance engagement and conceptual clarity in intermediate-level programming courses.
Compared with previous studies—most of which apply visual aids or animation tools primarily at the introductory grammar level to support learning of basic programming concepts such as variables, loops, or pointers—this study extends visualization tools into advanced project development, focusing on interpreter implementation in the Scheme language. This approach integrates two key aspects: “architectural comprehension” and “modular logic planning”, helping students synthesize knowledge and apply skills to context-specific challenges. Notably, this study is the first to apply an automatic diagram generation system within a real-world course that aligns ESD and CDIO principles, validating its pedagogical impact through empirical data.
The main contributions of this study lie not only in the system design and its measurable outcomes, but also in the construction of an innovative sustainability-oriented teaching model suitable for higher education. This model emphasizes ability cultivation, practical application, structural understanding, and problem solving. If motivational design and feedback mechanisms are integrated in future iterations, the proposed framework has the potential to evolve into a scalable programming pedagogy aligned with SDG 4, offering a powerful bridge between educational innovation and sustainable development.
Although this study focused on Scheme—a functional and declarative programming language—as the target for interpreter implementation, the core instructional approach is not language-dependent. The visual architecture diagram system emphasizes structural thinking, function nesting, and evaluation logic, which are equally applicable to imperative languages such as C or Java, especially when teaching control flow, recursion, and data structure operations.
We acknowledge that learning Scheme while simultaneously implementing an interpreter constitutes a dual cognitive challenge. However, this deliberate blending is pedagogically motivated for the following reason: students are required to internalize the syntax and semantics of a new language while also applying that understanding in a structured design process. This dual task, guided by visual feedback and staged CDIO activities, promotes deeper engagement and reflection.
Although this study adopts the CDIO framework and integrates visual tools—an approach that shares conceptual parallels with prior research (CDIO-ML) [56]—the educational focus and technical implementation differ substantially. CDIO-ML emphasizes competition-driven activities and multi-disciplinary data fusion within the context of machine learning. In contrast, the current study targets the conceptual and practical difficulties encountered in programming language courses, specifically interpreter implementation in a functional language (Scheme). This curricular context demands high-level abstraction, including recursive structure processing and symbolic expression parsing, which distinguishes it from general programming or data science courses.
Although the average project performance increase (6.91 points) may appear modest when compared with skill enhancements reported in CDIO-ML (e.g., 15%), it is important to note that the project in this study involves significantly higher cognitive load and complexity. The improvements occurred in the context of a single-semester implementation with no competition-based incentives, underscoring the system’s value in scaffolding advanced programming tasks through visualization and formative assessment. This supports the CDIO framework’s goal of promoting sustainable and reflective learning in technically challenging contexts.
Moreover, although this study was conducted in a more advanced programming course, the core idea of integrating CDIO principles and visual programming tools offers promising potential for earlier-stage programming education. In future work, we plan to adapt the system for simplified syntax structures to support novice learners and explore its use in foundational courses such as Introduction to Programming and Data Structures.
Although the primary focus of this study was on enhancing the quality of programming education through structured visual scaffolding and CDIO-aligned project learning, it also aligns with the broader vision of Education for Sustainable Development (ESD) and Sustainable Development Goal 4 (SDG 4), particularly in fostering equitable access to complex knowledge through scaffolding, cognitive support, and formative assessment. In this sense, the system contributes to sustainability by supporting students with diverse prior knowledge and reducing dropout risks in advanced programming courses, which are often bottlenecks in computing curricula.
Rather than emphasizing environmental sustainability directly, the pedagogical model aims to advance sustainability in terms of instructional equity, learning continuity, and support for cognitive diversity—key principles of inclusive and lifelong learning emphasized in SDG 4.

6.2. Future Research

Although this study demonstrates a statistically significant improvement in project performance, we acknowledge limitations regarding the assessment of higher order learning outcomes such as systems thinking and knowledge transfer. The observed variability in project scores—evident in the relatively high standard deviation of the experimental group—suggests that the tool’s impact may differ across learner profiles.
Future research should incorporate longitudinal designs to assess knowledge retention over time and evaluate transferability to other programming paradigms and tasks. In addition, the integration of qualitative data (e.g., structured interviews, concept mapping, or diagram-based reasoning tasks) could yield deeper insights into students’ structural comprehension and metacognitive development.
Moreover, while the current system effectively functions as a cognitive scaffold for structuring recursive logic and list-based evaluation, its design has not yet fully incorporated motivational strategies aligned with the ARCS model (Attention, Relevance, Confidence, Satisfaction). The observed post-test decline in student motivation suggests that the system may lack elements that sustain engagement, especially over extended project cycles.
Future versions of the system will explore the integration of motivational design features, such as gamified progression (e.g., milestone unlocking), peer-based benchmarking, and adaptive goal setting. These features have been widely adopted in platforms like Codecademy to improve engagement and persistence in programming education. Additionally, competition-based strategies, as demonstrated successfully in CDIO-ML, will be considered—particularly in the form of peer review showcases or design challenges that align with the CDIO “Operate” phase.
Nevertheless, we also acknowledge that the current version of this study did not measure resource efficiency metrics such as instructor workload reduction, nor did it assess environmental or social impacts such as deployment energy consumption or digital equity. These aspects will be incorporated into future research through indicators such as time-on-task reduction for teachers, energy usage profiles of cloud-based deployment models, and accessibility evaluation for students with differing technological access. Future iterations will explore how these features can contribute not only to learning outcomes but also to sustained engagement—thus more fully realizing the inclusivity and sustainability values articulated in SDG 4.
To enhance the applicability of the proposed system, future work should also explore its adaptability to other programming paradigms. While this study focuses on functional programming using Scheme, the underlying visualization framework could be extended to support imperative languages such as C or Python by incorporating control flow elements and variable tracking features. Additionally, given its web-based architecture and automatic feedback capabilities, the system shows promise for integration into online learning environments, such as MOOCs or flipped classrooms for introductory programming courses. Adapting the interface and scaffolding levels for beginners could further broaden its utility across diverse educational contexts.

6.3. Study Limitations

Although the findings of this study demonstrate the effectiveness of the automatic architecture diagram generation system in programming instruction, several limitations in the research design may affect the explanatory power and generalizability of the results.
First, this study adopted a quasi-experimental design, with the experimental and control groups drawn from different academic years. Although the course content, instructional materials, and teaching arrangements were kept consistent across both cohorts, potential confounding factors—such as historical effects or cohort differences (e.g., variations in learning styles, prior programming experience, or academic backgrounds)—could not be fully controlled.
Second, the primary measure of learning achievement was students’ project scores, which, while reflective of practical performance, may not comprehensively capture changes in students’ underlying skills such as syntactic understanding, logical reasoning, and problem-solving ability. Relying solely on project-based evaluation may therefore limit the depth of insight into students’ cognitive skill development.
Third, this study employed quantitative questionnaires as the primary instruments for assessing learning motivation and cognitive load. While these tools offer standardized and scalable measurements, the absence of qualitative data (e.g., interviews, open-ended responses, or classroom observations) restricts the ability to explore students’ in-depth experiences, learning strategies, and cognitive processes while interacting with the system.
Future research is encouraged to adopt mixed-method approaches, integrating both quantitative and qualitative data, to gain a more holistic and nuanced understanding of students’ learning experiences and the mechanisms through which visual programming support tools influence cognitive and motivational outcomes.
Additionally, the current implementation of the architecture diagram system was tailored for functional programming in Scheme, which may limit its immediate applicability to other programming paradigms. While the underlying visualization mechanism is language-agnostic in theory, its parser and rendering logic are currently Scheme-specific. This restricts its use in imperative or object-oriented programming environments where structural complexity may require different forms of representation, such as control flow graphs or class hierarchies. Future development could focus on extending the system’s parser and visualization logic to support languages such as C, Python, or Java. This may involve implementing support for visualizing branching, loops, function calls, and object hierarchies. Moreover, the tool could be adapted for upper-level courses such as compiler construction, software testing, or software architecture, where students deal with complex program structures and require modular design thinking. These adaptations would increase the scalability and applicability of the system beyond its current scope.

Author Contributions

Conceptualization, C.-H.L. and L.-C.H.; methodology, C.-H.L. and L.-C.H.; software, L.-C.H. and Z.-Y.L.; validation, C.-H.L. and L.-C.H.; formal analysis, C.-H.L.; investigation, C.-H.L.; resources, C.-H.L.; data curation, C.-H.L.; writing—original draft preparation, C.-H.L. and L.-C.H.; writing—review and editing, C.-H.L.; visualization, L.-C.H.; supervision, C.-H.L.; project administration, C.-H.L. All authors have read and agreed to the published version of the manuscript.

Funding

This research received no external funding.

Institutional Review Board Statement

The study was approved by Ethical Review Approval National Taiwan University (202405ES015).

Informed Consent Statement

Informed consent was obtained from all subjects involved in the study.

Data Availability Statement

Data are not available due to school privacy policies.

Acknowledgments

The authors would like to express their sincere gratitude to Yen-Teh Hsia for his foundational contributions to the course design, particularly the Scheme Project, which served as the basis for this study. Hsia’s original curriculum and instructional approach laid the groundwork for the project development. The authors also deeply appreciate his recognition of the system proposed in this research.

Conflicts of Interest

The authors declare no conflicts of interest.

References

  1. Krishnaswamy, S.; Shriber, L.; Srimathveeravalli, G. The design and efficacy of a robot-mediated visual motor program for children learning disabilities. J. Comput. Assist. Learn. 2014, 30, 121–131. [Google Scholar] [CrossRef]
  2. Malmi, L.; Karavirta, V.; Korhonen, A.; Nikander, J.; Seppälä, O.; Silvasti, P. Visual algorithm simulation exercise system with automatic assessment: TRAKLA2. Inform. Educ. 2004, 3, 267–288. [Google Scholar] [CrossRef]
  3. Rajala, R.; Westerlund, M.; Rajala, A.; Leminen, S. Knowledge-intensive service activities in software business. Int. J. Technol. Manag. 2008, 41, 273–290. [Google Scholar] [CrossRef]
  4. Moreno-León, J.; Robles, G.; Román-González, M. Dr. Scratch: Análisis automático de proyectos Scratch para evaluar y fomentar el pensamiento computacional. Rev. Educ. Distancia 2015, 46, 1–23. [Google Scholar] [CrossRef]
  5. Paredes-Velasco, M.; Lozano-Osorio, I.; Pérez-Marín, D.; Santacruz-Valencia, L.P. A Case Study on Learning Visual Programming With TutoApp for Composition of Tutorials: An Approach for Learning by Teaching. IEEE Trans. Learn. Technol. 2022, 17, 498–513. [Google Scholar] [CrossRef]
  6. Venigalla, A.S.M.; Chimalakonda, S. FlowARP-Using Augmented Reality for Visualizing Control Flows in Programs. In Proceedings of the ACM Conference on Global Computing Education Vol 1, Hyderabad, India, 5–9 December 2023; pp. 161–167. [Google Scholar]
  7. Hu, M.; Assadi, T.; Mahroeian, H. Teaching visualization-first for novices to understand programming. In Proceedings of the 2021 IEEE International Conference on Engineering, Technology & Education (TALE), Wuhan, China, 5–8 December 2021; pp. 654–660. [Google Scholar]
  8. Huang, C.L.; Fu, L.; Hung, S.C.; Yang, S.C. Effect of Visual Programming Instruction on Students’ Flow Experience, Programming Self-Efficacy, and Sustained Willingness to Learn. J. Comput. Assist. Learn. 2025, 41, e13110. [Google Scholar] [CrossRef]
  9. Gutierrez, M.B.; Fabro, J.A.; Cordeiro, A.C. FluxProg 2.0-Extended Version of a Visual Tool for Teaching Programming Logic Using Flowcharts with Real and Simulated Robots. In Proceedings of the 2024 Brazilian Symposium on Robotics (SBR), and 2024 Workshop on Robotics in Education (WRE), Goiânia, Brazil, 11–14 November 2024; pp. 319–324. [Google Scholar]
  10. Isohanni, E.; Järvinen, H.-M. Are visualization tools used in programming education?: By whom, how, why, and why not? In Proceedings of the European Conference on Modelling and Simulation, Koli, Finland, 20–23 November 2014; pp. 35–40. [Google Scholar]
  11. Finnveden, G.; Schneider, A. Sustainable Development in Higher Education—What Sustainability Skills Do Industry Need? Sustainability 2023, 15, 4044. [Google Scholar] [CrossRef]
  12. Kim, M. A Study on the Effectiveness of PBL Classes Focusing on Solving Community Problems for Education for Sustainable Development. Korean Assoc. Gen. Educ. 2023, 17, 217–228. [Google Scholar] [CrossRef]
  13. Tran, K.; Bacher, J.T.; Shi, Y.; Skripchuk, J.; Price, T.W. Overcoming Barriers in Scaling Computing Education Research Programming Tools: A Developer’s Perspective. In Proceedings of the 2024 ACM Conference on International Computing Education Research, Melbourne, Australia, 3–15 August 2024; pp. 312–325. [Google Scholar]
  14. Kontio, J. Human Factors in improving engineering education with CDIO framework. Train. Educ. Learn. Sci. 2024, 155, 114–122. [Google Scholar]
  15. Kovaichelvan, D.V. Program Assessment through Product Based Learning in Undergraduate Engineering Programmes in India. In Proceedings of the 2020 ASEE Virtual Annual Conference Content Access, Virtual, 22–26 June 2020. [Google Scholar]
  16. Benneworth, P.; Kolster, R.; Stienstra, M.; Garcia, L.F.; Jongbloed, B.W.A. Integrating Sustainable Development into the Curriculum: Enacting “Scalar Shifting” in ESD Competencies. In Integrating Sustainable Development into the Curriculum; Emerald Publishing Limited: Leeds, UK, 2020. [Google Scholar]
  17. Abdulwahed, M. The Attributes of Future 2030 Engineers in Qatar for Innovation and Knowledge Based Economy. In Proceedings of the 2016 ASEE International Forum, New Orleans, LA, USA, 25 June 2016. [Google Scholar]
  18. Liao, E. Research on Teaching Reform for Python Programming Curriculum Based on AIGC-CDIO-OBE Model. In Proceedings of the 2024 6th International Conference on Computer Science and Technologies in Education (CSTE), Xi’an, China, 19–21 April 2024; pp. 106–109. [Google Scholar]
  19. Huang, L.; Chen, Y.; Zhao, W.; Wen, Y. CDIO-based curriculum reform in Java-programming. In Proceedings of the 2012 7th International Conference on Computer Science & Education (ICCSE), Melbourne, Australia, 14–17 July 2012; pp. 1741–1744. [Google Scholar]
  20. Fusic, S.J.; Anandh, N.; Subbiah, A.; Jain, D.B.K. Implementation of the CDIO Framework in Engineering Courses to Improve Student-Centered Learning. J. Eng. Educ. Transform. 2022, 35, 19–26. [Google Scholar] [CrossRef]
  21. Gunnarsson, S.; Swartz, M. On the connections between the cdio framework and challenge-based learning. In Proceedings of the SEFI 2022—Towards a New Future in Engineering Education, New Scenarios that European Alliances of Tech Universities Open Up, Barcelona, Spain, 19–22 September 2022; pp. 1217–1223. [Google Scholar]
  22. Abdüsselam, M.S.; Turan-Güntepe, E.; Durukan, Ü.G. Programming education in the frameworks of reverse engineering and theory of didactical situations. Educ. Inf. Technol. 2022, 27, 6513–6532. [Google Scholar] [CrossRef]
  23. Jaimez-González, C.; Castillo-Cortes, M. Web Application to Support the Learning of Programming Through the Graphic Visualization of Programs. Int. J. Emerg. Technol. Learn. 2020, 15, 33–49. [Google Scholar] [CrossRef]
  24. Kräuter, T.; König, H.; Rutle, A.; Lamo, Y. The Visual Debugger Tool. In Proceedings of the 2022 IEEE International Conference on Software Maintenance and Evolution (ICSME), Limassol, Cyprus, 3–7 October 2022; pp. 494–498. [Google Scholar]
  25. Hu, Y.; Chen, C.-H.; Su, C.-Y. Exploring the effectiveness and moderators of block-based visual programming on student learning: A meta-analysis. J. Educ. Comput. Res. 2021, 58, 1467–1493. [Google Scholar] [CrossRef]
  26. Mladenović, M.; Žanko, Ž.; Aglić Čuvić, M. The impact of using program visualization techniques on learning basic programming concepts at the K–12 level. Comput. Appl. Eng. Educ. 2021, 29, 145–159. [Google Scholar] [CrossRef]
  27. Nicacio, J.; Petrillo, F. An approach to build consistent software architecture diagrams using devops system descriptors. In Proceedings of the 25th International Conference on Model Driven Engineering Languages and Systems: Companion Proceedings, Montreal, QC, Canada, 1–6 October 2023; pp. 312–321. [Google Scholar]
  28. Li, L.; Yin, S.; Li, K. Graphic programming design based on embedded AI processor. In Proceedings of the E3S Web of Conferences, Online, 1 December 2020; p. 03007. [Google Scholar]
  29. Sobota, J.; PiŜl, R.; Balda, P.; Schlegel, M. Raspberry Pi and Arduino boards in control education. IFAC Proc. Vol. 2013, 46, 7–12. [Google Scholar] [CrossRef]
  30. Khamphroo, M.; Kwankeo, N.; Kaemarungsi, K.; Fukawa, K. MicroPython-based educational mobile robot for computer coding learning. In Proceedings of the 2017 8th International Conference of Information and Communication Technology for Embedded Systems (IC-ICTES), Chonburi, Thailand, 7–9 May 2017; pp. 1–6. [Google Scholar]
  31. Hwang, G.-J.; Yang, L.-H.; Wang, S.-Y. A concept map-embedded educational computer game for improving students’ learning performance in natural science courses. Comput. Educ. 2013, 69, 121–130. [Google Scholar] [CrossRef]
  32. Funabiki, N.; Matsushima, Y.; Nakanishi, T.; Watanabe, K.; Amano, N. A Java programming learning assistant system using test-driven development method. IAENG Int. J. Comput. Sci. 2013, 40, 38–46. [Google Scholar]
  33. Ma, L.; Ferguson, J.; Roper, M.; Ross, I.; Wood, M. Improving the mental models held by novice programmers using cognitive conflict and Jeliot visualisations. In Proceedings of the 14th Annual ACM SIGCSE Conference on Innovation and Technology in Computer Science Education, Paris, France, 6–9 July 2009; pp. 166–170. [Google Scholar]
  34. Khaleel, F.L.; Ashaari, N.S.; Wook, T.S.M.T. An empirical study on gamification for learning programming language website. J. Teknol. 2019, 81, 151–162. [Google Scholar]
  35. Keller, J.M. The Arcs model of motivational design. In Motivational Design for Learning and Performance: The ARCS Model Approach; Springer: New York, NY, USA, 2009; pp. 43–74. [Google Scholar]
  36. Imeh-Nathaniel, S.; Iftikhar, I.; Snell, A.; Brown, K.; Cooley, K.; Black, A.; Khalil, M.K.; Nathaniel, T. Implementing a student-centered stroke intervention and prevention education program; evaluating motivation, cognitive load, and performance among middle school students. Front. Public Health 2024, 12, 1332884. [Google Scholar] [CrossRef]
  37. Lajane, H.; Arai, M.; Gouifrane, R.; Qaisar, R.; El machtani El Idrissi, W.; Chemsi, G.; Radid, M. A scenario of the formative e-assessment based on the ARCS model: What is the impact on student motivation in educational context? Int. J. Emerg. Technol. Learn. 2021, 16, 135–148. [Google Scholar] [CrossRef]
  38. Aşıksoy, G.; Özdamlı, F. Flipped classroom adapted to the ARCS model of motivation and applied to a physics course. Eurasia J. Math. Sci. Technol. Educ. 2016, 12, 1589–1603. [Google Scholar] [CrossRef]
  39. Daugherty, K.K. ARCS motivation model application in a pharmacy elective. Curr. Pharm. Teach. Learn. 2019, 11, 1274–1280. [Google Scholar] [CrossRef] [PubMed]
  40. Lynch, D.J. Confronting challenges: Motivational beliefs and learning strategies in difficult college courses. Coll. Stud. J. 2008, 42, 416–421. [Google Scholar]
  41. Lavrijsen, J.; Preckel, F.; Verachtert, P.; Vansteenkiste, M.; Verschueren, K. Are motivational benefits of adequately challenging schoolwork related to students’ need for cognition, cognitive ability, or both? Personal. Individ. Differ. 2021, 171, 110558. [Google Scholar] [CrossRef]
  42. Giangrande, N.; White, R.M.; East, M.; Jackson, R.; Clarke, T.; Saloff Coste, M.; Penha-Lopes, G. A competency framework to assess and activate education for sustainable development: Addressing the UN sustainable development goals 4.7 challenge. Sustainability 2019, 11, 2832. [Google Scholar] [CrossRef]
  43. Hasnine, M.N.; Nguyen, H.T.; Tran, T.T.T.; Bui, H.T.; Akçapınar, G.; Ueda, H. A real-time learning analytics dashboard for automatic detection of online learners’ affective states. Sensors 2023, 23, 4243. [Google Scholar] [CrossRef]
  44. Amaya, E.J.C.; Restrepo-Calle, F.; Ramírez-Echeverry, J.J. Discovering insights in learning analytics through a mixed-methods framework: Application to computer programming education. J. Inf. Technol. Educ. Res. 2023, 22, 339–372. [Google Scholar]
  45. Geetha, S.; Spandana, A.; Vijay, D.; Vishruth, M. Soft Alert Generation for student Dropout Mitigation and Proactive Management by Machine Learning Algorithms. In Proceedings of the 2025 International Conference on Intelligent and Innovative Technologies in Computing, Electrical and Electronics (IITCEE), Bengaluru, India, 16 January 2025; pp. 1–5. [Google Scholar]
  46. Abdulsahib, A.K.; Mohammed, R.; Ahmed, A.L.; Jaber, M.M. Artificial Intelligence based Computer Vision Analysis for Smart Education Interactive Visualization. Fusion: Pract. Appl. 2024, 15, 245–260. [Google Scholar]
  47. Krishnan, R.; Nair, S.; Saamuel, B.S.; Justin, S.; Iwendi, C.; Biamba, C.; Ibeke, E. Smart analysis of learners performance using learning analytics for improving academic progression: A case study model. Sustainability 2022, 14, 3378. [Google Scholar] [CrossRef]
  48. Wati, S.F.A.; Fitri, A.S.; Vitianingsih, A.V.; Najaf, A.R.E. Strategic Insights into Educational Assessment: The Implementation and Constraints of SIMCPM in Monitor-ing Student Outcomes. Int. J. Data Sci. Eng. Anal. 2023, 3, 11–20. [Google Scholar]
  49. Winter, V.L.; Friend, M.; Matthews, M.; Love, B.; Vasireddy, S. Using Visualization to Reduce the Cognitive Load of Threshold Concepts in Computer Programming. In Proceedings of the 2019 IEEE Frontiers in Education Conference (FIE), Covington, KY, USA, 16–19 October 2019; pp. 1–9. [Google Scholar]
  50. Sweller, J.; Chandler, P. Evidence for cognitive load theory. Cogn. Instr. 1991, 8, 351–362. [Google Scholar] [CrossRef]
  51. Merriënboer, J.J.G.v.; Sweller, J. Cognitive Load Theory and Complex Learning: Recent Developments and Future Directions. Educ. Psychol. Rev. 2005, 17, 147–177. [Google Scholar] [CrossRef]
  52. Merriënboer, J.J.G.v.; Kester, L.; Paas, F. Teaching complex rather than simple tasks: Balancing intrinsic and germane load to enhance transfer of learning. Appl. Cogn. Psychol. 2006, 20, 343–352. [Google Scholar] [CrossRef]
  53. Gavrilova, T.; Bazhina, P.S.; Khodchenko, A.K.; Zamaraeva, Y.A. Augmented reality marker technology as a means of geometric literacy development: Efficiency and cognitive load. Perspect. Sci. Educ. 2022, 60, 535–553. [Google Scholar] [CrossRef]
  54. Emara, E.A.E.-H.M. A Reflection Based-Program to Enhance Student Teachers’ EFL Teaching Performance and Decrease their Cognitive Load. CDELT Occas. Pap. Dev. Engl. Educ. 2024, 88, 411–453. [Google Scholar] [CrossRef]
  55. Gerjets, P.; Scheiter, K.; Catrambone, R. Designing Instructional Examples to Reduce Intrinsic Cognitive Load: Molar versus Modular Presentation of Solution Procedures. Instr. Sci. 2004, 32, 33–58. [Google Scholar] [CrossRef]
  56. Zhu, Y.; Liu, M. Exploring the Blended Teaching Mode of Machine Learning by Integrating CDIO Engineering Concept. In Proceedings of the 2024 14th International Conference on Information Technology in Medicine and Education (ITME), Guiyang, China, 13–15 September 2024; pp. 316–320. [Google Scholar]
Figure 1. Interpreter execution flow.
Sustainability 17 05630 g001
Figure 2. Visual representation of a list in Scheme.
Sustainability 17 05630 g002
Figure 3. Execution example of the Scheme interpreter.
Sustainability 17 05630 g003
Figure 4. Graphical representation of the list function output.
Sustainability 17 05630 g004
Figure 5. Research procedure.
Sustainability 17 05630 g005
Figure 6. SBT visualization system architecture.
Sustainability 17 05630 g006
Figure 7. Visualization of (A B C D).
Sustainability 17 05630 g007
Figure 8. SBT visualization system interface.
Sustainability 17 05630 g008
Table 1. Project score.
MeanNStd.Pairwise Differences
MeanStd.tp
Experimental group29.6311828.35−6.913.17−2.1810.030
Control group22.7210118.04
Table 2. Results of the learning motivation analysis.
MeanNStd.Pairwise Differences
MeanStd.tp
Pre-test5.001180.840.330.1092.9910.003
Post-test4.671010.86
Table 3. Cognitive load analysis results.
StageMeanNStd.Pairwise Differences
MeanStd.tp
Intrinsic loadPre-test4.481180.97−0.0080.127−0.660.510
Post-test4.561011.00
Extraneous loadPre-test4.401180.98−0.0440.1280.350.730
Post-test4.351011.03
Disclaimer/Publisher’s Note: The statements, opinions and data contained in all publications are solely those of the individual author(s) and contributor(s) and not of MDPI and/or the editor(s). MDPI and/or the editor(s) disclaim responsibility for any injury to people or property resulting from any ideas, methods, instructions or products referred to in the content.

